Indicative investment plan Fluxys Belgium & Fluxys LNG 2021-2030 - February 2021
←
→
Page content transcription
If your browser does not render page correctly, please read the page content below

Indicative investment plan
Fluxys Belgium & Fluxys LNG
2021-2030

February 2021
Purpose
The indicative investment plan 2021-2030 sets out all investments needed to keep up with
changes in Belgium's natural gas market, maintain and upgrade infrastructure, and achieve
the aims of Fluxys Belgium and Fluxys LNG. The investments described in this document are
provided for reference purposes only and relate to gas transmission and storage
infrastructure in Belgium as well as the Zeebrugge LNG terminal.

Outlook for 2021-2030
Changes on the market in Belgium and in neighbouring countries lead to adjustments of
Belgium's natural gas transmission infrastructure. This is especially true for the L/H conversion,
which is needed as a result of the upcoming end of gas supplies from the Groningen gas
field in the Netherlands; the construction of new power stations in light of the phase-out of
Belgian nuclear power plants by 2025; and the market demand for more regasification
capacity at the Zeebrugge LNG Terminal.

Given the maturity and age of the Fluxys Belgium and Fluxys LNG infrastructure, substantial
amounts have also been earmarked for recurring investments in maintaining, adjusting and
modernising the network. Furthermore, Fluxys Belgium needs to adapt its network in line with
demand from public distribution (which sees between 55,000 and 60,000 new customers
every year) and new industrial customers.

Annex: Hydrogen and CO2 transmission systems
An annex detailing the outlook beyond the current framework of the Belgian Gas Act has
been appended to the indicative investment plan 2021-2030, which was drawn up in
accordance with Article 15/1, §5 of said Act. This annex sets out the future development of
hydrogen and CO2 transmission systems in Belgium, which will be based in part on the reuse
of Fluxys Belgium's natural gas transmission infrastructure. The framework governing the
development of such transmission systems will be devised in the years to come, and
investments will depend on changes in needs as well as technical opportunities.

 Fluxys Belgium & Fluxys LNG
 Indicative investment plan 2021-2030                                                      1
Contents
1   The European gas market _________________________________________________ 4
1.1 Consumption trends in 2019 _____________________________________________________ 4

1.2 Outlook for natural gas demand _________________________________________________ 5

1.3 Supply trends in 2019 ____________________________________________________________ 7

1.4 Outlook for European domestic production _______________________________________ 9

1.5 Outlook for supply _____________________________________________________________ 10

2   The ENTSOG TYNDP 2020 and regional investment plans ____________________ 12
2.1 The ENTSOG/ENTSO-E 2020 Scenario Report ______________________________________ 12

2.2 The ENTSOG TYNDP 2020 ________________________________________________________ 15

2.3 Gas Regional Investment Plans (GRIPs) __________________________________________ 16

2.4 Projects of Common Interest (PCIs) ______________________________________________ 16

3   The Belgian natural gas market ___________________________________________ 17
3.1 Fluxys Belgium and Fluxys LNG natural gas infrastructure _________________________ 17

3.2 Market segments ______________________________________________________________ 17

3.3 Consumption trends in Belgium _________________________________________________ 18

3.4 Network simulation model ______________________________________________________ 20

3.5 Investments required in the domestic market ____________________________________ 22

4   Transit at Belgium's borders _______________________________________________ 26
4.1 General description ____________________________________________________________ 26

4.2 Overview of allocations at border points _________________________________________ 27

4.3 Fluctuations in daily allocations at border points _________________________________ 29

5   Change in domestic and transit demand __________________________________ 33
5.1 Domestic demand _____________________________________________________________ 33

5.2 Outlook for imports _____________________________________________________________ 34

5.3 Outlook for exports _____________________________________________________________ 35

6   L/H conversion___________________________________________________________ 37
6.1 Introduction ___________________________________________________________________ 37

6.2 Optimising the conversion programme __________________________________________ 37

                                                             Fluxys Belgium & Fluxys LNG
     2                                             Indicative investment plan 2021-2030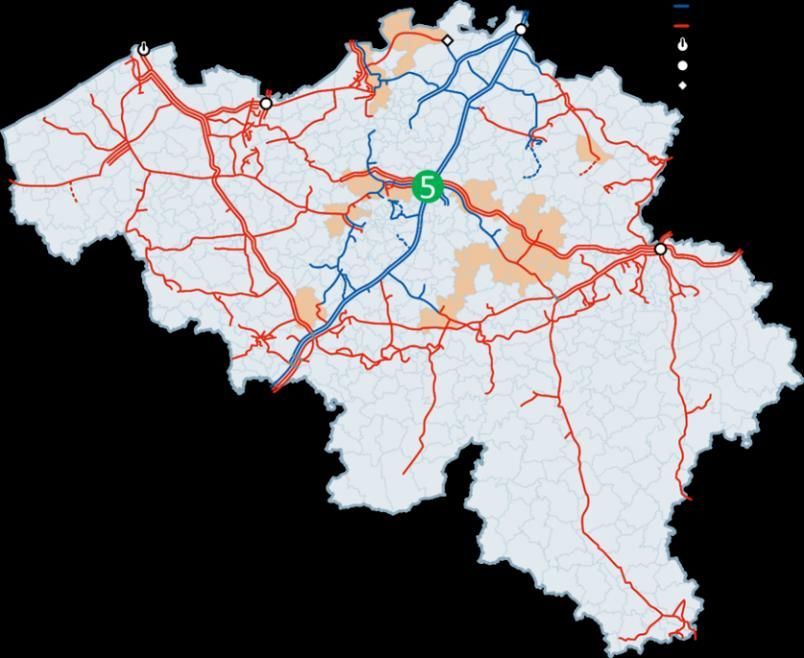
6.3 Principles governing the conversion of transmission systems ______________________ 38

6.4 Adjustments to the Fluxys Belgium network ______________________________________ 39

6.5 Entry capacity for the new H market_____________________________________________ 41

7   Developments concerning LNG ___________________________________________ 43
8   Developments concerning biomethane ___________________________________ 44
8.1 Status of biomethane today ____________________________________________________ 44

8.2 Injecting biomethane into natural gas networks __________________________________ 45

9   Summary ________________________________________________________________ 46
10 Indicative investments up to 2030 _________________________________________ 47
10.1 Environment and the transition of the network to the future energy mix ____________ 47

10.2 Adaptation, integrity assurance and renewal of infrastructure: ____________________ 48

10.3 Development of end-user needs ________________________________________________ 48

10.4 LNG initiatives and cross-border projects ________________________________________ 48

10.5 Miscellaneous _________________________________________________________________ 48

Annex: Hydrogen and CO2 transmission systems
1   Context _________________________________________________________________ 50
1.1 European energy and climate policy ____________________________________________ 50

1.2 Role of gas and gas infrastructure _______________________________________________ 51

2   Hydrogen transmission in Belgium ________________________________________ 52
3   CO2 transmission in Belgium ______________________________________________ 53
4   Development of future hydrogen and CO2 transmission systems ____________ 54
4.1 Europe's backbone for hydrogen transmission ___________________________________ 54

4.2 Long-term vision of a Belgian H2/CO2 backbone _________________________________ 55

4.3 Short-term options _____________________________________________________________ 56

5   Indicative investments up to 2030 _________________________________________ 60
5.1 Hydrogen transmission system __________________________________________________ 60

5.2 CO2 transmission system ________________________________________________________ 60

 Fluxys Belgium & Fluxys LNG
 Indicative investment plan 2021-2030                                                3

1 The European gas market
1.1 Consumption trends in 2019
600 3000
521
Gas consumption (bcm/y)
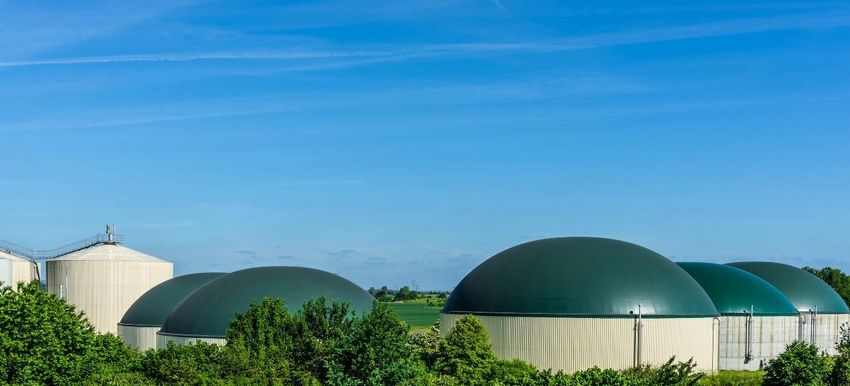
500 471 459 463 457 469 2500
451 449
401 419
400 2000
300 1500
200 1000
100 500
0 0
2010 2011 2012 2013 2014 2015 2016 2017 2018 2019
EU 27 + UK (left scale) Belgian degree-days (right scale)
Figure 1: Gas consumption in the EU 27 and the UK, and the impact of the weather (sources: BP
Statistical Review of World Energy, 2020 and gas.be)
In 2019, the European gas consumption (in the EU 27 (excluding Malta) and the UK) rose
from 456.8 bcm in 2018 to 469.1 bcm, following a slight drop the previous year (BP
Statistical Review of World Energy, 2020). The upward trend recorded between 2014 and
2016 was mainly linked to the increasing number of degree days. This trend has since
reversed, with degree days falling since 2017 due to higher than normal temperatures in
Belgium and across Europe, mitigating the demand for gas to heat buildings.
Figure 2: Monthly electricity generation mix in the EU 27 (source: European Commission, 2020)
Fluxys Belgium & Fluxys LNG
4 Indicative investment plan 2021-2030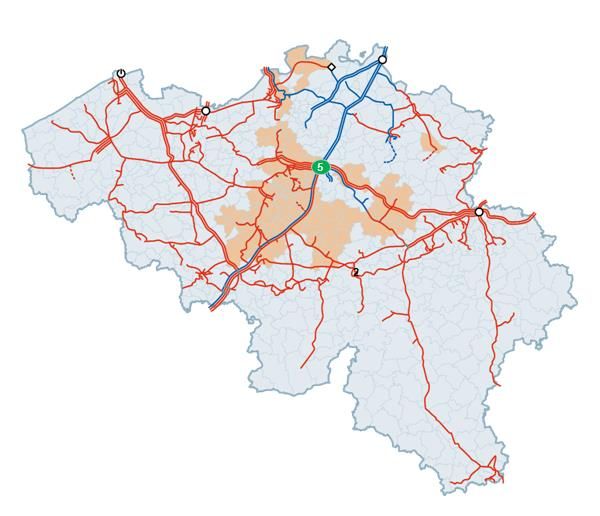
In its Quarterly Report on European Gas Markets, the European Commission assesses gas
demand in the power sector. In 2019, Europe's electricity generation mix had changed
from the previous year, with gas accounting for a greater share of total electricity
generation (23%) and partly offsetting the decline in lignite and coal (14%). Renewables
(mainly wind power) compensated for this decline in coal.

The competitiveness of gas-fired power generation improved vis-à-vis coal due to lower
prices for natural gas and relatively high prices for coal, aided by high prices for carbon
emission quotas (€25/tonne CO2 equivalent). In Belgium, gas production generally offsets
the deficit in nuclear capacity.

   Figure 3: Gas supplies for power generation in selected EU Member States (source: European
                                        Commission, 2020)

1.2 Outlook for natural gas demand
The global commitment to limit climate change (Paris Agreement) as well as national and
European energy and climate policies will impact gas demand in the future.

The European Network of Transmission System Operators for Gas (ENTSOG) – of which
Fluxys Belgium is a member – defined three demand forecast scenarios in its Ten-Year
Network Development Plan (TYNDP) 2020, including methane (natural gas, biomethane,
synthetic gas) and hydrogen. The Global Ambition scenario, which envisages a rapid
reduction in CO2 emissions and alignment with the targets in the Paris Agreement, foresees
the strongest gas demand. Demand would peak at around 2030 before gradually
declining to just below 4,000 TWh in 2050. Under the Distributed Energy scenario, demand
for natural gas would fall to 3,000 TWh by 2050.

 Fluxys Belgium & Fluxys LNG
 Indicative investment plan 2021-2030                                                     5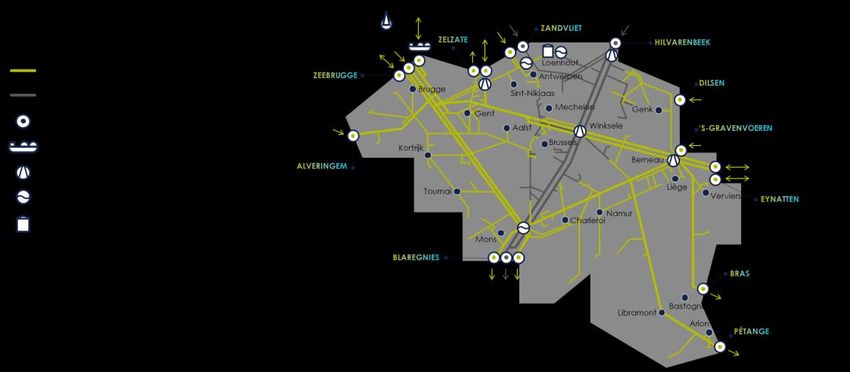
Figure 4: Projections for total gas demand (methane and hydrogen) (source: ENTSOG, 2020)

Despite the impact of energy efficiency measures on gas demand, there are also ways to
use gas in highly energy-efficient technologies. Combined heat and power (CHP)
technology, including fuel cells, shows great potential in small and medium-sized
applications as well as for residential use. This technology falls within the decentralised
power generation segment, and has the added benefit of using existing gas infrastructure
and avoiding congestion on the electricity distribution system. Gas-fired heat pumps can
halve energy consumption by using 50% renewable heat. Hybrid heat pumps (comprising
a small electric heat pump and a gas condensing boiler) combine the use of renewable
electricity with the security of gas supply.

The transport sector is seeing some growth in compressed natural gas (CNG) and, in
particular, liquefied natural gas (LNG) as alternative fuels for vehicles and ships. As far as
maritime transport is concerned, analysts expect LNG to amass a market share of 3% to
10% between 2025 and 2030, i.e. equal to approximately 15 to 45 million tonnes/year.

The L/H conversion could lead to a short-term collapse in demand in some markets. In the
wake of declining exports of Dutch L-gas, the conversion of Belgian, German and French
L-gas markets to H-gas may lead to some end users switching to alternative energy
sources and electric heat pumps. In Belgium, however, where appliances are compatible
with both L and H gases, this risk can be mitigated by all gas-sector players taking
appropriate action, and as yet there have been no signs of a collapse in natural gas
demand.

                                                                 Fluxys Belgium & Fluxys LNG
     6                                                Indicative investment plan 2021-2030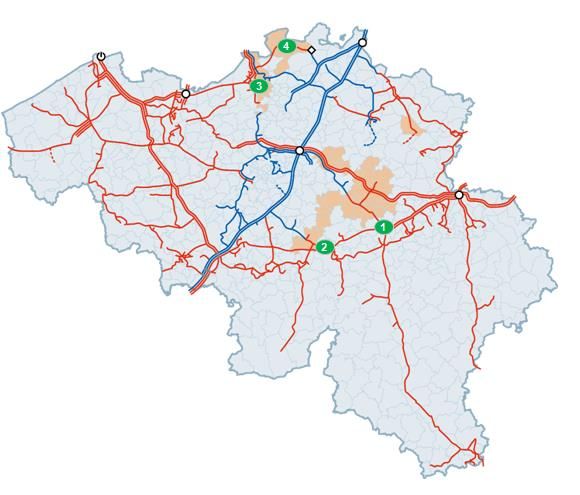
1.3 Supply trends in 2019

                                                          22%
                                          26%

                                                             23%
                                           23%
                                                     5%

            EU 27 + UK production         Norway 1%                     Algeria pipeline
            Other pipelines (Libya)       LNG                           Russia

       Figure 5: Gas supply mix in 2019 (EU 27 and Russia) (source: BP Statistical Review, 2020)

In 2019, Russia was Europe's biggest supplier of natural gas (market share of 26%), followed
by Norway and LNG imports (23%), and European production (22%). Imports via pipeline
from outside Europe (Algeria and Libya) accounted for 6% of supplies.

                         Figure 6: Europe's current and future supply routes

Russian pipeline gas supplies to Europe in 2019 came via Ukraine (45% in 2019 vs 41% in
2018), Nord Stream (33% vs 34%) and Belarus (22% vs 25%). The commissioning of the
TurkStream gas pipeline on 8 January 2020 also affected the distribution of Russian imports
in 2020.

 Fluxys Belgium & Fluxys LNG
 Indicative investment plan 2021-2030                                                              7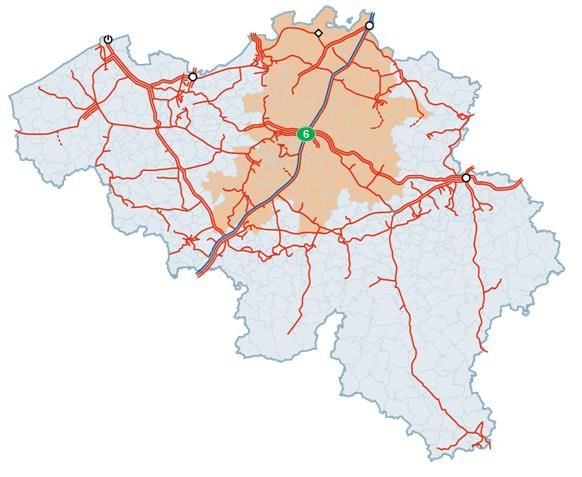
Figure 7: EU imports of gas through Russian supply routes (source: European Commission, 2020)

Supplies from LNG imports to Europe have witnessed incredible growth since Q4 2018, as
illustrated by the figure below. From a stable average of 50 bcm/year from 2013 to 2018,
the cumulative send-out of all terminals increased significantly from October 2018
onwards, reaching 80 bcm/year in winter 2018/2019 and 120 bcm/year in April 2019, at
the beginning of the storage period. After falling by around 80 bcm/year in summer 2019,
it rose to 150 bcm/year in December 2019 and reached approximately 120 bcm/year in
the first five months of 2020. It then dropped sharply to around 80 bcm/year due to the
COVID-19 pandemic and the very low gas prices worldwide. Depending on the economic
recovery, the global oversupply of LNG could last until 2022-2025.

           140                                                                                   40
           130
           120                                                                                   35
           110                                                                                   30
           100
            90                                                                                   25
bcm/year

            80
            70                                                                                   20
            60
            50                                                                                   15
            40                                                                                   10
            30
            20                                                                                   5
            10
             0                                                                                   0
                 01/01/2018
                 01/02/2018
                 01/03/2018
                 01/04/2018
                 01/05/2018
                 01/06/2018
                 01/07/2018
                 01/08/2018
                 01/09/2018
                 01/10/2018
                 01/11/2018
                 01/12/2018
                 01/01/2019
                 01/02/2019
                 01/03/2019
                 01/04/2019
                 01/05/2019
                 01/06/2019
                 01/07/2019
                 01/08/2019
                 01/09/2019
                 01/10/2019
                 01/11/2019
                 01/12/2019
                 01/01/2020
                 01/02/2020
                 01/03/2020
                 01/04/2020
                 01/05/2020
                 01/06/2020
                 01/07/2020
                 01/08/2020
                 01/09/2020
                 01/10/2020
                 01/11/2020

                              Europe (left scale)         Belgium (right scale)

  Figure 8: Send-out from LNG terminals in the European Union (source: GLE transparency platform)

Following the development of liquefaction capacity in the United States and Russia,
Europe's LNG market is dominated by Qatar, Russia and the United States. However, the

                                                                      Fluxys Belgium & Fluxys LNG
            8                                               Indicative investment plan 2021-2030
level of LNG imports depends very much on global LNG dynamics, in which LNG demand
in Asia plays a key role.
Cumulative LNG imports from the United States to the EU
Figure 9: Cumulative LNG imports from the United States to the EU (source: European Commission,
2020)
1.4 Outlook for European domestic production
In the long term, Europe's domestic natural gas production will continue to decline.
Domestic gas production in Europe is falling as North Sea gas fields (UK and the
Netherlands) are depleted, and Dutch L-gas production is declining due to natural
depletion and regulatory measures taken as a result of earthquakes in the region. In some
countries, the decline in production will be offset by the development of green gas
production (biomethane, power-to-gas) up to 2040. No major development of shale gas is
currently foreseen.
The supply of L-gas to Germany, Belgium and France will gradually decline, ending
completely by 2030 at the latest. As a result of an increasing number of earthquakes in the
surrounding area, caps on gas production from the Groningen field have been
systematically lowered, with the most recent cap being reduced to 8.1 bcm/year (gas
year 2020-2021). However, the Netherlands intends to fulfil its contractual obligations to
Belgium, France and Germany by producing synthetic L-gas by injecting nitrogen into H-
gas, despite the high cost of this solution.
Fluxys Belgium & Fluxys LNG
Indicative investment plan 2021-2030 9600
500
400
bcm/year
300
200
100
0
Prod. (conventional) Prod. (green gas) Imports Norway Other imports
Figure 10: Evolution of indigenous European gas production and imports (source: BP Statistical
Review, 2020 and the ENTSOG TYNDP)
1.5 Outlook for supply
EU imports are expected to rise in the coming years to offset the decline in EU gas
production coupled with stagnating or decreasing Norwegian and Algerian supplies.
The Nord Stream 2 pipeline, which is currently under construction, will double the volume
that can be imported from Russia to Germany. However, US economic sanctions on some
companies and investors involved in the project are currently affecting the completion of
this pipeline. The TurkStream pipeline, which has been operational since 8 January 2020,
allows Russia to divert its gas currently transmitted via Ukraine to Turkey (TurkStream 1) and
Central Europe (TurkStream 2).
Furthermore, the South European Gas Corridor links the EU to Azerbaijan via the TANAP
and TAP pipelines, operational since November 2020, and this may also unlock other
sources in the Caspian region (Turkmenistan, Iran and Iraq). It may also be possible to
connect new resources in the Eastern Mediterranean (Cyprus, Israel, Lebanon, the Zohr
gas field in Egypt) via the EastMed project. However, the construction of infrastructure for
gas production and transmission would require long-term commitments from European
market players.
Nevertheless, LNG and Russian gas are expected to make up the bulk of additional
imports. New liquefaction and regasification infrastructure is being built, which will increase
the quantity of LNG available for trade and pave the way for the diversification of supply.
Fluxys Belgium & Fluxys LNG
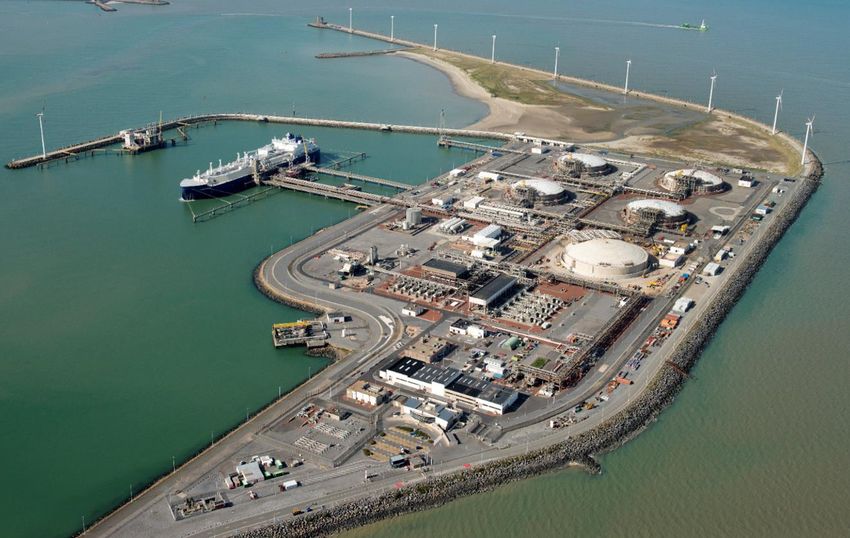
10 Indicative investment plan 2021-2030Turning to Northern Europe, studies into three LNG terminal projects in Germany (Brunsbüttel, Stade and Wilhemshaven) are currently under way. Meanwhile in Poland, the Świnoujście LNG terminal (commissioned in 2016) is being expanded. Studies into the construction of a terminal at Gdańsk are also ongoing. PGNiG has signed short- and long- term contracts to buy LNG from the United States. In Southern Europe, Croatia made a final investment decision on a planned floating storage and regasification unit (FSRU) in Krk in February 2019, with commissioning scheduled for 2021. In Greece, Gastrade, in which DESFA has just purchased a 20% stake, has rolled out plans to construct an FSRU at Alexandroúpoli, bolstered by progress on the IGB interconnection between Greece and Bulgaria. A third storage tank was constructed at the Revithoussa LNG terminal in 2018. In December 2019, Cyprus concluded a contract to construct the country's first regasification terminal, while Turkey commissioned the Dörtyol FSRU in 2018. The capacity of the Etki FSRU has been expanded to 2 million tonnes/year. Liquefaction capacities continue to grow worldwide, with the United States, Canada and Australia leading the way. In 2017, Qatar lifted the moratorium on North Field natural gas production that had been in place since 2005 to 77 million tonnes/year, boosting its production capacity to 100 million tonnes/year in 2027 and 126 million tonnes/year in 2029. In September 2019, Qatar Terminal Limited, a subsidiary of Qatar Petroleum, and Fluxys LNG signed a long-term LNG services agreement (running until 2044) for the Zeebrugge LNG terminal. European LNG imports will be determined by price differentials between the United States, Europe and Asia, the decline in domestic production, and competition between pipeline gas, coal, LNG and the development of renewables. LNG supplies will compete with pipeline gas supplies from both Russia and Norway in European gas networks. Fluxys Belgium & Fluxys LNG Indicative investment plan 2021-2030 11
2 The ENTSOG TYNDP 2020 and regional
  investment plans
2.1 The ENTSOG/ENTSO-E 2020 Scenario Report
Given the success of their initial cooperation on the TYNDP 2018, ENTSOG and the
European Network of Transmission System Operators for Electricity (ENTSO-E) once again
worked together to devise scenario storylines for the TYNDP 2020, with joint scenarios
serving as the cornerstone for an interconnected model. Three storylines were adopted,
all in line with the climate targets set by the European Commission.

•     Distributed Energy: in line with the Paris Agreement's target of limiting any rise in
      temperature to 1.5 °C, based on a decentralised approach to the energy transition
      through small-scale solutions and circular approaches.
•     Global Ambition: in line with the Paris Agreement's 1.5 °C target, based on the
      economic development of centralised generation such as offshore wind power and
      power-to-X production.
•     National Trends: based on National Energy and Climate Plans (NECPs) and therefore in
      line with the EU's 2030 climate and energy framework and the Commission's 2050 long-
      term strategy.

While the National Trends scenario is based on data collected using a bottom-up
approach among gas and electricity transmission system operators (TSOs), the Global
Ambition and Distributed Energy scenarios have been quantified using a recently
developed top-down approach, taking into account the entire energy mix and therefore
making it possible to calculate estimated CO2 emissions, which in turn can be compared
with an EU-wide carbon budget.

Based on the data provided by electricity and gas TSOs, ENTSO-E conducted simulations
of the EU-wide electricity market, which resulted in scenario-specific production mixes at
national level. Gas demand for power generation was used as input for ENTSOG's gas
network simulations in its TYNDP 2020.

The final version of the Scenario Report for gas and electricity for the TYNDP 2020 was
published in June 2020.1 It comprises a visualisation platform2 displaying the detailed
simulation results of the electricity market modelling.

As regards the role of gas in the energy system, the ENTSOG and ENTSO-E TYNDP 2020
Scenario Report highlights the key elements outlined below.

1   https://www.entsog.eu/sites/default/files/2020-
07/TYNDP_2020_Joint_Scenario%20Report%20ENTSOG_ENTSOE_June_Final.pdf
2   https://www.entsos-tyndp2020-scenarios.eu/visualisation-platform/

                                                                        Fluxys Belgium & Fluxys LNG
        12                                                Indicative investment plan 2021-2030
Excerpt from the ENTSOG/ENTSO-E 2020 Scenario Report (NB: emphasis added):
• "Quick wins" are essential to reduce global temperature warming. A coal to gas switch
in the power sector can save at least 85 MtCO2 by 2025.
• To optimise conversions, the direct use of electricity is an important option – resulting in
progressive electrification throughout all scenarios. Gas will continue to play an
important role in sectors such as feedstock in non-energy uses, high-temperature
processes, transport or in hybrid heating solutions to make optimal use of both
infrastructures.
• […]
• Wind and solar energy will play an important role in the European energy system,
however, the scenarios point out that the decarbonisation of gas will have a
significant part to play as well. The scenarios show that the decarbonisation of the gas
carrier is necessary, employing technologies to increase the share of renewable
gases, such as bio-methane and Power-to-Gas, and decarbonised gases associated
with Carbon Capture and Storage (CCS).
• At present gas as an energy carrier is mainly based on methane, as the main
component of natural gas. However, in the longer-term hydrogen could become an
equally important energy carrier towards full decarbonisation of the gas carriers in
2050.
• Sector Coupling enables a link between energy carriers and sectors, thus it becomes
key in contributing to achieve the decarbonisation target. In the long-term, Power-to-
Gas and Power-to-Liquid will play a key role in both the integration of electricity from
variable renewables and decarbonising the supply of gas and liquid fuels. [...] Gas-
fired power plants will continue to provide peak power flexibility to support an energy
mix based on increasingly variable electricity generation.
• Today, the EU28 imports most of its primary energy ( ca. 55%[...]). Decarbonisation will
also change this pattern. In a way, the "insourcing" of energy production will reduce
the import dependency to ca. 20% to 36%. However, imports remain an important
vector in the future energy supply making use of competitive natural resources outside
the EU territory. For gas in particular, import shares increase in all scenarios until 2030
due to the declining natural gas production in the EU.
The last point listed above is illustrated by the following figure, which shows the primary
energy mix in the Distributed Energy scenario. As is clear from the figure, imports (oil,
nuclear power and gas) will still account for around 20% of the 2050 energy mix.
Fluxys Belgium & Fluxys LNG
Indicative investment plan 2021-2030 13Figure 11: Primary energy mix in the Distributed Energy scenario (source: ENTSOG/ENTSO-E 2020
Scenario Report)
ENTSOG and ENTSO-E projections for gas demand are illustrated in the figure below. It
shows that the two scenarios compatible with COP21 requirements, namely Global
Ambition (GA) and Distributed Energy (DE), result in higher demand in 2030 than the
National Trends scenario. This is due to a faster transition from carbon-rich fuels like coal
and oil to gas as well as to higher shares of renewable and decarbonised gases in the
energy mix.
Figure 12: Total gas demand in the ENTSOG/ENTSO-E scenarios (source: 2020 Scenario Report)
ENTSOG and ENTSO-E have launched a new scenario-creation cycle with a view to
submitting a draft Scenario Report for the TYNDP 2022 by the end of 2021. A series of
working sessions have already led to the publication of the TYNDP 2022 Scenario Storyline
Fluxys Belgium & Fluxys LNG
14 Indicative investment plan 2021-2030Report,3 which appeared in early November 2020. This report outlines the scenarios that
will be quantified by ENTSOG and ENTSO-E in the 2022 Scenario Report.
2.2 The ENTSOG TYNDP 2020
On 19 November 2020, ENTSOG published a draft TYNDP 2020, which mainly consisted of
the Infrastructure Report and the Assessment Report.4
The Infrastructure Report focuses on the development of the European gas network and
analyses infrastructure projects submitted by TSOs and third-party project promoters. As for
previous Infrastructure Reports, Fluxys Belgium submitted the L/H conversion project.
For the first time, ENTSOG sought out a new type of project related to the energy transition,
including, first and foremost, the use of hydrogen networks, power-to-gas facilities,
biomethane production, and carbon capture, use and storage (CCUS). Given the decline
in the number of traditional infrastructure projects, 74 of these energy transition (ETR)
projects have already been submitted by promoters, accounting for 28% of all submitted
projects.
The following Belgian ETR projects5 are included in the TYNDP 2020:
• Interconnected hydrogen network
• Power to Methanol Antwerp
• Carbon Connect Delta
• H2-Import Coalition
• HyOffWind Zeebrugge
• Antwerp@C
The Assessment Report uses a range of cost-benefit analysis (CBA) indicators to analyse
the performance of current and future gas infrastructure at European level in terms of
security of supply, market integration, competition and sustainability. It assesses the
scenarios from the Scenario Report relating to the infrastructure that is presented in the
Infrastructure Report.
The main conclusion drawn at European level is that the projects classified as Final
Investment Decision (FID) and Advanced cover almost all infrastructure needs and should
be operational by 2025. Only a few local problems remain, for which additional
infrastructure would be needed.
Like previous TYNDPs, this TYNDP once again confirms that Belgian gas infrastructure is well
developed and interconnected with neighbouring countries and has access to a wide
range of supply sources.
3 https://www.entsog.eu/sites/default/files/2020-
11/entsog_TYNDP_2020_Scenario_Storyline_Report_201103.pdf
4 https://www.entsog.eu/tyndp#entsog-ten-year-network-development-plan-2020
5 Fluxys is not always promoter of these ETR projects.
Fluxys Belgium & Fluxys LNG
Indicative investment plan 2021-2030 152.3 Gas Regional Investment Plans (GRIPs)
In June 2020, the TSOs of the North-West region published the fourth edition of the GRIP for
this region, coordinated by Fluxys and Gasunie Transport Services (GTS).6
The report provides an overview of the projects and initiatives in which the gas TSOs are
involved in order to facilitate the decarbonisation of gas infrastructure throughout North-
West Europe. These initiatives demonstrate the commitment of the region's TSOs to actively
engaging in the decarbonisation of the gas and energy system as a whole. The
technologies adopted in the various decarbonisation projects seem to vary from one EU
Member State to another.
The second part of the report focuses on the L-gas markets in the North-West region. The
planned shutdown of the Groningen field and declining L-gas production in Germany
mean that significant investment is needed in infrastructure to convert the L-gas market to
H-gas in Germany, France and Belgium. The report gives a detailed overview of the
current state of the L-gas markets and the associated infrastructure adjustments needed
to ensure a successful market conversion.
2.4 Projects of Common Interest (PCIs)
The European Commission has once again confirmed that Belgium's L/H conversion
represents a key infrastructure need in the West European region, resulting in the renewal
of the PCI label in October 2019. The fourth PCI list came into force in April 2020.7
6 https://www.entsog.eu/sites/default/files/2020-06/ENTSOG_NW_GRIP_2020_web.pdf
7 https://eur-lex.europa.eu/legal-content/en/ALL/?uri=CELEX:32020R0389
Fluxys Belgium & Fluxys LNG
16 Indicative investment plan 2021-20303 The Belgian natural gas market
3.1 Fluxys Belgium and Fluxys LNG natural gas
infrastructure
Figure 13: Fluxys Belgium and Fluxys LNG natural gas infrastructure
The natural gas transmitted and distributed in Belgium comes from a variety of sources.
The chemical composition of the various natural gases is not the same; their calorific value
and Wobbe index vary. Most of these are 'rich' gases. They are interchangeable and are
transmitted together in the form of high-calorific natural gas (H-gas). By contrast, the low-
calorific natural gas (L-gas) from the Groningen fields is quite unique in that it contains up
to 14% nitrogen. It has a lower heating value and is not interchangeable with H-gas. As a
result, Fluxys Belgium's Belgian transmission system is split into two networks, which are
operated separately.
3.2 Market segments
The Belgian transmission system supplies gas to three market segments (or categories of
end users):
• Public distribution companies, which supply gas to residential customers, SMEs and
the tertiary sector
• Industrial customers, including large-scale CHP facilities
• Power stations
The natural gas offtakes by each of these market segments vary all the time and have
very different profiles:
• Public distribution is strongly influenced by the weather conditions, and thus the
temperature.
• Industrial customers have a fairly regular offtake pattern.
Fluxys Belgium & Fluxys LNG
Indicative investment plan 2021-2030 17• Power stations make gas offtakes to meet the increasingly changeable needs for
electricity generation. While electricity demand is much less heavily influenced by
the temperature than natural gas demand, the availability of other energy sources
(e.g. nuclear energy, solar power, wind power, import/export) and price
parameters (spark spread of coal vs natural gas) have a significant impact too.
3.3 Consumption trends in Belgium
3.3.1 Trend in the number of degree days
The number of degree days in a year reflects the demand for heating in a given period. A
normal (benchmark) year has 2,301 degree days.8 According to the Royal Meteorological
Institute of Belgium (RMI), 2014 was the warmest year since 1900, with only 1,828 degree
days. 2015 saw 2,121 degree days and was also considered a warmer year. Following a
normal year in 2016, which had 2,329 degree days, 2019 proved to be another fairly warm
year, the third in a row.
3500
3000 2701
2535
2500 2326 2329
2214 2212 2121 2156 2091 2076
1963 1928
2000 1828
1500
1000
500
0
2007 2008 2009 2010 2011 2012 2013 2014 2015 2016 2017 2018 2019
Figure 14: Degree days (calendar year)
3.3.2 Annual volumes for the Belgian market
In 2014, the warmest year since 1900, Belgium's total consumption decreased substantially
(12% down on 2013), falling to 14.7 bcm. It has since picked up again, rising to 17.2 bcm in
2019. Unlike the increase in 2016, the rises in 2017, 2018 and 2019 were the result of
increased offtake by power stations and industrial customers, not a colder winter period.
8 1986 to 2015, Synergrid benchmark (calendar year)
Fluxys Belgium & Fluxys LNG
18 Indicative investment plan 2021-203019
20
17 17 17 17 17 17 17
17 16 16 16
06 15
15 05 05 06 04 04 04 04
05 04 04 04
04
04 04
10 04 04 04 04 04 04 04
05 04 04 04
5 9,5 9,2
7,6 8,2 8,1 7,7 8,6 7,5 8,2 8,6 8,5 8,5 8,5
0
2007 2008 2009 2010 2011 2012 2013 2014 2015 2016 2017 2018 2019
Public Distribution Industry & CHP Power Stations
Figure 15: Changes in gas consumption in Belgium (in bcm)
3.3.2.1 Industrial customers (including combined heat and power
generation)
Since the 2008-2009 economic crisis, several major industrial sites have closed, such as the
steel production plant in Liège (late 2014), the Opel car plant in Antwerp (late 2010) and
the Ford car plant in Genk (late 2014). Once the crisis bottomed out in 2014, industrial
consumption rose by around 3% per year, hitting 4.3 bcm in 2019, mainly as a result of new
connections.
3.3.2.2 Power stations
The annual consumption of power stations has also increased over the last three years.
The closure of the country's older conventional generation units, including Kallo (2011), Les
Awirs (2012), Langerbrugge (2012) and Ruien (2013), led to a sharp falloff in annual
volumes. Natural gas offtake has once again increased since 2014, with H-gas offtake
reaching 4.4 bcm in 2019.9 That said, the offtake pattern of power stations has become
more volatile, as highly flexible open-cycle gas turbines and efficient, combined-cycle gas
turbine (CCGT) units are frequently being used to back up variable power generation
from solar and wind sources at any time. Recently, the spark spread for natural gas has
also evolved in a positive direction, meaning that units that were temporarily shut down
and put on the (strategic) reserve list for several years will once again come back into
daily use during the winter period. The reduced availability of various units at the Doel and
Tihange nuclear power stations also plays a role here.
9 The last L-gas-fired power stations were decommissioned in 2008. All units still operating are powered
by H-gas.
Fluxys Belgium & Fluxys LNG
Indicative investment plan 2021-2030 193.4 Network simulation model
Transmission systems are systematically analysed to ascertain whether they are fit for
purpose. Analysing the network's behaviour in a peak offtake situation makes it possible to
determine whether infrastructure needs to be adapted to cope with demand fluctuations.
Given the variety of offtake profiles that exist, special statistical methods are used to
calculate the peak values for the different market segments.
3.4.1 Public distribution
3.4.1.1 Method
Consumption peaks are partly linked to the severity of winter weather conditions and must
therefore be analysed in light of the temperatures recorded. 10 The standard winter period
used for such analyses runs from the start of November to the end of February.
3.4.1.2 Assessment of winter 2019/2020
The last winter period (from November 2019 up to and including February 2020) was
relatively mild, with 1,230 degree days (a benchmark winter11 has 1,428 degree days). The
two short colder periods in the first half of December 2019 and the second half of January
2020 can hardly be described as a cold snap. The coldest day of the winter (measured in
Uccle) was recorded on Thursday, 5 December 2019, with an equivalent temperature of
+1.2 °C. No frost days were recorded last winter (2019/2020), meaning that the linear
regression reflecting the relationship between consumption and ambient temperature is
insufficiently representative this year.
10 The concept of 'equivalent temperature' was introduced to take account of the thermal inertia of
buildings. This temperature is determined as follows: Teq D = 0.6 x Tav D + 0.3 x Tav D-1 + 0.1 x Tav D-2
11 1986 to 2015 (winter months). Source: Synergrid
Fluxys Belgium & Fluxys LNG
20 Indicative investment plan 2021-2030Temperature profile winter 2019-2020
12,00
Equivalent Temperature - °C
10,0 10,00
8,00
5,0
6,00
0,0
4,00
-5,0
2,00
-10,0 0,00
24/01/20
21/02/20
01/11/19
08/11/19
15/11/19
22/11/19
29/11/19
06/12/19
13/12/19
20/12/19
27/12/19
03/01/20
10/01/20
17/01/20
31/01/20
07/02/20
14/02/20
28/02/20
Date
weekend holiday Temp Eq
Figure 16: Assessment of winter 2019/2020
3.4.2 Power stations, CHP units and industrial customers
3.4.2.1 Method
The temperature has very little impact on gas offtakes for industrial processes and power
generation. Consequently, analysis of these market segments is based on a statistical
analysis of past offtakes combined with a commercial analysis of the market segments'
development prospects, rather than on a linear regression linked to the ambient
temperature. Since industrial customers' consumption profiles do not really depend on the
temperature, their consumption peak will not occur at the same time (smoothing effect),
and therefore peak offtakes for this segment are corrected using a regional-level
multiplication factor. The approach for power stations is based on the theoretical
simultaneous use of all generation facilities, and so not solely on the ambient temperature.
Fluxys Belgium & Fluxys LNG
Indicative investment plan 2021-2030 21Domestic consumption in winter 2019-2020
Daily consumption (GWh/day) 1.000 12,0
900
Equivalent temperature (°C)
10,0
800
700
8,0
600
500 6,0
400
4,0
300
200
2,0
100
0 0,0
01-11- 15-11- 29-11- 13-12- 27-12- 10-01- 24-01- 07-02- 21-02-
2019 2019 2019 2019 2019 2020 2020 2020 2020
Industry Power Plants Public Distribution Equivalent Temperature (°C)
Figure 17: Domestic consumption in winter 2019/2020
3.5 Investments required in the domestic market
3.5.1 Public distribution
Despite the steady increase in the number of active connections, several factors have
caused a slight decline in gas consumption. The thermal insulation of houses and buildings
and the efficiency of heating systems are constantly improving thanks to the introduction
by public authorities of strict regulations concerning renovations and new constructions.
Number of access points provided (EANs)
3.600.000
3.400.000
3.200.000
Number of EANs
3.000.000
2.800.000
2.600.000
2.400.000
2004 2006 2008 2010 2012 2014 2016 2018 2020
Year
Figure 18: Increase in the number of EAN access points12 (source: Synergrid)
12 EAN (European Article Numbering) codes are unique codes used to identify gas meters.
Fluxys Belgium & Fluxys LNG
22 Indicative investment plan 2021-2030The combination of these erosion factors and the change in the potential number of new connections to the public distribution network in some regions means that the increase in peak consumption will not grow at the same rate in every region. Use of the available capacity on the networks is constantly analysed by the relevant distribution system operators (DSOs) based on detailed analyses and simulations. The investments identified as necessary to support more local/regional growth in the coming years remain limited. 3.5.2 Industrial customers The outlook for industrial consumption still has two facets. While it is true that each year sees several industrial customers wind down their production operations in Belgium, new industrial projects are also launched. Generally speaking, only limited investment is required to create local connections. On the whole, the existing networks hosting the connections have enough capacity to supply the new end customers. However, large- scale projects combined with the construction of new power stations may require local investments. 3.5.3 Power generation Natural-gas-fired power generation in Belgium, as elsewhere in Europe, has been under considerable pressure for some time. Gas-fired power stations are used to maintain a balance on the electricity grid during short periods of high demand or when renewable sources prove insufficient. Thanks to a favourable spark spread, a higher baseload has gradually been observed again in recent years. Gas-fired power stations have the advantage of being able to start up quickly while producing far less CO2 than coal-fired power stations. Thanks to their flexibility, they provide the ideal back-up needed for intermittent power generation from wind and solar facilities. The complete shutdown of Belgium's nuclear generation facilities by the end of 2025 is enshrined in law. As a result, almost 6,000 MW of nuclear generation capacity is set to be phased out in the very near future. Alongside increased import facilities and the steady growth of wind and solar energy, natural-gas-fired generation facilities will also have to be further expanded, in part to replace existing gas-fired units that will reach the end of their technical and economic life in the next few years. State-of-the-art CCGT units with capacities of 450 to 850 MW are now available. These efficient generation units are expected to be developed at a number of sites, preferably close to the backbone of the high-pressure transmission system. Fluxys Belgium & Fluxys LNG Indicative investment plan 2021-2030 23
More specifically, the Capacity Remuneration Mechanism (CRM) launched by the
government would result in the construction of additional generation facilities with a
capacity of around 3.9 GW13 to compensate for the total phase-out of nuclear power.

The older, less efficient units would have to be used as peak units for a number of years
before being shut down. However, the resulting increase in the need for synchronous peak
capacity will not necessarily translate into a significant change in annual volumes.

3.5.4 Other sectors

3.5.4.1 The transport sector
CNG and LNG are two gas products that are very well suited to use in the transport sector.
Methane combustion produces less CO2 than the combustion of conventional fuels like
diesel, petrol and liquefied petroleum gas. Natural gas is also a clean fuel in terms of
particle emissions.14

Since LNG takes up 600 times less space than the same amount of energy in gaseous form
under atmospheric conditions, it is especially suitable for use in road transport (as an
alternative to diesel) and shipping (as a substitute for heavy fuel oil). CNG, on the other
hand, is an attractive solution for fuelling private cars and vans.

The CNG network, which is supplied from the public distribution networks, is expected to
continue growing in the short term. The capacity of the transmission system is sufficient to
support such growth.

13   Adequacy and flexibility study for Belgium 2020-2030 - Elia
14   CREG 2018, Study on the cost-effectiveness of natural gas (CNG or compressed natural gas) used
as fuel in cars

                                                                      Fluxys Belgium & Fluxys LNG
         24                                                  Indicative investment plan 2021-2030
Existing CNG filling stations
Planned CNG filling stations
Figure 19: Existing/planned CNG filling stations
3.5.4.2 Development of off-network natural gas distribution
It is usually not economically viable to develop both the transmission network and the
distribution network to connect remote population centres. CNG and LNG satellite
installations supplied by land or water can serve as a starting point for the development of
new natural gas distribution networks. At a later stage, once these markets are sufficiently
developed, consideration can be given to connecting the natural gas network to the
transmission network.
These networks can be developed in tandem with CNG and LNG for the transport sector.
Fluxys Belgium & Fluxys LNG
Indicative investment plan 2021-2030 254 Transit at Belgium's borders
4.1 General description
With all its interconnection points, the Belgian network is connected to most of the natural
gas production sources supplying the European market, namely:
• natural gas supplied by pipeline from Norway, the UK, the Netherlands, Germany and
France;
• LNG supplied from producer countries through the LNG terminals at Zeebrugge and
Dunkirk.
The Fluxys Belgium network is connected to the following gas markets/production zones:
• Netherlands: TTF
• UK: NBP
• Germany: NCG and Gaspool
• France: TRF
• Norway
• LNG: via Zeebrugge and Dunkirk
LNG and pipeline gas brought into Belgium can be traded via the Fluxys Belgium network
at the Belgian gas trading point, which is divided into two services:
• ZTP-P (Zeebrugge Trading Point – Physical Trading Services)
• ZTP-N (Zeebrugge Trading Point – Notional Trading Services), which encompasses ZTP
(for the H-gas network) and ZTPL (for the L-gas network)
Physically, the natural gas supplied is consumed on the Belgian market or transmitted
across the country's borders for sale at other gas trading points or consumption on end-
user markets in Europe. As such, various capacity products are traded:
• Entry/Exit: A capacity product for access to the Belgian market area, trading on the
ZTP, supply to the domestic market or transmission of gas to neighbouring markets.
• Shorthaul: An Operational Capacity Usage Commitment (OCUC) is a Shorthaul that
combines the use of Entry/Exit services at predefined interconnection points. A
Wheeling is a specific OCUC with entry and exit at the same location. Lastly, Zee
Platform is a Shorthaul service for transporting unlimited quantities of natural gas
between two or more interconnection points in the Zeebrugge area.
The figure below provides a general overview of interconnection points, capacity
products (Entry/Exit, OCUC, Wheeling and Zee Platform) and links to neighbouring
markets.
Fluxys Belgium & Fluxys LNG
26 Indicative investment plan 2021-2030Figure 20: Fluxys Belgium interconnection points
4.2 Overview of allocations at border points
The figure below provides an overview of the volumes (allocations) imported and
exported at border points in 2019.
Figure 21: Allocations at border points in 2019
Fluxys Belgium & Fluxys LNG
Indicative investment plan 2021-2030 274.2.1 Natural gas imports
The total annual average volume entering the Fluxys Belgium network was 430 TWh in
2015-2019, peaking at over 460 TWh in 2017.
Annual entry allocations
500
Annual entry allocations (TWh)
400
300
200
100
0
2015 2016 2017 2018 2019
NO NL-GTS (L) NL-GTS (H) VK LNG DE-NCG DE-GP
Figure 22: Annual entry allocations
Two main entry routes carry approximately 60% of incoming flows: Norwegian gas comes
into Belgium through the Zeepipe (around 150 TWh), while L-gas from the Netherlands
enters the country via the Hilvarenbeek entry point (around 100 TWh). H-gas supplies from
the Netherlands have been falling since 2017, with significantly lower volumes being
supplied in 2019 in particular.
Volumes from the UK fluctuate, totalling between 50 and 90 TWh per year.
The volume of LNG injected into the Belgian transmission system at Zeebrugge rose in 2015
(over 25 TWh). However, this trend did not continue in 2016 and 2017. Following a trend
observed at European level, the volume of LNG injected into the transmission system rose
considerably in 2018 and 2019.
Imports from Germany remained relatively low. 2017 and 2018 saw an increase, perhaps
due to the larger quantities transmitted to the UK. It is worth noting that virtually all imports
come from the Gaspool market area.
4.2.2 Natural gas exports
The total annual average volume of gas (H-gas and L-gas) transmitted to neighbouring
markets at the border points was 240 TWh in 2015-2019, with a significant peak of 275 TWh
in 2017.
Fluxys Belgium & Fluxys LNG
28 Indicative investment plan 2021-2030Annual exit allocations
Exit allocations (TWh) 300
250
200
150
100
50
0
2015 2016 2017 2018 2019
FR (H) FR (L) VK DE-NCG DE-GP NL-Zebra NL-GTS (H)
Figure 23: Annual exit allocations
Between 65% and 85% of this volume (between 150 and 200 TWh, of which around 50 TWh
is L-gas) is intended for the French market.
The volume of gas exported to the UK (through the IZT pipeline) fluctuates considerably
from one year to the next. Between 2016 and 2018, the volume of gas exported to the UK
climbed sharply due to, for example, the closure of the Rough underground storage
facility and the reduced availability of LNG in the UK compared with 2015. The relatively
high level of exports in 2018 was fully recorded in the first quarter. The impact of the expiry
of long-term contracts can clearly be seen in the low volumes recorded in 2019.
The volume of gas transmitted to Germany totals between 10 and 30 TWh per year, with
almost all exports being transmitted to the NCG market area.
The volume transmitted to the Netherlands mainly goes to the Zebra network and the
annual supply is relatively consistent (15 TWh per year). Transmission via the GTS network
has also increased since 2017, most likely as a result of the growing need for H-gas in the
Netherlands following the restriction of production at the Groningen gas field.
Gas transmitted to Luxembourg is not included on the above graph because Belgium and
Luxembourg form a single market.
4.3 Fluctuations in daily allocations at border points
Fluxys Belgium analyses network load and use of capacity supplied to neighbouring
networks based on simultaneous daily and hourly flows.
Fluxys Belgium & Fluxys LNG
Indicative investment plan 2021-2030 294.3.1 Natural gas imports
The following graph shows the change in daily flows simultaneously injected at various
border points on the Fluxys Belgium network (2015-2019). On average, around 50 GW of
gas is injected into the Fluxys Belgium network, with peaks of between 70 and over 80 GW.
Daily entry allocations (hourly average), 2015-2019
90
80
70
Allocations (GWh/h)
60
50
40
30
20
10
0
01/01/2015 01/01/2016 01/01/2017 01/01/2018 01/01/2019
NO NL-GTS (L) NL-GTS (H) VK LNG DE-NCG DE-GP FR (H)
Figure 24: Daily entry allocations, 2015-2019
The graph15 below shows the use of entry capacity in 2017-2019.
Figure 25: Entry allocations, neighbouring markets
Flows entering the Fluxys Belgium network from entry points directly linked to gas
production zones (Norway, Netherlands L) account for the highest average volumes.
Average incoming flow volumes at entry points connected to a neighbouring TSO's
transmission system (Netherlands H, UK, Germany) are lower and/or more variable. The
total import capacity of the H-gas network is sufficient to compensate for an increase in
15 This graph is based on a calculation of the daily net value of the allocations.
Fluxys Belgium & Fluxys LNG
30 Indicative investment plan 2021-2030the domestic market (e.g. as a result of the L/H conversion). Market signals will gradually
pinpoint which sources will actually be used to supply the new H market.
4.3.2 Natural gas exports
The following graph shows the change in daily flows exported simultaneously at various
border points on the Fluxys Belgium network (2015-2019).
Daily exit allocations (hourly average), 2015-2019
60
50
Allocations (GWh/h)
40
30
20
10
0
01/01/2015 01/01/2016 01/01/2017 01/01/2018 01/01/2019
FR (H) FR (L) UK DE-NCG DE-GP NL-Zebra NL-GTS (H)
Figure 26: Daily exit allocations
The average daily flows simultaneously exiting the Fluxys Belgium network amount to
27 GW. There were substantial transit flows towards the UK in winter 2016-2017 and 2017-
2018 and an increase towards the Netherlands during the summer months. Transit during
winter 2017-2018 peaked in December, with large volumes bound for the UK and France.
The Fluxys network had no problems handling this peak transmission.
The graph16 below shows the use of the capacity supplied to each market area in 2017-
2019.
16 This graph is based on a calculation of the daily net value of the allocations.
Fluxys Belgium & Fluxys LNG
Indicative investment plan 2021-2030 31Figure 27: Exit allocations, neighbouring markets
The graph shows that the highest average daily flow is to the French market (H-gas and L-
gas). The French market also had the average closest to peak consumption (higher load
factor). By contrast, the average daily flows to the UK, Germany and the Netherlands
were lower.
Fluxys Belgium & Fluxys LNG
32 Indicative investment plan 2021-20305 Change in domestic and transit
demand
5.1 Domestic demand
Fluxys Belgium maintains a projection of future natural gas consumption, in terms of annual
volume and peak consumption, for public distribution, industry and power stations. These
projections are based on the latest prospective studies of the gas sector (coordinated by
Gas.be), projections by the Federal Planning Bureau and Elia's latest adequacy studies for
power stations. ENTSOG requires these projections when drafting the TYNDP, which is
compiled every two years at European level.
Taking into account the conclusions of Elia's Adequacy and flexibility study for Belgium
2020–2030 (published in June 2019), which shows that an additional 3.9 GWe of power-
station capacity would be needed by 2025 in the event of a nuclear phase-out, Fluxys
Belgium's projections indicate an increase in peak daily supply demand from 61 GW in
2020 to between 65 and 67 GW in 2025 (H- and L-gas, daily average) depending on the
scenario.17
Change in peak daily demand for gas
(H- and L-gas, daily average) (GWh/h)
80
70
60 National
Trend
50
40 Distributed
30 Energy
20 Global
10 Ambiton
0
Figure 28: Projection of peak daily demand for gas on the Belgian gas market
The adequacy of the Fluxys Belgium network in view of gas demand is assessed both
overall and at local level.
17 The Fluxys Belgium demand scenarios are aligned with those of ENTSOG (see Section 2.1). The
National Trends scenario is compatible with the NECP. The Global Ambition scenario covers the period
up to 2050, is compatible with the 1.5 °C limit on global warming set by the 2015 Paris Agreement, and
is built on the centralised development of renewable energy generation resources. The Distributed
Energy scenario is also aligned with the 1.5 °C target but takes a decentralised approach to the
energy transition up to 2050.
Fluxys Belgium & Fluxys LNG
Indicative investment plan 2021-2030 33Overall, Fluxys Belgium determines the entry and exit capacities of its network, taking into
account peak hourly demand from public distribution, industry and power stations,
divided into consumption clusters. This calculation is based on hydraulic simulations carried
out for the various potential flow scenarios.
Overall capacity calculations (network entry and exit) show that, should new gas-fired
power stations be built by 2025 (integrated into the peak gas demand scenarios), the total
entry capacity of the H network would remain higher than the peak demand, even after
full integration of the current L network into the H network. Under this scenario, total peak
day demand would be just under 6 million m³/h (daily average), while the entry capacity
into the H network would total 10 million m³/h, without taking into account the injection
capacity into the network from the underground storage facility at Loenhout.
5.2 Outlook for imports
The physical gas entry capacity on the Fluxys Belgium network comes mainly from
Zeebrugge (imports via pipeline from Norway and the UK and via LNG) and Alveringem
(imports from France) in the west, Zelzate, Zandvliet and Hilvarenbeek in the north (imports
from the Netherlands), and 's Gravenvoeren (imports from the Netherlands) and Eynatten
(imports from Germany) in the east.
Figure 29: Fluxys Belgium network and interconnections
5.2.1 Imports from Norway
ENTSOG's TYNDP predicts a reasonably stable supply from Norway to the European market
over the coming years. Imports to Belgium are also expected to experience little change.
5.2.2 LNG imports
It is commonly accepted that the decline of European domestic production will be
predominantly offset by competition between LNG and Russian gas. The volume of LNG
coming to Europe will also depend, among other factors, on the availability of LNG for
Europe (in light of demand in Asia as well as South and Central America) and the
Fluxys Belgium & Fluxys LNG
34 Indicative investment plan 2021-2030You can also read