Future economic perspective and potential revenue of non-subsidized wind turbines in Germany - WES
←
→
Page content transcription
If your browser does not render page correctly, please read the page content below
Wind Energ. Sci., 6, 177–190, 2021
https://doi.org/10.5194/wes-6-177-2021
© Author(s) 2021. This work is distributed under
the Creative Commons Attribution 4.0 License.

          Future economic perspective and potential revenue of
                non-subsidized wind turbines in Germany
                         Lucas Blickwedel, Freia Harzendorf, Ralf Schelenz, and Georg Jacobs
                         Chair for Wind Power Drives, RWTH-Aachen University, Aachen, Germany
                       Correspondence: Lucas Blickwedel (lucas.blickwedel@cwd.rwth-aachen.de)

                                   Received: 31 January 2020 – Discussion started: 10 March 2020
                       Revised: 10 November 2020 – Accepted: 8 December 2020 – Published: 1 February 2021

       Abstract. Fixed feed-in tariffs based on the Renewable Energy Act grant secure revenues from selling elec-
       tricity for wind turbine operators in Germany. Anyhow, the level of federal financial support is being reduced
       consecutively. Plant operators must trade self-sufficiently in the future and hence generate revenue by selling
       electricity directly on electricity markets. Therefore, uncertain future market price developments will influence
       investment considerations and may lead to stagnation in the expansion of renewable energies. This study es-
       timates future revenue potentials of non-subsidized wind turbines in Germany to reduce this risk. The paper
       introduces and analyses a forecasting model that generates electricity price time series suited for revenue estima-
       tion of wind turbines based on the electricity exchange market. Revenues from the capacity market are neglected.
       The model is based on openly accessible data and applies a merit-order approach in combination with a simple
       agent-based approach to forecast long-term day-ahead prices at an hourly resolution. The hourly generation pro-
       file of wind turbines can be mapped over several years in conjunction with fluctuations in the electricity price.
       Levelized revenue of energy is used to assess both dynamic variables (electricity supply and price). The merit-
       order effect from the expansion of renewables as well as the phasing out of nuclear energy and coal are assessed
       in a scenario analysis. Based on the assumptions made, the opposing effects could result in a constant average
       price level for Germany over the next 20 years. The influence of emission prices is considered in a sensitivity
       analysis and correlates with the share of fossil generation capacities in the generation mix. In a brief case study,
       it was observed that current average wind turbines are not able to yield financial profit over their lifetime with-
       out additional subsidies for the given case. This underlines a need for technical development and new business
       models like power purchase agreements. The model results can be used for setting and negotiating appropriate
       terms, such as energy price schedule or penalties for those agreements.

1   Introduction                                                   to increase competition and promote the competitiveness of
                                                                   wind energy. In the future, however, subsidies will probably
Renewable electricity generation has increased exponentially       cease completely. Electricity from renewable energy sources
in Germany over the last few decades due in large part to sub-     will have to be sold in alternative ways to generate revenue.
sidization by the Renewable Energy Act (Erneuerbare En-            These are likely to be based on the electricity exchange mar-
ergien Gesetz, EEG). The law was enacted to achieve the            kets. Hence, the electricity exchange price at the time of elec-
policy goal of reducing the energy sector’s greenhouse gas         tricity generation will become a crucial factor for profitability
emissions. Fixed feed-in tariffs secured revenues from sell-       next to the already widely considered cost of electricity gen-
ing electricity for renewable energy sources and ensured in-       eration (Federal Ministry for Economic Affairs and Energy,
dependence from the fluctuating electricity exchange price.        2019a–c).
Thus, investments in the renewable energy sector were par-            The aim of this research is to address and quantify the bar-
ticularly attractive and led to a strong expansion. By intro-      rier of uncertain revenues of electricity generation from wind
ducing a tendering procedure, an attempt was then made

Published by Copernicus Publications on behalf of the European Academy of Wind Energy e.V.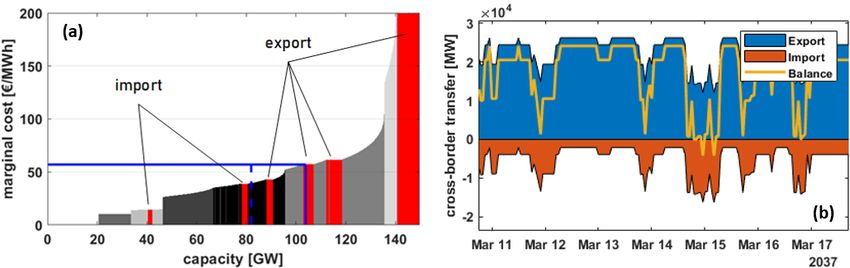
178                                                                          L. Blickwedel et al.: Future economic perspective

turbines (WTs) without subsidies in Germany. How can fu-            time by the contracting parties. PPAs define the following
ture electricity exchange prices be estimated and put in per-       aspects of power purchase: amount of electricity, price, con-
spective to the generated electricity? To answer this ques-         tract terms and penalties for breach of contract (Javadi et al.,
tion, the markets of Germany and its neighboring countries          2011; Elwakil and Hegab, 2018).
are considered within the framework of a new forecasting               PPAs already have a significant market share in the sale of
model, which will be developed and discussed in this paper.         electricity from renewable energy sources in some countries
   First, a literature research for three different aspects rele-   around the world. In particular in the US, the market for PPAs
vant to this task is conducted: in Sect. 1.1 the current market     has been growing in recent years. Energy-intensive compa-
situation and potential revenue sources for WT operators in         nies such as Google, Microsoft and Facebook have commit-
Germany are assessed with a focus on long-term power pur-           ted to 100 % green electricity. Google has already concluded
chase agreements as one possible alternative for selling elec-      PPAs for a total of about 1.8 GW. In Brazil, energy-intensive
tricity. Afterwards, in Sect. 1.2 different metrics to evaluate     consumers have been able to conclude PPAs for electricity
the economic efficiency and perspective of renewable energy         from conventional or renewable energy sources since 1995
sources are being discussed. Section 1.3 will then address          (Coussi and Harada, 2020; Berger et al., 2016). Compared
existing approaches with a similar scope for modeling and           to other European countries, the PPA market in Germany is
forecasting electricity supply systems and exchange prices.         much less developed. In a lot of neighboring countries PPAs
   Based on the literature research, the elaborated model re-       are already an established procedure (Fischer et al., 2019;
quirements and forecasting model will be derived and dis-           Tang and Zhang, 2019). Sweden (33 %), Norway (30 %) and
cussed in Sect. 2. Finally, in Sect. 3 model results are pre-       the UK (16 %) are the European countries with the highest
sented and interpreted along with a brief case study and con-       share of PPAs (). However, the majority of renewable ener-
clusion, followed by a critical discussion of the model and         gies in Europe, including Germany, were supported through
outlook in Sect. 4.                                                 a fixed feed-in tariff financed by public funds (Berger et al.,
                                                                    2016). Since many plants will be excluded from subsidies
1.1   Potential revenue sources for wind turbine operators
                                                                    from 2020 onwards, PPAs are increasingly being considered
      in Germany
                                                                    in Germany.
                                                                       Although PPAs can be negotiated independently of the
Since 2017 the level of subsidization for electricity from          electricity exchange price, it is nevertheless common for the
WTs in Germany is determined through tendering with a               contracting parties to base their agreement on the develop-
pay-as-bid system, regulated by the German Renewable En-            ment of the electricity exchange price. PPAs are therefore
ergy Act. After successfully taking part in the tendering pro-      considered as an alternative selling option in this paper. Con-
cedure, WT operators receive individual feed-in tariffs per         sequently, the two potential revenue sources to be considered
kilowatt-hour according to their bid. The Renewable Energy          in this paper are direct sales through the electricity exchange
Act defines a maximum tender volume for each year. Bids             market and bilateral sales through PPAs. The future electric-
that exceed the set limit are not receiving financial support       ity exchange price seems to be the correct forecast object to
(Deutscher Bundestag, 2020). There are three main options           derive statements about both potential revenue sources.
for plant operators in Germany who do not receive subsi-
dies to sell their generated electricity: selling directly on the   1.2   Existing metrics for evaluating the economic value
electricity exchange market, through bilateral contracts or by            of wind turbines
providing generation capacity on the capacity market. The
latter naturally does not pose a significant source of revenue      Several different metrics are known by literature to describe
for the variable electricity generation from wind and solar en-     the economic efficiency of electricity generation techniques
ergy so far and will therefore be disregarded for this paper. In    and plants. Generally, the economic efficiency of a WT can
the case of selling directly on the electricity exchange mar-       be assessed based on three essential quantities: cost, revenues
ket, revenues depend largely on the temporal development of         and electricity yield. A distinction can be made between
the exchange price and local wind conditions. The question          those metrics that consider the costs of a generation tech-
of how their course over a longer period of time can be esti-       nology and those that consider the revenue situation. Those
mated is the core element of this research and the following        metrics that are found to be relevant for evaluating potential
chapters.                                                           revenues within this study are listed in Table 1 and further
   An alternative for selling electricity from renewable            described in the following.
sources on the electricity exchange markets is so-called               The overall performance of WT (or other generation
power purchase agreements (PPAs). PPAs are mostly made              plants) is often evaluated based on the levelized cost of en-
between corporate electricity consumers and plant operators.        ergy (LCOE). The LCOE is defined as the total lifetime
They enable bilateral trading including consultation between        cost over the total lifetime energy production. It is a widely
contracting parties. Those agreements normally cover a pe-          used and simple metric for estimating the value of renew-
riod of up to 10 years and are established individually each        able energy source (RES) projects (Campbell et al., 2009;

Wind Energ. Sci., 6, 177–190, 2021                                                      https://doi.org/10.5194/wes-6-177-2021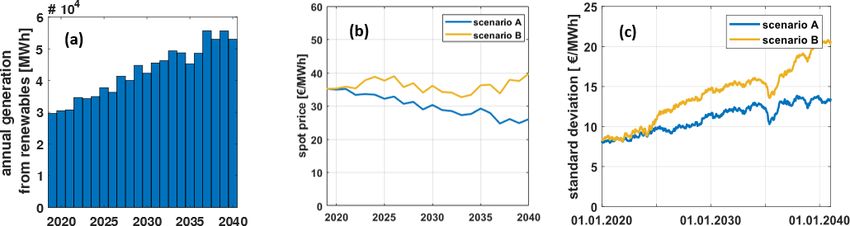
L. Blickwedel et al.: Future economic perspective                                                                            179

Boubault et al., 2016; Ouyang and Lin, 2014; Parrado et al.,      1.3   Existing electricity price forecasting models
2016). To calculate the LCOE, information on annual costs
and annual electricity generation is needed. The annual costs     Extensive literature is available in the field of modeling and
consider investment, operation and maintenance (O&M) and          forecasting electricity exchange prices. However, there is no
fuel costs. However, the LCOE does not consider the time-         consensus on the approach and methodology of modeling.
varying value of electricity generation, which is already crit-   Most models are designed for a specific market situation or
icized in literature (Hirth and Steckel, 2016; Hirth, 2013;       forecasting horizon in which they perform well and deliver
Simpson et al., 2020). Therefore, the LCOE is no holistic         robust results. In an extensive review, Weron has identified
indicator for the profitability and economic value of a plant     five different categories of electricity price forecasting mod-
and its potential revenue. Its value can only be interpreted as   els: multi-agent, fundamental, reduced-form, statistical and
the minimum fixed revenue required for an economical plant        computational intelligence models. Hybrid combinations of
operation.                                                        model types do also exist (Weron, 2014). This classifica-
   The system LCOE (sLCOE) metric addresses this problem          tion will be used for assessing the state-of-the-art forecasting
by adding marginal integration costs. Uckerdt et al. define a     models as well as the newly developed model in this paper. In
method to determine the marginal integration costs from an-       the following, some practical examples of forecasting mod-
nual electricity demand, generation from renewable sources        els are presented which are of methodological interest for
and system costs with and without renewables (Ueckerdt et         this work. Jonsson et al. (2010) investigate the influence of
al., 2013). This makes the metric interesting for a systemic      wind energy forecasts and actual wind volume on the Danish
view, but is not suitable for the centralized planner, since      electricity exchange price. They use a non-parametric regres-
revenues are not considered and complex simulation of inte-       sion model and a statistical distribution of the spot price for
gration costs is required (Joskow, 2011; Lucheroni and Mari,      different scenarios and conclude that a high forecast feed-in
2018; Reichenberg et al., 2018).                                  from wind turbines lowers the electricity price. The actual
   Analogous to the LCOE, the LROEs measure revenues in-          amount of wind energy also influences the price. The authors
stead of costs of a plant. By combining LROE and LCOE,            observe growing price volatility and weather-related price
the net present value (NPV = LROE − LCOE) can be cal-             patterns (Jónsson et al., 2010). Jonsson et al. focus on the
culated. Thereby, information is provided on how incentives       impact of wind energy onto the electricity price, but they do
have to be set to encourage growth of renewable energies.         not consider the impact of the electricity price during differ-
However, time series data and revenues from electricity and       ent wind conditions on the economic efficiency of WTs. The
capacity sales as well as incentives must be considered when      correlation between actually available wind energy and elec-
calculating revenues (Baker, 2011a, b). The LROE can be           tricity exchange price as described by Jonsson et al. should
regarded as the expectable average revenue in a given mar-        be considered.
ket. LROEs vary for the same plant in different markets. The         In 2013 Jonsson et al. then pursue a two-step approach
additional market information poses an advantage of LROE          to model the short-term spot prices in Denmark for the years
over LCOE. Unlike LROE, levelized avoided cost of energy          2010 and 2011. They forecast grid load and electricity gener-
(LACE) does not consider revenues from incentives but from        ation from WTs. Non-linear and transient influences of these
the capacity market. This makes modeling a bit less compli-       two variables are considered in the first step of the model by a
cated and it is more interesting for centralized planners than    non-parametric regression. Subsequently, time-series-based
from a systemic point of view. Due to the neglection of the       models are used to represent the remaining autocorrelations
capacity market in this paper, the LACE appears to be less        and seasonal effects. The authors conclude that models with
suitable for the subject under consideration. The LACEs fur-      variable parameter estimation can yield better results over
ther simplify revenues by incorporating capacity sales, which     time than those with static parameters (Jonsson et al., 2013).
generally represent only a small part of RES revenues. Rev-       However, robust parameter estimation has the advantage that
enues are calculated on the assumption of a linear relation-      models are less vulnerable to abrupt parameter changes, e.g.,
ship between spot market price and residual demands. This         due to excessive price peaks. Hence, robust parameter esti-
simplifies the simulation even further, while still taking into   mation seems to be preferable for the given case.
account that the value of electricity generation varies over         Fanone et al. can generate both negative and positive price
time (Simpson et al., 2020).                                      peaks with a parameter-rich fundamental forecasting model
   In order to evaluate the potential revenue from wind en-       of the German intraday market with hourly resolution. The
ergy, a measurand must be chosen that considers revenues          model parameters are calibrated using historical EPEX intra-
instead of costs. Against this background, LROE and LACEs         day data. The hourly spot price is divided into two compo-
seem equally suitable. LACEs require simplification in price      nents, namely a time-dependent adjustable component and a
calculation. This paper attempts to provide the price time        deterministic component containing long-term variations and
series needed to calculate the LROE using the forecasting         seasonal effects. An annual and a half-yearly periodicity can
model described below.                                            be observed when investigating daily spot prices (Fanone et
                                                                  al., 2013). A disadvantage of this approach is that fundamen-

https://doi.org/10.5194/wes-6-177-2021                                                    Wind Energ. Sci., 6, 177–190, 2021
180 L. Blickwedel et al.: Future economic perspective
Table 1. Overview of relevant metrics for evaluating the economic value of electricity generation techniques.
Metric Abbreviation Objective Formula
Pn Ct Pn Wt,el
Levelized cost of energy LCOE Cost t=1 (1+i)t t=1 (1+i)t
Pn Ct Pn Wt,el d
System levelized cost of energy sLCOE Cost t=1 (1+i)t t=1 (1+i)t + dWt,el Cint
Pn Rt Pn Wt,el
Levelized revenue of energy LROE Revenue (1+i)t t=1 (1+i)t
Pt=1
Y PY
Levelized avoided cost of energy LACE Revenue j =1 Rj, el · hj + Rj,cap j =1 hj
PY P Y
Simplified levelized avoided cost of energy LACEs Revenue R
j =1 j, el j· h h
j =1 j
C : cost; Cint : integration cost; Wel : electricity generation; i : interest rate; Rel : revenue from electricity sales; Rcap : revenue from capacity market; h:
dispatched hours; Y : time periods.
tal changes in generation capacities such as decommission- Thanks to parallel computing, PLEXOS can boast compar-
ing of coal-powered plants are neglected. This could lead to atively short calculation times in the range of a few hours up
long-term forecasting errors that could be avoided by intro- to minutes (Energy Exemplar, 2019). Yet, it is questionable
ducing these changes in generation capacities. whether a leaner model might not be sufficient to achieve
Šumbera and Dlouhý model the German spot market based comparative results at lower computational effort.
on the fundamental assumption that the demand for elec- In the following, a new price forecasting model is derived
tricity and the system load always equal the generation ca- that combines the advantages of the above approaches to pre-
pacity provided by all power plants. A merit-order approach dict time series data of the electricity exchange price in a lean
is used for pricing. The power plants are divided into dis- way.
patchable and non-dispatchable power plants. The dispatch-
able power plant schedules are presented in high detail. Non-
dispatchable power plants are grouped according to their en- 2 Methodology and forecasting model
ergy source and defined as “must-runs”. Power plants whose
In order to draw conclusions on the economic perspective of
generation depends only on their availability are modeled
wind turbines in Germany, model requirements are derived
with variable costs of zero (Šumbera and Dlouhý, 2015). A
from the previous chapters. Based on Sect. 1.1, the forecast-
disadvantage of this methodology is that a set of all gener-
ing objective of this study is the day-ahead spot market as it is
ation units or at least a representative dataset must be avail-
one of the most relevant markets for trading electricity from
able. Apart from that, the merit-order approach as chosen by
wind turbines and furthermore functions as a reference for
the authors seems to be promising for this research.
drafting PPAs. On the day-ahead market, electricity is traded
Next to the discussed models that specifically address fore-
for each hour of the following day.
casting electricity prices, there is also a broad variety of
To assess the potential revenue of WTs, the entire life cycle
equilibrium models that analyze energy systems and conse-
has to be considered. Therefore, the long-term development
quently may be used for electricity price estimation as well.
of the electricity exchange price should be estimated. At the
The Balmorel model will be discussed as representative for
same time, increased price volatility due to higher generation
this group. Balmorel is a partial equilibrium model for an-
from renewable sources should be considered by the chosen
alyzing the electricity and combined heat and power sec-
temporal resolution. In conclusion, a long-term forecast pe-
tors in a large geographical and international perspective.
riod of 20 years at a high temporal resolution will be modeled
It has been directed towards the solution of an optimization
to fulfill both requirements. Due to the hourly trading steps
problem in GAMS to determine entities like generation, con-
of the day-ahead market, the model is designed to calculate
sumption, transmission, and prices of electricity and heat as
prices in hourly resolution to ensure comparability.
well as emission. The source code of Balmorel is openly
Calculating hourly prices requires that short-term demand
available since 2001 (Wiese et al., 2018). Due to the wide
characteristics like daily and weekly patterns are modeled.
range of applications and the necessity to solve an optimiza-
Seasonal demand variations as well as long-term develop-
tion problem, the model poses comparatively high require-
ments of the average demand should be possible to include.
ments in terms of technological detail and data, even if these
For this study it is assumed that the hourly demand for the en-
can be reduced by later model adjustments.
tire forecast period is known in foresight and that the hourly
Another widely used commercial tool is the market sim-
demand equals the grid load at all times.
ulation software PLEXOS (Papadopoulos et al., 2020). Like
The available generation capacity from renewable and
Balmorel, PLEXOS is able to solve complex optimization
conventional sources needs to be considered by generation
problems with an object-oriented approach and delivers mar-
technology. It is also required that changes in national elec-
ket results for the gas, electricity and the water system.
tricity generation landscapes can be parameterized in the
Wind Energ. Sci., 6, 177–190, 2021 https://doi.org/10.5194/wes-6-177-2021L. Blickwedel et al.: Future economic perspective 181
model to account for developments like the decommission- fvar covers different cyclic characteristics of the actual elec-
ing of coal and nuclear energy in Germany. Electricity from tricity demand like higher demands during winter as well as
weather-dependent renewable sources must be integrated. Fi- peak and off-peak hours. All long-term demand trends must
nally, neighboring electricity markets should be considered be considered within Dmean . The hourly electricity demand
in terms of electricity import and export. is assumed to be equivalent to the load profile used for the
A general criticism of many existing models is the lack of merit-order approach.
transparency and accessibility of the calculation methods and
databases as they are often not openly accessible. Therefore, D(t) = Dmean · (1 + fvar (t)) (1)
only openly accessible data shall be used for the forecasting
model.
2.3 Marginal generation cost and conventional capacity
2.1 Forecasting objective and model classification
The national installed generation capacities are divided into
The subject of this study is the hourly German day-ahead conventional and renewable plants, where gas, hard coal, lig-
spot market price over the next 20 years. The developed fore- nite, oil and nuclear plants are considered to be conventional.
cast model uses a merit-order approach to calculate hourly On the other hand, hydro, solar, wind (onshore and offshore)
prices and can therefore basically be classified as a funda- and others (mainly biomass) are considered to be renew-
mental model according to Weron (Weron, 2014). An object- able. Based on these categories, a total installed capacity per
oriented approach has been added for the implementation of year is required as user input. In a next step the model de-
power plants. Each conventional electricity generation unit rives individual objects to generate an object-oriented plant
functions as a single agent and can be parameterized individ- fleet based on reference data. The procedure can be classi-
ually. Due to this design decision, the model can moreover be fied as a simple agent-based approach. The number of power
assigned as an agent-based model, yielding additional bene- plants constitutes the number of agents. Because of the un-
fits over a solely fundamental procedure. All in all, accord- derlying merit-order approach, the decision-making heuristic
ing to Weron, the model presented is being classified as a for every agent and hour is to offer electricity at their own
hybrid model, combining fundamental and agent-based as- marginal generation cost and to generate and sell electric-
pects. Figure 1 shows which input variables and calculations ity if they are below the uniform market clearing price. An
are necessary to describe this target and how they have been interaction topology is given by the competition to the other
linked together within the presented model. First, the elec- power plants or agents. The exogenously given electricity de-
tricity demand is calculated for every hour of the forecasting mand represents the environmental influence that drives the
period based on a mean annual value and an hourly fluctua- decision of every agent.
tion factor. Afterwards, marginal generation cost and genera- Marginal generation cost cvar is calculated for every con-
tion capacities of conventional power plants are derived from ventional plant following: Eq. (2)
different operational parameters and commodity prices. The
hourly renewable generation capacity from solar and wind cvar = cfuel + co&m + cCO2
energy is calculated based on installed capacity and an hourly pfuel pCO2
generation potential. The hourly electricity price is derived with cfuel = and cCO2 = · fCO2 , (2)
η η
as the marginal generation cost of the most expensive power
plant that is still needed to meet the current electricity de- where cvar is the marginal generation cost of a specific power
mand. The obtained time series data are used to calculate plant used for the merit-order approach. Commodity prices
LROE for economic evaluation of WTs. are split into fuel prices pfuel and emission (CO2 ) prices
In the following sections the input data and intermediate pCO2 , which are both assumed to be constant over time dur-
steps of the calculation model are explained in more detail. ing a simulation run. The resulting costs are then calculated
regarding both efficiency η of plants and emission rate fCO2 .
2.2 Hourly electricity demand
For this research, values given in Table 2 have been as-
sumed as reference for commodity prices and efficiencies.
The hourly electricity demand of a country for each year is The values have been derived from TYNDP18 data and are
composed of an annual mean value Dmean and an hourly fluc- assumed to be constant over time (entso-e, 2018). The spe-
tuation factor fvar according to Eq. (1). Dmean is derived from cific cost terms can be varied for each individual power plant.
the total annual demand required as model input while fvar When adding additional plants, cost values can be set indi-
remains the same for any scenario. The time series for fvar vidually. For the plant efficiency it was assumed that over
is derived from data of the Ten Year Network Development all power plants the efficiency follows a beta-distribution de-
Plan (TYNDP18) of the European network of transmission fined by ηmin , ηmean and ηmax where the oldest plants operate
system operators (entso-e, 2018). Figure 2 shows annual, at the lowest efficiency and vice versa. Every plant is also
weekly and daily sections of fvar . It can be observed how given a date of commission and shutdown date. Outside the
https://doi.org/10.5194/wes-6-177-2021 Wind Energ. Sci., 6, 177–190, 2021182 L. Blickwedel et al.: Future economic perspective
Figure 1. Schematic model structure and input data requirements.
Figure 2. Demand variation factor fvar for Germany in 2017 with annual (a), weekly (b) and daily (c) characteristics.
resulting time span, the respective power plant is not con- In the case of the neighboring countries the NTC can func-
sidered for the price calculation. The given emission factors tion as both demand capacity and supply capacity depending
refer exclusively to emissions occurring during operation. on the current electricity spot price of the country. The spot
price is set as the marginal cost (bar height) for neighboring
2.4 Implementation of cross-border transactions countries. The bar height determines whether there is elec-
tricity import or export at a certain hour. If the local price
When considering the German market, the import and export of a neighboring country is lower than the German price, it is
of electricity is very relevant due to its many neighboring assumed that Germany will import electricity from this coun-
countries and its central location in the increasingly intercon- try to the extent of available NTC. The neighboring country
nected European power grid. The approach for this paper on thereby acts as a supplying power plant. On the other hand,
integrating cross-border transactions is to model neighbor- if the local price in a neighboring country is higher than the
ing countries as single power plants (agents). These agents German price, it is assumed that Germany will export elec-
are assigned individual capacity and dynamic marginal cost tricity to the extent of available NTC. In this case the avail-
so that they can be included into the merit-order plot. The net able NTC enlarges the current electricity demand. To esti-
transfer capacity (NTC) provided by the European network mate hourly prices for the neighboring markets, a simplified
of transmission system operators is assumed to be the tech- pre-simulation for each country is executed where import and
nical upper bound for cross-border electricity transfer. Re- export are neglected. This pre-simulation is based on the cur-
garding the merit-order plot, this corresponds to the capacity rent plant portfolio and annual demand of each neighboring
(bar width) of the agent. NTC values for Germany are imple- country and thereby also respects its generation mix.
mented as given in Table 3. At this state, NTC is assumed to Figure 3a illustrates this approach for 1 h within the model.
be constant over time for all countries. The electricity demand on the German market is depicted by
Wind Energ. Sci., 6, 177–190, 2021 https://doi.org/10.5194/wes-6-177-2021L. Blickwedel et al.: Future economic perspective 183
Table 2. Reference values for commodity prices and plant efficiencies (entso-e, 2018).
Property Sign Unit Gas Hard coal Lignite Oil Nuclear
O&M cost co&m EUR MW h−1 1.46 3.3 3.3 2.57 9
Min efficiency ηmin % 25 30 30 25 30
Mean efficiency ηmean % 44 40 40 36 33
Max efficiency ηmax % 60 46 46 43 35
Fuel price pfuel EUR MW h−1 21.96 8.28 3.96 50.76 1.69
Emission rate fCO2 kg MW h−1 205.2 338.4 363.6 280.8 0
Table 3. Cross-border NTC capacities for Germany (entso-e, 2018).
Country AT BE CH CZ DK FR LU NL NO PL SE
NTC [MW] 5000 1000 4600 2100 2765 1800 2300 4250 1400 2500 615
the dotted line at 80 GW. Whenever the market price on a eration capacity of solar panels and WTs. In addition, the
neighboring market is lower than the local price, the neigh- assumption is made that capacity factors will not change in
boring market is handled as a power plant that supplies elec- the future. This poses an underestimation of the available
tricity for the German market. This applies to the two coun- electricity because an increase in capacity factors may be ex-
tries at the left side of the dotted line. When a country ex- pected due to technological progress.
hibits a higher market price than the local price, it is assumed The influence of the ambient temperature on the electric-
to be a potential market for export of electricity. This means ity demand and spot price was assessed by investigating his-
that the actual demand can be extended by the NTC of the toric data of the German day-ahead spot price, trading vol-
respective countries. The continuous line at 105 GW shows ume and temperature in Germany. Hourly data from 2012 to
the resulting total demand that finally defines the price. In 2017 have been used and analyzed in terms of correlation
this case the German spot price increases due to cross-border (Deutscher Wetterdienst, 2020). Figure 4 shows the results
transactions, because there are several markets available for of this analysis in scatter plots with a least-square regression
export. Figure 3b shows an exemplary weekly course of the line and correlation coefficient r. It can be seen that there is
modeled cross-border transfer. It can be seen that at all times a weak positive correlation (r = 0.1652) between tempera-
there is import and export at the same time, while in the over- ture and trading volume and a weak negative correlation be-
all balance there is more export for this particular week. tween temperature and spot price (r = −0.1270) as well as
trading volume and spot price (r = −0.1454). For the given
model it is assumed that the electricity demand always cor-
2.5 Hourly renewable generation capacity and weather responds exactly to the trading volume. Under this condition
time series data and given the very low correlation coefficients, the assump-
tion is made that weather data and load profile do not need to
For the implementation of weather-dependent electricity be synchronized further for the given case. All other weather
generation technologies such as solar panels and WTs, the and climate influences are also neglected within this study.
underlying weather time series data are of fundamental im-
portance. In this paper, the influences of wind speed and so-
lar radiation are assumed according to previous studies of 2.6 Model validation
Staffell and Pfenninger (Staffell and Pfenninger, 2016; Pfen-
ninger and Staffell, 2016). The authors use weather data from To validate the model, calculated prices have been compared
global reanalysis models and satellite observations to gener- to actual prices on the EPEX SPOT day-ahead market for
ate synchronized national time series data for solar and wind the year 2017. As Germany and Austria were a coupled mar-
generation capacity factors for the years 1985 to 2016 at an ket until 2018, the test has been executed for both countries
hourly resolution. There data are also used for commercial together. Figure 5a shows the ordered annual price duration
application in the dataset PLEXOS World 2015 (Brinkerink curve for Germany and Austria as well as the prices calcu-
and Deane, 2020). lated by the presented forecasting model. It can be stated
It is assumed that there is no long-term weather trend in that the model provides satisfactory results in reconstruct-
terms of wind and solar radiation. To calculate the hourly ing the average price level and price distribution at a mean
available electricity generation, the technology-specific ca- absolute error of EUR 2.38 per megawatt per hour and root-
pacity factors are multiplied with the overall installed gen- mean-square error of EUR 5.8 per megawatt per hour over
https://doi.org/10.5194/wes-6-177-2021 Wind Energ. Sci., 6, 177–190, 2021184 L. Blickwedel et al.: Future economic perspective
Figure 3. Exemplary merit-order plot from forecasting model with cross-border considerations (a) and exemplary weekly course of modeled
cross-border transfer (b).
Figure 4. Scatter plots, least-square regression line and correlation coefficient r for temperature and trading volume (a) temperature and spot
price (b) and trading volume and spot price (c) for the German day-ahead market from 2012 to 2017 at hourly resolution.
the course of a year. The mean spot price varies by 1.87 % influence revenues of WTs? Therefore, the forecasting model
between historic data (EUR 34.2 per megawatt per hour) and described in Sect. 2 is now used to calculate hourly electric-
the model result (EUR 34.84 per megawatt per hour). Any- ity prices for the German market over the course of the next
how, it can also be seen in Fig. 5b that the model is not 20 years. Calculation results will be analyzed in Sect. 3.1 and
able to fit the actual temporal order of spot prices. In par- finally put into perspective in a brief case study in Sect. 3.2.
ticular the number of negative price peaks during summer For this study, two different renewable expansion scenarios
is overestimated, leading to an overall RMSE of EUR 20.26 based on German legislation and policy goals are being eval-
per megawatt per hour between historic and calculated val- uated for the years 2019 to 2040. Both scenarios are based
ues. Figure 5c underlines that this is the case all over the year. on the requirements of the Renewable Energy Act and as-
The daily RMSE is in the range of EUR 10–20 per megawatt sume that the medium and long-term energy policy objec-
per hour most of the time. In conclusion, the given model tives of the German government will largely be met. Sce-
results are sufficient when regarding the overall price struc- nario A represents the increase in the share of electricity gen-
ture over a year but must not be used for the forecast of exact erated from renewable energies in gross electricity consump-
hourly values. tion to 65 % by 2030 as stipulated in the coalition agreement
The average calculation time for a forecast period of of 12 March 2018 (Koalitionsvertrag, 2018). Conventional
22 years at an hourly resolution lies at 00:05:11 on a reg- generation capacities are assumed to remain constant in this
ular home computer without parallelization. In comparison, scenario. Scenario B is derived from the scenario framework
PLEXOS calculates optimization results for comparable time approved by the German Federal Network Agency in June
periods and resolution in several hours, even with parallel 2018 (Bundesnetzagentur, 2018). In addition to scenario A,
computing (Energy Exemplar, 2019). it includes in particular the phasing out of nuclear power by
2022 and of coal-powered plants until 2038 decided by the
German Coal Commission in 2019. The forecast lignite and
3 Model application, results and case study
hard-coal-fired power plant capacities are based on standard-
An important question which this research tries to address ized assumptions on the technical and economic lifetime of
is the following: how do different future expansion scenarios power plants. The chosen scenario B follows the basic idea
Wind Energ. Sci., 6, 177–190, 2021 https://doi.org/10.5194/wes-6-177-2021L. Blickwedel et al.: Future economic perspective 185
Figure 5. Validation results and comparison of model results against historic values from EPEX SPOT for Germany in 2017.
of a moderate sector coupling and a mix of centralized and crease in price and decreasing price volatility. In reality, this
decentralized structures. It forecasts the development up to could be the case, e.g., in a weak-wind year.
2035. Thereafter, the forecast for gas-powered plants and re- A sensitivity analysis for the CO2 price is investigated on
newable sources is linearly extrapolated for the following 5 top of both scenarios A and B. Four different specific prices
years. are analyzed, namely 10, 18, 30 and EUR 60 per metric ton.
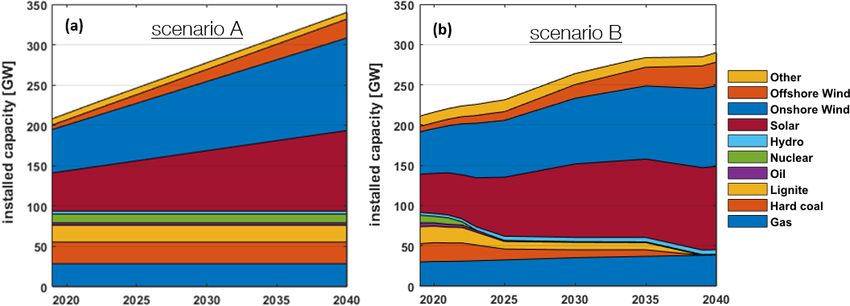
In Fig. 6 the overall installed capacity for Germany is Figure 8a and b show the corresponding results and sensitiv-
shown for scenario A (renewable energy expansion pursuant ity of spot prices against the CO2 price. It can be observed
to the statutory expansion path of EEG 2017) and scenario how an increased emission price leads to higher mean spot
B (additional dismantling of coal and nuclear plants). Mean prices. This influence becomes stronger the more conven-
annual demand is assumed to be constant for both scenarios. tional plants that are active on the market. The converging
It should be emphasized that scenario A with the pure ad- lines in Fig. 8b along the expansion shown in Fig. 6b em-
dition of renewables is a highly improbable scenario. For this phasize this relation. A minimal taper of the curves is also
study it is used as a basis for scenario B and to indicate the shown in Fig. 8a. This is due to the fact that even without
isolated influence of the renewable energy expansion on the the decommissioning scheme, renewable energies are push-
German spot market price. ing conventional power plants out of the market.
3.2 Case study observing a small onshore wind park in
3.1 Scenario results and analysis Germany
Figure 7a–c show the impact of increasing electricity gen- The model results are used to evaluate the potential revenue
eration from renewables on the average spot price and price of WTs in a brief case study. Therefore, hourly supervi-
volatility for the given scenarios A and B. Price volatility is sory control and data acquisition (SCADA) data of a Ger-
represented in Fig. 7c by the floating standard deviation of man wind park with five turbines of the 3 MW class with
spot prices at a window size of 365 d. average full load hours of 1920 h a−1 were used. Following
Both scenarios use the same time series data for annual Sect. 1.2, the commonly used LCOE is no holistic measure to
generation from renewables as shown in Fig. 7a. Comparing assess revenue potential and overall profitability of WTs. In-
Fig. 7a and b, it is visible for scenario A that the increasing stead the LROE as introduced by Baker in 2011 will be used.
generation from renewables causes a constant decrease in the The modeled hourly prices from the merit-order approach are
spot market price. This is referred to as the merit-order effect used to determine the time course of the revenues needed to
(Sensfuß et al., 2008). At the same time an increasing price calculate the LROE.
volatility can be observed in Fig. 7c. For scenario B it can Revenues from selling electricity are calculated based on
be seen in Fig. 7b how the decommissioning of conventional the extrapolated SCADA data and the modeled spot price
power plants counteracts the merit-order effect seen for sce- over the course of the next 20 years. Figure 9 shows the
nario A. Rising prices can be observed for the next 5 years LROE of the investigated wind farm at two different emis-
due to the phase-out of nuclear energy. Prices then fall until sion prices (18 and EUR 60 per megawatt per hour) for both
2035 along the renewable energy expansion and finally rise scenarios. These results are compared to potential revenues
again with the complete decommissioning of coal energy. In based on hypothetic PPAs with different base prices. Mendi-
this case the average price level remains more or less at a cino et al. propose that feed-in tariffs of corporate PPAs over
constant level. On the other hand, a more strongly increas- 7 to 10 years should be in the range between EUR 75 and
ing price volatility for scenario B can be observed in Fig. 7c. EUR 100 per megawatt per hour (Mendicino et al., 2019). For
Taking the year 2035 as an example, it is clear to see how this study a lower range of base feed-in tariffs is assumed be-
reduced generation from renewable sources leads to an in- cause of the longer time span (EUR 40–50 per megawatt per
https://doi.org/10.5194/wes-6-177-2021 Wind Energ. Sci., 6, 177–190, 2021186 L. Blickwedel et al.: Future economic perspective
Figure 6. Development of installed capacity in Germany pursuant to statutory expansion (a) and additional dismantling of conventional
plants (b).
Figure 7. Influence of rising feed from renewables (a) on annual mean spot price (b) and price standard deviation (c) at otherwise constant
conditions.
hour). In the constructed case, electricity sold during times of sure the economic viability of WTs in Germany after all. For
spot prices below the base price will be remunerated with the instance, it could lead to rethinking existing remuneration
respective base PPA price. In order to assess the profitability, and auction systems, also to prevent cannibalistic merit-order
the results are compared to current estimates of the LCOE of effects. Another possibility would be to consider further gov-
onshore wind turbines in Germany (Kost et al., 2018; IWR ernmental support in legislation or adjustment of emission
Online, 2019; Wallasch et al., 2019). These are shown in prices. Finally, an increased market share of PPAs could be
Fig. 9 as green box plots. the consequence in the future. However, these would have to
On the one hand, it can be seen that in the event of higher be set at a sufficiently high price.
electricity exchange prices, higher revenues can be expected
for all cases. Furthermore, it can be observed that for this
particular case, the chosen PPAs do not necessarily guarantee 3.3 Conclusion
profitability. However, the lower revenues from PPAs should
The model application and corresponding results show that
always be evaluated against the background of the equally
it is possible to forecast electricity exchange prices with the
lower risk.
presented model at comparatively low data requirements and
For the results as shown in Fig. 9, many turbines will not
computational costs. The model results can be used for the
be profitable without subsidies for all cases in scenario A and
derivation of development goals in terms of LCOE and de-
for scenario B at emission prices of EUR 18 per metric ton
liver the necessary values for break-even consideration in
without PPA. For these cases the range of LCOE lies mostly
terms of cost reduction or annual energy production.
above the LROE. For the other three situations most or all
Influences of renewable energy expansion and the decom-
turbines would be economically profitable.
missioning of conventional power plants on the mean spot
Based on the case study, it can be seen that profitable oper-
price can be shown in two calculation scenarios in Sect. 3.1.
ation of wind turbines in Germany without subsidies is uncer-
The model results in Fig. 7a–c show that for scenario A,
tain in the future. Depending on which scenario is assumed
a pure expansion of renewables could lower the electric-
and which way of selling is chosen, future WTs could be un-
ity price in Germany by EUR 10.98 per megawatt per hour
economical. On the one hand, this emphasizes the need to
(−31.2 % compared to 2019) and increase its standard de-
further reduce the LCOE of wind energy through technical
viation hence volatility by EUR 5.36 per megawatt per hour
progress in design, production and operation. However, this
(+67 % compared to 2019). In addition, results for scenario
finding may also lead to various developments in order to en-
B show that the forecasted expansion of renewables in Ger-
Wind Energ. Sci., 6, 177–190, 2021 https://doi.org/10.5194/wes-6-177-2021L. Blickwedel et al.: Future economic perspective 187 Figure 8. Mean annual spot price in Germany for scenarios A (a) and B (b) at different CO2 prices. Figure 9. LROE of the observed wind park over 22 years at different emission prices and different PPAs compared to currently estimated LCOE of onshore WT in Germany (green box plots) for expansion scenario A (a) scenario B (b). many, in conjunction with the coal and nuclear power phase- which considers the LROE for different technologies could out, can lead to roughly constant exchange market prices and be a more holistic approach and a more indirect technology increasing volatility by up to EUR 12.37 per megawatt per support. hour (+151 % compared to 2019). Figure 8a and b shows that the pricing of emissions in the coming years will have a 4 Discussion and outlook strong influence on the exchange price. This effect will de- crease as more and more conventional plants are being de- In this study a new forecasting model has been presented that commissioned. Overall, the level of emission prices in the estimates future electricity exchange prices for Germany in next 20 years has a very strong influence on both the ex- order to conclude on potential revenues of non-subsidized change price and the profitability of non-subsidized WTs. WTs. Prices are calculated at an hourly resolution over 22 Figure 9 shows that at a CO2 price of EUR 18 per metric ton years. Historically, this used to be a rather unusual combina- most of the onshore wind turbines in Germany could not be tion. However, the necessity to consider the dynamic elec- operated without additional funding. Regarding the evalua- tricity generation characteristics of wind and solar energy tion of revenue potential, LROE, as presented in Sect. 3, has has become more common in recent years and state-of-the- shown to be an appropriate benchmark for evaluating mar- art models as described in Sect. 1.3. The given model is ket developments. By using LROE instead of LCOE model using a merit-order approach in combination with a simple results can be evaluated independently from plant specific multi-agent approach for conventional power plants. The lat- cost and thereby have a more general character and appli- ter allows to integrate neighboring countries and cross-border cability. Just like LCOE, LROE can be used to define and electricity trading. The developed model is constructed com- evaluate technical and financial development goals for en- paratively simple with many assumptions being made. This gineering. Moreover, it allows a consideration detached from leads to low data requirements based on open source data and plant costs and can be used both in the negotiation of PPAs or allows easy adaptation on the one hand. Compared to mod- as a benchmark for policymaking, for example in determin- ern complex optimization models this may be advantageous. ing a suitable CO2 price. Today, subsidies in the form of the On the other hand, the model assumptions also cause less ac- tendering procedure generally follow the LCOE. A funding curate results and narrow the possible field of application. https://doi.org/10.5194/wes-6-177-2021 Wind Energ. Sci., 6, 177–190, 2021
188                                                                              L. Blickwedel et al.: Future economic perspective

   To validate the model results, historic prices of the Ger-         Author contributions. The concept and method of the present
man day-ahead market of 2017 have been compared to model              study were developed by LB and FH. LB performed the implemen-
results for the same year. The annual ordered price dura-             tation of the software as well as the initial text creation and visu-
tion curve was reconstructed at a mean absolute error of              alization. FH and RS reviewed and edited the document. RS and
EUR 2.38 per megawatt per hour. Anyhow, because of the                GJ were responsible for supervision and final approval. FH and RS
                                                                      acquired the funding. All authors have read and agreed to the pub-
simplifying assumptions regarding electricity demand and
                                                                      lished version of the paper.
weather data synchronization it is not possible to forecast the
exact temporal course of prices by the hour. For future work
it is planned to benchmark the given model results in terms
                                                                      Competing interests. The authors declare that they have no con-
of accuracy against state-of-the-art models like PLEXOS or            flict of interest.
Balmorel. Even if the model results lag behind proprietary
solvers in terms of result quality, the results can at least serve
as a first estimation and comparison value that can be gener-         Special issue statement. This article is part of the special issue
ated within a few minutes.                                            “Wind Energy Science Conference 2019”. It is a result of the Wind
   The two scenarios discussed in this study are solely de-           Energy Science Conference 2019, Cork, Ireland, 17–20 June 2019.
veloped from current German policy goals. Especially sce-
nario A is very unlikely to actually happen. Further, more
sophisticated expansion scenarios for Germany and other Eu-           Acknowledgements. We thank the German Federal Ministry for
ropean countries that also consider long-term electricity de-         Economic Affairs and Energy for funding the research project
mand trends should be simulated. The scenarios from the               ArkESE in which we address this topic. In the 3-year project (start
IEA World Energy Outlook and the Ten Year Network De-                 December 2018), rural municipalities are investigated to design in-
velopment Plan 2020 by ENTSO-E are currently being con-               dividual electricity supply systems on the basis of renewables. Mu-
                                                                      nicipalities shall be enabled to prepare, make and implement energy
sidered for this purpose.
                                                                      system-related decisions more self-sufficiently.
   A major limitation of the model lies in the neglect of
national grid capacities. Grid bottlenecks are already pos-
ing major challenges for the expansion of renewable ener-
                                                                      Financial support. This open-access publication was funded
gies today, for example when considering the integration of           by the RWTH Aachen University.
offshore wind energy. This strong simplification should be
improved in subsequent model extensions. The given model
also needs further improvement to overcome current limita-            Review statement. This paper was edited by Katherine Dykes
tions. During future studies, the model shall be extended by          and reviewed by Matti Koivisto and one anonymous referee.
implementing dynamic time series for the currently constant
parameters like emission and fuel prices as well as cross-
border capacity and average electricity demand. Also finding
rules for synchronizing the weather data used and the elec-           References
tricity demand time series might yield further improvement
of the model results. Finally, the agent-based approach could         Baker, T.: Levelized Revenue of Electricity (LROE) – Part 2: Re-
                                                                        newable Energy Analysis, A smart, well researched and scien-
be further developed by introducing randomness as well as
                                                                        tific analysis of the science, policy and business of renewable
learning rules for agent decision making. Further model ap-
                                                                        energy, available at: http://thomasabaker.blogspot.com/2011/09/
plication is also planned in combination with planning and              levelized-revenue-of-electricity-lroe.html, last access: 5 Novem-
optimization tools such as the wind farm optimizer WIFO                 ber 2020, 2011a.
to generate a more reliable economic yield prognosis in ad-           Baker, T.: Levelized Revenue of Electricity (LROE) – Part 1: Re-
dition to the energy yield prognosis. WIFO is an optimiza-              newable Energy Analysis, A smart, well researched and scien-
tion tool that calculates wind farm layouts based on LCOE               tific analysis of the science, policy and business of renewable
minimization and maximization of annual energy production               energy, available at: http://thomasabaker.blogspot.com/2011/08/
(Roscher et al., 2018; Roscher, 2020).                                  levelized-revenue-of-electricity-lroe.html, last access: 5 Novem-
                                                                        ber 2020, 2011b.
                                                                      Berger, A., Marschner, P., Bühler, K., and Kurz, A.: Cor-
Data availability. The data and metadata used to calculate the re-      porate PPA erfolgreich gestalten, available at: https:
sults shown in this study are cited and accessible via URL in the       //www.roedl.de/de-de/de/erneuerbare-energien/documents/
bibliography. The datasets are not yet deposited in a DOI marked        corporate-ppa-erfolgreich-gestalten.pdf (last access: 4 Novem-
repository because there are still substantial adaptions being made     ber 2020), 2016.
to the described models.                                              Boubault, A., Ho, C. K., Hall, A., Lambert, T. N., and Ambrosini,
                                                                        A.: Levelized cost of energy (LCOE) metric to characterize solar
                                                                        absorber coatings for the CSP industry, Renew. Energ., 85, 472–
                                                                        483, https://doi.org/10.1016/j.renene.2015.06.059, 2016.

Wind Energ. Sci., 6, 177–190, 2021                                                         https://doi.org/10.5194/wes-6-177-2021
L. Blickwedel et al.: Future economic perspective 189 Brinkerink, M. and Deane, P.: PLEXOS World 2015, frage zu Perspektiven nachfragegetriebener Stromlieferverträge https://doi.org/10.7910/DVN/CBYXBY, 2020. bis 2030, dena-MARKTMONITOR 2030, Deutsche Energie- Bundesnetzagentur für Elektrizität, Gas, Telekommu- Agentur GmbH (dena), Berlin, Germany, 18 pp., 2019. nikation, Post und Eisenbahnen: Genehmigung des Hirth, L.: The market value of variable renewables: The effect of so- Szenariorahmens 2019–2030, available at: https://www. lar wind power variability on their relative price, Energ. Econon., netzausbau.de/SharedDocs/Downloads/DE/2030_V19/SR/ 38, 218–236, https://doi.org/10.1016/j.eneco.2013.02.004, 2013. Szenariorahmen_2019-2030_Genehmigung.pdf;jsessionid= Hirth, L. and Steckel, J. C.: The role of capital costs in decar- BD3659F41F1C3D9FAFDAD202EF8D4719?__blob= bonizing the electricity sector, Environ. Res. Lett., 11, 114010, publicationFile (last access: 4 November 2020), 2018. https://doi.org/10.1088/1748-9326/11/11/114010, 2016. Campbell, M., Blunden, J., Smeloff, E., and Aschenbrenner, P.: IWR Online: Bundesnetzagentur legt Obergrenze für Minimizing utility-scale PV power plant LCOE through the use Windenergie-Ausschreibungen 2020 fest, available at: of high capacity factor configurations, in: 2009 34th IEEE Photo- https://www.iwr.de/ticker/verguetung-bundesnetzagentur- voltaic Specialists Conference (PVSC), Philadelphia, PA, USA, legt-obergrenze-fuer-windenergie-ausschreibungen-2020-fest- 7–12 June 2009, 421–426, 2009. artikel2031, (last access: 24 January 2021), 2019. Coussi, M. and Harada, L.-N.: Power Purchase Agreements: Javadi, M. S., Azami, R., Javadinasab, A., and Hemmatipoor, G.: An Emerging Tool at the Centre of the European En- Renewable Generation Expansion Planning Based on Power Pur- ergy transition A Focus on France, European Energy and chasing Agreement, Int. J. Multidisciplin. Sci. Engin., 2, 28–34, Environmental Law Review, 2020, 195–205, available at: 2011. https://kluwerlawonline.com/journalarticle/European+Energy+ Jonsson, T., Pinson, P., Nielsen, H. A., Madsen, H., and Nielsen, and+Environmental+Law+Review/29.5/EELR2020043 (last T. S.: Forecasting Electricity Spot Prices Accounting for Wind access: 24 January 2021), 2020. Power Predictions, IEEE T. Sustain. Energy, 4, 210–218, Deutscher Bundestag: Renewable Energy Sources Act Gesetz https://doi.org/10.1109/TSTE.2012.2212731, 2013. für den Ausbau erneuerbarer Energien (Erneuerbare-Energien- Jónsson, T., Pinson, P., and Madsen, H.: On the market im- Gesetz): EEG2017, 2020. pact of wind energy forecasts, Energ. Econ., 32, 313–320, Deutscher Wetterdienst: Historical air temperature in Germany, https://doi.org/10.1016/j.eneco.2009.10.018, 2010. available at: https://opendata.dwd.de/climate_environment/ Joskow, P. L.: Comparing the Costs of Intermittent and Dispatchable CDC/observations_germany/climate/hourly/air_temperature/ Electricity Generating Technologies, Am. Econ. Rev., 101, 238– historical/, last access: 6 November 2020. 241, https://doi.org/10.1257/aer.101.3.238, 2011. Elwakil, E. and Hegab, M.: Risk Management for Power Purchase Klinger, I.: Corporate PPA. Going Green, Hamburg Com- Agreements, in: 2018 IEEE Conference on Technologies for Sus- mercial Bank, available at: https://www.hcob-bank.de/en/ tainability (SusTech), Long Beach, CA, USA, 11–13 November presse/publikationen/branchenstudie-ppa/ (last access: 24 Jan- 2018, 1–6, 2018. uary 2021), 2019. Energy Exemplar: PLEXOS Breakout, Discussion Koalitionsvertrag zwischen CDU, CSU und SPD, avail- on Major PLEXOS Enhancements, available at: ble at: https://www.cdu.de/system/tdf/media/dokumente/ https://energyexemplar.com/wp-content/uploads/ koalitionsvertrag_2018.pdf?file=1, last access: 10 November EMFC-2019-PLEXOS-Breakout-Presentation.pdf (last ac- 2020, 2018. cess: 24 January 2021), 2019. Kost, C., Shammugam, S., Jülch, V., Nguyen, H.-T., and Schlegl, T.: entso-e: TYNDP2018: Ten Year Network Development Plan, Exec- Stromgestehungskosten erneuerbare Energien, Fraunhofer Insti- utive Report, available at: https://tyndp.entsoe.eu/maps-data (last tute for Solar Energy Systems ISE, Freiburg, Germany, 2018. access: 6 November 2020), 2018. Lucheroni, C. and Mari, C.: Optimal Integration of Intermittent Re- Fanone, E., Gamba, A., and Prokopczuk, M.: The case of neg- newables: A System LCOE Stochastic Approach, Energies, 11, ative day-ahead electricity prices, Energ. Econ., 35, 22–34, 549, https://doi.org/10.3390/en11030549, 2018. https://doi.org/10.1016/j.eneco.2011.12.006, 2013. Mendicino, L., Menniti, D., Pinnarelli, A., and Sorrentino, Federal Ministry for Economic Affairs and Energy: Zeitreihen N.: Corporate power purchase agreement: Formulation of zur Entwicklung der erneuerbaren Energien in Deutschland: the related levelized cost of energy and its application unter Verwendung von Daten der Arbeitsgruppe Erneuerbare to a real life case study, Appl. Energ., 253, 113577, Energien-Statistik (AGEE-Stat), Federal Ministry for Economic https://doi.org/10.1016/j.apenergy.2019.113577, 2019. Affairs and Energy, Berlin, Germany, 48 pp., 2019a. Ouyang, X. and Lin, B.: Levelized cost of electricity (LCOE) of Federal Ministry for Economic Affairs and Energy (Ed.): Zweiter renewable energies and required subsidies in China, Energ. Pol., Fortschrittsbericht zur Energiewende: Energie der Zukunft, Fed- 70, 64–73, https://doi.org/10.1016/j.enpol.2014.03.030, 2014. eral Ministry for Economic Affairs and Energy, Berlin, Germany, Papadopoulos, C., Johnson, R., and Valdebenito, F.: PLEXOS® In- 298 pp., 2019b. tegrated Energy Modelling around the Globe, available at: https: Federal Ministry for Economic Affairs and Energy (Ed.): Moni- //old.energyexemplar.com/wp-content/uploads/publications/ toringbericht zur Versorgungssicherheitim Bereich der leitungs- PLEXOSIntegratedEnergyModellingaroundtheGlobe.pdf, last gebundenen Versorgung mit Elektrizität, nach § 63 i.V.m. § 51 access: 7 November 2020. EnWG, Federal Ministry for Economic Affairs and Energy, Parrado, C., Girard, A., Simon, F., and Fuentealba, E.: 2050 Berlin, Germany, 43 pp., 2019c. LCOE (Levelized Cost of Energy) projection for a hy- Fischer, T., Ebner, A., Battaglia, M., Ehrig, R., Petersen, brid PV (photovoltaic)-CSP (concentrated solar power) A., and Haueisen Pechir, B.: Corporate Green PPAs: Um- https://doi.org/10.5194/wes-6-177-2021 Wind Energ. Sci., 6, 177–190, 2021
You can also read