Theatrical Movies As Capital Assets
←
→
Page content transcription
If your browser does not render page correctly, please read the page content below
Theatrical Movies As Capital Assets
                                       By Rachel Soloveichik

                                               Abstract

       In 2007, I estimate that studios spent $20.0 billion producing original theatrical movies.
These movies were shown in theaters in 2008 and will be sold on DVD and broadcast on
television for decades to come. Because of their long working life, the international guidelines
for national accounts recommends that countries classify production of movies and other
entertainment, literary and artistic originals as an investment activity and then depreciate those
movies over time. However, BEA did not capitalize this category of intangible assets until the
July 2013 benchmark revision. In order to change the national accounts, I collected data on
movie production from 1915 to 2010. I then calculated how GDP statistics change when
theatrical movies are classified as capital assets.
       To preview, my empirical results are: 1) Theatrical movies have a useful lifespan of at
least 80 years; 2) Over the past decade, nominal movie production has grown slower than the
overall economy. As a result, nominal GDP growth falls slightly when theatrical movie
production is classified as a capital investment; 3) Thanks to improvements in computer
technology; prices for shooting new movies have been constant over the past decade.

The views expressed here are those of the author and do not represent the Bureau of Economic
Analysis or Department of Commerce. Email: Rachel.Soloveichik@bea.gov

                                                      1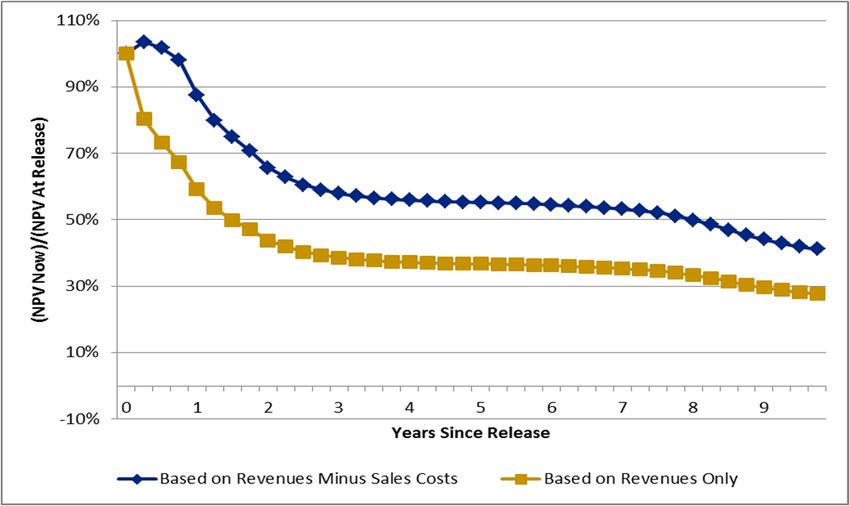
Introduction

       The motion picture industry started in the late 1800s when Thomas Edison introduced the
Kinetescope. Over the next decades, movies improved in quality and became a very popular
source of entertainment. By 1929, Americans were spending $720 million per year on movie
tickets (Vogel 2004), 0.7% of nominal GDP. The GDP share of movies diminished in the 1950s
and 1960s when television became widespread. After 1980, the movie industry made a
comeback with the introduction of video cassettes and DVDs. In 2007, studios earned $39
billion from theatrical movies, 0.27% of nominal GDP.
       In 2007, I estimate that studios spent $20.0 billion producing original theatrical movies.
This value includes box office licensing revenue, television licensing revenue, DVD sales,
merchandise licensing and any other revenue sources. Because of their long working life, the
international guidelines for national accounts recommends that countries classify movie
production as an investment activity and movie originals as capital assets. This recommendation
was first introduced by the 1993 System of National Accounts (SNA 1993 10.94) and was
reiterated in the 2008 System of National Accounts (SNA 2008 10.115).
       In the national income and product accounts (NIPAs), this $20.0 billion of movie
production could either be treated as a current expense or it could be treated as an investment. If
theatrical movies have a useful life of less than one year, then the production costs for movies
should be treated as a current expense. In that case, the final revenue from the sale of movies is
all that matters for gross domestic product (GDP), and production costs for movies are an
expense in the same way that DVD stamping and movie advertising is an expense. Before the
July 2013 benchmark revision, BEA used this method to account for movie production.
       In contrast, items with a useful lifespan of more than one year are generally classified as
capital assets. If theatrical movies have a long useful life, then the production costs for movies
should be treated as a capital investment. In that case, the capital investment in theatrical movies
is added to GDP as part of private investment and added to the pre-existing capital stock of
movies to get the total capital stock of movies. This capital stock of original movies then returns
a flow of value to its owner, and that flow is counted in GDP as part of capital services. GDP
counts both the flow of value and the initial investment. As a result, GDP is always higher when
a good is changed method 1) to method 2). Finally, the total capital stock of original movies is

                                                 2
depreciated, which is known as consumption of fixed capital. In addition to the well-known
GDP, BEA also estimates net domestic production. Net domestic production equals GDP minus
consumption of fixed capital. Because net domestic production does not include the cost of
maintaining the capital stock, it is generally viewed as a better long-term measure of the total
sustainable output of an economy.
In order to calculate the NIPAs with theatrical movies as a capital asset, I estimate real
production, prices and capital stock for theatrical movies back to 1929. The most important
results are given below.
1) Theatrical movies have a projected lifespan of at least 80 years. Furthermore, the
average depreciation rate is only 9.3% per year. The total capital stock of all theatrical
movies was worth more than $150 billion in 2007.
2) Over the past decade, nominal movie production has shrunk from 0.16% of GDP to
0.13% of GDP. This shrinkage occurred during a period that movie production prices
rose much slower than overall inflation. Over the same time period, real movie
investment grew at 5% per year.
3) The movie industry grew rapidly during the Great Depression. In 1929, theatrical
movie investment was $162 million, 0.15% of GDP. By 1934, movie investment was
$301 million, 0.46% of GDP. Accordingly, the Great Depression looks a little less grim
when movies production is counted as an investment activity. After World War 2, movie
investment hovered between 0.10% and 0.16% of the overall economy. Accordingly,
GDP growth from 1945 to 2010 does not change much when movie production is
counted as an investment activity.
My research on capitalizing theatrical movie production is part of a broader initiative by
the BEA to improve the treatment of intangible assets in the national income and product
accounts. In addition to the movie research, I have papers measuring investment in long-lived
television, original music, books and miscellaneous entertainment (Soloveichik 2013a, b, c and
d). Other researchers at the BEA have developed a satellite account measuring the annual
investment and capital value of R & D (Robbins and Moylan 2007), educational investments
(Fraumeni, Reinsdorf, Robinson and Williams 2008) and the role of intangible assets in foreign
direct investment (Bridgman 2008).
3This paper consists of three sections. In section 1, I describe my data on nominal
production costs for theatrical movies and calculate the nominal value of movie production back
to 1929. In section 2, I describe my price index and calculate the real value of movies
production back to 1929. In section 3, I estimate the depreciation schedule for theatrical movies
and then use that depreciation schedule to calculate capital stocks of theatrical movies from 1929
to 2010.
1. Nominal Production
What Products are Included?
In this paper, I study the production of theatrical movies. The category “theatrical
movies” include any movie shown in theaters, even if it earns the majority of its revenue from
DVD sales or television licensing. However, this category does not include television movies or
direct-to-DVD movies.1 Those movies are measured in a separate paper “Long-Lived Television
Programs as Capital Assets” (Soloveichik 2013a). I also exclude movies distributed on YouTube
or other internet broadcasters because those films are very different from theatrical movies. I
hope to study long-lived entertainment produced by internet broadcasters in a future paper.
Because this project is focused on the United States national accounts, I restrict my
sample to movies produced by US studios. Even if a movie is filmed abroad, it is still included
in my analysis if a US corporation or resident originally owned the movie. Some movies are
jointly produced by US and non-US studios.2 In the absence of any data on the ownership
shares, I split those movies proportionally. For example, suppose that a $100 million movie is
jointly produced by a US studio, a French studio and a British studio. I assume that the US
studio spent $33 million producing its share of the movie.
My paper does not calculate imports or exports of movie licensing. In the trade data,
BEA treats revenue from US movies shown abroad as an export of services and overseas
production of US movies as an import of services. Previous researchers have found that studios
1
The treatment of direct-to-DVD movies is potentially controversial. They are too small to be in their own
category, but they could be placed in either television or theatrical movies. Based on viewership data from Nielsen
Media and advertising data from Kantar media, I believe that direct-to-DVD movies are more similar to television
programs than they are to theatrical movies. Accordingly, I placed them with long-lived television programs.
2
In a few cases, IMDB does not provide production studios. In those cases, I use listed country of production. I
drop movies with no information at all.
4often misreport the revenue from US movies shown abroad (Hanson and Xiang 2006). It is also
possible that studios misreport the value of overseas production of US movies. However, these
potential problems have no impact on the estimates in my paper. My paper calculates the
change to GDP from capitalizing theatrical movies. If imports and exports are misreported, then
BEA’s estimates of GDP may be incorrect. However, the size of the error remains exactly the
same when movies are re-classified as capital goods. Therefore, my estimates are not sensitive
to any problems measuring international transactions properly.
Movie Investment in 2007
The primary dataset for this project is the 2007 Economic Census. According to the
Economic Census, theatrical movies earned $22 billion from domestic licensing, $6.5 billion
from foreign licensing, $7.1 billion from DVD sales and $3.0 billion from merchandise
licensing.3 Of course, movie studio revenue is not equal to returns on theatrical movie originals.
Studios must pay physical sales costs like DVD stamping and marketing costs before they can
earn any money from their intangible asset. Based on “The Big Picture” (Epstein 2005a), I
estimate that physical sales account for 5% of licensing revenue and 15% of DVD revenue.
Based on data from Kantar Media, I estimate that marketing accounts approximately 30% of
total revenue. This marketing includes direct advertising costs like airtime and also indirect
costs like studio overhead devoted to marketing. After subtracting sales costs, studios earned
$24.5 billion in returns from their theatrical movie assets.
Because my paper is focused on the production of new movies, I would like to measure
revenue by the year of release rather than year of sales. In other words, a 2010 re-run of
“Cinderella” is attributed to 1950 – not 2010. Of course, I don’t know how much movies
released in 2007 will actually earn in 2017. Instead, I use data on current market shares for older
movies to predict future earnings. This data is described further in section 3. Given my
predicted earnings, I calculate the net present value (NPV) of revenues for newly release movies:
Investment = (Sales of New Movies)*[(NPV of all Sales)/(Sales in First Year)]
3
The Economic Census does not split DVDs and merchandise licensing between television and movies. I use sales
data from The-numbers.com to split DVDs. I split merchandise licensing proportionally to other licensing.
5In section 3, I calculate that new movies account for 33% of total industry revenue. I also
calculate that NPV of future sales is 2.48 times sales in the first year.4 Therefore, I calculate that
new movie investment is:
Investment = (Revenue after sales costs)*.33*2.48 = 82%*$24.5 billion = $20.0 billion
Movie Investment 1929-2010
I use the Service Annual Survey (SAS) to measure movie investment from 2005 to 2010.
I first benchmarked each revenue type reported in the SAS to the 2007 Economic Census. I then
applied the adjustments for sales costs, market share for new movies and NPV factor described
earlier. Going forward, BEA plans to use revenue data from the SAS to measure movie
investment in the national income and product accounts (NIPAs).5
Before 2005, I use data on real movie inputs from the website IMDB.com, which is a
massive database containing theatrical movies, television programs and videos. Based on my
own research, I believe that IMDB contains every major theatrical movie and most minor
theatrical movies produced in the US.6 For each item in their database, IMDB collects a list of
actors and production crew, technical information like run-time and business information like
production budgets, etc.
IMDB allows researchers to download the complete raw data files for all movies,
television programs, videos and video-games in their database. All of my estimates reported in
this paper are based on the complete raw data files. Accordingly, the standard errors for my
estimates of real production are relatively small.7 I supplement the IMDB data with industry
literature giving background on the process of movie production and the non-production costs.
Table 1 contains a description of the data used in my analysis and the figures they are used in.
4
This calculation depends critically on the discount rate. In earlier versions of this research, I used discount rates
ranging from 7% real to 10% real. The current numbers in this paper support a discount rate of 8.2% real.
The 8.2% discount rate deflates future sales by the PCE deflator, not the movie price index. Over the past 20 years,
movie prices have grown slower than overall PCE prices. However, I believe investors holding movie originals are
concerned with revenues relative to GDP, not revenues relative to the movie industry.
5
This approach produces relatively smooth estimates of annual investment. Actual movie filming can be volatile,
especially on a quarterly basis. For example, a threatened strike increased filming the first half of 2001. Even
though the strike did not materialize, filming still dropped in the second half because studios had already planned
their filming to avoid it.
6
Alexander and Associates surveys people about home video purchases and rentals. I was able to match most
movies mentioned by survey respondents to the IMDB data. Adult movies, exercise movies and music videos were
often unmatched.
7
However, my estimates are very sensitive to the techniques for imputing budgets to movies with missing data.
6I use four separate variables from IMDB to estimate real production budgets: a) the
number of actors; b) the number of non-actors (e.g. writers, camera people, make-up artists, etc.);
c) the number of locations listed and d) the number of special effects companies. To start out, I
restrict the sample to major movies released 2000 to 2009.8 In section 2, I will show that
inflation was very low over that time period. Therefore, I do not need controls release year.
Live action and animated movies are produced very differently, so I estimate two separate
production budget equations. The following equations are the precise regression used in Stata.9
Nominal budget for live action films = αLA *(number of actors) + βLA *(number of non-actors) +
γLA *(number of locations) + δLA *(number of special effects companies) +εLA
Nominal budget for animated films = αAN *(number of actors) + βAN *(number of non-actors)
+εAN
For live action films, the coefficients imply that one extra actor costs $46,000; one extra
non-actor costs $172,000; one extra location costs $1,118,000 and one extra special effects
company costs $4,488,000. For animated movies, the coefficients imply that one extra actor
costs $485,000 and one extra non-actor costs $502,000. The higher labor costs for animated
movies is consistent with the industry literature. Animated movies are generally produced over
several years, and so each computer programmer or animator puts in more time on the movie
than a set designer does on a live action movie.10
In the analysis given earlier, I focus on ‘major’ movies, which I define as the top 100
movies each year. All other movies are considered minor movies, and treated separately. Many
of these minor movies have no production budgets listed. If I impute production budgets for
minor movies based on the cost of major movies, then minor movies account for approximately
8
In order to define major movies, I first ranked all US movies by the number of non-actors (which are the biggest
cost factor). I then focus on the top 100 US movies each year. If a film is produced jointly by a US and non-US
studio, I count it as half a movie. Results are similar if I use another cut-off.
9
I use the no option to suppress the constant term. If the constant term is not suppressed, it is positive and
significant for every regression. My time series would be very different if I allowed a constant term. However, I
believe that the constant is caused by measurement error and is misleading. The R2 is 0.80 for both regressions
10
Star actors are generally paid much less for animated movies, where they only provide voices. However, there are
many fewer extras on animated movies. Furthermore, programmers need to do a lot of support work for each
character in animated movie. The net effect may be higher costs per actor in animated movies.
784% of total production in 2007. However, minor movies earn only about 25% of the US box
office, 25% of the US video revenue and 35% of US television revenue in my sample.11
Furthermore, relatively few IMDB users rate minor movies. Based on all of these factors, I
believe that minor movies have significantly lower budgets than their reported inputs would
suggest. I impute real production budgets for minor movies according to the following formula:
Real budget = (Supposed budget from listed inputs)*.99min(max(rank-100,0),400)
In other words, I assume that minor movies have smaller budgets than their inputs would
suggest, and the difference grows as you move further down the list. My equation was calibrated
to a graph of (number of IMDB votes)/ (Supposed budget). The same general equation works
reasonably well for all decades studied, from the 1930’s to the 2000’s.12 Therefore, it seems to
be a general fact of the movie industry that A-list movies use higher cost inputs than B-list
movies. However, I don’t have enough data to test whether the true budget for minor movies
matches this particular equation.13 I also reduced budgets by 50% for short movies and 50% for
silent movies (75% for silent shorts). This adjustment has a big impact on production and prices
before 1929.
Finally, I calculate nominal production for each year. First, I aggregate the real budget
for each movie to get real investment by the entire motion picture industry. Next, I multiply real
investment by the price index described in section 2. This approach is a little different than the
measurement techniques used for long-lived television, books, music and miscellaneous artwork
(Soloveichik 2013a, b, c and d). For all of those entertainment categories, I measured nominal
investment first and then use my price index to estimate real investment. These two approaches
will both produce similar results if the prices are measured correctly. As a robustness check, I
also estimate nominal movie revenue from 1929 to 2010 and calculate investment from that.
11
My samples cover 2000-2009 for box office, 1988-2002 for video and 2003-2008 for television. All of the
numbers are approximate. The exact percentages might be different if I only look at 2007.
12
The equation is also roughly consistent with data on box office, home video and television advertising revenue.
However, I do not have enough data to be certain of the precise form.
13
Movies that report budgets generally have higher (IMDB votes)/(Supposed budget from listed inputs). This
suggests movies with budgets might be higher quality. The bias is biggest for minor movies, which rarely report
budgets.
Because of the reporting bias, I ignore reported budget for minor movies. Instead, I only use imputed budget.
8Figure 1 compares both estimates of nominal movie production from 1929 to 2010. The
most important result is that the estimate based on IMDB data tracks the estimate based on
revenue reasonably well over time. I believe that the IMDB data is higher quality than the
revenue data. For example, I do have any data on foreign box office revenue before 1965.
Before then, I assume that foreign box office revenue is a fixed percentage of US box office
revenue. This fixed percentage might not hold in unusual times like World War 2. Also, the
ratio of new investment to revenue may have changed over time. In the rest of the paper, I will
use the IMDB data to measure investment, prices and capital stock.
Calculating Quarterly Production
This paper counts movie investment when the movie is first released, not when the movie
is filmed. I make this choice for two related reasons: 1) It is extremely difficult to measure
quarterly filming costs in real times. Accordingly, my quarterly numbers would be too
speculative to include in the NIPAs; 2) Conceptually, unreleased movies could be counted in
inventories as “work in progress,” similar to the treatment of uncompleted manufactured goods.
This paper does not count unreleased movies in inventory. Instead, this paper is focused on how
GDP changes when entertainment originals are reclassified as capital assets.
For interested readers, Figure 2 shows estimates of the value of unreleased inventory
from 1990 to 2009. There is a clear seasonal pattern to movie inventory. Studios generally film
all around the year but release their best films during the summer and right before Christmas.
Most data users focus on seasonally adjusted numbers, so the consistent pattern is adjusted out.
However, there is also some non-seasonal variation in inventory. Some of this variation can be
explained by labor relations. For example, actors threated a strike that would have started in
May of 2001. Studios responded to the threatened strike by increasing production before the
strike and stockpiling enough films to last until the spring of 2002. In the end, no strike
occurred, but studios still cut back on production in the second half of 2001 so that they could
use up their huge stockpile (Graham 2001). Other inventory variation might be related to the
financial crisis or just a measurement error.
92. Price Indexes and Real Production
It is difficult to develop a price index for movie originals. Each movie is a unique artistic
creation, so I can never compare the cost of producing two identical movies at different times. In
this paper, I use labor and non-labor inputs to calculate the real budget for each film in the IMDB
dataset. I assume that each actor, each non-actor, each filming location and each special effects
company produces the same amount of entertainment capital over time. I then calculate my price
index as the ratio of nominal production budgets to real budgets. Therefore, my price index will
double if the nominal production budget doubles while inputs are held fixed. This price index
assumes zero multifactor productivity growth since 191514 and omitted inputs grow at the same
rate as inputs tracked. I believe that the technologies like DVD players should be considered
improvements in viewing technology – not movie technology. After all, studios often re-release
classic movies on DVD.
Price Indexes from IMDB Data
I used the same IMDB data described in section 1. First, I used the regression
coefficients described earlier to estimate what the nominal production budget for each movie
would be if it was filmed between 2000 and 2009. As a robustness check, I also calculated real
budgets using major movies filmed 1980-1989, 1960-1969 and 1940-1949. I then dropped the
movies which did not report production budgets and calculated a price index for each year:
Price in Year X = (Nominal BudgetMovie 1 + … + Nominal BudgetMovie N) /
(Real BudgetMovie 1+ …. + Real BudgetMovie N)
Figure 3 gives the price index from 1929 to 2009. The most important result is movie
prices have been almost flat from 2000 to 2009. At the same time, the general service sector
price rose 32%. I believe that the slow inflation for movies is caused by improvements in
computer technology. Digital video-cameras are cheaper and easier to use than film-based
14
Multi-factor productivity could rise if directors learned better production techniques over time. Alternatively, it
could fall if early movies used up all the good storylines. For simplicity, I assume that productivity has not changed
at all over time. This might overestimate productivity before 1935, when the movie industry was very new.
10video-cameras. Once the movie is shot, studios use computers to edit the film, create special
effects, etc. The other noteworthy result from Figure 3 is that price trends are similar regardless
of which base period I use. For the rest of the paper, I will use movies filmed 2000 to 2009 to
calculate price indexes.
Potential Sample Selection Problems
Sample selection may potentially bias the price indexes shown in Figure 3. IMDB does
not report production budgets for all movies in the sample. Movies with missing data generally
have fewer actors, non-actors, special effects companies and filming locations. Even controlling
for the inputs listed, movies with missing data do worse. For every dollar of imputed production
spending, movies with missing budget data earn 73% lower box office revenues,15 42% less from
home video16 and 13% less from television licensing.17 There are two ways to interpret this
correlation: a) movies with missing data are expensive flops; b) movies with missing data are
cheap successes. If a) is true, then my price imputations are correct and the missing data does
not bias my results. If b) is true, then my price imputations are flawed and the missing data
created biased estimates.
It is possible that missing data creates serious problems with my time series. For
example, suppose that movies with missing budgets cost 50% less than otherwise similar movies
which did report budgets. Between 1929 and 1989, only 22% of major movies report a budget.
Between 1990 and 1999, 54% of major movies report a budget. Between 2000 and 2008, 81% of
major movies report a budget. In that case, prices for major movies 1929-1989 are overstated by
(1-22%)*.5 = 39% before 1990, (1-53%)*.5 = 23.5% between 1990 and 1999 and (1-81%)*.5 =
10% between 2000 and 2009. In other words, I overestimate historical prices badly and
therefore underestimate inflation over time.
I can’t fix the sample selection problems. However, the results in Figure 1 suggest that it
is not too severe. In Figure 1, I used a price index based on Figure 3 to calculate nominal
investment for every year from 1929 to 2010. As a robustness check, I also used nominal
15
Based on US box office revenue reported by IMDB. Sample restricted to major movies released 2000 to 2009.
16
Based on survey data for 1987-2002. Sample restricted to major movies released 1990-1999.
17
Based on airing time (premium & regular cable counted equally) 2003-2008. Sample restricted to major movies
released 1990-1999.
11revenue data to measure nominal investment. The two techniques give similar results,
suggesting that IMDB-based price index is reasonably accurate.
Input Prices for the National Accounts
The price index presented in Figure 3 is conceptually interesting, but it is too volatile to
use in the National Accounts. From one year to the next, prices may drop 25% and then go right
back. In addition, the IMDB price index requires days of data analysis to calculate. That work-
load is not feasible for BEA analysts to do each quarter.
In this section, I calibrate an input-based price index to match the IMDB price index
shown earlier. This input-based index is a weighted average of a BEA price index, and two BLS
price indexes. Because the data is already available, it can be calculated in a few minutes.
a) The main input for movies is live performances to film. These live performances
require inputs like scripts, scenery, costumes, actors, etc. Animated movies have different
inputs, but they still need writers to create a script, graphic designers to create characters and
actors for the voice-overs. For both types of movies, labor costs account for the majority of
input costs, but there are also non-labor costs like offices to plan the movie, materials for the
scenery and costumes, etc. I have not been able to locate a pre-existing price index that tracks
live performance costs in the movie industry. However, BEA does track consumer prices for
live entertainment such as theatrical plays, dance performances and music concerts. I assume
that performances in the live entertainment industry use similar inputs to live performances in the
movie industry – so the prices should move similarly.18 BEA’s live entertainment price index is
published in NIPA Table 2.4.4U, line 211. Before 1959, I use the overall PCE deflator as a
proxy for live entertainment costs. That price index is published in Table 2.4.4, line 1.
b) The second input for movies is video cameras to record and process the live
performances. BLS has produced a producer price index (PPI) for photographic and
photocopying equipment. The series ID for that PPI is PCU333316333316.19 Going forward, I
recommend that analysts use that PPI. For historical prices, I use a variety of price indexes.
18
Ticket prices for popular music concerts have risen much faster than other components of the live entertainment
sector. This increase appears to be a response to music piracy (Krueger 2005) and is not caused by an increase in
input costs. However, popular music concerts are a relatively small share of the overall live entertainment industry.
Therefore, the price index does not change much when I adjust for music concert prices.
19
BLS briefly produced a specific PPI for video cameras used in the movie industry (PCU33315333157), but that
PPI only started in 2007 and was discontinued shortly afterwards.
12From 1977 to 2006, I use the BEA deflator for ‘other video equipment’. That price index is
given in Table 2.4.4U, line 40. From 1947 to 1976, I use the BLS PPI for ‘audio and video
equipment manufacturing’. The series ID for that PPI is PCU334310334310. For 1929 to 1946,
I use the BEA deflator for ‘audio, video & information processing equipment and media”. That
price index is given in Table 2.4.4, line 14. I then splice all of those time series together to get a
price index for movie cameras from 1929 to 2010.
c) The last input for movies is computers to edit the raw footage, add special effects and
other digital enhancements. Over the past two decades, studios have benefited from enormous
improvements in computer quality. I recommend that analysts use the general PPI for
‘electronic computer manufacturing’. The series ID for that PPI is PCU334111334111. IF BLS
ever produces a more specific PPI, then analysts can switch to that.
Of course, computers have not always been used in movie studios. For historical price
indexes, I assume that computer usage was negligible before 1990. At that time, animated
movies used hand drawn illustrations instead of computers to create their scenes. Computer
usage then grew rapidly over 1990s. By 2000, computer costs plateaued at 15% of the nominal
budget for live action movies and 30% of the nominal budget for animated movies. Of course,
real computer prices have been plummeting since 2000. Therefore, real computer usage has
increased from 2000 to 2010. This includes supercomputers used to create special effects,
computers used to edit raw footage and other digital enhancements.
None of these price indexes are a perfect proxy for movie input costs. In particular, I am
concerned that the price index for live entertainment is too smooth. For a variety of reasons,
ticket prices for live theater may be sticky despite economic problems. In contrast, movie actors
and other talent may have flexible wages. Most studios hire their workers for an individual
movie, so they can quickly adjust wages for new projects. If unemployment is high, studios may
be able to assemble a top quality team for less than normal rates. I welcome suggestions to
measure historical prices better.
Figure 4 compares the input-based price index with IMDB price index. In the long-run,
both input-based price indexes track the IMDB-based price index reasonably well. The input-
based price index does a better job of matching IMDB prices when I adjust for unemployment.
However, this is mostly important during the Great Depression. In the past few years, the IMDB
price index has not dropped despite a large increase in unemployment. Accordingly, the
13relationship between unemployment rates and movie costs may no longer hold. In order to be
cautious, BEA will use the unadjusted input price index in the national accounts. That price
index is used to calculate nominal investment in Figure 1 and nominal inventory in Figure 2.
Hedonic Price Indexes
I experimented with a hedonic price index to measure the cost of producing a movie of
constant quality over time. Unfortunately, the only measures of quality available on IMDB are
length of the movie, width of film, animated versus live action and color film versus black and
white. Most of these quality measures achieve their maximum by 1980. None of them capture
expensive items like dramatic special effects and high quality computer animation. In contrast,
the input-based quantity index performs reasonably well at measuring those expensive items. I
do quality adjust slightly by reducing the budgets for silent films by 50% and the budgets for
short films by 50% (75% for silent shorts). This adjustment has a significant impact on initial
capital stock in 1929, but little impact on prices after 1935.
Consumption-Based Price Indexes for Movies
Prices paid by consumers for theatrical movies might offer another potential price index
for theatrical movies. The BEA produces four separate price indexes that are relevant to movies:
a) a price index for movie tickets; b) a price index for purchased DVDs; c) a price index for
rented DVDs and d) a price index for cable television. These price indexes are all reported in
Table 2.4.4U. The line numbers are 44, 210, 215 and 219.
Figure 5 compares the input price index with BEA’s four price indexes. I find that the
consumption-based price indexes do not track each other or the input-based price index. Movie
ticket prices and cable prices rose significantly faster than input costs. At the same time, DVD
rental prices have remained almost constant and DVD purchase prices have fallen dramatically.
Given the huge differences between the four indexes, it is important to pick the right
consumption-based price index to deflate nominal expenditures. However, there is no easy way
to determine which index is the right one to use.
Even if the consumption-based price indexes were consistent, they still might not be
useful. All of those price indexes track prices for goods or services disseminating copies of
theatrical movies, not the underlying theatrical movie originals. For example, the price of movie
14tickets might rise because rents go up for the building or wages rise for theater ushers. Based on
the industry literature, I estimate that theatrical movie costs account for approximately 25% of a
movie theater ticket prices, 50% of DVD prices (purchases & rented) and 15% of cable prices.20
In theory, it is possible to adjust consumer prices to strip out non-artwork costs. However, that
process is much more difficult than using input costs.
Furthermore, the consumption-based price indexes are not adjusted for the quality of a
theatrical movie. Based on the IMDB data, I believe that real movie quality has risen
significantly from 1929 to 2010. In the 1930s, the typical major movie had 15 non-actors to
write scripts, design sets, etc. In the 2000s, the typical major movie had 106 non-actors. Modern
studios are also much more likely hire special effects companies and shoot scenes outside of the
studio lot. Therefore, the average movie ticket in 2010 buys a better experience than the average
movie ticket did in 1929.
Real Production 1929-2010
Figure 6 calculates an implicit quantity index by dividing the nominal production
spending estimated in Figure 1 with the unadjusted input-price index shown in Figure 4. I find
that real movie production grew rapidly from 1929 to 1935. Movie production then stayed flat
for the next forty years. After 1975, movie production started growing again. Between 1975 to
2008, movie production grew by 8% per year.
It is interesting to note that the quantity index in Figure 6 does not track with Census
data on total employment in the theatrical industry.21 The Census data is based on worker’s self-
reported industry in the 1920, 1930, 1940, 1950, 1960, 1970, 1990 and 2000 population Census
and the 2001-2008 American Community Survey. My quantity index shows that real production
increased by more than 400% between 1980 and 2008. In the Census data, employment
increased by only 10%. The main difference between the two series is how they handle
outsourcing. The Census only counts workers in the United States. In contrast, my analysis
includes workers around the world as long as a US studio owns the movie. Over the last 30
years, domestic studios have moved much of their production out of the US (McDonald 2006).
Therefore, an index based on US employment only will underestimate the total value of movies
20
The 15% share is only for movie originals. Television program originals also contribute to cable costs.
21
This includes theatrical plays, movies and some television.
15owned by US studios. In addition, the Census’s count of workers may miss employees who are
not employed directly by the movie studios. For example, Pixar might hire a computer
consulting firm to help with animation. In the 1970’s, the average movie paid $6.4 million to
actors and non-actors, but only $0.37 million to special effects companies (2005 dollars).22 In
the 2000’s, the average movie spent $24.3 million to actors and non-actors and $17.5 million to
special effects companies. This rapid growth in special effects spending will not show up in
movie studio employment.
3. Depreciation Schedules and Capital Stock for Movies
The standard order for a movie release is first movie theaters, then DVD sales and finally
television. In this paper, I will use five separate datasets to estimate the rate at which studios
receive revenue from their movie originals: 1) US box office data from IMDB.com; 2) a
consumer survey of home video purchases and rentals within the United States from Alexander
and Associates; 3) A historical dataset from Tribune Media Services listing the dates and stations
selected theatrical movies are shown on US broadcast and cable television; 4) A historical
dataset from Red Bee Media Services listing the dates and stations selected theatrical movies
were shown on European television; 5) Nielsen ratings for a sample of US television airings of
theatrical movies.23 Appendix 1 contains more information on the source of the datasets used,
the data cleaning rules and the procedures for estimating quarterly revenue.
In this paper, I define the value of a movie original as the expected present value of future
revenues minus future costs. I define the depreciation schedule as the rate at which a movie
original declines in value over time.24 There are many possible reasons why a movie original
might decrease in value over time. In this paper, I will not attempt to distinguish between
exhaustion of the target market, obsolescence of the special effects technology, physical
depreciation of the film reel, or any other reason why consumers stop buying an old movie. I
22
Sample covers live action movies in the top 100 each year. Payments are estimated from the regressions used in
Section 1 and IMDB’s data. I do not know actual payments.
23
Figures 7-20 are taken from an earlier version of this paper. Since that version, I have slightly changed my price
indexes and other factors which could influence the depreciation schedule. The graphs would be very similar if I
used the latest price indexes.
24
I discount future revenues at 7% real. The depreciation schedule changes slightly if I use a different discount rate.
16will simply estimate the schedule at which studios earn revenue from their movie originals and
the costs associated with those revenues.
Revenues from Movie Theaters Worldwide
The first stage of a typical movie’s lifecycle is theatrical release. In 2002, studios earned
21% of their revenue from theatrical release. The 2007 Economic Census does not split box
office licensing and television licensing, but movie studios probably earned a slightly smaller
share from box office in 2007. Since the 1948 Paramount antitrust ruling, studios have not been
allowed to own movie theaters and display their films directly. Instead, studios rent copies of
their films to movie theaters in return for a share of the ticket sales (Gil 2007). The industry
norm is that theaters pay 70% of their box office revenue to studios in the first week after
theatrical release and smaller shares for later weeks (Vogel 2004). On average, box office
licensing equals 40% of movie theater ticket sales.
I found that the typical movie has a very short lifespan in US theaters, as shown in Figure
7. Between 2000 and 2009, the typical movie earned 69% of its box office revenue in the first
quarter after theatrical release and 26% in the second quarter. US box office revenue trails off
dramatically after that. As a robustness check, I also used data from The-number.com to track
worldwide box office revenue. I found very similar results: movie theaters around the world
only show new movies.
Home Video Revenue
The next stage in a typical movie’s lifecycle is DVD release. According to the 2007
Economic Census, studios earned 22% of their revenues from DVD sales. In the past, studios
released their movies to VHS approximately six months after theatrical release. This gap has
been falling steadily over time, and by 2006 studios waited only 4 months between theatrical
release and DVD release (Hettrick 2007). Movies are almost never withdrawn from the home
video market, and consumers continue to buy or rent old movies years after initial release.
Figure 8 shows (estimated real home video revenue)/(real production budget) for new
movies by quarters since release. The typical movie is not released to DVD until about six
months after theatrical release. Once it is released, it sells DVDs worth more than 100% of its
production budget over six months. After the first year, revenue trails off quickly. Total DVD
17revenue is 125% of the production budget in the first year, 74% of the production budget in the
second year, 24% of the production budget in the third year and 14% of the production budget in
the fourth year.
Figure 9 shows (estimated real home video revenue)/(real production budget) for older
movies by quarters since release. I find that the revenue decrease slows dramatically once a
movie passes the first few years. Between years 4 to 9, revenue drops by about 14% per year.
Between years 10 to 14, revenue drops by about 5% per year. After year 15, revenue remains
almost constant. All of these numbers are an average. My sample covers the entire universe of
movies produced in the US, so there are many movies which do not appear in the dataset at all.
Those movies are counted as zeroes when I calculate (real licensing revenue)/(original
production budget). Because of random variation, I cannot determine the precise depreciation
rate for very old movies, but it is clearly small.25
I also find a very small depreciation rate when I track a fixed sample of pre-1980 movies,
as shown in Figure 10. These movies accounted for a little more than 10% of total studio
revenue between 1988 and 2002. Because the depreciation rate is so small, I cannot determine
the precise number. The point estimate for my depreciation rate changes when I use a different
functional form or different price indexes to deflate nominal revenues.
In order to get the best possible estimate of the long-term depreciation rate, I use the
complete sample of classic movies. First, I calculated real home video revenue 1988-2002 by
year of release. For example, movies released in 1950 earned $760 million in home video
revenue between 1988 and 2002 (2005 dollars). Earlier in this paper, I calculated that studios
spent $1.5 billion (2005 dollars) producing those same movies.
Figure 11 shows the ratio (real home video revenue 1988-2002)/(original production
budget) by year of release. Even when I aggregate by year, the data is still very noisy. However,
there is a general pattern for older movies to earn less than newer movies. On average, movies
released 1929 to 1953 earned home video revenues equal to 25% of their original production
budget. Movies released 1954 to 1979 earned home video revenues equal to 39% of their
original production budget. Therefore, I calculate that long-term depreciation is 36% over 25
25
Some movies are remade every few years. For example, there are dozens of “Sherlock Holmes” movies or
television programs. Alexander and Associates tried to identify the precise movie people watched, but many
consumers might have gotten confused and misreported the movie. As a robustness check, I restricted the sample to
movies with unique titles. I found that depreciation rates were very similar.
18years, or about 2% per year.26 This depreciation rate is sensitive to my estimates of historical
production budgets, the price index used to deflate classic movie production budgets and the
price index used to deflate contemporary home video revenue.
Television Licensing Revenue based on Airtime
The final stage of typical movie’s lifecycle is television licensing. In 2002, studios
earned 34% of their revenue from television. Movies are first shown on premium cable about
nine months after theatrical release (Vogel 2004). Premium cable channels generally show
newer movies, but they occasionally show older movies if the audience is still interested.
Movies are first shown on regular cable and foreign television about 24 months after theatrical
release (Vogel 2004). Regular cable and foreign television show movies for decades, until the
audience loses interest.
Figure 12 shows (estimated real television revenue)/ (real production budget) for new
movies by age and television market. I find that US premium cable has two separate windows.
Premium cable starts showing movies about six months after theatrical release. It then shows
movies frequently for the 18 months. Movies then are withdrawn over the next few years. By
the time a movie is four years old, it is almost gone from premium cable. Finally, movies return
to premium cable when they are about seven years old. In contrast, regular cable and foreign
television are much steadier. Networks first show movies when they are about two years old.
After that, they continue showing movies at about the same rate for the next eight years. Just
like home video, I track the entire universe of movies produced in the US. Movies which do not
appear at all are counted as zeroes.
Figure 12 shows the depreciation rate for older movies is relatively small. However, the
time span is too short to estimate a precise depreciation rate. In Figure 13, I track a fixed sample
of pre-1995 movies from 2003 to 2008. Once again, I find that the depreciation rate for older
movies is relatively small, but I cannot get a precise depreciation rate. In order to get a better
depreciation rate, I use the complete sample of classic movies. I use the exact same techniques
described earlier for Figure 11.
26
According to current copyright law, movies lose protection after 95 years. In theory, I could adjust the
depreciation schedule accordingly. In practice, movies that are old are already heavily depreciated. Furthermore,
the industry has lobbied several times to extend their copyrights and may do so again.
19Figure 14 shows the ratio (Estimated Television Revenue)/(Real Investment) by year of
release for US television. Very few movies released before 1980 are shown on premium cable.
Based on that data, I calculate that premium cable revenues decrease by 10% per year after the
first few years. In contrast, regular cable often shows older movies. I calculate that regular cable
revenues decrease by about 5% per year. I do not have good annual data for foreign TV, but the
market share for classics is fairly large.27 In my analysis, I will assume that foreign TV
depreciates at the same rate as regular cable. Just like home video sales, these depreciation
estimates are sensitive to my estimates of historical production budgets, the price index used to
deflate classic movie production budgets and the price index used to deflate contemporary
television revenue.
Television Licensing Revenue based on Viewership
I do not know how much television networks paid for television licensing. Based on the
2007 Economic Census and Nielsen data, I estimate that premium cable channels earn
approximately $0.28 per viewer-hour and regular cable channels earned $0.15 per viewer hour.
Therefore, it is likely that premium cable channels pay a higher licensing fee per viewer.
However, I do not have any data on actual prices charged for individual movies or genres. In
most cases, television licensing payments are negotiated privately and the prices are kept secret.
As a substitute for data on license fees, BEA has purchased a special dataset of cable
ratings from Nielsen. Cable networks receive a monthly fee per household, so they should prefer
movies that draw more households. Therefore, it seems reasonable to use viewership per hour as
a proxy for licensing fees per hour.28 The Nielsen dataset reports the domestic rating for every
television program shown on ten randomly selected days between 2003 and 2008. I do not have
any ratings data for foreign television. I used the Nielsen dataset to impute television revenue
for Figures 12-14.
Figure 15 shows the average rating by age for premium cable and regular cable. The
ratings data is very noisy, so I cannot draw a smooth curve. But there does not appear to be any
trend for older movies to get lower ratings. Even if total viewership was fixed, it is possible that
27
BEA purchased a dataset that gave all airing for a sample of 1,000 movies. In order to get the most data, I picked
a sample of popular movies. It would be extremely difficult to translate that sample into a representative sample.
28
This assumes that the non-licensing costs are identical for old and new movies. The main non-licensing cost is
likely to be advertising by the network. I analyzed a dataset from Kantar Media that gives advertising by networks
for theatrical movies. I found that advertising is approximately proportional to viewership.
20classic movie viewers could be less profitable for other reasons. In order to test that hypothesis,
BEA purchased ratings data by demographics. I found little relationship between movie age and
viewer demographics. If anything, classic movies attracted slightly more prime-aged men than
recent movies.29 Therefore, it seems unlikely that classic movies earn less per viewer minute
than recent movies. Because all movies earn about the same amount per viewer minute, studios
probably charge similar licensing fees per viewer. If not, then a cable network could switch to
cheaper movies and reduce its costs without reducing the number of subscribers.30
Lifecycle for Sequel Rights
In this paper, I only value individual movies. This is consistent with the SNA’s final
handbook (SNA 2008 5.2.2 “Criteria for inclusion”). In theory, one might also capitalize sequel
rights for theatrical movies as well. For example, the ‘Star Wars’ franchise is legally protected.
Nobody can make a new ‘Star Wars’ movie without permission from its current owner. Holding
the production budget fixed, sequels receive 25% higher box office revenue than original
movies.31 Furthermore, box office revenue accounts for 21% of total movie revenue. Therefore,
one might calculate that sequel rights account for 25%*21% = 5% of a movie’s value.
As a robustness check, I measured the lifespan for sequel rights. I found that sequels are
the most common within five years of the original movie. After that, the sequel rate trails off
slowly. This lifecycle is very similar to the lifecycle for other revenue sources such as home
video and television. If I capitalized sequel rights, then I would split the value of each original
movie into two separate assets: the movie itself and potential sequel rights. However, these two
assets are both produced using the same inputs and have similar lifespans. Therefore, the
aggregate capital stock would not change if sequel rights were capitalized separately from
individual movies. By the same token, aggregate production and real production would remain
almost unchanged.
29
Advertisers pay much higher rates for men 18-49, so ad-supported networks often target their shows to that group.
On the other hand, cable distributors charge identical monthly subscription fees for all demographic groups.
30
It is possible that cable stations receive other benefits from showing new movies. For example, viewers might
value an hour spent watching new releases higher than an hour spent watching classic movies. In that case,
licensing fees per viewer-hour might be higher for new movies.
31
Sequels also earn slightly lower home video and television revenues and spend less on advertising. None of those
differences are statistically significantly. All figures for major movies only. Box office data is for 2000-2008.
21Advertising Costs for Theatrical Movies
Movie studios spend enormous amounts of money advertising their films right around the
theatrical release. In fact, these advertising costs are often larger than the studio’s share of
theatrical revenue (Epstein 2005b). This advertising has an immediate impact on sales (Wilbur
and Renhoff 2008). Studios also spend money printing the film reels to be shown in movie
theaters and then shipping them nationwide. In order to track advertising spending, BEA
purchased a subscription to ‘Adspender’ by Kantar Media Services. This dataset tracks
advertising by product across the US. I then adjusted the Kantar data for non-US advertising. In
total, I estimate that studios spend about 45 cents on advertising airtime for every dollar they
spend on filming.
Figure 16 shows advertising spending by quarters since release. In the first quarter after
theatrical release, studios spend 30% of their filming investment on advertising. In the next three
quarters, studios spend another 14%. After the first year, studios spend almost nothing on
advertising. On average, studios spend more money advertising their new films than they earn
from theatrical release. At first glance, it would seem that studios could raise profits by skipping
the theatrical release entirely. In fact, advertising new movies almost certainly raises demand for
DVDs in six months when the movie is released to the home video market. It is also possible
that advertising new movies raises demand for television showings in ten years. BEA’s general
practice is to treat advertising as a current expense. Therefore, I will deduct advertising revenue
from revenue in that quarter. Because of this choice, the value of movie originals peaks in the
third quarter, after advertising is completed.
Manufacturing Costs
Before a movie can be shown in theaters, movie studios must print thousands of reels and
distribute them across the world. I estimate that printing and distribution costs are approximately
10% of box licensing office revenue.32 All of these costs occur right before theatrical release.
Movie studios also need to stamp, pack and ship DVDs around the world. In “The Big
Picture”, Epstein reports that studios spend about $4-$5 for each individual DVD on
32
This estimate is significantly lower than the $1.3 billion for the six major studios reported in a recent article
Alimurung 2012). If that article is correct, then movie depreciation rates are slightly lower and movie investment in
2007 was slightly lower. In the future, studios may switch to digital distribution and save printing costs. However,
digital distribution requires other costs like new projectors.
22manufacturing and sales. These manufacturing costs and sales expenses represent around 33%
of the wholesale price for DVDs. For simplicity, I will assume that studios stamp DVDs and
ship them in the same quarter they’re sold. Epstein also reports that it only costs $30,000-
$50,000 for a studio to prepare the master DVD file from a pre-existing film reel,33 less than
0.1% of filming costs. This upfront cost is small enough to ignore.
Movie studios spend almost nothing on manufacturing for television licensing. In “The
Big Picture”, Epstein estimates that it costs only around $150,000 for a studio to prepare a pre-
existing film for television release. And the television network pays all of the advertising and
customer service costs itself. I will assume that 99% of the revenue from television licensing
represents a return on the investment filming a movie.
Overhead Costs and Profit-Sharing
The final cost to studios is residual payments to fulfill profit-sharing contracts between
the studio and workers. From the studio’s point of view, profit-sharing arrangements represents
a significant cost. Depending on the contract, actors and directors may be legally entitled to a
portion of the revenues earned from box office, home video sales and television licensing.
However, from the standpoint of national accounts, these payments are simply a delayed wage
payment.34 This is similar to the tech industry, where workers are often paid with stock options.
The investment activity is the same regardless of when the workers are paid or how the payment
is structured. I will not subtract these payments from studio revenue.
Final Depreciation Schedule
Earlier in this paper, I calculated separate depreciation schedules for box office revenue,
home video revenue, television licensing revenue and advertising. In order to combine these
rates into a single depreciation schedule, I need to weight each revenue source properly. I will
benchmark all my revenue data to the 2007 Economic Census.
33
This only measure the cost of transferring a pre-existing file. It is common for studios to include additional
material on DVDs such as interviews with actors, extra scenes, etc. The cost of this material might be considerably
larger than $50,000.
34
An alternative method to account for profit-sharing agreements would be to assume that studios only own a
portion of the movie and actors own the rest. In that case, I would calculate the actor’s share by estimating the net
present value of future royalty payments. However, that procedure would complicate my calculations without
changing the aggregate value of theatrical movies.
23You can also read