WP/20/200 Demographics and the Housing Market: Japan's Disappearing Cities - International ...
←
→
Page content transcription
If your browser does not render page correctly, please read the page content below

WP/20/200

Demographics and the Housing Market: Japan’s Disappearing
 Cities

 by Yuko Hashimoto, Gee Hee Hong, and Xiaoxiao Zhang

 IMF Working Papers describe research in progress by the author(s) and are published to
 elicit comments and to encourage debate. The views expressed in IMF Working Papers are
 those of the author(s) and do not necessarily represent the views of the IMF, its Executive
 Board, or IMF management.
© 2020 International Monetary Fund WP/20/200

 IMF Working Paper

 Asia Pacific Department

 Demographics and the Housing Market: Japan’s Disappearing Cities

 Prepared by Yuko Hashimoto, Gee Hee Hong, and Xiaoxiao Zhang1

 Authorized for distribution by Paul Cashin

 September 2020
IMF Working Papers describe research in progress by the author(s) and are published to
elicit comments and to encourage debate. The views expressed in IMF Working Papers are
those of the author(s) and do not necessarily represent the views of the IMF, its Executive
Board, or IMF management.

 Abstract

How does a shrinking population affect the housing market? In this study, drawing on
Japan’s experience, we find that there exists an asymmetric relationship between housing
prices and population change. Due to the durability of housing structures, the decline in
housing prices associated with population losses is estimated to be larger than the rise in
prices associated with population increases. Given that population losses have been and
are projected to be more acute in rural areas than urban areas in Japan, the on-going
demographic transition in Japan could worsen regional disparities, as falling house prices
in rural areas could intensify population outflows. Policy measures to promote more even
population growth across regions, and avoid the over-supply of houses, are critical to
stabilize house prices with a shrinking population.

JEL Classification Numbers: C33, J11, R31, R38

Keywords: population change, house prices, durable housing model, akiya (vacant houses),
regional disparity

Authors’ E-Mail Addresses: yhashimoto@imf.org; ghong@imf.org; xz413@cam.ac.uk

1
 We would like to thank Helge Berger, Paul Cashin, Giovanni Dell’Ariccia, Kenneth Kang, Gaston Gelos, Gita
Gopinath, Gian Maria Milesi-Ferretti, Takuji Tanaka, Ken Chikada, and seminar participants at the Bank of Japan
(during the 2019 Japan Article IV mission), the IMF Surveillance Meeting, the IMF Asia and Pacific Department
Discussion Forum, and the RESSI-MF seminar, for helpful comments and suggestions. The work commenced
when Zhang was a research assistant in the IMF Research Department.
2

 Table of Contents

Abstract ___________________________________________________________________1

I. Introduction ______________________________________________________________4

II. Demographic Trends in Japan _______________________________________________6
 A. Population Change at Prefecture Level ______________________________________6
 B. Japanese Households: Total Number and Composition ________________________10

III. Housing Price Developments in Japan _______________________________________11
 A. House Price Changes Across Prefectures __________________________________11
 B. House Price Changes by Housing Type ____________________________________12
 C. Tokyo Story _________________________________________________________14

IV. Modeling Population Growth and Housing Prices ______________________________17
 A. Theoretical Framework ________________________________________________17
 B. Empirical Analysis ____________________________________________________18

V. Policy Implications ______________________________________________________20
 A. Why Move to Large Cities? _____________________________________________21
 B. Human Capital and Housing Price Changes ________________________________22
 B. Implications for Household Balance Sheets_________________________________22
 C. Overinvestment and Housing Market Policy ________________________________24

VI. Conclusion ____________________________________________________________25

References ________________________________________________________________27

Figures
1. Japan’s Population and its Age-group Composition_______________________________4
2. Kernel Density of Population Growth by Prefecture ______________________________7
3. Changes in Rate of Net-Migration in Four Major Metropolitan Areas ________________8
4. Changes in Change in Prefecture-Level Concentration: 1996-2015 __________________8
5. Households and Family Members ___________________________________________10
6. Residential Land Price Trend in Japan ________________________________________11
7. Housing Price Change Over Time by Prefecture (in percent) ______________________12
8. Housing Price Movements by Property Types __________________________________13
9. Institutional Investment in J-REIT ___________________________________________14
10. Supply and Demand in Tokyo Housing Market ________________________________15
11. Tokyo Metropolitan Area: New Condominium Supply and Prices _________________16
12. Nonlinear Relationship between Population Growth and House Price Changes _______18
13. Changes in House Price and Net Migration Flows (1996-2018) ___________________19
14. Education and House Prices _______________________________________________22
15. Change in Household Balance Sheet Values 1994-2017 (Trillion Yen) _____________23
3

Tables
1. Speed of Population Change _________________________________________________9
2. House Price Changes and Population Change __________________________________20

Annexes
A. Household Numbers and the Housing Market __________________________________29
B. Development of Housing Market in Japan from 1982 to 2012 _____________________31
C. Japan Tax Policies Related to the Housing Market ______________________________33
4

 I. INTRODUCTION

Advanced economies are in the middle of a significant demographic transition. Population
growth is slowing, due to a combination of low fertility and an increased life expectancy
(OECD, 2019; United Nations, 2017). A shrinking population poses significant economic
challenges, as studies find that the loss of workers could lead to lower productivity growth,
lower potential growth and a steady rise in age-related fiscal costs such as pensions and medical
care (IMF 2018, 2020; McGrattan et al. 2018; Westelius and Liu, 2016; Colacelli and
Fernandez-Corugedo, 2018).

Japan is a country at the leading edge of this demographic change, as total population growth
has turned negative since 2011 (Figure 1). 2 Another dimension of Japan’s demographic
challenge is its aging population. The old age dependency ratio (measured as a share of the
old-age population over the working-age population) has been on the rise: the ratio exceeded
40 percent in 2014 and is expected to accelerate, reaching above 70 percent in the next 50 years
(IMF 2017; Shirakawa 2012).

 Figure 1. Japan’s Population and its Age-group Composition

Interestingly, how the demographic transition has unfolded varies greatly across regions in
Japan. Population is declining in most prefectures due to low fertility rate and outbound
migration to large cities, while population is growing in key major cities with inbound
migration, contributing to an increase in population concentration in large cities. As a result,
Japan will likely become a highly polarized country in terms of population concentration. At
the same time, the on-going population dynamics have affected the housing supply and demand
dynamics differentially across regions. For instance, the declining population in rural areas has

2
 Source: National Institute of Population and Social Security Research, based on the medium-variant fertility and
medium-variant mortality projection. http://www.ipss.go.jp/pp-newest/e/ppfj02/suikei_g_e.html
5

generated empty houses (akiya) across the country, particularly in rural areas, which, by some
estimates, will rise to comprise as much as one third of total houses by 2033.

Against this backdrop, in this paper we focus on the regional differences in population
dynamics and analyze how demographic changes have influenced house prices in Japan. Using
the data on residential land price as a proxy for house prices and population by prefectures (our
unit of a ‘region’) from 1975, we address the following four questions:

• What has been the pattern of prefecture-level population dynamics in Japan in the last forty
 years?

• During this time, how have residential house prices evolved over time in Japan and by
 prefecture?

• How important is the demographic factor as a driver of house price dynamics in Japan?
 Has the relationship between demographics and house prices evolved over time?

• What are the potential policy implications?

First, we observe a stark difference in the demographic transition between urban areas and
rural areas during this period. As early as the 1990s, a number of prefectures in rural areas have
demonstrated negative population growth. Over time, more prefectures joined the list. For
instance, in 1998, there were thirty-four prefectures (out of a total of forty-seven prefectures)
with negative population growth. Twenty years later, in 2017, the list had expanded to forty
prefectures. Seven prefectures that recorded positive population growth in 2017 are large cities,
four of which cover the Tokyo Metropolitan area—Tokyo-to, Saitama, Chiba and Kanagawa
prefectures. Three other prefectures with positive population growth are other major cities like
Osaka, Fukuoka and Nagoya. In sum, over time, Japan’s population density has become
polarized with higher concentration in urban areas.

Second, we observe that residential house prices in Japan declined steadily after the bubble
burst in the early 1990s. Since 2013, the downward trend has reversed with the advent of
Abenomics, as house prices stabilized, either with a mild increase in some prefectures or no
change in house prices in others. In fact, in some large cities and tourist destinations, a sharp
appreciation of condominium prices has even been observed.

Third, we find that there exists a positive correlation between population growth and house
prices—a 1 percent increase in population growth is associated with a 5 percentage points
increase in house prices. Furthermore, we find that this positive correlation embeds a non-
linear relationship between population growth and house price changes. Consistent with the
durable housing model (Glaeser and Gyourko (2005)), the magnitude of house price decreases
associated with population decline is larger than the magnitude of house price increases
associated with population increase of the same magnitude in absolute terms. 3 This non-linear

3
 The key intuition of Glaeser and Gyourko (2005) is that houses can be built quickly with increasing demand,
while they cannot disappear as fast with decreasing demand. This is because houses are quintessential durable
goods, implying that housing supply is elastic when the demand increases, but housing supply is inelastic with
 (continued…)
6

relationship is time-varying. Using the same data looking at just the last ten years, the positive
correlation between an increase in population and an increase in house prices has weakened,
although the positive correlation between negative population growth and the decline in house
prices remains.

Finally, our policy implications highlight the importance of policies to promote more even
growth across regions. For rural areas, this involves attracting and maintaining workers and
preventing over-supply of houses with declining populations. Rural prefectures that are not
able to attract people will face several economic challenges. If the so-called ‘brain drain’
intensifies in rural areas, population outflows will negatively affect productivity and economic
growth of regions, as high-skilled workers, the more mobile ones with attractive opportunities
outside of the region, are likely to leave. At the same time, if housing supply does not properly
adjust to declining population and over-supply is generated, downward pressures on house
prices will amplify the negative feedback loop between population growth and house prices.
Financial stability concerns could arise with deterioration of household and regional bank
balance sheets. On the other hand, prefectures with the risk of higher population concentration
need to have appropriate policies to address the distributional issues within the prefecture,
particularly those related to urban poverty.

The rest of the paper is organized as follows. Section II discusses Japan’s demographic trends,
highlighting significant regional differences. Section III discusses the development of housing
prices in Japan, while zeroing in on the Greater Tokyo-area. In Section IV, we analyze the
empirical relationship between population changes and housing price changes. Section V
discusses policy implications and Section VI concludes.

 II. DEMOGRAPHIC TRENDS IN JAPAN

 A. Population Change at Prefecture Level

In this section, we document the patterns of population dynamics across prefectures in Japan
since 1975. Figure 2 shows the distribution of prefecture-level population change in two
periods: from 1975 to 1990 and from 1990 to 2015. The leftward shift of the distribution of
prefecture-level population change over time suggests that a large number of prefectures that
exhibited population growth before 1990 experienced population decline since 1990.

Between 1975 and 1990, every prefecture in Japan except for two prefectures (Akita and
Nagasaki) experienced positive population growth, albeit at a different pace, shown by the
large dispersion of the distribution. During this period, the average population growth across
regions registered around 9 percent, with the median of 6.7 percent. However, starting from
1990, the number of prefectures with population declines rose sharply, as thirty prefectures out
of forty-seven experienced population declines. Prefectures that experienced the largest decline
in population are concentrated in Tohoku, Shikoku and Kyushu regions. For instance, in 1998,
there are thirteen prefectures with net positive population growth.

declining population. This generates a kinked supply curve which is highly elastic when prices are at or above
construction costs and highly inelastic otherwise.
7

 Figure 2. Kernel Density of Population Growth by Prefecture

 Source: Statistics Bureau, Japan and authors’ calculation.

The change in population dynamics—especially in areas that experienced a large decline in
population—cannot be explained solely by the natural population change (the numbers of
births and deaths). 4 Cross-prefecture net migrations, defined as population migration inflows
minus migration outflows, are important drivers of Japan’s prefecture-level population
dynamics. 5 Figure 3 depicts the rate of net migration into four major metropolitan areas since
1971, where the four metropolitan areas are defined as Tokyo, Osaka, Nagoya and Fukuoka.
Until 2007, all four regions showed positive change in net migration rate, implying that the
speed of inflows outpaced the speed of outflows. The mirror image of this trend is the negative
change of rate observed for the rest of Japan (in green) since the late 1990s. Since 2007, only
Tokyo-to (dotted orange line) and the Greater Tokyo Metropolitan area (solid orange line)
continue to show positive growth and the rate even picked up since 2012.

4
 According to Population Statistics Year 2019 (National Institute of Population and Social Security Research,
Japan), the number of births continued declining since 1973 (the peak was 2,091,983 in 1973), and it fell below
the number of deaths for the first time in around 2005. The births and deaths numbers in FY2017 were 946,065
and 1,340,397, respectively.
5
 In fact, internal migration contributes to population changes largely. For example, population changes due to
internal migration (outflows) accounted for half of population changes due to natural decrease in Tohoku area in
2017. In contrast, in prefectures such as Tokyo, Kanagawa, Chiba, Saitama, Aichi, and Fukuoka, percentage
change of population due to the natural increase was negative (births were lower than deaths), but the
percentage change of population due to net migration (inflows) was positive and exceeded the negative natural
population change. (Population Statistics Year 2019 (National Institute of Population and Social Security
Research, Japan)).
8

 Figure 3. Changes in Rate of Net-Migration in Four Major Metropolitan Areas

 Source: Statistics Bureau, Japan and IMF staff calculations.

This implies the intensification of population concentration in major cities and a polarization
of population density in Japan. Figure 4 shows the change in population concentration (and
loss) for each prefecture over the past twenty years. The concentration in Tokyo increased by
the largest amount (1.3 percent). On the other hand, other prefectures experienced a decline
in population concentration, with the largest decline observed for Hokkaido (-0.3 percent).
Only six prefectures recorded an increase in population concentration—Tokyo, Kanagawa,
Saitama, Hyogo, Shiga, and Fukuoka. These prefectures are either large cities or surrounding
(residential) areas of large cities (for instance, Shiga and Hyogo prefectures close to Osaka).

 Figure 4. Changes in Change in Prefecture-Level Concentration: 1996-2015

 Source: Statistics Bureau, Japan and IMF staff calculations.
9

We run the following regression, following Glaeser and Gyourko (2005), which suggests the
direction of population change and the speed of population change:

 ℎ (%) , = + , −1 + , −1 + ,

where i refers to prefecture and t refers to year. POPLOSS variable takes on a value of zero if
prefecture i’s population grew during the period t and equals prefecture’s actual percentage
decline in population if the prefecture lost population during the period. Similarly, POPGAIN
variable takes on a value of zero if prefecture i experienced population loss during the period
of t, and equals the actual population growth rate if the prefecture gained population.

Results are shown in Table 1. Columns (1) to (5) show results using different sample periods.
Columns (2) and (3) show the results using different samples before and after the asset bubble
burst in 1990. Column (4) represents the period when Japan’s total population increased, while
column (5) represents the sample when Japan’s total population began to decline.

Our results show a clear sign of polarization of population dynamics. The positive coefficients
for both population gains and losses across columns confirms the acceleration of population
inflows into already-concentrated prefectures and the population outflows from prefectures
with negative population growth. The relationship has changed over time, and more asymmetry
between population gain and population loss is observed for the most recent periods. During
the period between 1975 and 1990, a 1 percent population loss in the previous year is associated
with a 0.78 percent population decline in the current year, which is slightly larger than the
impact of population gains of 0.71 percent (column (2)). However, the caveat is that most of
the samples were experiencing positive population growth during this period. Columns (3)
through (5) suggest that the coefficients of population gain is higher than those of population
losses and such asymmetry is larger for the most recent periods: column (5), population gain
is more persistent with the population gain in ensuing period (0.77), than population loss
(0.17). This implies that concentration into prefectures with population gains is accelerating,
while population loss in the rest of prefectures are more gradual.

 Table 1. Speed of Population Change
10

 B. Japanese Households: Total Number and Composition

In this section, we document how the total number and the composition of Japanese
households has changed over time. Total population may not be a perfect proxy for housing
demand, especially in cases of high population mobility. For instance, when many young
people move to major cities for education and career opportunities, the number of households
may be a better measure of housing demand, rather than the total population. 6

Despite the declining population since 2011, the total number of households in Japan
continued to increase until 2016 and has since stabilized at around 53 million households.
According to the official projection by the National Institute of Population and Social
Security Research of Japan, the number of households will reach its peak in 2023, at around
54.2 million, and start a gradual decline n to around 50.8 million households by 2040, which
is slightly below the total household numbers in 2010.

 Figure 5. Households and Family Members

 Number of Households in Japan
 Households and family member numbers
 80,000,000 % change between 1970 and 2015

 70,000,000 One-person Nuclear family Other # Households Family members per household
 60,000,000

 50,000,000 Japan average -31.68 76.03
 40,000,000

 30,000,000
 Population concentrated area -28.20 115.60
 20,000,000

 10,000,000
 Other areas -31.89 18.31
 0
 1960 1980 1995 2010 2017 2020 2023 2026 2029 2032 2035 2038

 Source: Statistics Bureau of Japan

The increase of household numbers notwithstanding, the declining population reflects some
important changes in the composition and the size of Japanese households. In the old days, a
typical Japanese family would consist of “three-generation,” (grandparents, parents, and
children). Nowadays, a nuclear family consisting of two generations (parents and children) has
become the standard household.

Among households with persons aged 65 years and over, the share of “three generation” type
families declined dramatically, whereas the sum of one-person and couple-only increased to
exceed 50 percent (Figure 5, left side). On the other hand, average size of a family declined
steadily (Figure 5, right side), reflecting the increase in the share of nuclear and one-person
family. The decline in the number of family members per households was larger for rural areas

6
 In our empirical analysis, population is considered as the main variable for housing demand. The relationship
between households and population is reported in Annex A.
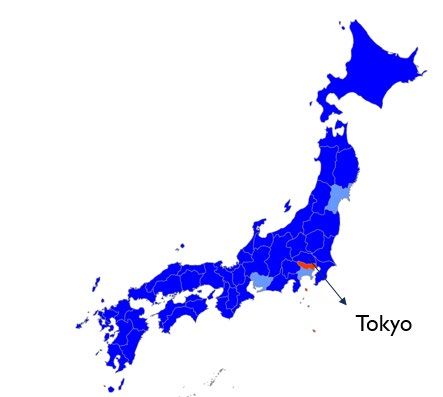
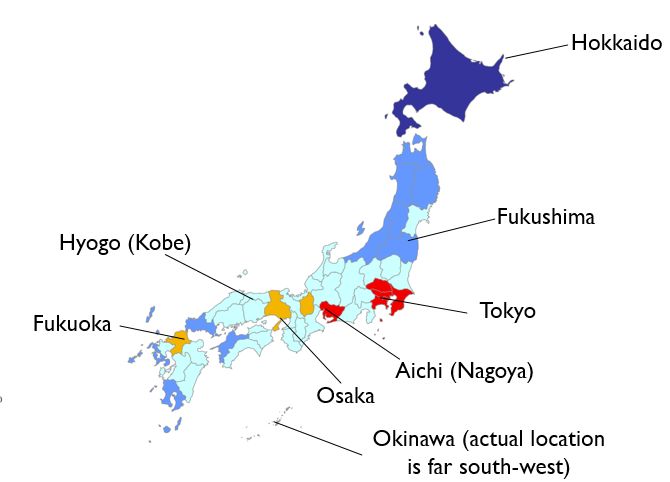
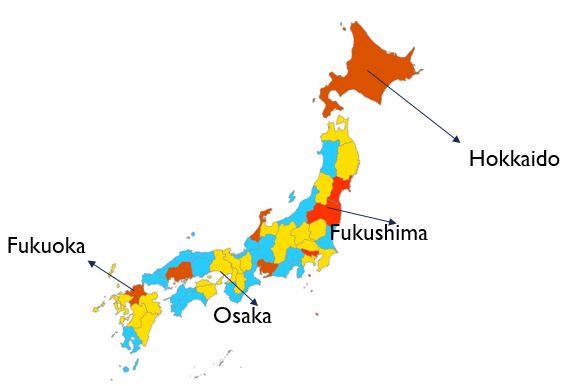
11

(-31.9 percent) compared to that in large cities (-28.2 percent). This reflect that younger
generations in family members left to other part of the same prefecture or moved out, whereas
older (parents) generation stayed in the prefecture. 7 In terms of the change in number of
households, we observe that major cities experienced a greater increase in the number of
household (115.6 percent) compared to other areas (18.3 percent).

 III. HOUSING PRICE DEVELOPMENTS IN JAPAN

In this section, we document the development of house prices in Japan, focusing on the
differences across regions and types of housing.

At the aggregate level, using the residential land price as a proxy for house prices, house prices
in Japan have experienced dramatic booms and busts. During the high growth periods with
economic expansion in the 1970s and 1980s, house prices in Japan steadily increased. Then,
the ‘Bubble Period’ in the late 1980s to early 1990s started. Since 1988, house price
appreciation intensified very rapidly, with an annual average increase of 20 percent. The
bubble burst in 1991, which was accompanied by a sharp fall in house prices. Since then, the
house price in Japan has been on a steady downward trend, except for a short period of a “Mini
bubble (2002-2008).” Since the beginning of Abenomics, price started to increase gradually
(increasing by 2.7 percent since 2014 and 0.7 percent in 2018). With the recent increase in
house prices, the current level recovered to the level in 2013. Annex B describes each period
in more details.

 Figure 6. Residential Land Price Trend in Japan
 Japan: Residential Land Price
 (yen/㎡, average across prefectures, public assessment value)
 180,000

 160,000

 140,000

 120,000

 100,000

 80,000

 60,000

 40,000

 20,000

 0
 1975 1979 1983 1987 1991 1995 1999 2003 2007 2011 2015

 Sources: Ministry of Land, Infrastructure, Transport and Tourism

 Source: Ministry of Land, Infrastructure, Transport and Tourism.

 A. House Price Changes Across Prefectures

How have house prices evolved in different prefectures? Figure 7 shows the growth rate of
house prices by prefecture using different time periods. The map on the left shows cumulative
price changes between 2002 and 2018. It shows that compared to the level of house prices in
2002, all prefectures, except for Tokyo, experienced a decline in house prices (from -5 to -15

7
 Elderly dependency ratio is significantly lower in large cities and higher in rural areas.
12

percent). By contrast, the map on the right shows cumulative house price changes since 2014
by prefecture. Compared to the map on the left, numerous prefectures experienced house price
appreciations in recent years, an average 1.9 percent nationwide since 2013. The magnitude of
price change, however, varies greatly across prefectures: greatest gains seen in Miyagi,
Fukushima by 18 percent (due to the low base effects related to the earthquake), Tokyo (16
percent) while losses have been recorded in Akita (-6.5 percent), Shimane (-5.5 percent) and
Yamanashi (-4.8 percent). In general, house prices in large cities and tourist destinations
exhibited price appreciations, especially led by constructions of condominiums. This could be
due to various factors including construction booms prior to the Tokyo Olympics scheduled
originally in 2020 and demand for high investment returns in a prolonged low-interest rate
environment, among other factors. For example, Hokkaido has attracted domestic and
international investment in skiing resorts, which has driven up commercial land price by 60%
in 2018 and residential land prices as well.

 Figure 7. Housing Price Change Over Time by Prefecture (in percent)

 B. House Price Changes by Housing Type

Expanding on the recent house price developments depicted in the right map of figure 7, in this
section, we assess an important aspect of recent house price developments, which is a large
dispersion of price changes across different types of housings. In sum, condominium prices
experienced a steeper price appreciation compared to detached houses, particularly in large
metropolitan areas. Condominium prices have increased by 23 percent at the national level
since 2013. In particular, condominium prices in Tokyo increased by 45 percent since 2013. 8
For detached houses, by contract, the increase was only 4.2 percent since 2013 (Figure 8).

8
 IMF (2017) concluded that condominium prices appear to be moderately overvalued in Tokyo, Osaka, and
several outer regions, exceeding the values predicted by fundamentals by 5 to 10 percent.
13

 Figure 8. Housing Price Movements by Property Types

 Japan: Residential Property Price Index Condominimum Prices
 (2010=100, NSA) (2010=100, NSA)
 150 220
 Residential Property
 140 200 Tokyo including suburbs Osaka including suburbs
 Residential Land
 130 Detached House Hokkaido Tohoku
 180 Kyushu-Okinawa Japan (nationwide)
 Condominiums
 120
 160
 110

 100 140

 90 120

 80
 100
 2008 - Apr

 2009 - Apr

 2010 - Apr

 2011 - Apr

 2012 - Apr

 2013 - Apr

 2014 - Apr

 2015 - Apr

 2016 - Apr

 2017 - Apr

 2018 - Apr
 80
 Apr-08 Jun-09 Aug-10 Oct-11 Dec-12 Feb-14 Apr-15 Jun-16

 Sources: Ministry of Land, Infrastructure, Transport and Tourism Sources: Ministry of Land, Infrastructure, Transport and Tourism

 Source: Ministry of Land, Infrastructure, Transport and Tourism.

Some key drivers behind the steep rise in condominium prices include: (1) wealthy households
investing in high-rise condominiums for inheritance tax avoidance purposes; (2) search-for-
yield motive by financial institutions and individuals in low-interest environment created by
aggressive monetary easing; and (3) an increase in foreign investors.

• Tax incentives: The inheritance tax assessment for residential properties is done separately
 for land and for dwellings. Land assessment is based on the portion of holdings of land. As
 a result, the tax on land is likely to be smaller for higher dwelling buildings with more
 residents (such as high-rise condominium buildings), and tax assessment value becomes
 smaller for owners of condominiums. In addition, assessed value of dwellings
 (condominium units and houses) is usually lower than market value, providing incentives
 for the owners to leave real estate for investments in alternative financial assets (see Annex
 C for more details).

• High investment returns: Among different types of housing, condominiums have enjoyed
 the largest price appreciation due to several reasons. First, the secondary market for
 condominiums is relatively well developed than that for detached houses, therefore the
 market is stable and deep in the sense that it is easy to transact condominiums in Tokyo
 metropolitan areas. Second, the added benefit of owning condominiums is that
 condominiums could be easily rented out. Finally, with the expectation that condominium
 prices will rise further, returns from investment in condominiums are in general much
 higher than the real rates. 9

• Foreign investment: Foreign investors have invested aggressively in certain segments of
 the Japanese real estate market since 2016. As shown in Figure 9, transaction volume of

9
 According to Japan Real Estate Institute projections (May 2019) on prices and rents of new condominiums in
Tokyo’s 23 wards, prices are expected to continue rising until 2020 and start to decline afterwards. Rents are
projected to continue a very marginal but gradual increase until 2025.
14

 the Japanese real estate investment trust (J-REIT) has been steadily increasing since 2014,
 and the market has attracted international investors. The total acquisition of commercial
 real estate by foreign investors reached approximately ¥680 billion in the second half of
 2017, the second highest after slightly above ¥800 billion recorded in the first half of 2007.

 Figure 9. Institutional Investment in J-REIT

 REIT trading volume by institutions: purchases REIT trading volume by institutions: sales
 (NSA, thousands units) (NSA, thousands units)
 4000 4000
 Institutions Individuals Institutions Individuals
 3500 3500
 Foreigners Securities companies Foreigners Securities Companies
 3000 3000

 2500 2500

 2000 2000

 1500 1500

 1000 1000

 500 500

 0 0

 2010-Feb

 2010-Dec

 2015-Feb

 2015-Dec
 2008-Nov

 2013-Nov

 2018-Nov
 2009-Apr

 2014-Apr
 2008-Jan

 2013-Jan

 2018-Jan
 2008-Jun

 2013-Jun

 2018-Jun
 2011-May

 2016-May
 2010-Jul

 2012-Mar

 2015-Jul

 2017-Mar
 2012-Aug

 2017-Aug
 2009-Sep

 2014-Sep
 2011-Oct

 2016-Oct
 2010-Feb

 2010-Dec

 2015-Feb

 2015-Dec
 2008-Nov

 2013-Nov

 2018-Nov
 2009-Apr

 2014-Apr
 2008-Jan

 2013-Jan

 2018-Jan
 2008-Jun

 2013-Jun

 2018-Jun
 2011-May

 2016-May
 2010-Jul

 2012-Mar

 2015-Jul

 2017-Mar
 2012-Aug

 2017-Aug
 2009-Sep

 2014-Sep
 2011-Oct

 2016-Oct

 Source: Haver Analytics.

 C. Tokyo Story

Tokyo and its surrounding prefectures stand out in terms of population flows and housing price
changes, which shows the opposite trend relative to all other prefectures in Japan. Why is
Tokyo special?

The trend of population concentration to Tokyo and other urban cities in the Tokyo
Metropolitan area has continued and, in some sense, have even accelerated, despite the
population decline in Japan. In fact, population migration to Tokyo never ceased. 10 In terms of
house prices, Tokyo is the only region where land house price increased despite the bubble
crash as shown in Figure 7. Indeed, housing demand seems to have exceeded supply in Tokyo.
Figure 10 shows the housing start and vacancy rates by prefectures to proxy for the relative
supply and demand for houses. As expected, housing start is highly correlated with population
and Tokyo has the highest number of housing start. At the same time, vacancy rate is low in
Tokyo, suggesting high demand for houses.

10
 RIETI Policy Discussion paper Series 19-P-006 (in Japanese) discusses regional-urban discrepancy and
migration across prefectures.
15

 Figure 10. Supply and Demand in Tokyo Housing Market

 Housing Start and Population Vacancy Rate and Population
 (Unit: housing start in number of constructions, population in thousands) (Unit: vacancy rate in percent, population in thousands)
 160000 25

 140000 Tokyo-to Yamanashi-ken
 20 Nagano-ken
 120000
 Shizuoka-ken
 100000 15 Hokkaido Chiba-ken Osaka-fu
 Aichi-ken Aomori-ken
 80000 Kanagawa-ken Kanagawa-ken
 Niigata-ken Saitama-ken Tokyo
 Osaka-fu 10
 60000 Fukuoka-ken Saitama-ken Kyoto-fu Hyogo-ken Aichi-ken
 40000 Fukuoka-ken
 Fukushima-ken Hokkaido Akita-ken
 Chiba-ken 5
 20000
 Hyogo-ken
 Aomori-ken
 0 0
 0 2000 4000 6000 8000 10000 12000 14000 16000 0 2000 4000 6000 8000 10000 12000 14000

 Sources: Cabinet Office, Ministry of Land, Infrastructure, Transport, and Touris Sources: Cabinet Office, Ministry of Land, Infrastructure, Transport, and Tourism

Inbound migration to the Tokyo area is an important demand side factor. Agglomeration of
businesses contributes to an increase in commercial property prices, which in turn pushes up
residential property prices. Another channel that contributes to an upward pressure of house
prices is the higher income offered in large cities, which increases the affordability of house.

Supply-side factors could also explain the price increase in Tokyo, which includes the
increased supply of new condominiums, whose prices rose more steeply compared to other
types of housing, as we discussed in the previous section. There may be various reasons
underlying the increased number of constructions of new condominiums:

• Market Structure of Condominium Developers. Recently, there has been an increase in the
 market share by major developers in Tokyo area. The market share of major seven
 developers in the number of condominium sales was relatively stable at about 20 percent
 until 2007. Since then, it increased to close to 50 percent in 2017. 11 It implies that the
 housing price is more sensitive to the supply decisions of condominiums by these major
 market players. As the developers have the incentive to raise prices and control supply to
 support prices, this increases the likelihood that housing (condominium) prices will remain
 elevated. In fact, Figure 11 shows a reverse relationship between condominium prices and
 the supply of newly-built condominiums in the Tokyo metropolitan area. 12

11
 Japan Real Estate Institute, Market Report, 2017H2.
12
 Historical monthly data of new condominium prices of Tokyo and Osaka (Land Institute of Japan Co.) reveal
that new condominium prices in Tokyo are approaching those at the peak of the bubble in 1989, whereas it is not
the case for other urban areas. For example, new condominium prices in Osaka metropolitan area have been
relatively stable and never recovered to the bubble-era level as yet.
16

• Tourism. Increased construction activities related to tourism: Tokyo has enjoyed a large
 inflow of tourists (see Nguyen 2020). The expectations of the 2020 Summer Olympics 13
 spurred expectations for economic booms in Tokyo metropolitan area.

 Figure 11. Tokyo Metropolitan Area: New Condominium Supply and Prices

 New condo price (10 thousand of yen)
 Units of new condo put on the market (right-axis)
 7000 14,000

 6500 12,000

 6000 10,000

 5500 8,000

 5000 6,000

 4500 4,000

 4000 2,000

 3500 0
 1996m12
 1997m11
 1998m10

 2007m12
 2008m11
 2009m10

 2018m12
 1995m2
 1996m1

 1999m9
 2000m8
 2001m7
 2002m6
 2003m5
 2004m4
 2005m3
 2006m2
 2007m1

 2010m9
 2011m8
 2012m7
 2013m6
 2014m5
 2015m4
 2016m3
 2017m2
 2018m1
 Source: Land Institute of Japan Co.

In addition to demand and supply factors, there are other drivers that encourage activities in
the real estate market in general.

• Low interest rate environment. The ultra-low interest rate policy by the Bank of Japan
 along with relatively low returns from equity and other financial markets boosted
 investment in real estate that has generated higher returns. Low mortgage rates helped spur
 demand for houses, reflecting population migrations into Tokyo and other urban areas
 whereas rural regional areas struggled with sluggish recovery after the collapse of the
 bubble.

• Inheritance tax incentives. As mentioned in the previous section, the inheritance tax
 incentives have contributed for an increased demand for condominiums (Annex C for more
 details).

 In March 2020, the postponement of the Tokyo Olympics by one year was officially announced, due to the
13

COVID-19 pandemic.
17

 IV. MODELING POPULATION GROWTH AND HOUSING PRICES

In this section, we establish an empirical relationship between population change and housing
price changes in Japan. 14 Our analysis will focus on the sample from 1975 to understand the
long-term and stable relationship between the two variables, rather than focusing on most
recent developments.

 A. Theoretical Framework

Conceptually, a simple demand and supply model of housing market describes that a shrinking
and declining population would lead to lower house prices—the excess supply of houses due
to sales by elderly people exceeds the demand for houses by young working generation. In
Japan, due to a population decline and aging in many areas, the downward pressure on a
demand curve should be large and the supply curve may shift rightward due to an increase in
sales by elderly. The shrinking population should have added a further downward trend on
house prices, on top of the low-growth period after the burst of the bubble economy in early
1990s (Kobayashi 2016).

The theoretical underpinning of this section is the durable housing model by Glaeser and
Gyourko (2005). The key insight is that the sensitivity of house prices changes to population
change is asymmetric – population loss is accompanied by a larger decline in housing prices
than the size of housing price increase with the same size of population increase. This is due
to the durability of housing, whereby housing supply is elastic when new houses are built,
while inelastic when houses need to be destroyed.

As a result, due to the durability of housing, the supply curve of housing is kinked: it is
(relatively) easy to construct, but once constructed, it is not easy to reduce (or demolish) due
to construction costs. An increase in population will be associated with house price increases,
because demand for houses should rise. On the other hand, a decline in population, therefore a
decline in demand for houses, will be associated with declining housing prices (Figure 12).
The point of the durable housing model is that the impact of demand on the increase and
decrease of prices are not symmetry: an increase in house price driven by increased demand is
small as the supply adjusts elastically, while the decrease in house price driven by decreased
demand is larger as the supply does not adjust elastically.

14
 Several studies that focused on the supply-side of housing market show that the number of houses provided is
highly correlated with population growth as people naturally demand places to live. The correlation coefficient
between log changes in housing units and population exceeds 0.9, according to U.S. data (Glaeser and Gyourko,
2005). In Japan, a similar observation can be made where house ownership increased during the baby boom
generation period (see Saita, Shimizu, Watanabe (2013)).
18

 Figure 12. Nonlinear Relationship between Population Growth and House Price Changes

Case A: Large cities (Tokyo): Net inflows of population increase demand for houses, and house
prices increase (P1). An upward shift in the supply curve leads to an increase in housing prices (P2).

 P: housing price

 D2

 D1 S2
 P2 S1
 P1
 P*

 Q

Case B: Rural areas: Population outflow lowers the demand for houses, and prices fall (P1). The
supply of houses increases due to sales by owners who move out from the region, putting further
downward pressure on house prices (P2).

 P: housing price

 D1 S1

 D2 S2
 P*

 P1
 P2
 Q

 B. Empirical Analysis

Following Glaeser and Gyourko (2005), as explained in the previous subsection, we look at a
non-linear relationship between housing price and population change in Japan. That non-
linearity is the difference in sensitivity between price changes and population growth,
depending on population gain or population loss. Figure 13 depicts a simple correlation
between the changes in house prices and net migration flows across regions over the last twenty
years (orange line). The dotted red line represents the fitted line excluding Tokyo. The actual
house price in Tokyo is well below what would have been predicted by the dotted red line.
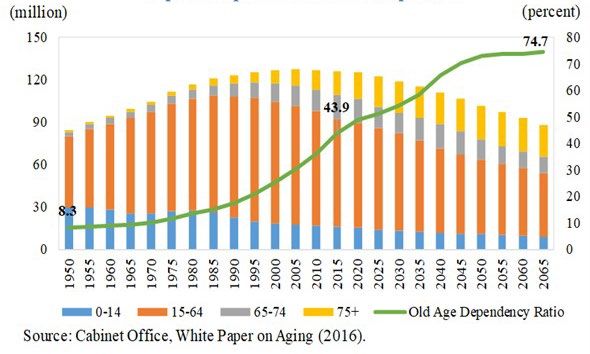
19

 Figure 13. Changes in House Price and Net Migration Flows (1996-2018)

 Sources: Ministry of Land, Infrastructure, Transport and Tourism; IMF staff calculations

With this background, our baseline regression specification is as follows:

 ∆ , = + , −1 + , −1 + ,

where P is the publicly assessed residential land price adjusted for inflation (in ¥/m2) as a proxy
for housing price; POPLOSS variable takes on a value of zero if prefecture i’s population grew
during the period t and equals prefecture’s actual percentage decline in population if the
prefecture lost population during the period. Similarly, POPGAIN variable takes on a value of
zero if prefecture i experienced population loss during the period of t, and equals the actual
population growth rate if the prefecture gained population. The expected signs of coefficients
of β and γ are positive, and that β > γ. This implies that for a price decline is bigger (β) for a
given loss of population (POPLOSS 0). In order to account for the lagged impact of population on housing
price, we use POPLOSS and POPGAIN of t-1 in the regressions.

For the robustness check, we test the following two baselines with additional controls:

 ∆ , = + , −1 + , −1 + ∆ , −1 + ,

 ∆ , = + , −1 + , −1 + ∆ , −1
 + ∆ , −1 + ,

The following table show regression results based on panel data of the annual change in
population and real land price across three different time periods: (i) 1975-2015, (ii) past two
decades since the collapse of the asset bubble, covering 1996-2015; and (iii) more recent
periods over 2010-2015 (Table 2).
20

Results show that during 1975-2015 (column 1), the estimated coefficient for population loss
is higher than that of population gain, confirming the prediction by Glaeser and Gyourko
(2005) that housing price falls faster with declining population than it increases with increasing
population. However, in more recent periods, while the correlation between house price decline
and population decline stays robust, the relationship between house price increase and
population increase disappears. This confirms the overall decline in housing prices across
regions since the bubble burst, regardless of population growth.

In reality, negative effects on housing prices from population decline may be even larger than
model predictions. The results suggest a larger decline in housing price associated with
population loss than a housing price increase with the same size of population gain. Given the
shrinking population in many prefectures, a further housing price decline could be a medium-
and long-term trend. The linkage between population loss and a housing price decline could
lead to a vicious cycle—residents expecting a housing price decline may sell their houses and
have less incentives to own houses, which will add to already-existing oversupply for houses
and create further downward pressures on housing prices.

 Table 2. House Price Changes and Population Change

 V. POLICY IMPLICATIONS

The empirical finding on the non-linear relationship between population changes and house
prices imply that house prices in Japan for most regions are on a downward trend, in line with
shrinking population. The downward trend of house prices is expected to incur negative
impacts on many sectors of the economy. For example, households’ financial and non-financial
assets would be affected negatively due to a decline in house prices. For financial institutions,
house price declines significantly affect their holdings of collateral values. This would add
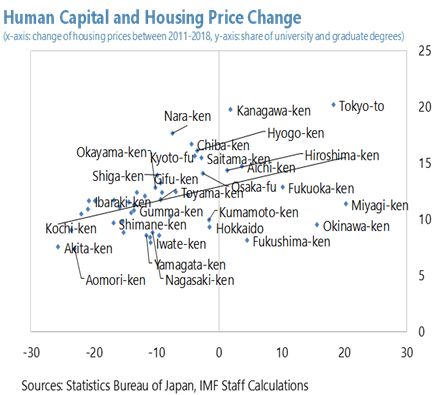
21

more burden on those already suffering from declining profitability of the industry. House
price declines directly affect local governments by reductions in tax revenue from housing
transactions. It would produce the second-round effect, quality and quantity of social spending
in the area. This might accelerate population outflows, which further exacerbates the housing
market and prices. This also raises an important underlying issue: why people are moving to
large cities in Japan?

In this section, we first discuss the possible root causes of migration flows across prefectures
that have contributed to the polarization of population concentration in Japan. Then we discuss
the potential implication of house price declines on household sector by focusing on balance
sheet effects. Finally, we discuss policy measures to tackle with potential overinvestment for
housing supply in shrinking and uneven population dynamics and local government
challenges.

 A. Why Move to Large Cities?

One of the key issues facing most of the prefectures in Japan, except for some major cities, is
the brain drain that comes with population outflows. With the aging population, rural regions
of Japan are experiencing outbound migrants to larger cities who leave their towns and cities
for better education and job opportunities. Availability of city amenities, such as numbers of
colleges and universities, hospitals and other facilities, is incomparably higher in major cities. 15
These factors are one of root causes of the regional disparities in population dynamics and the
continuous inflows of population into large cities from rural areas.

Population migration into large cities, especially by the young generation, affects the housing
market through the channel of human capital accumulation in the region. There exists a large
variation across prefectures in terms of the share of population with higher education – for
prefectures such as Akita and Aomori, the share of population with university degrees or
higher make up of about 5 percent of the population. This contrasts with Tokyo or Kanagawa
(a prefecture in the suburb of Tokyo) that has close to 20 percent of its total population with
higher education (university degree or above).

15
 For example, the number of general hospitals per 100,000 persons is more or less the same across prefectures,
although the numbers are higher in Shikoku and Kyushu areas (Japan average is 5.8). However, the number of
general hospitals per 100 km-sq of inhabitable area varies largely across prefectures. The numbers in broader
Tokyo and Osaka areas are seven times larger than Japan’s overage of 6.0. The lowest three are found in Iwate
(2.1), Akita (1.7), and Yamagata (1.9). Data are as of 2016, from social indicators by prefecture, Ministry of
Internal Affairs and Communications.
22

 Figure 14. Education and House Prices

A. Number of Colleges and Universities by B. Human Capital and Housing Price Changes
Prefecture

Sources: Statistics Bureau of Japan, IMF Staff calculations

 Figure 14 shows that there is a positive correlation between housing price changes and the
 share of educated population. This may reflect a higher affordability with workers in the
 cities with higher income. Some studies show that skilled workers are better generating
 growth in endogenous amenities, increasing the value of price (Shapiro, 2006; Glaeser and
 Saiz, 2004). In any case, brain drain could exacerbate the regional disparities in terms of
 growth and welfare, and therefore housing price dynamics.

 B. Implications for Household Balance Sheets

 House prices have an important role in household wealth through house ownership in Japan.
 According to the National Survey of Family Income and Expenditure of 2014, dwelling related
 liabilities (purchase of house and/or land) consists of about 75 to 90 percent of total household
 liabilities. Therefore, changes in housing prices have important implications on household
 wealth – a collapse of housing price leads to a deterioration of households’ net wealth (both
 net financial and nonfinancial assets), whereas their financial liabilities are less affected.

 Households in different regions of Japan may be affected differentially, as house price
 dynamics vary across regions. For instance, if rural prefectures of Japan experience a larger
 decline in housing prices compared to metropolitan areas, the value of nonfinancial asset for
 households in rural areas becomes much lower for house owners. In other words, the
 households balance sheet is more severely affected for households in rural areas than those in
 urban areas. This may lead to wealth inequality between urban and rural areas.
23

Looking at historical experience, the household balance sheet was negatively affected during
the periods after the bubble crash, when the housing price was on a declining path. Figure 15
suggests that household balance sheets were affected largely from a huge decline in the land
value during the low-growth period. The decline in the land value more than offset an
increase in the balance of net financial assets of households between 1994 and 2017. 16
Unfortunately prefectural-level data comparisons are not available: however, we can easily
assume that balance sheets of households in rural areas should be affected more severely than
those in large cities, given larger land (and house) price declines in rural areas, whereas there
are likely more even changes in net financial assets (for example, stock prices) across
regions.

Assume that financial assets in households balance sheets are equally affected across Japan,
then negative impacts from the nonfinancial asset pose a larger burden on households in
population declining prefectures. Since houses and lands are one of assets inherited inter-
generationally, house price declines imply that inequality could transmit intergenerationally,
and inequality could expand through house price declines. 17

 Figure 15. Change in Household Balance Sheet Values 1994-2017 (Trillion Yen)

 Source: The Cabinet Office, Government of Japan, Economic and Social Research Institute (ESRI), and
 IMF staff calculations. The household sector includes Private Unincorporated Enterprises (NPISH).

16
 Similar data from the OECD on financial and non-financial asset sectoral data is available only up to 2013.
There is a minor difference in the household sector coverage: the CAO (the Cabinet Office) data include private
unincorporated enterprises in addition to households, whereas OECD data are of households only. Comparisons
between CAO and OECD data using data samples from 1995 to 2013 are almost identical, with a minor difference
in changes in the net financial asset value: which may reflect valuation changes of private enterprises’ asset
valuation. The decline in the land value as well as nonfinancial assets are quite similar between the two data
sources.
17
 In fact, a U.S. study shows that the size distribution of direct financial transfer is highly skewed and affects
intergenerational redistribution. A counterfactual experiment where inheritances and inter vivos transfers are
equally distributed across the population shows that the top 10 percent of families sorted by wealth would
actually hold 40 percent of wealth, which is close to a half of 73 percent of the wealth actually owned by these
10 percent families in 2016. (FEDS Notes, June 01, 2018).
24

 C. Overinvestment and Housing Market Policy

One of the issues of housing market in rural areas of Japan experiencing population outflows
is the over-supply of houses: that is, house supply does not decline to a level which clears the
demand for houses and stabilizes house prices.

Weakening demand for houses (in general, with regional divergence) while continuing supply
of new houses (especially in large cities) has generated an increasing number of
abandoned/vacant houses (akiya) across regions. The number of vacant/abandoned houses and
the vacancy rate of them have increased in the past decades and reached their historical highs
of approximately 8.5million houses throughout the country and 13.6 percent (Japan average)
in 2018, respectively. 18 Prefectures with a high ratio of akiya match those with large population
outflows, which include Yamanashi (21.3 percent), Wakayama (20.3 percent), Nagano (19.5
percent), Tokushima (19.4 percent) and Kouchi (18.9 percent) (in Shikoku Island), and
Kagoshima (18.9 percent) (in Kyushu Island). In contrast, the vacancy rate is lower in
prefectures such as Tokyo, Kanagawa and Aichi.

There are several reasons behind the continued supply of new houses even though vacant
houses are generated. For instance,

• Secondary market for detached houses is not well-developed and active. There are
 several factors that hamper the development of the secondary market that contribute to
 low transactions of used and vacant houses. One is people’s preference for “newly built”
 over used houses. Tax treatments—such as conditions for income tax deductions on
 mortgage loans and fixed pro—are more favorable for newly built houses. Lack of ability
 to properly assess used house values hampers to determine accurate collateral values of
 the property. This leads to lenders (banks) become more reluctant to make loans and
 buyers may not be able to have enough access to a mortgage.

• Property tax issues. Vacant houses have not been demolished, because the tax assessment
 for detached houses or any building structure (plus land) was much lower than that for
 the land only. Therefore, there was no incentive to demolish houses, unless the owners
 have plans to sell the land and the building altogether (Annex C). 19

Recognizing problems related to vacant houses, a new law was introduced in May 2015
(“Akiya Taisaku Tokubetsu Sochi Hou”, Vacant Houses Special Measures Act; official
announcement in November 2014). The law aims to provide local/municipal governments

18
 Ministry of Internal Affairs and Communications, 2018 Survey.
19
 Property tax is charged on the land and structures at 1.4% of the taxable base. There is an exceptional
treatment for small residential properties wherein the taxable base on the land is reduced to one sixth of the
appraised value if there remains a residential structure on it (the background for this is to accelerate the high
utilization of land by giving an incentive to home construction). This was cited as one of the causes of the high
vacancy rate in Japan because, even after the property is not occupied and had better be demolished, the owner
of the property had an incentive to leave the property as it is to enjoy a lower property tax rate. To remove such
poor housing stock, new legislation was enacted in 2015 to accelerate the removal of such vacant houses.
25

legal powers to help them deal with abandoned houses. 20 Several actions to tear down
unoccupied and dangerous houses have been taken, although the progress has been very
slow. In addition, Ministry of Land, Infrastructure, Transport and Tourism (MLIT) launched
a web-based system to provide information of “for sale” and “for rent” of public assets. 21
These are attempts to facilitate and activate use of public assets in face of large fiscal deficits
at the local government level: however, it does not cover abandoned houses and buildings in
private sector. Going forward, there needs a holistic policy strategy— including urban
planning, precise projections on supply of and demand for houses, mortgage and other real
estate-related regulations, tax policies, and even private-public partnerships—are needed to
make the best use of non-used investment assets.

 VI. CONCLUSION

In this paper, we study regional differences in population dynamics and try to understand
how demographic changes influence housing market prices in Japan.

First, we document how demographic trends and housing prices have evolved over time in
Japan across regions. We found that demographic trends are important underlying factors
behind the growing regional dispersion. Different regions in Japan are experiencing
demographic transition at a different pace. That is, while population is declining in most
prefectures due to a low fertility rate and outbound migration, population is growing in key
major cities and surrounding regions with inbound migration, contributing to a large disparity
in population concentration across regions. At the same time, housing prices have declined
persistently across regions since the early 1990s, after the bursting of the bubble. The speed
and rate of declines, however, exhibit regional disparities—larger cities experienced
relatively smaller price declines than other regions. Only Tokyo (and a broader area of
Tokyo) experienced an early recovery from the continued price fall—due to factors such as
condominium construction booms and investment expectations related to the 2020 Tokyo
Olympics. After 2014, finally, numerous prefectures experienced the first housing price
appreciation since the beginning of Abenomics.

Second, we ask to what extent demographic trends are drivers of housing price dynamics in
Japan. Our empirical analysis based on prefectural-level data shows that there exists an
asymmetric relationship between changes in housing prices and population growth—housing
prices fall faster with a declining population than it rises with an increasing population. This
result proves the durability of housing, that is, once a house is constructed, it is not easy to
demolish. Prefectures that suffer from population outflows suffer a large(r) decline in

20
 Empty and abandoned houses that may pose health and/or physical danger risks to the community are
categorized as “specially designated vacant houses.” The new law allows municipal officials to order the
demolition of these houses. In principle, the authorities can request the owners to eliminate the risk sources, and
demolish the houses if owners refuse. However, there are strict procedures to follow, and there were concerns
that the legislation is not enough to address the problems.
21
 The public assets include old school buildings, government dormitories, and publicly held lands. The
websites are managed by two private companies, Lifull Co., Ltd. and AtHome Co., Ltd. The MLIT also
organizes a separate platform to provide information provision on public real-estate on their website, (Japanese
only), at http://www.mlit.go.jp/totikensangyo/totikensangyo_tk5_000102.html.
You can also read