Aging and Urban House Prices - Dis cus si on Paper No. 15-024 Norbert Hiller and Oliver W. Lerbs - MADOC
←
→
Page content transcription
If your browser does not render page correctly, please read the page content below
Discussion Paper No. 15-024 Aging and Urban House Prices Norbert Hiller and Oliver W. Lerbs
Discussion Paper No. 15-024 Aging and Urban House Prices Norbert Hiller and Oliver W. Lerbs Download this ZEW Discussion Paper from our ftp server: http://ftp.zew.de/pub/zew-docs/dp/dp15024.pdf Die Discussion Papers dienen einer möglichst schnellen Verbreitung von neueren Forschungsarbeiten des ZEW. Die Beiträge liegen in alleiniger Verantwortung der Autoren und stellen nicht notwendigerweise die Meinung des ZEW dar. Discussion Papers are intended to make results of ZEW research promptly available to other economists in order to encourage discussion and suggestions for revisions. The authors are solely responsible for the contents which do not necessarily represent the opinion of the ZEW.
Aging and Urban House Prices

 Norbert Hillera*, Oliver W. Lerbsb†

 University of Münster
 a

 Centre for European Economic Research (ZEW), Mannheim
 b

 Abstract

 This paper investigates the long-run relationships between the size and age
 composition of a city’s population and the price of local housing. For esti-
 mation purposes, we combine city-level demographic information with hous-
 ing price data for 87 cities in Germany over the period 1995-2012. Employ-
 ing a panel error correction framework that accounts for the evolution of
 city income and other controls, we find that urban house prices perform
 stronger in cities that grow or age less rapidly. A combination of the empiri-
 cal estimates with current population projections suggests that population
 aging will exert considerable downward pressure on urban house prices in
 upcoming years.

 Keywords: Urban house prices ⋅ demographic change ⋅ Germany

 JEL classification: G12 ⋅ J11 ⋅ R31

*
 Correspondence: Institute for Spatial and Housing Economics, University of Münster, Phone: 0251-83-
22432, E-Mail: hiller@insiwo.de.
†
 Correspondence: Centre for European Economic Research (ZEW), Research Department of Interna-
tional Finance and Financial Management, Phone: 0621-1235-147, E-Mail: lerbs@zew.de.
Aging and Urban House Prices

1 Introduction

Housing is a dominant asset in the household portfolio of owners. At the same time, a
considerable proportion of housing capital in modern economies is concentrated in ur-
ban areas. 1 Wealth formation in the private sector is therefore closely associated with
the evolution of housing prices in the very same locations that lie at the heart of eco-
nomic activity (Rosenthal and Strange 2004). Since a substantial part of housing capi-
tal is debt-financed, unforeseen city house price developments can threaten household
net wealth and financial stability (Mian and Sufi 2009). The systemic relevance of ur-
ban house prices is further amplified by evidence that real house price changes in cities
tend to ripple out towards geographically adjacent regions (Meen 1999, Lee and Chien
2011).
 The aim of this paper is to empirically examine the hypothesis of a long-term equi-
librium relationship between urban house prices and the age structure and size of cities.
The housing market effects of demographic change have been a vital area of research
since the seminal paper of Mankiw and Weil (1989). Eichholtz and Lindenthal (2014)
recently provide microeconometric evidence that individual housing demand depends
heavily on demography and education. This supports earlier studies such as Green and
Hendershott (1996) or Ermisch (1996). Recent studies based on macro data also sug-
gest strong empirical links between housing prices and demography at both the nation-
al and regional level. Takáts (2012) finds that real house price growth in OECD coun-
tries over 1970-2009 was promoted by population growth, but depressed by an aging
population, ceteris paribus. 2 Saita et al. (2013) confirm these interrelated findings,
based on data for Japanese prefectures and US states over 1976-2010 and 1975-2011,
respectively. Their results suggest even stronger house price effects of demography. Es-
pecially for Japanese prefectures, the coefficients estimated on the age structure are
larger, while those estimated on total population are comparable to those found by
Takáts.
 Given that housing markets are local by nature, there is a striking paucity of studies
investigating the long-term housing price effects of demography using city data. 3 One

1
 The term “urban area” usually extends to cities, towns as well as larger conurbations. In this paper, we
refer to 87 German urban areas defined as administratively independent cities.
2
 Takáts’ favorite specification suggests the elasticity of real house prices with respect to total population
size to be 1.05, while the elasticity with respect to age structure (old age dependency ratio) is -0.68. Ac-
cording to these findings, the major directional shift in demographic change in the upcoming four dec-
ades is expected to decrease real OECD house prices by around 80 basis points per annum.
3
 Research based on local housing market data has concentrated on the short-run, cyclical behavior of
metropolitan housing prices. Some studies focus on transitory metropolitan house price bubbles (Gallin
2008, Goodman and Thibodeau 2008, Glaeser et al. 2008). Others focus on the time series properties of
city-level house price data (Capozza et al. 2002, Miller and Peng 2006). Another line of papers has con-
centrated on heterogeneity with regard to the reactions of city-level house prices to a monetary stimulus
or shocks to aggregate macroeconomic variables (Himmelberg et al. 2005, Carlino and DeFina 2008). Yet
 1
Aging and Urban House Prices

of the few exceptions is Maennig and Dust (2008), who study the quantitative relation-
ship between the 1992-2002 percentage change in population and single-family house
price levels in 98 German cities in 2002. Their analysis suggests no statistically signifi-
cant relationship between house prices and past population increases, whereas a decline
in population between 1992 and 2002 is associated with significantly lower 2002 price
levels. Since their analysis draws on cross-sectional price information only, they could
neither assess the long-term effects of gradual changes in population size, nor the long-
term effects of gradual shifts in a city’s age structure on local housing prices.
 We add to the existing literature with two main contributions. First, we estimate
long-run cointegration relationships between the main variables of interest in a city
panel error correction framework. For this purpose, we combine demographic infor-
mation with housing price data for 87 German cities over the period 1995-2012. In us-
ing German data, we can exploit an exceptionally large variation in demographic de-
velopments across local housing markets that help identifying their long-term price ef-
fects. Based on a combination of our econometric estimates with population forecasts
by official sources, we secondly provide probabilistic projections of demography-induced
price effects for each city until 2020. Projections are conditional on non-demographic
variables remaining constant. The availability of detailed local demographic projections
by official sources is another key advantage of using German data.
 Prior to estimating a reasonable econometric model, we argue theoretically that
along with changes in the number of households who demand housing services, changes
in the age structure of cities can substantially alter the demand for local housing ser-
vices and housing capital. We point out that long-term housing price reactions to these
demand changes depend on housing supply elasticity, which is implicitly reflected in
our empirical estimates. Our econometric results support the hypothesis that the devel-
opment of a city’s size and age structure over time is a fundamental determinant of
long-run real house price evolution. The probabilistic projections of future price trajec-
tories demonstrate that housing equity in many German cities is likely to face consid-
erable headwind from population aging in upcoming years. We argue that this result is
transferable to other countries with similar demographic prospects.
 The remainder of this paper is organized as follows. Section 2 reviews theoretical
hypotheses regarding the effects of urban demography on house prices. Section 3 intro-
duces the data set, discusses the panel stationarity properties of the data, and presents
key facts regarding past and expected future demographic developments in Germany.
Section 4 considers the econometric framework, presents the econometric results and
discusses probabilistic projections of future urban house prices. Section 5 concludes
with policy implications.

another strand investigates endogenous contagion and co-cyclicity among metropolitan housing prices
(Beenstock and Felsenstein 2010, Kuethe and Pede 2011, Brady 2011, Zhu et al. 2013).
 2
Aging and Urban House Prices

2 Theory of urban demography and house prices

Economic theory suggests at least three distinct channels through which gradual
changes in the total size and age composition of a city’s resident population affect local
house prices. The first channel is the effect of these demographic variables on the de-
mand for housing services. Along with incomes and preferences, the total number of
households residing in a city determines total demand for flows of housing services,
which in turn determines real house prices in interaction with available housing supply
(DiPasquale and Wheaton 1994). A change in average house prices due to a shift in
total household population can be labelled the size effect. In addition to the size effect,
household demand for housing services underlies a life cycle (Pitkin and Myers 1994,
Flavin and Yamashita 2002). Housing services demand is comparatively low during
schooling years, increases with labor market entry, peaks with starting and maintaining
a family and decreases again in retirement. 4 This can be labelled the age effect. Assum-
ing that the long-run city housing supply schedule is finitely elastic, the size effect sug-
gests that if the total number of households in a city increases, so do house prices. The
age effect suggests that real house prices decrease if the number of retirement age rela-
tive to working age individuals, in a city shifts upward.
 A second channel refers to the investment demand for owner-occupied housing as a
durable asset. Young households purchase urban housing capital as a conduit of saving
and retirement provision and dissolve (parts of) their housing assets to move to periph-
eral locations or to rent again in retirement (Henderson and Ioannides 1983, Kraft and
Munk 2011). An upward shift in the number of retirement age individuals relative to
working age individuals in a city thus implies a lower demand for investments in urban
owner-occupied housing. Again, the long-run price effects of this change to demand
depend on the price elasticity of housing supply. Different from housing services de-
mand, the effects of aging on investment demand and prices are intrinsically self-
reinforcing. That is, forward-looking home buyers most likely anticipate future price
declines caused by forthcoming increases in the ratio of sellers to buyers in the market.
Since lower expected real house price gains raise housing capital costs, this decreases
housing investment demand and prices today.
 A third, more subtle effect concerns the supply side of urban housing markets. Local
demography is unlikely to affect local construction costs, given that construction work-
ers, as well as other mobile inputs, can be hired from elsewhere. An essential produc-
tion factor that may however be affected by demography is the amount of land that is
made available for new local construction. Anticipating population decline and aging,
city planners may opt for tighter zoning to stabilize prices in the existing stock. Anoth-

4
 In the presence of borrowing constraints and other frictions, households face obstacles in smoothing
housing services consumption over the life cycle and will thus tend to purchase self-owned housing
(which often requires a down payment and high levels of creditworthiness) in later stages in life.
 3
Aging and Urban House Prices

er possibility is to remove excess housing through demolition. Both options were real-
ized at considerable scale in eastern German cities since reunification (Bernt 2009).
 Since we are interested in the long-term price effects of shifts to local demography,
our identification strategy relies on the assumption that city-level housing supply is
finitely elastic and price elasticity itself can be affected by local demography. The par-
tial elasticities of real urban house prices with respect to key demographic variables
then reflect the joint effect of these fundamentals on the demand for housing services,
the investment demand for housing capital, and the local land market.
 Based on the prior theoretical considerations, we define our baseline regression mod-
el as follows:

 = 0 + 1 + 2 + 3 + 4 + 5 + + (1)

 where is real house price in city at time period , is total household
population, is the proportion of retirement age to working age residents (the
old age dependency ratio) and is real average income per capita. In view of re-
cent empirical evidence that individual education is another key determinant of housing
services demand at the household level, we additionally include the number of city
workers with college degrees relative to those without any formal educational degree,
which we refer to as the city’s human capital ratio ( ). To account for changes in
housing financing costs over time, indicates the national mortgage interest rate in
year . The represent unobserved city-level effects, while is a disturbance term
with usual properties. We evaluate the empirical evidence in favor or against the accu-
racy of predictions based on theory relying on the statistical significance and economic
relevance of 1 and 2 .

3 Data
3.1 Data set
Our econometric analysis relies on a panel data set with 87 German cities on its cross-
sectional dimension and 18 years (1995-2012) on its time period dimension. In the liter-
ature, such data sets are commonly termed macro panels or time series panels. Panels
characterized by moderate group sizes and substantial time periods are often distin-
guished by panel heterogeneity and non-stationarity in the individual time series
(Banerjee 1999, Phillips and Moon 2000). Such data sets offer econometric opportuni-
ties that differ to a large degree from micro panels. Most notably, they enable flexible
dealing with dynamics and the identification of long-term equilibrium relationships
(Eberhardt and Teal 2011). However, the majority of empirical research based on time
series panels still implements micro panel methods. 5 In urban and regional economics,
the analysis of non-stationary time series panels with appropriate methods is still

5
 Time series panel data sets and the respective methods are traditionally more common in country-level
analysis.
 4
Aging and Urban House Prices

scarce. Apergis et al. (2010) investigate the regional relationship between corruption
and income. Beenstock and Felsenstein (2010) and Holly et al. (2010) are two examples
of analyzing regional house prices.
 Table 1 reports our variable definitions and data sources. As a representative meas-
ure of urban house prices, we use assessed typical repeat sales prices of owner-occupied
apartments of medium size, quality and location. 6 The price information relies on
standardized annual surveys among local brokers, appraisers and surveyors and is pro-
vided by the private consulting firm Bulwien Gesa. The same data is used for housing
market analysis by the German Bundesbank (Kajuth et al. 2013) and is widely respect-
ed as a valid indicator of spatially disaggregated house prices.7 The real house price in
city i at time period t is defined as the average price in EUR per square meter, correct-
ed for consumer price inflation in the same period.
Table 1. Variable definitions and sources
Variable Definition Source
Real house price Real resale apartment price in EUR per sqm BulwienGesa

Total household population Number of resident households in a city German Federal Institute for Research
 on Building, Urban Affairs and Spatial
 Development

Old age dependency ratio Ratio of retirement age (65 years or older) to German Regional Statistical Office
 working age (20-64 years) residents

Real income per capita Real GDP divided by number of employees German Federal Statistical Office (GDP)
 and German Federal Institute for
 Research on Building, Urban Affairs and
 Spatial Development (employees)

Human capital ratio Ratio of workers with college degree to German Federal Employment Office
 workers without formal educational degree

Real mortgage interest rate Average effective real interest on building German Bundesbank
 society mortgages

 As a measure of the local demand for housing services, we calculate annual city-level
household populations, combining time series on population obtained from the German

6
 Owner-occupied apartments can be considered as a specific type of housing in which urban households
in Germany are invested. In comparison to single-family or two-family houses, which are typically preva-
lent in urban surroundings or more peripheral locations, owner-occupied apartments are typically located
in multi-family houses in central urban locations. If defined as the proportion of all residential dwellings
that are occupied by their owners, the German home ownership rate is 42.6 per cent (2011 Census). This
corresponds to 17.3 million owner-occupied dwellings. 3.5 million, or 20 per cent of all 17.3 million own-
er-occupied dwellings, are located in city-dominating multi-family buildings.
7
 The national home price index published by the Federal Statistical Office is derived from disaggregated
data reported by public local boards of surveyors (Lokale Gutachterausschüsse).
 5
Aging and Urban House Prices

Federal Statistical Office with information on average local household size from the
Federal Institute for Research on Building, Urban Affairs and Spatial Development
(Bundesinstitut für Bau-, Stadt- und Raumforschung, BBSR). As a measure of a city’s
age structure, we compute the old age dependency ratio as the proportion of retirement
age (65 years or older) to working age (20-64 years) residents. 8 As a measure of local
purchasing power, we define annual real city income as the total production in city i in
year t, corrected for CPI inflation in the same period, divided by the total number of
employees in the same year. As a measure of urban education, we define the human
capital ratio as the proportion of high-qualification jobs (workers with a college degree)
to low-qualified jobs (workers without any formal labor market qualification) in the
city, using information from the German Federal Employment Office. As a measure of
the real private housing financing cost at the national level, we use the CPI inflation-
corrected effective interest rate on building society mortgages. Interest rate and CPI
inflation data are obtained from the German Bundesbank.
 Figure 1 illustrates the geographic locations of the 87 cities in the data set. Accord-
ing to the 2011 Census, the cities encompass 30.5 per cent of the German population
and 33.2 per cent of all households. Table A1 in the Appendix lists mean values and
standard deviations of all variables for each city in the sample over the sample period.
Figure 1. Geographic locations of all 87 cities in the sample

Source: Authors’ own depiction using Google Maps.

8
 Compared to other statistics related to the age distribution of the resident population, such as the me-
dian age or skewness measures, the old age dependency ratio is both an economically plausible and a
compact measure of urban demography. We expect changes in the urban old age dependency ratio over
time to capture the underlying economic problem of gradual shifts in the relative proportion of suppliers
and demanders in the urban housing market.
 6
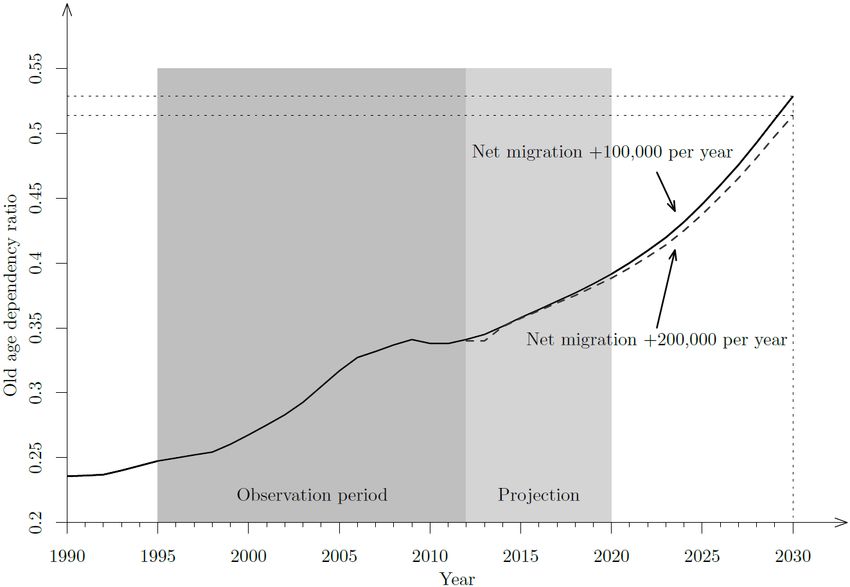
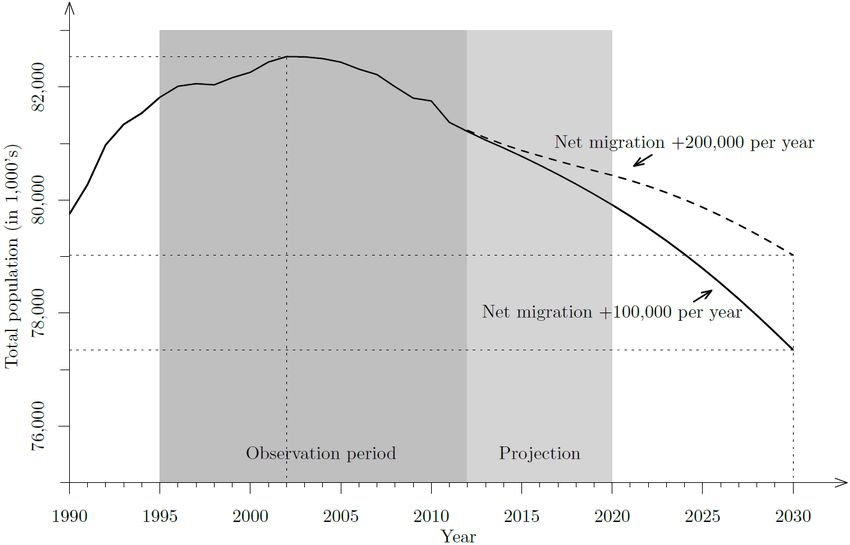
Aging and Urban House Prices

3.2 National and city-wide demographic trends in Germany

Like other industrial economies such as the US or Japan, Germany will be severely af-
fected by demographic change in upcoming decades. According to the most recent pop-
ulation projection by the German Federal Statistical Office, Germany‘s total popula-
tion will decline by between 14 and 20 per cent by 2060, based on 81 million in 2012
(Destatis 2009).9 The main cause is Germany‘s low total fertility rate. Importantly,
inward migration may reduce the expected decline in population, but most likely will
not stop it. Using data from the “medium variant” projection, Figure 2 shows that
even under the optimistic assumption of a net migration balance of +200,000 annually,
total population will decrease by about 1 million inhabitants between 2012 (the end
year of our sample period) and 2030. For sake of transparency, the projection period for
our own house price forecasts in shaded in light grey.
Figure 2. Total population in Germany by 2030

Source: German Federal Statistical Office, 12th Coordinated Population Projection, Var. 1-W1/2

 In addition to overall decline, the German population’s age profile will undergo sub-
stantial change. Due to the low fertility rate and a longer life expectancy, the share of
elderly in the population is expected to increase considerably. We illustrate aging in
Figure 3 by displaying the past and projected temporal evolution of the nationwide old
age dependency ratio, again using information from the most common population fore-
cast scenario of the German Federal Statistical Office. According to this scenario, Ger-

9
 Projections of household numbers are also available for the nation, but we prefer to rely on population
figures to depict demographic trends at the national level.
 7
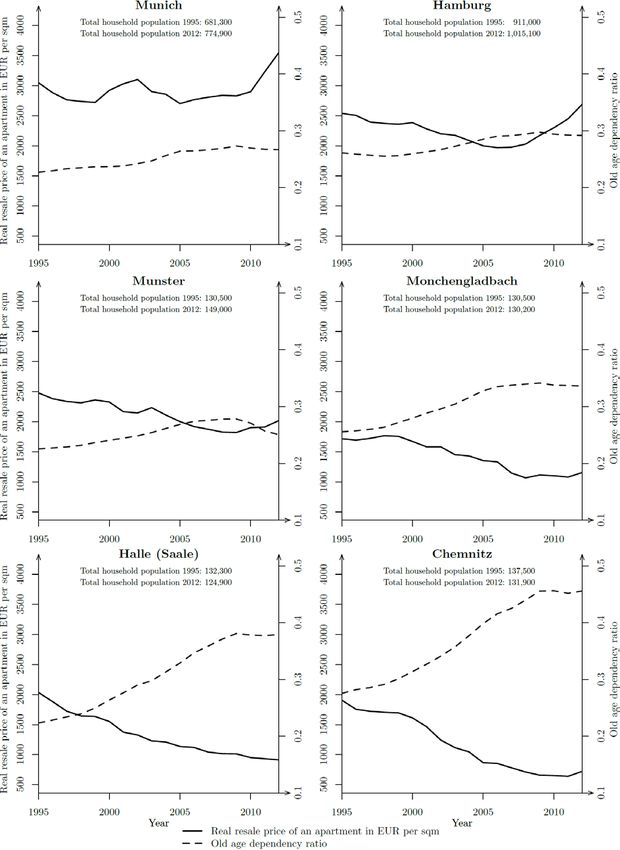
Aging and Urban House Prices

many’s nationwide old age dependency ratio will increase from 0.35 in 2012 to over 0.5
in 2030, showing very little sensitivity to net migration. This development is quite
noteworthy: compared to the projected decrease in total population of 1.5-3 per cent
over the same time horizon, the scenario implies an upward shift in the old age de-
pendency ratio of more than 40 per cent over 2012-2030.
Figure 3. Old age dependency ratio in Germany, 1990-2030

Source: German Federal Statistical Office, 12th Coordinated Population Projection, Var. 1-W1/2.

 A distinct feature of demographic change is its high spatial diversity. Our data re-
veal that cross-sectional variation in the temporal development of household population
figures and old age dependency ratios across German cities over the sample period
1995-2012 was indeed substantial. Figure 4 displays six different characteristic cases
illustrating this variation. Tentatively, a more positive demographic development ap-
pears to be associated with better performing urban house prices. For example, in Mu-
nich, Bavaria (upper left panel), total household population displayed a continuous
increase over 1995-2012, while the old age dependency ratio was low and almost re-
mained constant. Real house prices in this city displayed a positive trend. The Saxon
city of Chemnitz (lower right panel) is an example of exactly contrary developments.
Household population declined from 0.138 to 0.132 million over 1995-2012, while the
old age dependency ratio increased substantially from 0.28 to 0.45 (a relative increase
of 60 per cent). At the same time, real house prices declined by more than 50 per cent.
The other four examples display cities that range between these two extreme cases.

 8
Aging and Urban House Prices

Figure 4. Six examples of city-wide house price, population and old age dependency ratio evo-
lutions, 1995-2012

Sources: BulwienGesa, German Federal Statistical Office, authors’ own calculations.

 9
Aging and Urban House Prices

4 Empirical methodology and results

We first analyze the stationarity properties of our data set with established panel sta-
tionarity and panel cointegration tests. We then estimate a panel error correction mod-
el (PECM) based on the work of Pesaran and Smith (1995) and Pesaran et al. (1999).
The time dimension of our panel data is not large enough for reliable inference on the
cointegration parameters in each time series separately. However, annual observations
of 18 years enable the measurement of long-run house price elasticities of our variables
of interest, based on restrictions on heterogeneity in the cointegration relationships. We
exploit the cross-section information of the panel data by group pooling, based on the
notion of strong commonalities across the 87 cities in our sample. Specifically, we as-
sume common long-run cointegration relationships between housing prices and our
main explanatory variables among all cities, but allow for heterogeneity across groups
in short-run dynamics (Pesaran et al. 1999).

4.1 Panel unit root and cointegration tests
Inference techniques for unit root testing in panel data encompass a substantial body of
literature (Harris and Tzavalis 1999, Choi 2001, Levin et al. 2002, Im et al. 2003). Pan-
el unit root tests are based on a first-order autoregressive model allowing for two-way
unobserved effects and time trends:

∆ = + + + , −1 + (2)
 where is the variable of interest, and represents group and time fixed ef-
fects, is a deterministic time trend, and is a normally distributed error term. De-
pending on whether the specific test assumes homogeneity or heterogeneity in the auto-
regressive parameter, the tests involve the null hypothesis that all panels are integrated
of order 1, versus the alternative that either all or a fraction of the panels form station-
ary series.
 We employ different types of tests for the hypothesis of stationarity of our panel da-
ta. The Levin-Lin-Chu (LLC) test can be viewed as a pooled Augmented Dickey Fuller
test as it assumes that all panels have the same autoregressive parameter, = . In the
absence of a deterministic term, the test allows the number of time periods to tend to
infinity at a slower rate than the number of cross-sectional units, though T must go to
 √
infinity sufficiently fast to secure that lim , →∞ / = 0. The Harris-Tzavalis (HT)
test also assumes homogeneity in the autoregressive parameter, but different from the
LLC test, the number of time periods is fixed (Harris and Tzavalis 1999). The Im-
Pesaran-Shin (IPS) test allows each group to have its own autoregressive parameter
instead of a common (Im et al. 2003). The IPS statistics assume the number of time
periods is fixed, while N tends to infinity.
 All three tests are first applied to the natural logarithms of real city house prices,
total household population, old age dependency ratios, income per capita, human capi-

 10
Aging and Urban House Prices

tal ratios, and the real mortgage interest rate at their respective levels. The respective
tests are then applied to the first differenced panel series of each variable in logs. For
both cases, all tests are performed with and without the inclusion of a deterministic
time trend. Appropriate lag lengths are chosen based on the Akaike Information Crite-
rion.
 The upper part of Table 2 reports the test results for the non-differenced variables.
Except for the LLC test, the null hypothesis of non-stationarity cannot be rejected in
most cases, which indicates that at least some variables are I(1). A first-difference
transformation of the data is needed to generate a stationary time series (Hamilton
1994). The lower part of Table 2 lists the test results after this transformation. The
null hypothesis of non-stationarity has to be rejected at common significance levels for
each variable throughout, except for the old age dependency ratio, where rejection is
possible only in two of six cases.
Table 2. Panel unit root tests
Variables Levin-Lin-Chu Im-Pesaran-Shin Harris-Tzavalis
 H0: ϱ i =ϱ for all i H0: ϱ i =1 for all i H0: ϱ =1
 Ha: ϱ
Aging and Urban House Prices

explains urban real house prices by means of a linear combination of household num-
bers, age structure, income per capita, the human capital ratio and national financing
costs. In addition, we combine the variables to four different specifications. In order to
account for potential sensitivity of the cointegration tests with respect to these differ-
ent specifications, we use different combinations of the explanatory variables (Table 3).
The Kao ADF test, the Pedroni panel and Pedroni group tests suggest a cointegration
relationship between the variables of interest, which is identical among cities in most
cases. 10 There is thus supportive evidence that the variables of interest tend towards
long-run equilibrium.
Table 3. Panel cointegration tests
 Specification
 Variables [1] [2] [3] [4]
 Log real house price x x x x
 Log total houshold population x x x x
 Log old age dependency ratio x x x x
 Log income per capita x x x x
 Log human capital ratio x x
 Log real mortgage interest rate x x

 Cointegration tests
 Kao ADF-statistic -4.9407 *** -3.3990 *** -3.9364 *** -4.2792 ***
 Pedroni panel v-statistic 1.7056 ** -1.4512 0.9427 -2.2468
 Pedroni panel rho-statistic 2.4435 5.2398 5.0082 7.3515
 Pedroni panel PP-statistic -3.6388 *** -2.7785 *** -2.1498 ** -3.3356 ***
 Pedroni panel ADF-statistic -4.1325 *** -1.8974 ** -3.2928 *** -2.3632 ***
 Pedroni group rho-statistic 5.5255 8.3486 7.8563 10.5082
 Pedroni group PP-statistic -6.8314 *** 8.8133 *** -8.0500 *** -15.6458 ***
 Pedroni group ADF-statistic -6.4813 *** -4.3851 *** -5.4702 *** -5.4491 ***
 (*, **, *** denote statistical significance at the 10%-, 5%- and 1%-level, respectively)

4.2 Results of panel error correction models
Different techniques are available for the estimation of panel error correction models in
which the short-run dynamics are heterogeneous across groups. The mean-group (MG)
estimator (Pesaran and Smith 1995) averages the coefficients of N single times-series
regressions and allows the intercepts, slope coefficients, and error variances to differ
across groups. The pooled mean-group (PMG) estimator (Pesaran et al. 1999) relies on
a combination of pooling and averaging the coefficients. As the MG estimator, it allows

10
 Following Pedroni (1999), the within-dimension statistics (panel) are constructed by summing both
the numerator and the denominator terms over the N dimension separately, whereas the between-
dimension (group) statistics are constructed by first dividing the numerator and the denominator, prior
to summing over the N dimension. Because the between dimension does not presume a common first-
order autoregressive parameter, it allows modelling an additional source of potential heterogeneity across
individual cities.
 12
Aging and Urban House Prices

for heterogeneous short-run dynamics but constrains the long-run elasticities to be
equal across all groups. Pooling yields efficient and consistent estimates when the re-
strictions are true. Common dynamic fixed-effects estimation (DFE) captures individu-
al unobserved effects on house prices across cities. Like the PMG estimator, it restricts
the coefficients of the cointegrating vector to be homogenous across cities. The speed of
adjustment coefficient and the short-run coefficients are also assumed as equal.
 Building on the baseline regression model, we define the long-run price function as
follows:

 = 0 + 1 + 2 + + (3)

 where is the log real house price, is the vector of explanatory demographic
variables, is the vector of explanatory economic variables, and is the group-
specific unobserved effect. In line with the previous section, we assume that the varia-
bles in levels follow an I(1) process and are cointegrated. The ARDL(1,1,1) dynamic
panel specification of (3) is:

 = 10 + 11 , −1 + 20 + 21 , −1 + , −1 + + (4)
 where are scalars. The error correction representation of (4) is:

∆ = 11 ∆ + 21 ∆ + � , −1 − 0 − 1 − 2 � + (5)

 where = −(1 − ), 0 = 1−

 , 1 = 10
 1−
 + 11
 , and 2 = 20
 1−
 + 21
 . The estimated

coefficients 1 and 2 capture the long-run real house price effects of local demograph-
ic and economic fundamentals and can readily be interpreted as elasticities. If the vari-
ables return to long-run equilibrium after a shock, the error-correction adjustment pa-
rameter is expected to have a negative sign.
 Our baseline regression model [1] explains the evolution of real urban house prices
with the temporal evolutions of the total number of resident households, old age de-
pendency ratios, and the real city income per capita. The additional price determinants
are subsequently combined with this baseline specification. From theory, we expect the
elasticities of real house prices to be positive with respect to the number of households,
real per capita income, and the human capital ratio. Negative long-run elasticities are
meanwhile expected with respect to the old age dependency ratio and the national real
mortgage interest rate.
 The results of estimating each different specification with the MG, PMG and DFE
estimators are shown in Table 4. Since the MG and PMG estimators are inconsistent if
the true data-generating process includes unobserved city heterogeneity, we employ the
common Hausman test to each specification. The Hausman test indicates the presence
of unobserved city fixed-effects, such that we focus the discussion of our results on the

 13
Aging and Urban House Prices

DFE-estimation. As favorite specification, we identify the DFE Specification [2], which
includes only significant explanatory variables. 11
Table 4. Results of different panel error correction model specifications
 Specification
 Pooled mean-group estimation [1] [2] [3] [4]
 Log total houshold population 1.5415 *** 1.0677 *** 1.2196 *** 0.7268 ***
 Log old age dependency ratio -1.1603 *** -1.3009 *** -1.4495 *** -1.2551 ***
 Log income per capita 0.1891 *** 0.3517 *** 0.1630 *** 0.3001 ***
 Log human capital ratio 0.1377 *** -0.1455 ***
 Log real mortgage interest rate -0.0776 *** -0.1379 ***

 Error correction term -0.3029 *** -0.2730 *** -0.3022 *** -0.3072 ***

 Mean-group estimation
 Log total houshold population 1.6801 * 2.4003 ** 4.7370 1.7768
 Log old age dependency ratio -1.5237 *** -2.2503 *** -2.9243 *** -1.1854 **
 Log income per capita 0.4342 0.8999 -1.8570 -0.0645
 Log human capital ratio 0.2710 0.0583
 Log real mortgage interest rate -0.0537 * -0.1378 **

 Error correction term -0.6227 *** -0.6698 *** -0.7380 *** -0.8450 ***

 Dynamic fixed-effects estimation
 Log total houshold population 1.6581 *** 1.3847 *** 1.5043 *** 1.3519 ***
 Log old age dependency ratio -1.2634 *** -1.8283 *** -1.4991 *** -1.8682 ***
 Log income per capita 0.3020 ** 0.3589 ** 0.3493 ** 0.3677 ***
 Log human capital ratio 0.2106 *** 0.0322
 Log real mortgage interest rate -0.2763 *** -0.2698 ***

 Error correction term -0.1635 *** -0.1318 *** -0.1437 *** -0.1306 ***

 (*, **, *** denote statistical significance at the 10%-, 5%- and 1%-level, respectively)

 The estimated signs for the coefficients of the long-run cointegration relationship
between real urban house prices and their demographic and economic fundamentals
generally conform to the theoretical expectations. The results support our key hypothe-
sis that population aging is associated with decreasing house prices. The coefficient es-
timated with the old age dependency ratio carries the expected negative sign and is
significantly different from zero. An increase in the old age dependency ratio of one per
cent implies 1.83 per cent lower real house prices in the long run on average, which is
an economically very meaningful effect. Another key demographic driver of real local
house prices is total household population: a one per cent increase in the number of
resident households is associated with a 1.38 per cent average increase in prices in the
long run. Regarding other controlling covariates, an increase in real city income per
capita of one per cent is associated with a 0.36 per cent long-run increase in real house
prices. The human capital ratio is statistically insignificant in the DFE estimation

11
 The Hausman test favors the DFE model prior to PMG model and lastly, the MG model.
 14
Aging and Urban House Prices

when national mortgage interest rates are included. Upward shifts in housing financing
costs of one per cent at the national level meanwhile shift downward urban home prices
by 0.28 per cent on average. This estimate implies that urban house prices in Germany
decrease by about 30 per cent on average in the long run if the national mortgage in-
terest rate doubles.12 Regarding the error correction behavior of house prices, the coeffi-
cient estimated for the speed of adjustment of error correction is negative and signifi-
cant, which is in line with theoretical expectations that real urban house prices return
to their long-run equilibrium values after demographic or economic shocks. Yet, the
small size of the adjustment parameter suggests that real prices stay depart from their
equilibrium values for prolonged periods of time.
 Table 5 contrasts our findings with the results of the two recent relevant studies of
Takáts (2012) and Saita et al. (2013). Although such direct comparison is naturally
limited by differences in specification and data, it illustrates a striking similarity of the
results. 13 The coefficient we find for the elasticity of real house prices with respect to
total population (+1.38) lies slightly below the respective coefficients that Saita et al.
measure for regions in Japan (+2.02) and the US (+1.81) in the most comparable
specification, whereas it is larger than the respective elasticity that Takáts finds for
OECD countries (+1.05). Some of these differences may reflect that our population
measure is less noisy, though our results appear to be largely insenstive to the use of
households versus individual population. 14 The real house price elasiticity we find with
respect the old age dependency ratio (-1.83) ranges above the respective elasticities
that Saita et al. find for US states (-0.54) and Japanase prefectures (-1.73) in absolute
terms. It is also more than one percentage point larger than the ratio Takáts finds for
OECD countries (-0.68).
 The empirial relationship between real house prices and real per capita incomes is
quite comparable among the three studies. Importantly, all studies find the respective
elasticity to be positive and less than one. Our elasticity measure of +0.36 lies between
that which Saita et al. find for Japanese prefectures (+0.23) and for US states (+0.45).
In OECD countries, the real income elasticity of house prices appears to be
considerably higher (+0.88). Such large elasticity estimates may, however, reflect
measurement error due to aggregation problems in national data.
 In summary, our econometric results yield new original evidence supporting the the-
oretical claim that local demography acts as a strong driver of returns to housing capi-
tal over the long run. Concerning the effect of aging, there is now robust evidence of an

12
 A coefficient of this size suggests that the European Central Bank’s low interest rate policy in response
to the financial crisis plays an important role in the substantial increase in real housing prices in many
German cities since 2009.
13
 Following Takáts, we also estimated a pooled OLS regression, the results of which are provided in the
Appendix.
14
 If we use population instead of household figures, we find the following elasticities in our DFE estima-
tion: log total population: 1.6799, log old age dependency ratio: -1.1698, log income per capita: 0.3631.
Further results are provided in the Appendix.
 15
Aging and Urban House Prices

economically meaningful negative effect of increases in the old-age dependency ratio on
house prices at the local, the regional and the national level.

Table 5. Comparison of estimated elasticities in different studies 15
 Results Saita et al. (2013) Takáts (2012)
Variables Germany Variables Japan U.S. Variables Nation
Panel units (N) 87 cities Panel units (N) 47 prefectures 50 states Panel units (N) 22 countries
Time periods (T) 18 years Time periods (T) 34 years 36 years Time periods (T) 40 years
Log real resale apartment price Log real land / housing price Log real house price
Log total houshold population 1.3847 Log total population 2.0220 1.8079 Log total population 1.0547
Log old age dependency ratio -1.8283 Log old age dependency ratio -1.7280 -0.5363 Log old age dependency ratio -0.6818
Log income per capita 0.3589 Log GDP per capita 0.2302 0.4525 Log GDP per capita 0.8842
Error correction term -0.1635 Error correction term -0.1056 -0.1199 Error correction term N/A

4.3 Probabilistic forecasts of demography-related house price effects

We use the DFE estimation results of the panel error correction model for a conditional
probabilistic forecast of expected demography-related local house price effects until
2020. To this end, we first multiply the annual expected percentage change of total
household population and the old age dependency ratio in each city 16 with their respec-
tive real house price elasticities estimated in the favorite DFE specification. We then
compute the mean annual expected real house price change, which is conditional in the
sense that real incomes and financing costs remain unchanged Based on the standard
errors of the two respective elasticity estimates, we also provide a 90 per cent confi-
dence interval for the annual price effect. In Table 6, the 87 cities in the sample are
ranked according to the total size of the mean expected annual demography-induced
price effect.
 In almost the entire sample, local demographic change will most likely lead to lower
real house prices until 2020, ceteris paribus. The strongest negative demography-
induced price effects must be expected for cities in eastern Germany. Many of these
cities have experienced severe price declines in the past. The expected annual demogra-
phy-induced price change is positive only for one city (Dusseldorf). In order to interpret
these projections appropriately, it is important to remember that they assume that all
other relevant price-explaining factors remain constant. In each city, negative demog-
raphy-induced price effects may in fact be (over-)compensated by gains to productivity,
lower real housing financing costs, or unobserved city-level effects. Of course, since the
exact size of the regression coefficients is sensitive to the specification (Table 4) and
local demographic forecasts by themselves probabilistic, the exact quantitative values
must not be overstated relative to their qualitative implications.

15
 The results of Saita et al. (2013) refer to their baseline specification of a panel error correction model
including regional fixed effects. The results of Tákats refer to a pooled OLS model in first differences
including time fixed effects.
16
 Data on household and population age structure projections is provided by the German Federal Insti-
tute for Research on Building, Urban Affairs and Spatial Development (BBSR 2009).
 16
Aging and Urban House Prices

 In Figure 5, we graphically split the combined impact of demography into the specif-
ic contributions of household population growth and aging for a deeper understanding
of expected demography-related house price effects. The graph illustrates that the ma-
jor part of the expected adverse demography-induced house price effects in German
cities until 2020 is a consequence of expected gradual increases in the old age depend-
ency ratio. Growing housing services demand due to increasing household numbers will
by itself attenuate annual average house price decline in many cities. In some cities, the
positive partial price impact of household growth is likely to compensate for the nega-
tive partial price impact of aging to a significant extent.

 17
Aging and Urban House Prices

Table 6. Demography-induced annual change to urban house prices in per cent, 2020

Rank City 90% confidence interval Rank City 90% confidence interval
 minimum mean maximum minimum mean maximum
 1 Dusseldorf -0.17 0.20 0.58 45 Frankfurt (Main) -2.78 -2.15 -1.52
 2 Bamberg -0.40 -0.07 0.25 46 Offenbach (Main) -2.79 -2.18 -1.57
 3 Bielefeld -0.34 -0.12 0.11 47 Kempten (Allgau) -2.69 -2.20 -1.70
 4 Hamburg -0.49 -0.16 0.16 48 Wuppertal -2.44 -2.23 -2.01
 5 Regensburg -0.77 -0.31 0.15 49 Potsdam -3.17 -2.28 -1.39
 6 Rosenheim -0.85 -0.34 0.17 50 Freiburg (Breisgau) -3.26 -2.39 -1.51
 7 Leverkusen -0.57 -0.39 -0.21 51 Kaiserslautern -2.88 -2.40 -1.91
 8 Cologne -0.85 -0.40 0.04 52 Heidelberg -3.10 -2.41 -1.72
 9 Ludwigshafen -1.17 -0.74 -0.30 53 Dresden -3.02 -2.45 -1.87
 10 Stuttgart -1.32 -0.82 -0.33 54 Hagen -2.48 -2.46 -2.43
 11 Heilbronn -1.36 -0.86 -0.36 55 Bochum -2.77 -2.48 -2.18
 12 Augsburg -1.37 -0.90 -0.43 56 Coburg -2.77 -2.51 -2.25
 13 Munich -1.53 -0.92 -0.30 57 Furth -3.23 -2.54 -1.86
 14 Erlangen -1.35 -0.93 -0.50 58 Neumunster -2.93 -2.58 -2.23
 15 Brunswick -1.30 -1.01 -0.71 59 Bayreuth -3.08 -2.75 -2.42
 16 Landshut -1.78 -1.03 -0.29 60 Hamm -3.26 -2.78 -2.30
 17 Mainz -1.68 -1.06 -0.45 61 Wilhelmshaven -3.07 -2.81 -2.55
 18 Osnabruck -1.44 -1.07 -0.70 62 Remscheid -2.90 -2.82 -2.74
 19 Nuremberg -1.62 -1.12 -0.63 63 Bremerhaven -3.13 -2.85 -2.57
 20 Wiesbaden -1.76 -1.23 -0.70 64 Kassel -3.22 -2.87 -2.53
 21 Flensburg -1.63 -1.25 -0.86 65 Leipzig -3.46 -2.93 -2.41
 22 Wurzburg -1.70 -1.28 -0.86 66 Herne -3.22 -2.99 -2.75
 23 Trier -1.93 -1.42 -0.92 67 Gelsenkirchen -3.27 -3.06 -2.84
 24 Bremen -1.76 -1.44 -1.12 68 Aschaffenburg -3.81 -3.08 -2.35
 25 Lubeck -1.71 -1.45 -1.20 69 Berlin -3.86 -3.27 -2.67
 26 Bonn -2.08 -1.48 -0.87 70 Darmstadt -4.04 -3.29 -2.54
 27 Ingolstadt -2.28 -1.59 -0.90 71 Oberhausen -3.80 -3.31 -2.82
 28 Oldenburg -2.32 -1.62 -0.92 72 Monchengladbach -3.82 -3.34 -2.87
 29 Wolfsburg -1.86 -1.64 -1.41 73 Weimar -4.03 -3.44 -2.84
 30 Mulheim (Ruhr) -1.83 -1.64 -1.44 74 Bottrop -4.22 -3.78 -3.34
 31 Solingen -1.85 -1.67 -1.48 75 Salzgitter -4.13 -3.97 -3.80
 32 Ulm -2.32 -1.69 -1.07 76 Jena -5.01 -4.38 -3.76
 33 Mannheim -2.32 -1.79 -1.25 77 Magdeburg -5.56 -5.15 -4.75
 34 Koblenz -2.22 -1.79 -1.37 78 Brandenburg (Havel) -5.83 -5.52 -5.21
 35 Duisburg -1.97 -1.80 -1.63 79 Erfurt -6.53 -5.83 -5.13
 36 Karlsruhe -2.46 -1.86 -1.25 80 Rostock -6.90 -6.32 -5.74
 37 Essen -2.16 -1.88 -1.60 81 Halle (Saale) -7.47 -7.02 -6.58
 38 Passau -2.44 -1.90 -1.36 82 Chemnitz -7.56 -7.14 -6.71
 39 Kiel -2.32 -1.90 -1.48 83 Schwerin -8.62 -7.96 -7.31
 40 Dortmund -2.28 -1.91 -1.54 84 Gera -9.89 -9.40 -8.91
 41 Munster -2.72 -2.00 -1.29 85 Cottbus -10.22 -9.54 -8.87
 42 Krefeld -2.29 -2.02 -1.75 86 Frankfurt (Oder) -11.15 -10.43 -9.72
 43 Schweinfurt -2.42 -2.13 -1.84 87 Suhl -11.96 -11.36 -10.76
 44 Pforzheim -2.71 -2.14 -1.57

Source: Authors’ own calculations.

 18
Aging and Urban House Prices

Figure 5. Partial impacts of age structure and household numbers on urban house prices in
per cent, 2020

 Dusseldorf
 Bamberg
 Bielefeld
 Hamburg
 Regensburg
 Rosenheim
 Leverkusen
 Cologne
 Ludwigshafen
 Stuttgart
 Heilbronn
 Augsburg
 Munich
 Erlangen
 Brunswick
 Landshut
 Mainz
 Osnabruck
 Nuremberg
 Wiesbaden
 Flensburg
 Wurzburg
 Trier
 Bremen
 Lubeck
 Bonn
 Ingolstadt
 Oldenburg
 Wolfsburg
 Mulheim (Ruhr)
 Solingen
 Ulm
 Mannheim
 Koblenz
 Duisburg
 Karlsruhe
 Essen
 Passau
 Kiel
 Dortmund
 Munster
 Krefeld
 Schweinfurt
 Pforzheim
 Frankfurt (Main)
 Offenbach (Main)
 Kempten (Allgau)
 Wuppertal
 Potsdam
 Freiburg (Breisgau)
 Kaiserslautern
 Heidelberg
 Dresden
 Hagen
 Bochum
 Coburg
 Furth
 Neumunster
 Bayreuth
 Hamm
 Wilhelmshaven
 Remscheid
 Bremerhaven
 Kassel
 Leipzig
 Herne
 Gelsenkirchen
 Aschaffenburg
 Berlin
 Darmstadt
 Oberhausen
 Monchengladbach
 Weimar
 Bottrop
 Salzgitter
 Jena
 Magdeburg
 Brandenburg (Havel)
 Erfurt
 Rostock
 Halle (Saale)
 Chemnitz
 Schwerin
 Gera
 Cottbus
 Frankfurt (Oder)
 Suhl

 -10 -8 -6 -4 -2 0 2

 Impact of old age dependency ratio Impact of total household population

Source: Authors’ own calculations.
 19
Aging and Urban House Prices

5 Conclusions
How urban house prices are affected by demographic change in industrialized countries
in the long run is of critical relevance for home owners, investors, and policy makers
alike. The results of this paper provide original empirical evidence that the effects of
local aging and population shrinkage on city-level house prices are negative and
economically meaningful. This evidence adds to recent related findings by other
researchers using national and regional level housing market data. Extrapolating
historical empirical relationships to the future of urban house prices, demographic
change is most likely to contribute to lower real home price growth in almost any
German urban area until 2020. This represents an amplification of the already existing
headwind effects that demographic development have imposed on German home prices
over recent years.
 As with any projections, the results of our probabilistic forecast of city-level demog-
raphy-induced house prices have to be treated with the appropriate care. The causal
mechanisms underlying the empirical links between house prices and demography can
and do change with changes in household preferences, housing finance institutions and
the design of pension systems. Urban demographic developments may also not be fully
exogenous to urban house prices, given that rational households chose locations based
inter alia on intercity house price differences. Another factor that influences the price
effect of demographic shifts at the urban level is housing supply. Our results indicate
that housing supply has been finitely elastic over the sample period of 1995-2012,,
because it is not possible to find such large price effects otherwise.17 Future increases in
the elasticity of housing supply can theoretically reduce the real price effects of
forthcoming shifts to urban housing demand. However, given the durability-related
downward stickiness of housing supply, we see strong signs that aging and shrinking
cities in Germany and elsewhere will encounter considerable difficulty in combating
future demography-induced negative gains to housing capital within the relevant time
horizons.
 Future research could use our findings as a starting point for further work on the
potential endogeneity between aging and house prices. Do price declines due to an ag-
ing society provoke young people to move in or move out of a city? As adverse price
effects of aging make urban owner-occupied housing more affordable, this might en-
courage young households to invest in an aging city. As Hiller and Lerbs (2015) show,
it may be necessary to account for the evolution of urban amenities to disentangle
these dynamic second-round effects.

 Lerbs (2014) provides econometric evidence at the German district level that housing supply in Ger-
17

many is indeed inelastic, finding a long-run elasticity estimate of 0.33 for single-family homes.
 20
Aging and Urban House Prices

References

N. Apergis, O.C. Dincer, and J.E. Payne. The relationship between corruption and income ine
 quality in US states: evidence from a panel cointegration and error correction model. Public
 Choice, 145(1-2): 125-135, 2010.

A. Banerjee. Panel data unit roots and cointegration: an overview. Oxford Bulletin of Econom-
 ics and Statistics, 61(S1): 607-629, 1999.

M. Beenstock, D. Felsenstein. Spatial error correction and cointegration in nonstationary panel
 data: regional house prices in Israel. Journal of Geographic Systems, 12(2): 189-206, 2010.

M. Bernt. Partnerships for Demolition: The Governance of Urban Renewal in East Germany’s
 Shrinking Cities. International Journal of Urban and Regional Research, 33(3): 754-769,
 2009.

R.R. Brady. Measuring the diffusion of housing prices across space and over time. Journal of
 Applied Econometrics, 26(2): 213-231, 2011.

BBSR. Raumordnungsprognose 2030. German Federal Institute for Research on Building, Ur-
 ban Affairs and Spatial Development,
 http://www.bbsr.bund.de/BBSR/DE/Raumbeobachtung/UeberRaumbeobachtung/Kompon
 e-ten/Raumordnungsprognose/Downloads/DL_uebersicht.html;jsessionid=B1988D65EFA16
 FA81A0E61D4494D0A93.live1043?nn=443714 , 2009.

D.R. Capozza, P.H. Hendershott, C. Mack, C.J. Mayer. Determinants of real house price dy-
 namics. NBER Working Paper No. 9262, 2002.

G.A. Carlino, R.H. DeFina. Macroeconomic analysis using regional data: An application to
 monetary policy. In: R. J. Arnott and D. P. McMillen (Eds.) A Companion to Urban Eco-
 nomics, 440-459, Blackwell Publishing Ltd, Oxford, UK, 2008.

I. Choi. Unit root tests for panel data. Journal of International Money and Finance, 20(2):
 249-272, 2001.

Destatis. Germany's population by 2060 - Results of the 12th coordinated population projection.
 German Federal Statistical Office, Wiesbaden,
 https://www.destatis.de/EN/Publications/Specialized/Population/GermanyPopulation2060.
 pdf?__blob=publicationFile, 2009.

D. DiPasquale, W.C. Wheaton. Housing Market Dynamics and the Future of Housing Prices.
 Journal of Urban Economics, 35(1): 1-27, 1994.

M. Eberhardt, E. Teal. Econometrics for Grumblers: A New Look at the Literature on Cross-
 Country Growth Empirics. Journal of Economic Surveys, 25(1): 109-155, 2011.
 21
Aging and Urban House Prices

P. Eichholtz, T. Lindenthal. Demographics, human capital, and the demand for housing. Jour-
 nal of Housing Economics, 26(1): 19-32, 2014.

R.F. Engle, C.W.J. Granger. Cointegration and error correction: Representation, estimtation
 and testing. Econometrica, 55(2): 251–276, 1987

J. Ermisch. The demand for housing in Britain and population ageing: Microeconometric evi-
 dence. Economica, 63(251): 383-404, 1996.

M. Flavin, T. Yamashita. Owner-Occupied Housing and the Composition of the Household
 Portfolio. American Economic Review, 92(1): 345-362, 2002.

J. Gallin. The long-run relationship between house prices and rents. Real Estate Economics,
 36(4): 635-658, 2008.

A.C. Goodman, T.G. Thibodeau. Where are the speculative bubbles in US housing markets?
 Journal of Housing Economics, 17(2): 117-137, 2008.

E.L. Glaeser, J. Gyourko, A. Saiz. Housing supply and housing bubbles. Journal of Urban
 Economics, 64(2): 198-217, 2008

R. Green, P.H. Hendershott. Age, housing demand, and real house prices. Regional Science
 and Urban Economics, 26(5): 465-480, 1996.

J.D. Hamilton. Time Series Analysis. Princeton University Press, 1994.

R.D.F. Harris, E. Tzavalis. Inference for unit roots in dynamic panels where the time dimen-
 sion is fixed. Journal of Econometrics, 91(2): 201-226, 1999.

J.V. Henderson, Y.M. Ioannides. A Model of Housing Tenure Choice. American Economic Re-
 view, 73(1): 98-113, 1983.

N. Hiller, O. Lerbs. The capitalization of non-market attributes into regional housing rents and
 wages: evidence on German functional labor market areas. Review of Regional Research,
 35(1): 49-72, 2015.

C. Himmelberg, C. Mayer, T. Sinai. Assessing high house prices: Bubbles, fundamentals and
 misperceptions. The Journal of Economic Perspectives, 19(4): 67-92, 2005.

S. Holly, M.H. Pesaran, and T. Yamagata. A spatio-temporal model of house prices in the
 USA. Journal of Econometrics, 158(1): 160-173, 2010.

K.S. Im, M.H. Pesaran, Y. Shin. Testing for unit roots in heterogeneous panels. Journal of
 Econometrics, 115(1): 53-74, 2003.

 22
Aging and Urban House Prices

F. Kajuth, T.A. Knetsch, N. Pinkwart. Assessing house prices in Germany: evidence from an
 estimated stock-flow model using regional data. Deutsche Bundesbank Discussion Paper
 No. 46, 2013.

C. Kao. Spurious regression and residual-based tests for cointegration in panel data. Journal of
 Economcetrics, 90(1): 1-44, 1999.

H. Kraft, C. Munk. Optimal Housing, Consumption, and Investment Decisions over the Life
 Cycle. Management Science, 57(6): 1025-1041, 2011.

T.H. Kuethe, V.O. Pede. Regional Housing Price Cycles: A Spatio-temporal Analysis Using US
 State-level Data. Regional Studies, 45(5): 563-574, 2011.

C.C. Lee, M.S. Chien. Empirical modelling of regional house prices and the ripple effect. Urban
 Studies, 48(10): 2029-2047, 2011.

O. Lerbs. House prices, housing development costs, and the supply of new single-family housing
 in German counties and cities. Journal of Property Research, 31(3): 183-210, 2014.

A. Levin, C.F. Lin, C.S.J. Chu. Unit root tests in panel data: asymptotic and finite-sample
 properties. Journal of Econometrics, 108(1): 1-24, 2002.

N.G. Mankiw and D.N. Weil. The baby boom, the baby bust, and the housing market. Region-
 al Science and Urban Economics, 19(2): 235-258, 1989.

W. Maennig, L. Dust. Shrinking and growing metropolitan areas asymmetric real estate price
 reactions? The case of German single-family houses. Regional Science and Urban Econom-
 ics, 38(1): 63-69, 2008.

G. Meen. Regional house prices and the ripple effect: a new interpretation. Housing Studies,
 14(6): 733-753, 1999.

A.R. Mian, A. Sufi. House prices, home equity-based borrowing, and the US household leverage
 crisis. NBER Working Paper No. 15283, 2009.

N. Miller and L. Peng. Exploring Metropolitan Housing Price Volatility. Journal of Real Estate
 Finance and Economics, 33: 5-18, 2006.

P. Pedroni. Critical Values for Cointegration Tests in Heterogeneous Panels with Multiple Re-
 gressors. Oxford Bulletin of Economics and Statistics, 61(S1): 653-670, 1999.

P. Pedroni. Panel Cointegration: Asymptotic and Finite Sample Properties of Pooled Time
 Series Tests with an Application to the PPP Hypothesis. Econometric Theory, 20(3): 597-
 625, 2004.

 23
You can also read