Spatial and Temporal Variations of Airborne Poaceae Pollen along an Urbanization Gradient Assessed by Different Types of Pollen Traps
←
→
Page content transcription
If your browser does not render page correctly, please read the page content below
atmosphere

Article
Spatial and Temporal Variations of Airborne Poaceae Pollen
along an Urbanization Gradient Assessed by Different Types of
Pollen Traps
Johanna Jetschni *              and Susanne Jochner-Oette

                                            Physical Geography/Landscape Ecology and Sustainable Ecosystem Development, Catholic University of
                                            Eichstätt-Ingolstadt, 85072 Eichstätt, Germany; susanne.jochner@ku.de
                                            * Correspondence: johanna.jetschni@ku.de

                                            Abstract: Grass pollen allergy is widespread all around the globe. With an increasing number of
                                            people living in cities, the examination of grass pollen levels within cities and their surroundings has
                                            increased in importance. The aim of this study was to examine different temporal and spatial scales
                                            of grass pollen concentration and deposition across urban and semi-rural environments in the years
                                            2019 and 2020. We installed different types of pollen traps in the city of Ingolstadt (Bavaria, Germany)
                                            and its surroundings: volumetric pollen traps at roof level to assess background pollen concentration
                                            and gravimetric pollen traps and portable volumetric traps at street level. We considered grass
                                            pollen concentration and deposition in the context of land use and management. Our data showed
                                            that the grass pollen season in 2020 was longer and more intense than in 2019. Background grass
                                            pollen concentration was generally higher at the semi-rural site in both years: peak values were eight

                                     times (2019) and more than four times (2020) higher, and Seasonal Pollen Index was more than four
Citation: Jetschni, J.; Jochner-Oette, S.
                                            times and almost three times higher in 2019 and 2020, respectively. Analyses of spatial variations
Spatial and Temporal Variations of          measured at street level revealed higher numbers for pollen deposition and concentrations at semi-
Airborne Poaceae Pollen along an            rural than at urban sites. Recorded values were linked to local vegetation and the management of
Urbanization Gradient Assessed by           grass areas surrounding the traps. Analyses of diurnal variations at street level in June 2019 showed
Different Types of Pollen Traps.            that pollen concentration for all sites, independent of their degree of urbanization, were highest at
Atmosphere 2021, 12, 974.                   noon (22.2 pollen grains/m3 vs. 8.5 pollen grains/m3 in the morning and 10.4 pollen grains/m3 in
https://doi.org/10.3390/                    the evening). Diurnal variations at roof level showed similarities for the same days but differed when
atmos12080974                               considering the whole season. Our data suggest the importance of the management of grass areas as
                                            areas cut earlier have a decreased amount of emitted pollen.
Academic Editor: Jose Oteros

                                            Keywords: pollen concentration; Poaceae pollen; pollen deposition; urban-rural differences; spatial
Received: 29 June 2021
                                            and temporal variations; personal volumetric air samplers; gravimetric traps; volumetric traps
Accepted: 27 July 2021
Published: 28 July 2021

Publisher’s Note: MDPI stays neutral
with regard to jurisdictional claims in
                                            1. Introduction
published maps and institutional affil-          The most common pollen allergy in Europe and worldwide is grass-induced polli-
iations.                                    nosis [1,2]. In Germany, 14.8% of adults are affected by hay fever [3]. Various species
                                            contribute to the grass (Poaceae) pollen spectrum throughout the year (e.g., meadow foxtail
                                            Alopecurus pratensis, orchard grass Dactylis glomerata, annual bluegrass Poa annua, perennial
                                            ryegrass Lolium perenne, cultivated rye Secale cereale). Poaceae is amongst the most abundant
Copyright: © 2021 by the authors.           pollen types in Germany [4] and represents the taxa with the longest pollination period [5].
Licensee MDPI, Basel, Switzerland.          Airborne Poaceae pollen in Germany can be present from mid-March to the end of October,
This article is an open access article      with the main flowering period lasting from late May to mid-July [6]. Under climate change
distributed under the terms and             conditions, pollen allergies might intensify [7,8] and thus increase and prolong the burden
conditions of the Creative Commons          for allergy-affected people. Thus, further and intensified monitoring of airborne grass
Attribution (CC BY) license (https://       pollen is crucial. This especially applies to urban areas since more than 50% of the world’s
creativecommons.org/licenses/by/            population is living in cities [9].
4.0/).

Atmosphere 2021, 12, 974. https://doi.org/10.3390/atmos12080974                                         https://www.mdpi.com/journal/atmosphere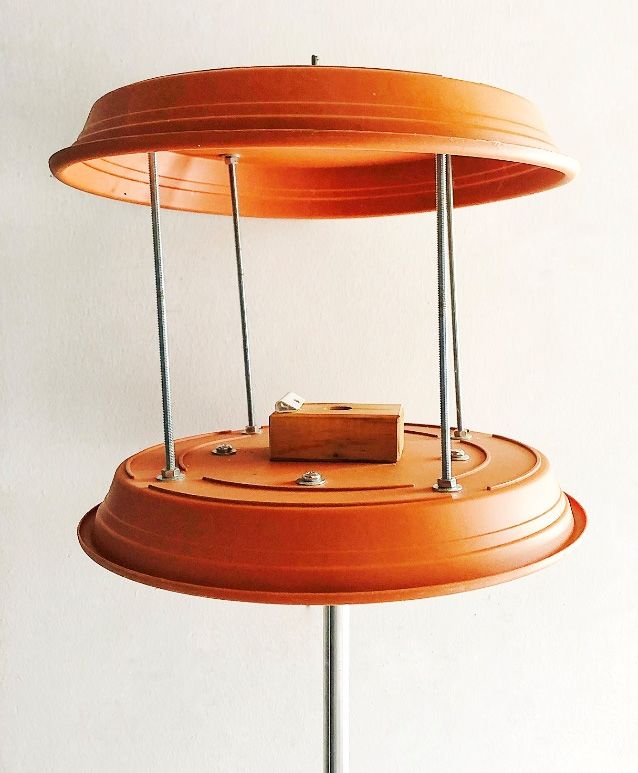
Atmosphere 2021, 12, 974                                                                                            2 of 23

                                 During spring, the media recommends that city dwellers air their rooms preferably
                           in the morning and those living in the countryside do so in the evening, when pollen
                           concentrations in the air are low. This advice is probably based on single studies and
                           therefore not sufficient to formulate general recommendations. This is confirmed by the fact
                           that many studies conducted in the last decades comparing circadian patterns of airborne
                           Poaceae pollen between urban and rural sites indicate a less explicit pattern: many studies
                           confirm comparatively low Poaceae pollen concentrations at urban sites during morning
                           hours [10–14]. In addition, high pollen counts were detected in the early evening [11],
                           but also in the morning [15] or with two peaks in the morning and afternoon [12]. For
                           rural sites, low Poaceae pollen concentrations were detected in the evening [10] and high
                           concentrations at midday [11] or not showing a distinct peak at all [15]. Even though no
                           general pattern can be used to separate rural and urban pollen conditions, small-scale
                           geographical and biological factors are important drivers for interdiurnal changes in pollen
                           concentration [16] and have to be considered.
                                 In aerobiological monitoring, a volumetric pollen trap of the Hirst design [17] is a
                           widely used instrument [18]. It is usually installed at rooftop level to capture background
                           pollen concentrations rather than pollen originating from plants in the immediate sur-
                           roundings. The area within approx. 30 km of the pollen trap is considered to influence
                           the pollen recorded by a rooftop level trap [19]. In cities, only one pollen trap is usu-
                           ally maintained, which is however related to some shortcomings, such as the following.
                           Records of a single trap do not adequately account for locally occurring events linked to
                           local pollen sources [20,21]. In addition, one trap cannot reflect pollen levels for a whole
                           city as intra-urban pollen levels may vary [22,23] due to the city’s heterogeneous features,
                           development and microclimate. Moreover, temperature differences can affect the timing of
                           pollen release [23], and urban features such as buildings and street canyons influence the
                           trajectories of air masses transporting pollen [24]. In addition, land use, local vegetation
                           distribution and management of green spaces, e.g., mowing [25], can affect local pollen
                           levels and are considered to be relevant drivers of spatial variations of airborne pollen [26].
                                 The above-mentioned studies conducted in urban areas mostly used data obtained
                           from pollen traps installed at roof level several meters above the ground, as is the stan-
                           dard [27]. This height, however, is not the average breathing height for people. Pollen
                           measured across a city at street level generally showed a considerable heterogeneity of
                           pollen concentrations [22] and should therefore be considered when evaluating intra-urban
                           pollen exposure. Nevertheless, Bastl et al. (2019) [28] found symptom data correlating
                           more with pollen concentrations measured at roof level than with concentrations measured
                           at ground level.
                                 To measure airborne pollen at street level, gravimetric traps of the Durham type [29]
                           have been used in several studies [30–32] as well as Rotorod samplers [22,33] or portable
                           volumetric samplers [26]. A few studies combine different kinds of pollen traps, such as
                           7-day volumetric traps with gravimetric traps [31,34], Rotorod samplers [24,35], nasal air
                           samplers [36,37], or portable volumetric samplers [38,39]. There are very few studies that
                           combine more than two pollen samplers: nasal air samplers, portable volumetric samplers,
                           and a 7-day volumetric trap were used by Mitakakis et al. (2000) [40]. Peel et al. (2014) [41]
                           compared the efficiencies of 7-day volumetric traps, Rotorod samplers, and portable
                           volumetric pollen traps.
                                 To build on findings from the mentioned literature and to gain new insights, this study
                           presents a novel approach using three types of pollen traps across different temporal and
                           spatial scales of grass pollen concentration and deposition across the city of Ingolstadt,
                           Germany, and its surroundings. We sampled airborne grass pollen using volumetric pollen
                           traps (7-day) at roof level at two locations for a duration of two years, gravimetric pollen
                           traps at ground level at twelve locations, and portable volumetric pollen traps at ground
                           level at eleven locations. Our central aim was to evaluate temporal variations of Poaceae
                           pollen exposure between urban and semi-rural areas taking surrounding land use and
                           management into account.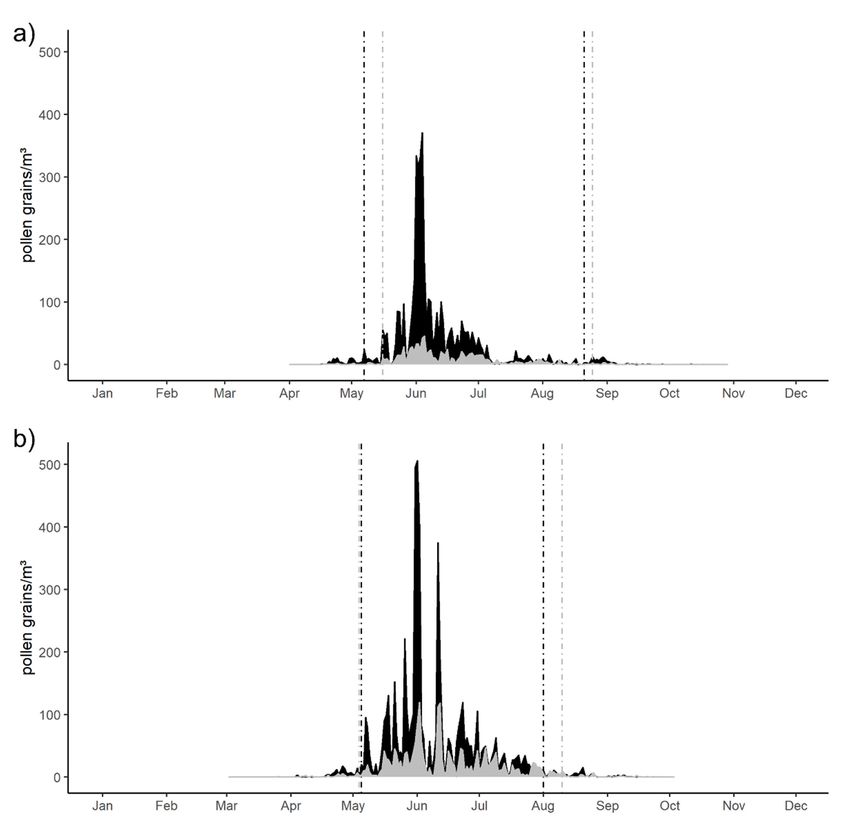
Atmosphere 2021, 12, 974                                                                                            3 of 23

                           2. Materials and Methods
                           2.1. Study Area
                                The study site was the city of Ingolstadt (48.7665◦ N, 11.4258◦ E, 374 m.a.s.l.) and
                           its surroundings. Ingolstadt is located in the southern part of Germany, in Bavaria at
                           the Danube, has a population of roughly 140,000 inhabitants, and covers an area of
                           13,335 ha [42]. The main land uses in the area surrounding Ingolstadt are industrial
                           and agricultural (Figure 1a). There are no distinct differences in altitude within the study
                           area. The average annual temperature is 8.9 ◦ C, and the average annual precipitation
                           is 712 mm (see Figure 1a for location of DWD station “Ingolstadt Flugplatz (Airport)”,
                           1981–2010). Airborne pollen sampling was conducted at various locations along an urbani-
                           sation gradient and across different land uses (Figure 1b,c). Ending points of the gradient
                           were the old town in the city centre of Ingolstadt (urban environment) and the southern
                           edge of the town of Kösching (semi-rural environment).

                           2.2. Pollen Monitoring
                           2.2.1. Volumetric Pollen Traps (7-Day)
                                 To gather data on background pollen concentration, we used two 7-day-recording
                           volumetric pollen traps (Burkard Manufacturing Co Ltd., Rickmansworth, UK) that are
                           based on the Hirst principle [17]. Using an integrated pump, this pollen trap aspirates 10 L
                           of air per minute through a 14 × 2 mm orifice. A rotating drum is mounted behind this
                           orifice, on which a plastic strip (Melinex, DuPont Teijin Films, Luxembourg), coated with
                           a thin layer of pharmaceutical Vaseline, is attached. Aspirated pollen and other airborne
                           particles adhere to the Melinex tape. The drum moves with a speed of 2 mm per hour and
                           completes one revolution in seven days. The drum was changed once per week, and daily
                           samples were prepared in the laboratory. One trap was set up in the city centre of Ingolstadt,
                           on the roof of Ingolstadt School of Management of the University of Eichstätt-Ingolstadt
                           (48.7658◦ N, 11.4156◦ E) at a height of 13 m a.g.l., representing urban conditions (urban
                           station (US)). The other trap was located northeast of this location at a straight-line distance
                           of approx. 7 km on the roof of the secondary school of Kösching (48.8084◦ N, 11.483◦ E)
                           at a height of 15 m a.g.l., representing semi-rural conditions and therefore referred to as
                           semi-rural station (SRS) (Figure 1b). In order to cover the main flowering period (late-May
                           to mid-July [6]), the traps operated from 1 April to 21 October (semi-rural station) and
                           24 April to 30 October (urban station) in 2019. In 2020, the traps operated from 30 January
                           to 27 September 2020 (semi-rural station) and 11 February to 3 October 2020 (urban station).
                           The sampling periods differed slightly due to the accessibility of the buildings. Sampling
                           was performed according to the standard methods proposed by the European Aerobiology
                           Society [27].

                           2.2.2. Gravimetric Pollen Traps—Sampling Network
                                 During spring and summer, a network of twelve gravimetric pollen traps was es-
                           tablished. These traps were self-constructed, and their design was based on Durham
                           samplers [29]. Our traps consisted of two horizontal circular disks with a diameter of 34 cm
                           and a downward sloping rim. The disks were made of plastic and fitted at a distance of
                           20 cm from each other with four threaded rods holding them in place. In the centre of
                           the lower disk, a wooden block (L × W × H = 5.5 cm × 9.5 cm × 3 cm) was bolted and
                           equipped with a clip on top to secure the microscope slide horizontally (see Figure 2). The
                           microscope slides were coated with Vaseline to adhere to airborne particles.
                                 The traps were set up at and between the urban station (US) and semi-rural station
                           (SRS) (Figure 1), mounted on a metal pipe at a height of 1.8 m a.g.l., reflecting the breathing
                           height of people. Locations were selected based on representativeness of different envi-
                           ronments, i.e., the rate of urbanisation and land use (Table 1), but also on accessibility and
                           security. The stations were numbered (G1-G12) according to the distance from the urban
                           station (US). Furthermore, we noted management of adjacent Poaceae area and land use in
                           the surroundings. Sampling lasted from 30 May to 22 August (2019) and from 22 April to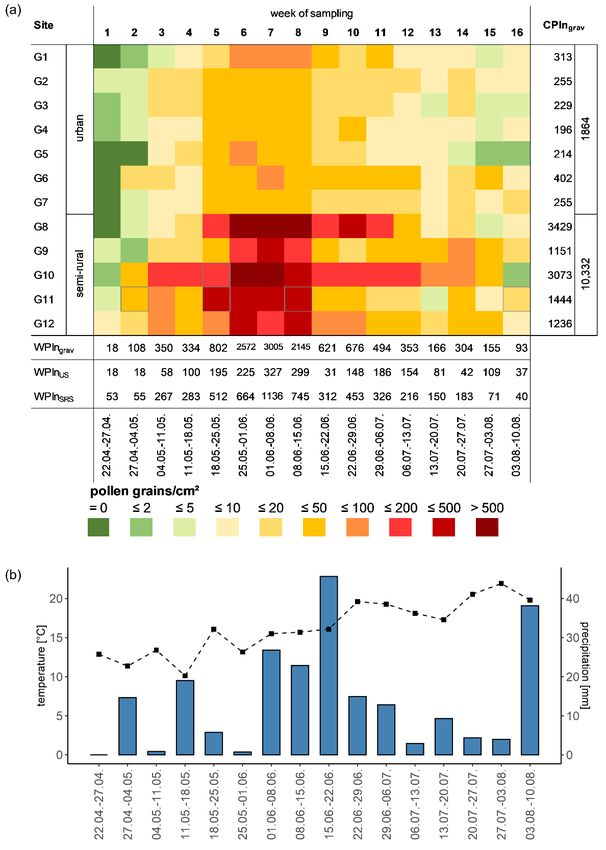
Atmosphere 2021, 12, 974                                                                                            4 of 23

                           10 August (2020) in order to cover the majority of the main flowering period (ca. late-May
                           to mid-July [6]). Sites were equipped with pollen traps later in 2019 due to organizational
                           issues, e.g., related to permissions. Microscope slides were changed every seven days
                           between 8 a.m. and 10 a.m., with the exception of the first week of sampling in 2020, where
                           the sampling period was only 5 days. In total, we collected 140 slides in 2019 and 187 slides
                           in 2020. Due to heavy winds and the damage of a pollen trap, data of nine slides (four in
                           2019, five in 2020) were missing.

                           2.2.3. Personal Volumetric Air Samplers—Sampling Campaign
                                We used personal volumetric air samplers (PVAS; Burkard Manufacturing Co Ltd.,
                           Rickmansworth, England) that are based on the Hirst principle [17] for a sampling cam-
                           paign in 2019. PVAS were mounted on tripods at a height of ca. 1.5 m and set to aspirate
                           10 L of air per minute. Air aspirates through a horizontally oriented orifice, and the airborne
                           particles contained in It adhere to a microscope slide coated with Vaseline.
                                Sampling was conducted during the Poaceae pollen season on seven consecutive days,
                           13 June 2019–19 June 2019, and at eleven locations. Four sites were located in a semi-rural
                           setting (“SR”), three sites in a residential area (“R”) and four sites in the city centre of
                           Ingolstadt (“U”) (see Figure 1 for locations and Table 2 for location characteristics). Pollen
                           was sampled for 25 min at each site three times a day: 6 a.m. to 8 a.m., 12 p.m. to 2 p.m.,
                           and 9 p.m. to 11 p.m.

                           2.2.4. Sample Preparation
                                 After exposure, the Melinex tape and microscope slides were fixed with a mixture of
                           distilled water, gelatine, glycerol, and staining safranin. The samples were analysed under
                           a light microscope (Axio Lab.A1; Zeiss, Wetzlar, Germany) using ×400 magnification. No
                           distinction between individual genera or species of the Poaceae family were made, as
                           Poaceae pollen grains share the same characteristics using light microscopy [43,44]. Grass
                           pollen were counted along three longitudinal transects in the case of the 7-day volumetric
                           traps (resulting in a screening of 10.3% of the whole slide) and along four longitudinal
                           transects in the case of the gravimetric traps. In the case of the PVAS samples, the whole
                           slide was examined. For further analyses, pollen counts were converted to pollen grains
                           per cubic meter of air (pollen grains/m3 ) for volumetric traps as is the standard [27]. Pollen
                           counts for the gravimetric traps were converted to pollen grains per square centimetre of
                           slide surface (pollen grains/cm2 ).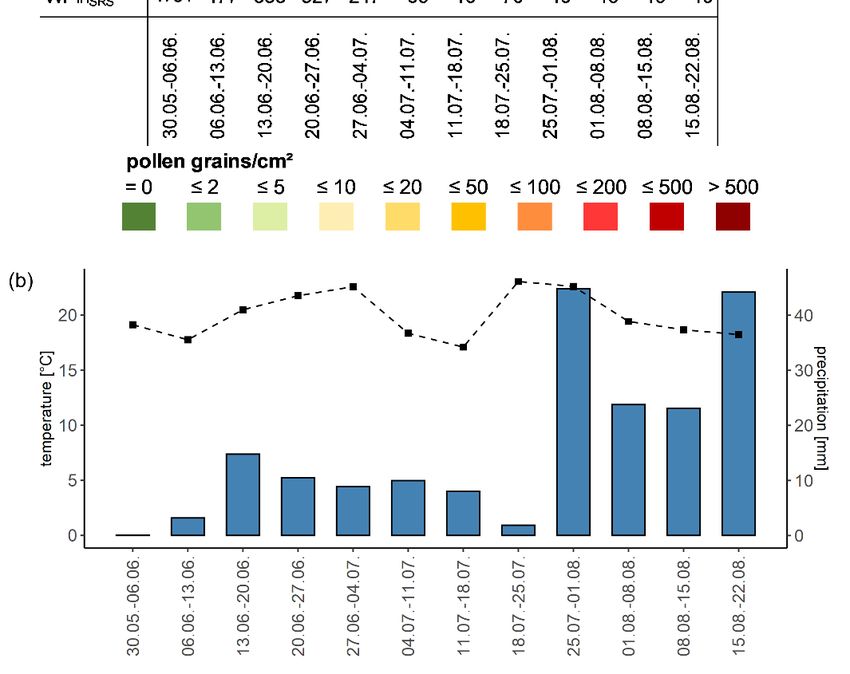
Atmosphere 2021, 12, 974 5 of 23
Atmosphere 2021, 12, x FOR PEER REVIEW 5 of 26
184
Figure
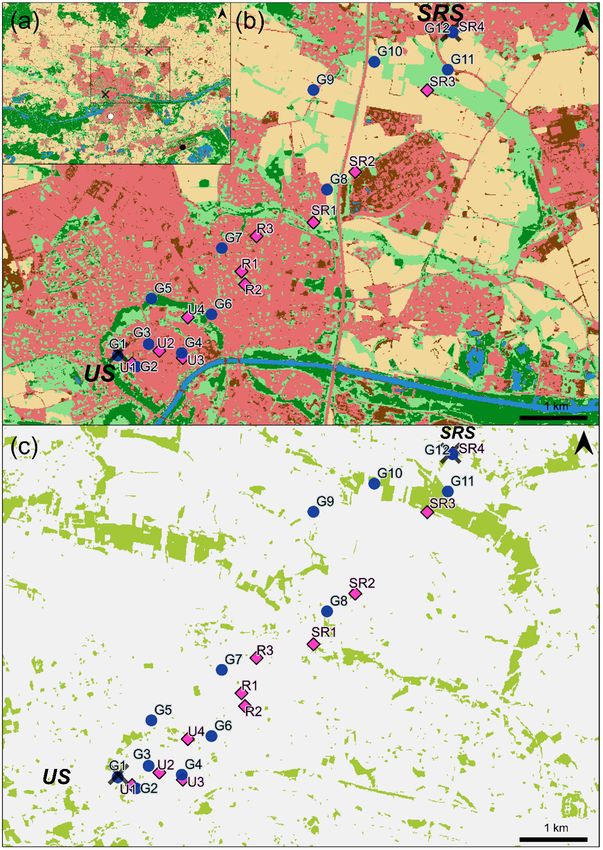
Figure 1. Locations
1. Locations of of pollen
pollen traps:Blue
traps: Bluecircles—gravimetric
circles—gravimetric traps;
traps;pink
pinksquares—PVAS;
squares—PVAS; black crosses—volumetric
black pollen
crosses—volumetric pollen 185
traps (roof level); (a) Study area (dashed box) and surrounding land use; white circle—station measuring precipitation
traps (roof level); (a) Study area (dashed box) and surrounding land use; white circle—station measuring precipitation (LfU); 186
(LfU); black circle—weather station (DWD); (b) Land use 2019: dark green—forest; light green—low vegetation; blue— 187
black circle—weather station (DWD); (b) Land use 2019: dark green—forest; light green—low vegetation; blue—water;
water; red—built-up; dark brown—bare soil; light brown—agriculture [45]; (c) Grassland 2018: green—grass area [46]. 188
red—built-up; dark brown—bare soil; light brown—agriculture [45]; (c) Grassland 2018: green—grass area [46].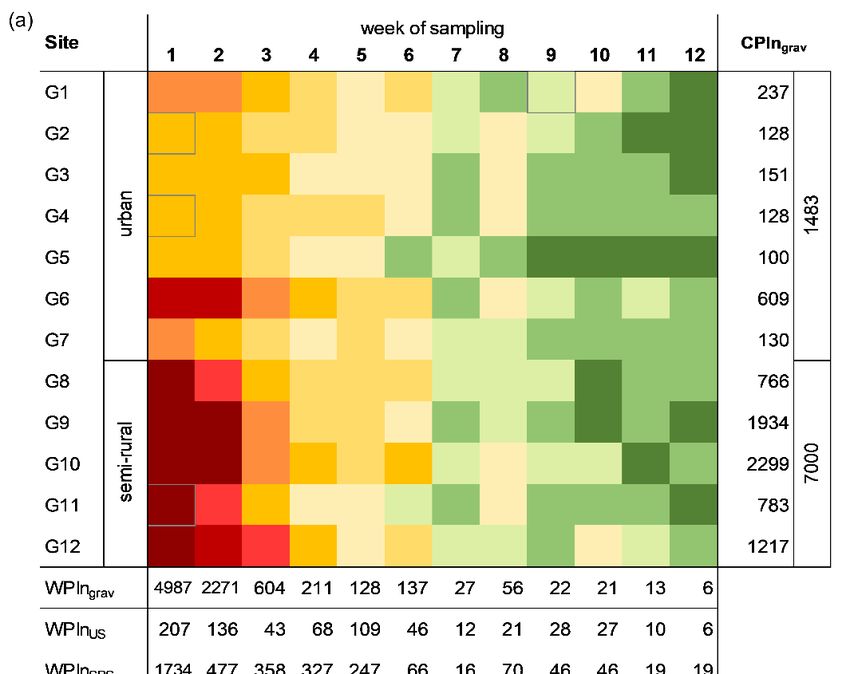
Atmosphere 2021, 12, 974                                                                                                                                                                        6 of 23

      Table 1. Sampling locations and surroundings of gravimetric pollen traps. Grass cover [46] and land cover [45] within 100 m of the traps (see methodology section for calculation). Land
      cover class “water” is not listed as its values equalled 0 for all sampling locations. Station codes G1 to G12 (G = gravimetric) ascending with distance from the urban station (US).

                                      Distance from                Grass                  Land Cover Classification [%]
 Station          Coordinates                          Urban                                                                             Description of Immediate Surrounding and
                                      Urban Station                Cover                  Low                       Bare
  Code                                                 Index                 Forest                    Built-Up          Agriculture Management of Poaceae Area within a Radius of 100 m
                                       (US) [km]                    [%]                Vegetation                   Soil
                                                                                                                                           Green space of the Ingolstadt School of Management;
    G1       48.7650◦ N, 11.4153◦ E         -            0.51        6          8          29             62         1          0        irregular-cut Poaceae area, allowing it to flower for short
                                                                                                                                                                    periods.
                                                                                                                                             Fully secluded courtyard of two-story houses with
    G2       48.7635◦ N, 11.4190◦ E       0.32           0.53        0          0           1             98         1          0            ornamental plants; sealed inner-city areas with no
                                                                                                                                                                 Poaceae area.
                                                                                                                                         Half-secluded driveway to apartment building complex
    G3       48.7665◦ N, 11.4216◦ E       0.49           0.58        0          0           0             99         1          0           with small backyard; sealed inner-city areas with no
                                                                                                                                                                 Poaceae area.
                                                                                                                                           Courtyard of three-story apartment complex with cut
    G4       48.7653◦ N, 11.4283◦ E       0.95           0.62        0          0           1             93         6          0          lawn and playground; sealed inner-city areas with no
                                                                                                                                                                 Poaceae area.
    G5       48.7726◦ N, 11.4221◦ E       0.98           0.64        0         60          16             24         0          0                 City park area; unmanaged Poaceae area.
                                                                                                                                             Small green area at an intersection of a busy street;
    G6       48.7705◦ N, 11.4343◦ E       1.52           0.64        0          3           7             89         1          0         irregular cut Poaceae area allowing flowering for short
                                                                                                                                                                    periods.
                                                                                                                                          Green area with short cut grass of apartment buildings
    G7       48.7793◦ N, 11.4364◦ E       2.22           0.61        0          1          16             82         1          0         next to a multilane street; residential and half-industrial
                                                                                                                                                           area; regularly cut lawn.
                                                                                                                                          Residential area with freestanding houses with gardens
                                                                                                                                          and agricultural land; 2019: field with Poaceae was cut
    G8       48.7871◦ N, 11.4577◦ E       3.97           0.38        22         0          19             40         0         41         occasionally allowing flowering for short periods; 2020:
                                                                                                                                            Field with Poaceae was cut once in August allowing
                                                                                                                                                        flowering for longer periods.
   G9        48.8003◦ N, 11.4549◦ E       4.89           0.26         0         0           2              9         1         88               Agricultural land; unmanaged Poaceae area.
   G10       48.8041◦ N, 11.4672◦ E       5.79           0.27        25         4          34              2         1         59               Agricultural land; unmanaged Poaceae area.
   G11       48.8030◦ N, 11.4821◦ E       6.48           0.26        39         0          52             16         3         29               Agricultural land; unmanaged Poaceae area.
                                                                                                                                           Green area next the secondary school of Kösching and
   G12       48.8080◦ N, 11.4831◦ E       6.91           0.26        11         0           4             30         15        50        agricultural land; occasionally cut Poaceae area, allowing
                                                                                                                                                         flowering for short periods.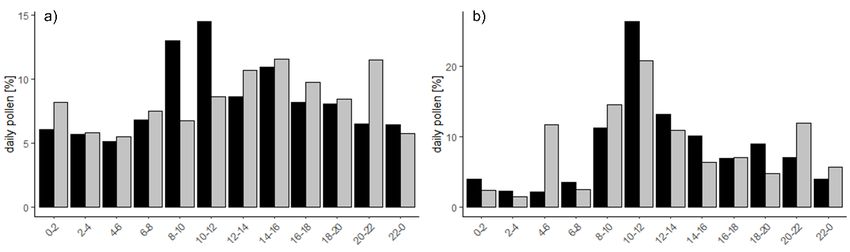
Atmosphere 2021, 12, 974                                                                                                                                                                     7 of 23

      Table 2. Sampling locations and surroundings of PVAS. Grass cover [46] and land cover [45] within 100 m of the traps (see methodology section for calculation). Land cover class “water”
      is not listed as its values equalled 0 for all sampling locations. Classification of station code: U = urban, R = residential, SR = semi-rural.

                                                                   Gras                   Land Cover Classification [%]
 Station          Coordinates         Distance from    Urban                                                                             Description of Immediate Surrounding and
                                                                   Cover                  Low                       Bare
  Code                                  US [km]        Index                 Forest                    Built-Up          Agriculture Management of Poaceae Area within a Radius of 100 m
                                                                    [%]                Vegetation                   Soil
                                                                                                                                           Courtyard of an apartment building. Almost fully
    U1       48.7639◦ N, 11.4182◦ E       0.26          0.53         0         2           13             82         3         0
                                                                                                                                                        enclosed; no Poaceae area.
                                                                                                                                        Open public space and streets, completely sealed area; no
    U2       48.7656◦ N, 11.4238◦ E       0.61          0.59         1         0            3             96         1         0
                                                                                                                                                               Poaceae area.
                                                                                                                                         Wide street in pedestrian zone, completely sealed area;
    U3       48.7646◦ N, 11.4285◦ E       0.96          0.61         0         0            1             95         4         0
                                                                                                                                                             no Poaceae area.
                                                                                                                                             Sidewalk of a main street, little park area with
    U4       48.7700◦ N, 11.4295◦ E       1.16          0.64         15        16          55             26         2         0
                                                                                                                                                        unmanaged Poaceae area.
                                                                                                                                             Residential area with single-family houses with
    R1       48.7762◦ N, 11.4404◦ E       2.19          0.59         0         0           12             88         0         0         maintained front and back yards; Poaceae areas/lawns
                                                                                                                                                   cut regularly preventing flowering.
                                                                                                                                            Residential area, maintained public playground
    R2       48.7745◦ N, 11.4411◦ E       2.14          0.60         0         0           33             66         0         0            surrounded by houses; Poaceae areas/lawns cut
                                                                                                                                                     regularly preventing flowering.
                                                                                                                                         Residential area with multi-story apartment buildings;
    R3       48.7809◦ N, 11.4434◦ E       2.68          0.53         6         0           13             81         6         0
                                                                                                                                        Poaceae areas/lawns cut regularly preventing flowering.
                                                                                                                                            Edge of a residential area with allotment gardens
   SR1       48.7827◦ N, 11.4549◦ E       3.48          0.47         10        18          45             17         0         20           neighbouring agricultural land; unmanaged and
                                                                                                                                                      occasionally cut Poaceae area.
                                                                                                                                         Agricultural land; between country road, highway and
   SR2       48.7894◦ N, 11.4634◦ E       4.42          0.32         15        5           28             12         7         47
                                                                                                                                                industrial area; unmanaged Poaceae area.
   SR3       48.8003◦ N, 11.4779◦ E       6.01          0.27         48        0           46              2         6         46             Agricultural land; unmanaged Poaceae area.
                                                                                                                                        Green area next to the secondary school of Kösching and
   SR4       48.8081◦ N, 11.4831◦ E       6.88          0.26         11        0            8             37        13         42       agricultural land; occasionally cut Poaceae area, allowing
                                                                                                                                                       flowering for short periods.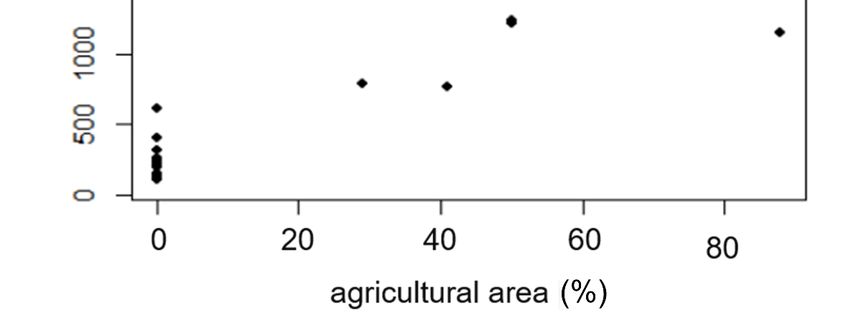
Atmosphere 2021, 12, x FOR PEER REVIEW 8 of 25
Atmosphere 2021, 12, 974 8 of 23
Figure 2.
Figure 2. Self-constructed
Self-constructed gravimetric
gravimetric pollen
pollen trap
trap used
used for
for this
this study.
study.
2.3. Analyses
2.3. Analyses
2.3.1. Aerobiological Data
2.3.1. Aerobiological Data
We used the recommended terminology by Galán et al. (2017) [47] to describe the
We used the
aerobiological datarecommended
recorded by the terminology by [47] to
7-day volumetric describe
traps. Starttheandaerobiological
end dates ofdata the
recorded by the 7-day volumetric traps. Start and end dates of
Poaceae pollen seasons were calculated using the 95% method [48]: the pollen season starts the Poaceae pollen seasons
were 2.5%
when calculated
of the using
annualthe 95%amount
pollen methodis[48]: the pollen
collected and ends season
whenstarts
97.5%when 2.5%
of total of the
pollen is
annual pollen amount is collected and ends when 97.5% of total
collected. We calculated the Seasonal Pollen Integral (SPIn), i.e., the sum of the daily mean pollen is collected. We
calculated
pollen the Seasonal
concentrations Pollen Integral
(pollen*day/m (SPIn),the
3 ) during i.e.,pollen
the sum season of the
[47].daily mean pollen
Furthermore, we
concentrations (pollen*day/m³) during the pollen season
determined the lengths, start and end days of the seasons, and the days with the highest [47]. Furthermore, we
determined
daily the lengths, start
mean concentration. Daysandwith end days mean
a daily of thepollen
seasons, and the days
concentration with
of at leastthe
50highest
pollen
daily mean
grains/m concentration.
3 were classified as Days
highwith
pollena daily
days,mean pollen concentration
as suggested by Pfaar et al.of (2019)
at least 50
[49].
pollen grains/m³ were classified as high pollen days, as suggested
Missing data (2019: 17 days, 2020: 8 days) were interpolated by calculating the moving by [49]. Missing data
(2019:of17daily
mean days,pollen
2020:concentrations
8 days) were interpolated
(7-day volumetric by calculating
traps) using thethe
moving
method mean of daily
included in
pollen concentrations (7-day volumetric traps) using the
the R-package [50]. We analysed diurnal patterns by examining two-hourly variations method included in the inR-
package
grass [50].Missing
pollen. We analysed data fordiurnal patternstraps
gravimetric by examining
(2019: 4 out two-hourly variations
of 144 entries; 2020: 5inoutgrass
of
pollen.
192 Missing
entries) were data for gravimetric
interpolated traps (2019:
by calculating the mean 4 out of 144 entries;
of previous 2020: 5 out
and following of 192
values of
entries)
the were interpolated
respective and the two by calculating
closest traps. the mean of previous and following values of the
respective and the
In addition twostandard
to the closest traps.
terminology, we used the following terms to describe and
In addition
compare data: to the standard terminology, we used the following terms to describe and
•compare data: Pollen Integral (CPIn)
Campaign
• Campaign Pollen Integral (CPIn)
# The sum of all measurements for each location during one sampling campaign,
o The sum of all measurements for each location during one sampling campaign,
i.e., CPIngrav and CPInPVAS [51].
i.e., CPIngrav and CPInPVAS [51].
•• Weekly
WeeklyPollenPollenIntegral
Integral(WPIn)
(WPIn)
#o Thesum
The sumof ofall
all daily
daily means
means of of one week of background
background pollen pollen concentration,
concentration,
i.e., WPIn
i.e., WPInUS for volumetric
USfor volumetric trap attrap at US (roof level), and WPIn
level), and WPInSRS SRS for volumetric
volumetric
trapatatSRS
trap SRS(roof
(rooflevel).
level).
#o Thesum
The sum of of all
all gravimetric
gravimetric measurements
measurements of of all
all locations
locations forfor one
one particular
particular
week,i.e.,
week, i.e., WPIn
WPIngrav Werefer
gravWe refer toto the
the week
week withwith thethe highest
highestWPIn
WPIngrav grav as
as aa peak
peak
week of the
week of the campaign. campaign.
•• Daily
Daily Pollen
Pollen Integral
Integral (DPIn)
(DPIn)
# o The
The sum of all PVASmeasurements
sum of all PVAS measurements of of one
one day,
day, i.e.,
i.e., DPIn
DPInPVAS .
PVAS .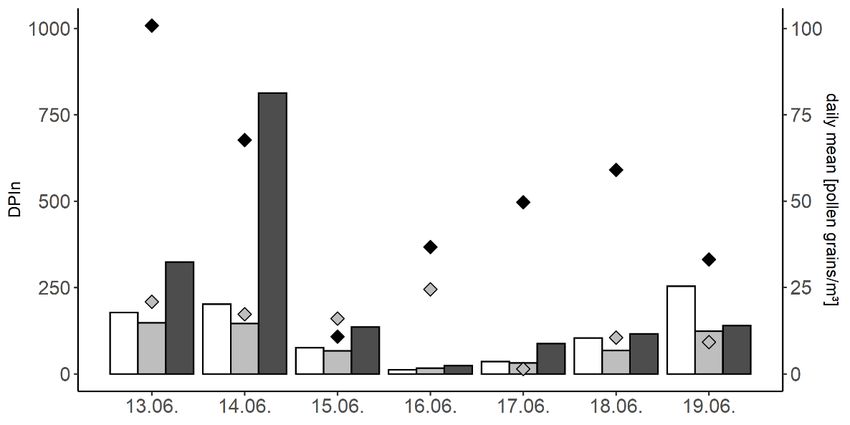
Atmosphere 2021, 12, 974                                                                                             9 of 23

                                We analysed data in regard to spatial and temporal variations and diurnal patterns
                           by comparing CPIn, WPIn, and DPIn, as well as means and medians. Sites (gravimetric
                           traps, PVAS) and measurement times (PVAS) were tested for significant differences using
                           Wilcoxon rank-sum test and Kruskal–Wallis test. The relationships between WPIns or DPIns
                           of different traps were analysed by calculating Spearman’s correlation coefficient (rs ).

                           2.3.2. Land Cover and Grass Cover
                                 Information on land cover for the year 2019 was obtained from [45]. This dataset
                           provides the land cover classifications “forest”, “low vegetation”, “water”, “built-up”, “bare
                           soil”, “water”, and “agriculture” for Germany with a spatial resolution of 10 m × 10 m. We
                           calculated the percentage of each class in a radius of 100 m from all sampling locations. In
                           addition, we used the Grassland 2018 dataset [46] with a spatial resolution of 10 m × 10 m
                           to calculate the percentage of grassland in a radius of 100 m. We calculated the Urban
                           Index as a measure of urbanisation [52] based on the 2019 land cover data for all sampling
                           locations. The relationships between these variables and pollen concentrations and pollen
                           deposition (CPIns) were analysed by calculating Spearman’s correlation coefficients (rs ).

                           2.3.3. Meteorological Data
                                Weather data, i.e., air temperature, wind speed, and wind direction, for the period
                           of the sampling campaigns were obtained from the DWD station “Ingolstadt (Flugplatz)”
                           (48.7112◦ N, 11.5362◦ E, see. Figure 1a). Precipitation data were obtained from a station
                           operated by the Bavarian Environment Agency (LfU) (48.74286◦ N, 11.42355◦ E, Figure 1a).
                           For the duration of the sampling campaigns with gravimetric traps, we calculated weekly
                           means for temperature, weekly sums for precipitation and the frequency of counts by wind
                           direction for each sampling week starting at 8 a.m. For the duration of the PVAS sampling
                           campaign, we calculated hourly means (temperature), hourly sums (precipitation), and the
                           frequency of counts by wind direction for each day of sampling, from the start of the first
                           measurement (6 a.m.) to the end of the last measurement (11 p.m.).
                                We used RStudio (1.3.959), packages AeRobiology 2.0.1 [50], OpenAir 2.8-1 [53],
                           ggplot2 [54] for statistical analyses and visualisation. For spatial analyses, we used ESRI
                           ArcMap 10.6 and for visualisation QGIS 3.14 and Microsoft Excel 2016.

                           3. Results
                           3.1. Background Pollen Concentration: Characteristics of the Grass Pollen Seasons 2019 and 2020
                                The pollen seasons of both years and locations (urban station (US), semi-rural station
                           SRS) showed different characteristics (Figure 3). We observed differences in SPIn, length of
                           the pollen seasons, peak values, peak dates, and number of high-pollen days (Table 3). In
                           both years, grass pollen concentration was generally higher at SRS, as shown by SPIn (2019:
                           4071 pollen*day/m3 , 2020: 5725 pollen*day/m3 vs. US 2019: 933 pollen*day/m3 , 2020:
                           2104 pollen*day/m3 ) but also by peak values and number of high-pollen days. In 2019,
                           there were no high-pollen days recorded at the urban station but 25 at the SRS. However,
                           in 2020, we detected six high-pollen days at the US and 33 at the SRS. Peak values at the
                           SRS were eight times (2019) and more than four times (2020) higher than the ones recorded
                           at the US. This is also reflected by SPIn (more than four times higher at the SRS in 2019,
                           almost three times higher in 2020). Grass pollen season always started in May; in 2020,
                           12 days earlier at the US than in 2019. At the SR, the difference was smaller, as grass pollen
                           season only started two days earlier in 2019. The pollen season ended in August, and the
                           length of the season was almost identical for the US (−3 days in 2020) but 18 days longer
                           in 2020 for the SRS. Thus, the year 2020, was (partly) a longer and more intense Poaceae
                           pollen season. The start of the season was 9 days later at the US in 2019 but 1 day earlier in
                           2020 compared to the SRS. Instead, the end of the season was always recorded later at the
                           US (2019: 4 days, 2020: 9 days), resulting in a shorter period in 2019 (−5 days) and a longer
                           period in 2020 (+10 days).
Atmosphere 2021, 12, x FOR PEER REVIEW 3 of 26
pollen season. The start of the season was 9 days later at the US in 2019 but 1 day earlier 279
in 2020 compared to the SRS. Instead, the end of the season was always recorded later at 280
Atmosphere 2021, 12, 974
the US (2019: 4 days, 2020: 9 days), resulting in a shorter period in 2019 (-5 days) and a10 of281
23
longer period in 2020 (+10 days). 282
283
FigureFigure 3. Poaceae
3. Poaceae pollen
pollen concentration
concentration (daily
(daily meanmean values)
values) forthe
for theSRS
SRS(black)
(black) and
and US
US (grey)
(grey)locations
locationsinin
thethe
greater area
greater area of 284
of Ingolstadt. Dashed lines indicate start and end dates of the corresponding grass pollen season (a) 2019
Ingolstadt. Dashed lines indicate start and end dates of the corresponding grass pollen season (a) 2019 and (b) 2020. and (b) 2020. 285
Table 3. Characteristics of the grass pollen season 2019 and 2020 for US (urban station) and SRS (semi-rural station) in the 286
Table 3. Characteristics of the grass pollen season 2019 and 2020 for US (urban station) and SRS (semi-rural station) in the
greater area of Ingolstadt. 287
greater area of Ingolstadt.
US SRS
2019 US 2020 2019 SRS 2020
Seasonal Pollen Index (SPIn) 2019 2020 2019 2020
3
933 2104 4071 5725
(pollen*day/m³)
Seasonal Pollen Index (SPIn) (pollen*day/m ) 933 2104 4071 5725
Length
Length of season
of season (days)
(days) 102102 99 99 107107 89 89
StartStart
day/day
day/dayof year
of year 16.05/136
16.05/136 04.05/125
04.05/125 07.05/127
07.05/127 05.05/126
05.05/126
EndEnd
day/day of year
day/day of year 25.08/237
25.08/237 10.08/223
10.08/223 21.08/233
21.08/233 01.08/214
01.08/214
PeakPeak
day/day of year
day/day of year3 05.06/156
05.06/156 02.06/154
02.06/154 04.06/155
04.06/155 01.06/153
01.06/153
PeakPeak
value (pollen grains/m ) 46 120 371 506
value (pollen grains/m³) 46 120 371 506
High pollen days 0 6 25 33
3.2. Gravimetric Pollen Traps
3.2.1. Sampling Campaign 2019
In general, semi-rural locations were linked to higher values for pollen deposition
and urban locations to lower values, as illustrated in the heat map in Figure 4a. The
course of grass pollen deposition cannot be described for the whole season, as sampling
started when the season had already begun. In the first week of measurement, however,
peak values at most sites were reached. The highest weekly pollen deposition during
sampling (max. 1440 pollen grains/cm2 ) and CPIngrav (max. 2299) were recorded at theAtmosphere 2021, 12, 974 11 of 23
sites G9, G10, and G12, which are situated in the semi-rural environment. The lowest
values (i.e., CPIngrav = 128) were measured at G2 and G4, located in the inner city, and
were partially secluded by buildings, e.g., in courtyards (see Table 1 for details). Pollen
deposition in the peak week (30.5. to 6.6.), the week with the highest WPIngrav , was
highest at G10 (semi-rural) with 1140 pollen grains/cm2 and lowest at G4 (urban) with
39 pollen grains/cm2 (approx. 3.5% of G10). The site with the highest CPIngrav was
G10 (CPIngrav = 2299 pollen grains/cm2 ), and the lowest CPIngrav was recorded for G5
(urban park; CPIngrav = 100 pollen grains/cm2 ). Kruskal–Wallis test revealed
Atmosphere 2021, 12, x FOR PEER REVIEW 5 ofno
26 significant
difference between sites (Kruskal–Wallis chi-squared = 7.301, p-value = 0.774).
305
Figure4.4.(a)(a) Heat map showing weekly 2 in 2019 for the
Figure Heat map showing weekly grass grass
pollenpollen deposition
deposition (pollen grains/cm
(pollen grains/cm²) in 2019 for )the 306
samplingcampaign
sampling campaignFigure 30 May
figure 30 Mayto 22
toAugust 20192019
22 August and WPIn
and WPIn US andUS and
WPIn SRSWPIn
for theSRS for the respective
307
respective weeks. Gravimetric
weeks. Gravimetric traps aretraps are ordered
ordered by distance
by distance from from the urban
the urban station
station (US).
(US). A grey
A grey outline 308
indicates
outline indicates interpolated values. (b) Weekly mean temperature (black squares/dotted line) 309
interpolated values. (b) Weekly mean temperature (black squares/dotted line) and weekly sum
and weekly sum of precipitation (blue bars) during the sampling campaign with gravimetric traps 310
of precipitation
from 30 May to 22(blue bars)
August during the sampling campaign with gravimetric traps from 30
2019. May to
311
22 August 2019.
During sampling, mean temperature was 19.9 °C, and precipitation sum was 193 mm 312
(Figure 4b). There was no week without precipitation. In the week with the highest 313
WPIngrav, we recorded 1 mm of rain. During sampling, the wind came predominantly from 314Atmosphere 2021, 12, 974 12 of 23
During sampling, mean temperature was 19.9 ◦ C, and precipitation sum was 193 mm
(Figure 4b). There was no week without precipitation. In the week with the highest
WPIngrav , we recorded 1 mm of rain. During sampling, the wind came predominantly
from the west, the southwest, and the northwest. The mean wind speed was 1.3 m/s. In
the first weak of sampling, there was mostly westerly wind with a mean wind speed of
2.5 m/s.
3.2.2. Sampling Campaign 2020
In 2020, semi-rural sites were again linked to higher values of pollen deposition
(Figure 5a). The course of the grass pollen season can be seen in the heat map (Figure 5a).
The peak around the first week of June (week 7) can also be found for both WPInUS and
WPInSRS . Pollen deposition in the peak week (1 June–8 June) was highest at G8 (semi-rural),
with 954 pollen grains/cm2 and lowest at G4 (urban) with 27 pollen grains/cm2 (approx.
2.8% of G10). Furthermore, the highest single and total values were recorded at G10 and
G12, both situated in the semi-rural environment. Kruskal–Wallis test and Wilcoxon rank
-sum test revealed significant differences between sites: all significant differences occurred
between semi-rural and urban sites; this means pollen deposition of every urban site was
significantly different from at least the values of one semi-rural site (Table 4).
Table 4. Pairwise comparisons of pollen deposition 2020 between all sites using Wilcoxon rank sum test, bold values
indicate significant differences (p < 0.05).
Urban Semi-Rural
G1 G2 G3 G4 G5 G6 G7 G8 G9 G10 G11
G2 0.756 - - - - - - - - - -
G3 0.985 0.969 - - - - - - - - -
G4 0.937 0.400 0.837 - - - - - - - -
urban
G5 0.758 0.473 0.754 0.855 - - - - - - -
G6 0.235 0.273 0.168 0.055 0.110 - - - - - -
G7 0.760 1 0.762 0.415 0.492 0.235 - - - - -
G8 0.235 0.489 0.400 0.220 0.201 0.836 0.534 - - - -
G9 0.117 0.095 0.082 0.033 0.042 0.534 0.087 0.985 - - -
semi-rural G10 0.010 0.007 0.006 0.006 0.006 0.010 0.006 0.510 0.105 - -
G11 0.087 0.087 0.078 0.029 0.042 0.471 0.140 0.888 0.834 0.220 -
G12 0.028 0.029 0.022 0.010 0.011 0.147 0.029 0.816 0.534 0.201 0.770
During sampling, the mean temperature was 16.4 ◦ C and the precipitation sum was
222.9 mm. There was no rain in the first week of sampling, and less than 1 mm in the 6th
week. In the peak week, we recorded 26.8 mm of rain (Figure 5b). During sampling, the
wind came predominantly from the west, east and northeast. The mean wind speed was
2.3 m/s. In the peak week, the predominant wind direction was western; the mean wind
speed was 2.5 m/s.
3.2.3. Land Use
Table 2 gives an overview of the land use surrounding the traps. Based on the
Grassland 2018 dataset [46], locations with a grass area in a radius of 100 m surrounding
the traps were only documented for five sites: G11 (39%), G10 (25%), G8 (22%), G12 (11%),
and G1 (6%). We investigated the relationship of CPIn and grass cover, land cover and
urban index in the surrounding 100 m (Tables 1 and 2) of the respective trap locations. The
highest correlation coefficient was revealed for CPIn and the percentage of agricultural
area (rs = 0.836, p < 0.005) (Figure 6), the lowest for the percentage of grass cover (rs = 0.692,
p < 0.005), and a negative correlation for Urban Index (rs = −0.726, p < 0.005).Atmosphere 2021, 12, 974 13 of 23
here 2021, 12, x FOR PEER REVIEW 7 of 26
335
Figure 5. (a)Figure
Heatmap 2 ) in 2020 for the sampling campaign
5. (a)showing
Heatmap weekly grass
showing pollen
weekly deposition
grass (pollen grains/cm
pollen deposition (pollen grains/cm²) in 2020 for the 336
from 22 April to 10 August
sampling 2020,from
campaign WPIn22 , WPIn
April
grav US ,August
to 10 and WPIn
2020, for the
SRSWPIn gravrespective weeks.
, WPInUS, and WPInGravimetric
SRS for the traps are ordered
337
by distance respective
from the urban station
weeks. (US). A traps
Gravimetric grey outline indicates
are ordered interpolated
by distance from values;
the urban (b) station
weekly(US).
meanAtemperature
grey (black
338
outline
squares/dotted indicates
line) interpolated
and weekly values; (b) weekly
sum of precipitation (blue mean temperature
bars) during (black squares/dotted
the sampling campaign withline)gravimetric 339
traps
from 22 Aprilandto weekly
10 August sum2020.
of precipitation (blue bars) during the sampling campaign with gravimetric traps 340
from 22 April to 10 August 2020. 341
342Grassland 2018 dataset [46], locations with a grass area in a radius of 100 m surrounding 347
the traps were only documented for five sites: G11 (39%), G10 (25%), G8 (22%), G12 (11%), 348
and G1 (6%). We investigated the relationship of CPIn and grass cover, land cover and 349
urban index in the surrounding 100 m (Tables 1 and 2) of the respective trap locations. 350
The highest correlation coefficient was revealed for CPIn and the percentage of 351
Atmosphere 2021, 12, 974 agricultural area (rs = 0.836, p < 0.005) (Figure 6), the lowest for the percentage of grass 352 14 of 23
cover (rs = 0.692, p < 0.005), and a negative correlation for Urban Index (rs = −0.726, p < 353
0.005). 354
355
Figure
Figure 6. Scatterplot
6. Scatterplot showing
showing the relationship
the relationship of CPIn
of CPIn of both years of
andboth years andofthe percentage
the percentage 356 of agricultural
agricultural
area withinareaawithin
100 m a 100 m radius
radius of each
of each sampling location.
sampling location. 357
3.3. PVAS Sampling Campaign 2019
3.3.1. Daily Variation
DPInPVAS for locations in semi-rural (SR), urban (U), or residential (R) environments
(see classification in Table 2) differed considerably during the seven days of sampling
(Figure 7). The highest values were measured at sites located in SR, and the lower val-
ues in U. The highest means were associated with the sites SR2 (42 pollen grains/m3 ),
SR4 (17.6 pollen grains/m3 ), and SR1 (15.8 pollen grains/m3 ) located in the countryside.
The lowest means were associated with SR3 (3.6 pollen grains/m3 ) and R3 (7.6 pollen
grains/m3 ). There were no significant differences between all eleven sampling locations
(Kruskal–Wallis chi-squared = 11.937, p-value = 0.289). On the first two days, the highest
DPIns for SR and R were recorded. DPIns were lowest on 16 June and 17 June, days, which
were affected by precipitation. The rainy period started in the evening of 15 June, just after
the end of the evening measurements, and lasted until 3 a.m On the morning of 16 June,
there was light rain between the first and second measurements of the day. The mean
temperature for the sampling period was 20.8 ◦ C, and total precipitation was 14.8 mm,
which mostly fell between measurements. Wind directions and wind speed varied between
the days: on 13, 14, 17, and 18 June, wind predominately came from northeast and east; on
15 and 16 June from north, northwest, and west; and on 19 June from south, southeast, and
southwest. The highest wind speed was recorded on 15 June (7.6 m/s).
3.3.2. Diurnal Variation
Analyses of diurnal variation showed that pollen concentrations for all sites, inde-
pendent from their degree of urbanisation, were highest at noon (Figure 8). Mean pollen
concentrations for measurements in the morning were 8.4 pollen grains/m3 , at noon
22.2 pollen grains/m3 , and in the evening 10.4 pollen grains/m3 . The differences be-
tween the three daily measurements were significant (Kruskal-Wallis chi-squared = 14.471,
p-value = 0.001). Wilcoxon rank-sum test revealed significant differences between morn-
ing and noon measurements (p = 0.001) and between noon and evening measurements
(p = 0.006). Instead, the concentrations did not differ significantly between noon and
evening measurements (p = 0.327).end of the evening measurements, and lasted until 3 a.m On the morning of 16 June, there
was light rain between the first and second measurements of the day. The mean
temperature for the sampling period was 20.8 °C, and total precipitation was 14.8 mm,
which mostly fell between measurements. Wind directions and wind speed varied
between the days: on 13, 14, 17, and 18 June, wind predominately came from northeast
Atmosphere 2021, 12, 974 15 of 23
and east; on 15 and 16 June from north, northwest, and west; and on 19 June from south,
southeast, and southwest. The highest wind speed was recorded on 15 June (7.6 m/s).
Figure 7. Sum of DPIn
Figure 7. Sum forDPIn
PVASof locations in urban area/city centre (U; white), residential area (R; light grey), and semi-rural
PVAS for locations in urban area/city centre (U; white), residential area (R;
environment
here 2021, 12, x FOR (SR;grey),
light
PEER REVIEW dark grey). Squares represent
and semi-rural daily (SR;
environment meandark
pollen concentration
grey). measured
Squares represent at rooftop
daily level:
mean pollen black—SRS
17 of 25 and
grey—US. concentration measured at rooftop level: black—SRS and grey—US.
3.3.2. Diurnal Variation
Analyses of diurnal variation showed that pollen concentrations for all sites,
independent from their degree of urbanisation, were highest at noon (Figure 8). Mean
pollen concentrations for measurements in the morning were 8.4 pollen grains/m³, at noon
22.2 pollen grains/m³, and in the evening 10.4 pollen grains/m³. The differences between
the three daily measurements were significant (Kruskal–Wallis chi-squared = 14.471, p-
value = 0.001). Wilcoxon rank-sum test revealed significant differences between morning
and noon measurements (p = 0.001) and between noon and evening measurements (p =
0.006). Instead, the concentrations did not differ significantly between noon and evening
measurements (p = 0.327).
Figure 8. Boxplots
Figure 8.showing
Boxplots distribution of pollen of
showing distribution concentrations by measurement
pollen concentrations period. period.
by measurement Horizontal line = median,
boxes = interquartile
Horizontalrange.
line =Outliers
median,not shown.
boxes Colours forrange.
= interquartile sampling locations:
Outliers white—city
not shown. centre,
Colours light grey—residential
for sampling
locations: white—city
area, dark grey—semi-rural area. centre, light grey—residential area, dark grey—semi-rural area.
We compared We our compared our data
data on diurnal on diurnal
variation with variation with data
data measured measured
by the two 7-dayby the two 7-day
volumetric samplers at roof level during PVAS sampling and during the whole season whole season
volumetric samplers at roof level during PVAS sampling and during the
(Figure 9).
(Figure 9). Considering Considering
the whole season,the most
wholegrass
season, most
pollen grass
was pollen was
measured measured
between 2 and between 2 and
4 p.m.8 and
4 p.m. and between and between
10 p.m. at8 the
andUS.10 p.m. at SRS,
At the the US.
mostAtgrass
the SRS, most
pollen grass
was pollen was measured
measured
between 8 a.m.between 8 a.m.
and 12 p.m. and 12
(Figure p.m.
9a). Just(Figure 9a). Just
considering theconsidering
week of thethe week
PVAS of the PVAS sampling
sampling
campaign, peaks for both SRS and US were between 10 a.m. and 12
campaign, peaks for both SRS and US were between 10 a.m. and 12 p.m. (Figure 9b). These p.m. (Figure 9b). These
results show similarities to PVAS measurements, where the mean
results show similarities to PVAS measurements, where the mean pollen concentration pollen concentration was
highest
was highest at noon. at noon.(Figure 9). Considering the whole season, most grass pollen was measured between 2 and
4 p.m. and between 8 and 10 p.m. at the US. At the SRS, most grass pollen was measured
between 8 a.m. and 12 p.m. (Figure 9a). Just considering the week of the PVAS sampling
campaign, peaks for both SRS and US were between 10 a.m. and 12 p.m. (Figure 9b). These
Atmosphere 2021, 12, 974 16 of 23
results show similarities to PVAS measurements, where the mean pollen concentration
was highest at noon.
Figure
Figure 9. Diurnal pattern
9. Diurnal pattern of
of Poaceae
Poaceae pollen
pollen concentration
concentration recorded
recorded byby both
both 7-day
7-day volumetric
volumetric traps,
traps, grey—US,
grey—US, black—SRS
black—SRS
(a) during 2019; (b) during the week of PVAS sampling (13 June to 19 June
(b) during the week of PVAS sampling (13 June–19 June 2019).2019).
3.3.3. Land
Land Use
Use
Land use
Land use surrounding
surrounding the the traps
traps varied
varied depending
depending on on locations
locations (Table
(Table 2).
2). Based
Based on
on
grassland data (European Union 2020), areas covered with grass within
grassland data (European Union 2020), areas covered with grass within 100 m were 100 m were found in
found
7 out of 11 locations: U2 (1%), U4 (15%), R3 (6%), SR1 (10%), SR2 (15%), SR3 (48%),
in 7 out of 11 locations: U2 (1%), U4 (15%), R3 (6%), SR1 (10%), SR2 (15%), SR3 (48%), and and SR4
(11%).
SR4 Based
(11%). on land
Based covercover
on land classification 2019 [43],
classification 2019 areas defined
[43], areas as lowasvegetation
defined could
low vegetation
be found
could be in the surroundings
found of at all of
in the surroundings sites
at except U3;
all sites agricultural
except areas wereareas
U3; agricultural present at
were
sites SR1 (20%), SR2 (47%), SR3 (46%), and SR4 (42%). We found no statistically
present at sites SR1 (20%), SR2 (47%), SR3 (46%), and SR4 (42%). We found no statistically significant
relationshiprelationship
significant between CPIn PVAS and
between CPInthe percentage of agricultural area, grass cover, low
PVAS and the percentage of agricultural area, grass
vegetation, or Urban Index.
cover, low vegetation, or Urban Index.
4. Discussion
With this study, we are adding to the few studies that combine different types of
pollen traps (e.g., [31,39,41]). We used two 7-day volumetric pollen traps to gather data
on background pollen concentration, twelve gravimetric pollen traps to assess spatial
variations of pollen deposition for two grass pollen seasons, and portable volumetric traps
to assess spatial and diurnal variations of pollen concentration at eleven locations. The
volumetric trap at roof level is suitable to measure background pollen concentration for a
larger region. With the portable volumetric pollen traps that we used (PVAS), differences
at smaller spatial and temporal scales can be addressed. With the placement of this
trap at street level, the results are probably more relevant for people allergic to pollen,
since sampling is conducted at breathing height. Gravimetric pollen traps can be used to
compare cumulated pollen deposition for a longer interval, which cannot be done with
PVAS. Our results indicate that the differences between pollen amounts recorded at urban
and semi-rural locations mainly originated from different land use (more pollen was linked
to agricultural land and grass areas nearby) and land management (i.e., grass cutting).
4.1. Spatial Variations
4.1.1. Background Pollen Concentration
Volumetric pollen traps set up at roof level are not only useful to receive data on
background grass pollen concentration; these data are also appropriate to place data
obtained by sampling campaigns (conducted at street level and at certain periods or
intervals) into a broader context. Analyses of background pollen concentrations at the two
stations revealed different characteristics of the pollen seasons of both studied years. We
found that the more rural site was linked to higher peak values in both years, a higher
number of high pollen days, and SPIn (see Table 3).
This finding was also confirmed in other studies: Antón et al. (2020) [55] reported
that total pollen, peak values, and days with high levels were higher and that peak days
were one day earlier at the less urban site. Bosch-Cano et al. (2011) [56] counted a higher
number of days with more than 10 pollen grains/m3 at more rural sites. In general, the
urban heat island effect is associated with an earlier flowering, which is most pronouncedAtmosphere 2021, 12, 974 17 of 23
for plants flowering in spring [57]. In our study, we could not confirm an earlier onset
of the flowering period in 2019 using aerobiological data since the start was recorded
nine days later. In 2020, the difference between the US and the SRS was only one day.
This varying pattern might be attributable to different land use and management, i.e., the
abundance of grass or different species with different flowering periods. The placement of
a trap several meters above the ground implies the exposure to other influences such as
the dominance of regional winds, the additional input of long-range transported pollen,
and other differences in meteorological parameters compared to the ground. Therefore,
these different conditions of trap exposure should be kept in mind when comparing data
of pollen traps set up at different heights above the ground [28,58]. A wind sensor attached
to the top of the pollen trap could give detailed information on the wind direction and
therefore on the possible pollen source.
4.1.2. Gravimetric Sampling Campaigns
Using gravimetric samplers, we observed differences in pollen deposition across
sampling locations in both years. Despite different grass species contributing to the Poaceae
pollen spectrum, the seasonal pattern was rather uniform in 2019 and 2020, with the main
peak in the first week of June as also confirmed using the results of the volumetric rooftop
trap. The highest CPIngrav in 2019 with a value above 1000 were measured at sites classified
as semi-rural (Table 1). These high values of the CPIngrav can be attributable to a higher
abundance of grass areas, as well as fewer obstructions such as buildings or courtyard
walls that might hinder airflow and transport of pollen to the traps [33]. Surprisingly, in
2020, CPIngrav at G8 was much higher compared to the previous year (considering the
same sampling period of 10 weeks, more than three times higher). This can be explained by
the different management of an agricultural field adjacent to the trap (Table 1). In 2019, the
field consisting of mostly Plantago sp., Rumex sp., Poaceae, and Trifolium sp. was mowed
more than once during the sampling period, which hindered long-lasting flowering of
grasses. In 2020, the field was not mowed until mid-August, allowing grass species to
flower for a much longer period and therefore contributing to a higher pollen deposition.
The pairwise comparison of pollen deposition in 2020 (Table 4) revealed significant
differences between urban and semi-rural sites, e.g., between G1 and G10 and G12, G2 and
G10 and G12, G3 and G10, and G12 and G4. There were no significant differences between
different urban sites or between different semi-rural sites. Thus, inner-urban exposure can
be regarded as identical to each other but different from those in semi-rural conditions.
A study conducted by Werchan et al. (2017) [30] tested for spatial autocorrelation and
found a positive correlation between nearby as well as farther traps in most cases. In our
other year of sampling, 2019, however, no significant differences could be detected. Factors
responsible for differences in grass pollen concentration comprise land management/crop
cultivation [59] but also meteorology before, during, and after anthesis, including long-
range transport and resuspension [60]. Long-term monitoring at these sites would allow a
more profound conclusion about the reasons for diminished differences in certain years.
The positive and strong correlation of CPIngrav (year 2020) with the coverage of
agricultural land (rs = 0.836, p < 0.005; Figure 6) and weaker correlation with grass cover
(rs = 0.692, p < 0.005) suggests that agricultural areas are a more suitable indicator for the
amount of pollen deposition in semi-rural environments. However, the basis of the data set
has to be considered. Even with a comparatively good spatial resolution of 10 m, the data set
does not completely reflect current conditions, and smaller areas might not be considered.
As various different grass species are distributed within the city and the countryside at
many locations, the real conditions of pollen emissions cannot be depicted using these data.
Similar findings were reported by Cariñanos et al. (2019) [25] and Charalampopoulos et al.
(2018) [26]. Besides reasons related to the data source and the associated resolution, grass
areas might often be grazed or mowed and therefore do not necessarily present areas with
high pollen emission. The PVAS sampling campaign, instead, did not reveal any significant
correlations, pointing to the temporal effect of land management. In addition, an evenAtmosphere 2021, 12, 974 18 of 23
higher resolution of land cover data may be appropriate to identify small grass patches.
Studies focusing on these data or on an extended vegetation survey might reveal even
stronger correlations between pollen concentration and land use characteristics.
The negative correlation with Urban Index (rs = −0.726, p < 0.005) is similar to
observations in the study by Hugg et al. (2017) [33], who demonstrated that pollen
amounts decreased with increasing urbanisation. Reference [30] recorded for the study
area of Berlin the highest grass pollen deposition at a site close to agricultural land with
permanent pastures and grassland. The great influence of local pollen sources has also
been pointed out by Ciani et al. (2020) [61].
Since mean wind speed during the peak week in 2019 and 2020 was both 2.5 m/s,
these conditions, combined with low precipitation and high temperatures, have probably
also contributed to the high pollen catch (see Figures 4 and 5).
The use of gravimetric pollen traps is a cost-effective way to measure pollen deposition
at various locations. While advantages include easy operation, low cost, the absence of
moving parts, and the requirement for power; disadvantages are the method itself, i.e.,
the passive sampling. This method is solely based on the sedimentation of pollen, and the
volume of air that is sampled is unknown [62]. Therefore, neither a concentration (particles
per volume) nor the sampling efficiency can be determined, which leads to the fact that
pollen deposition cannot directly be compared to traps recording pollen concentration.
Furthermore, the catch is relatively low and influenced by wind speed, direction, and
turbulence [62].
4.1.3. PVAS Sampling Campaigns
Our results from the PVAS sampling campaign showed that sites located in the semi-
rural environment (SR) were predominately linked to higher Poaceae pollen concentrations,
except for SR3. Although this site was located next to agricultural fields, we recorded low
pollen concentrations there. Instead, we recorded much higher values at SR2, located at a
distance of approx. 1.5 km with similar surroundings. The reason for this is not entirely
clear—it could originate from a sampling or operational error or a gust of wind transporting
more grass pollen. Our results indicate a great variance in pollen concentrations measured
throughout the sampling period (Figure 8). This variance is also shown by the daily mean
pollen concentration measured each day at rooftop level at the SRS and US. This might be
due to changing meteorological parameters (during day and night or influenced by the
general weather situation) such as wind direction, wind speed, temperature, and humidity.
Especially the latter factors are responsible for anther dehiscence and thus influence the
process of pollen emission. These factors might have a greater influence on near-ground
measurements with a short sampling duration (in our study, 25 min). Other aerobiological
studies were conducted with similar or even shorter sampling durations, e.g.,15 min [39]
or 30 min [38]. In Section 2.1, we included references with similar findings of our observed
spatial variation.
The sampling campaign was strongly influenced by precipitation on the third and
fourth days, as well as lower temperatures on the fourth and fifth days. Wind speeds were
highest on the third day, just before sampling in the morning. These weather conditions
seemed to reduce pollen concentrations at all locations, which was also observed by
Laaidi et al. (2013) [63], who showed that Betula pollen dispersal was promoted by windy
conditions and low precipitation (less than 2 mm). A study has shown the negative
correlation between pollen concentration and precipitation [55] and the positive correlation
with wind speed close to the pollen trap [36]. Peel et al. (2014) [41], on the other hand,
reported significant negative correlations of pollen concentration measured with PVAS
and wind speed, which can be attributable to the horizontally oriented orifice and the
absence of a wind vane, which leads to a reduced sampling efficiency. Nevertheless, PVAS
are useful and easy-to-handle devices for measuring pollen concentration at street level,
especially during calm conditions due to the reported shortcomings related to strong winds.
When aiming for measurements at multiple locations, operating them, however, can beYou can also read