Current Status and Willingness to Adopt Renewable Energy Technologies in Saudi Arabia - MDPI
←
→
Page content transcription
If your browser does not render page correctly, please read the page content below
sustainability

Article
Current Status and Willingness to Adopt Renewable
Energy Technologies in Saudi Arabia
Ibrahim Mosly 1, *         and Anas A. Makki 2
 1    Department of Civil Engineering, Faculty of Engineering—Rabigh Branch, King Abdulaziz University,
      Jeddah 21589, Saudi Arabia
 2    Department of Industrial Engineering, Faculty of Engineering—Rabigh Branch, King Abdulaziz University,
      Jeddah 21589, Saudi Arabia; nhmakki@kau.edu.sa
 *    Correspondence: ikmosly@kau.edu.sa; Tel.: +966-126-400-000

 Received: 14 September 2018; Accepted: 13 November 2018; Published: 19 November 2018

 Abstract: The purpose of this research study is to reveal the current status of and the willingness to
 adopt renewable energy technologies in the western region of Saudi Arabia. The main contribution
 of this work is the revealed levels of background knowledge presented on six types of renewable
 technologies, as well as five willingness perspectives on adoption by different sociodemographics.
 This was achieved following a quantitative research study to randomly collect cross-sectional data
 from 416 participants using a carefully designed questionnaire survey. Descriptive and inferential
 statistics were used to analyze the collected data. Results of the study provided and ranked the
 background knowledge of participants’ viewpoints on six renewable energy sources. It was revealed
 that education is paramount in increasing the level of awareness of renewable energy technologies.
 The results also ranked the five willingness perspectives to adopting renewable energy technologies.
 It was revealed that the economic factor is the main factor influencing the willingness to adoption.
 The analysis also showed that age was an important factor influencing the adoption of these
 technologies. This research study acts as a guide assisting energy policy-makers, government
 agencies, and investors in designing better-targeted public awareness and marketing campaigns
 on renewable energy technologies. This is in turn will assist in achieving the energy efficiency and
 production targets of Vision 2030 in Saudi Arabia.

 Keywords: renewable energy technologies; willingness; adoption; public perception; Saudi Arabia

1. Introduction
     Environmental pollution, greenhouse gas emissions, and climate change have been recently
amongst the worldwide most significant global environmental concerns [1]. Continuously increasing
levels of carbon dioxide (CO2 ) and other greenhouse gases in the atmosphere are threatening the
environment [1]. The trends in CO2 emissions are highly dependent on energy production and
consumption levels, energy intensity, the cost of energy and its accessibility [1]. Both industrial
development and economic growth are derived from energy [1]. The consumption of energy is vital
to the wellbeing of humans as well as to economic activities [2]. An economic and social growth
constraint in several parts of the world is the lack of access to contemporary energy that is reliable and
affordable [2]. It is assumed that a nation with large energy consumption will also have a high living
standard [1]. Consequently, this high-energy consumption will produce high amounts of CO2 , leading
to the harmful effect on the environment [1].
     Saudi Arabia is one of several countries that has an abundant supply of fossil fuel resources [2].
Its wealth in these resources has led to overuse of energy and the high production of CO2 emissions [2].
In 2012, Saudi Arabia was the world’s leading oil producer and the second largest holder of crude

Sustainability 2018, 10, 4269; doi:10.3390/su10114269                     www.mdpi.com/journal/sustainability
Sustainability 2018, 10, 4269 2 of 20
oil reserves [2]. Energy is heavily subsidized in Saudi Arabia, resulting in overuse and inappropriate
allocation of oil and natural gas resources [2]. Furthermore, the gross domestic product (GDP) of
Saudi Arabia is mainly dependent on energy exports [2]. Reducing CO2 emissions in Saudi Arabia is
necessary due to the country being one of the largest polluters on the planet [2]. It is forecasted that if
the domestic oil consumption continues to increase at the current rate, by the late 2030s the kingdom
will consume all of its oil production [3]. The Saudi government can adopt an energy conservation
strategy through energy price changes and fuel replacement [1]. As energy prices increase, both users
and producers will reduce the energy consumption, and as a result energy efficient technology would
be adopted, resulting in CO2 emissions reduction [1]. Investing in renewable energy sources such as
solar and wind powers, to control the use of fossil fuel and CO2 emissions is an urgent matter [2].
Currently, there are no specific regulation or policies on renewable energy technologies (RETs)
usage in Saudi Arabia, but the government has set an ambitious strategy plan to adopt RETs on
a wide scale. The kingdom is introducing several initiatives, including increasing investments in
downstream assets, gas, renewables in the power sector, as well as increasing energy prices for domestic
use and enhancing efficiency [4]. The Vision 2030 targets for Saudi Arabia contain an obligation to
renewables for 9.5 GW by 2030 [4,5]. Vision 2030 classifies renewable energy as one of the pillars
for broadening economic status so that it is more than just oil [3]. It also seeks to localize several
significant aspects in the Saudi economy, such as research and development, manufacturing, and other
design and distribution stages [5]. The Vision 2030 also stresses localization of the manufacturing
of renewable energy and industrial equipment sectors in Saudi Arabia [3,5,6]. The current legal and
regulatory framework will be reviewed to allow private sector engagement in renewable energy,
including purchasing and investment activities [5]. As part of the Vision 2030, the government also
launched a smaller scale program called the National Transformation Program 2020. This program
was announced after the Vision 2030 with a renewable target of 3.45 GW by 2020, which represents 4%
of the total power consumption of the kingdom [3].
To endorse clean energy, it becomes necessary to find the correct balance between economic,
social, and environmental factors due to the typically higher cost of these technologies compared to
traditional ones [7]. It is possible to measure the preference of consumers on several RETs through
the use of a very useful tool by measuring their willingness to pay [7]. The public opinion on RETs
must be acknowledged by decision-makers as it represents a significant variable for policy-makers and
investors [8]. Ignoring this social variable can lead to limiting the wanted development of RETs [8].
The research herein was conducted to better understand the public perception in Saudi Arabia
of RETs, and their willingness to adopt these technologies. The driver of this research was the lack
of information on public perception of RETs in Saudi Arabia. The research problem is to collect
information on: how the public rates and ranks its level of background knowledge on RET sources;
and what are their willingness perspectives to adopt RET sources and how they rank them; what are
the significant sociodemographic determinants of background knowledge on RET sources; and what
are the significant sociodemographic determinants of willingness perspectives to adopt RET sources.
Such information is very significant to many renewable energy stakeholders, such as RETs suppliers,
installation contractors, operation and maintenance companies, the government, etc. New energy
technologies typically receive disapproval from the public [9]. This research will serve as a guide for
RETs stakeholders on the status and public willingness to adopt RETs. The following sections will
include a literature review, research methodology, results and discussion, and a conclusion.
2. Literature Review
2.1. Renewable Energy Technologies
The demand for RETs is growing worldwide. These technologies depend on renewable
energy sources to produce energy. Natural sources are the supply of renewable energy and can
be used continuously [10]. This includes solar, wind, geothermal, hydro, biomass, and wave energy.
The following sections will discuss the aforementioned types of renewable energies.Sustainability 2018, 10, 4269 3 of 20
2.1.1. Solar Energy
Worldwide, solar energy technologies have become well established and widespread [11].
Saudi Arabia has become the largest market for photovoltaic (PV) projects within the six Gulf
Cooperation Council countries and is expected to be leading the region in acting as a hub for
solar energy development [12]. Solar energy can be incorporated using many different systems,
which will help society to overcome its dependency on conventional fuels [13]. It is considered
a cheap, abundant, and endless source of renewable energy [13]. This energy source can offer energy
security and independence, due to its continues supply [11]. Furthermore, it is non-polluting, clean,
and consistent [11]. Recently, an increased enhancement in the efficiency of solar power technologies
was achieved along with a reduction in its costs, which is forecasted to continue [11]. Several European
countries such as Germany have developed special regularity mechanisms to promote the use of PV
technologies through government programs and incentives [14]. The main issue with solar powered
systems is its high capital costs [10,15]. Fortunately, as energy prices increase internationally, the cost
of solar energy is declining [15]. The cost of PV energy declined 50% between the years 2010 and
2014 [16].
2.1.2. Wind Energy
Wind power will play a significant role in attaining a post-fossil carbon society [17]. Deployment
of renewable energy resources such as wind is a practical solution towards an environment that is
clean, sustainable, and secure [18]. Wind energy is rapidly growing worldwide [18–20]. It will continue
to grow due to being abundant, domestic, inexhaustible, and clean [20]. Wind energy does not use
fossil fuel, and thus does not pollute the air [21]. It was the first to be realized on a commercial scale
among other new technologies [20]. The extraction of wind power using contemporary turbines is
now globally well-established [22]. Forecasting a representative way to harvest onshore and offshore
wind will be significant in planning the technology systems to be used, knowing the investment
needs, and designing the correct policies [23]. It is essential to be knowledgeable on wind behavior
in order to evaluate the performance of wind turbines [22]. Wind speed and frequency are very
dependent on location, and this explains why wind farms are only located in specific regions in the
world [22]. The turbines are classified as either large wind turbines (LWTs) or small wind turbines
(SWTs) [18]. There are also two categories of wind turbine: horizontal axis or vertical axis wind
turbines, with horizontal axis wind turbines being the most commonly used [21]. Wind turbines are
installed onshore or offshore depending on the locations with adequate wind resources [21]. Offshore
locations are more attractive, due to higher wind speeds, extra reliability, and consistency [21].
2.1.3. Geothermal Energy
Geothermal energy is an environmentally-friendly source of renewable energy [24,25]. It is
a sustainable source that can generate electricity, heating/cooling, and can be applied in other industrial
applications [26]. Compared to other existing energy generation technologies, it has the lowest
environmental impact, due to its marginal resource requirements for construction and maintenance [25].
Geothermal energy is a sustainable resource that can provide societies with access to a carbon-free
future [27]. Geothermal technologies emit very minor levels of carbon dioxide [27]. The only emissions
that exist arises from the underground reservoir fluids [27]. Growth of geothermal adoption is slow
compared to solar and wind technologies [27]. Projections indicate that energy use will increase
worldwide, and geothermal energy use will also increase considerably for both electricity generation
and heating [28]. The potential of geothermal energy does not exist in all countries, but those that
lie on the ring of fire have access to geothermal energy resources [29]. In several southern countries,
geothermal energy plays a major role [30]. Out of the top 15 countries that use geothermal technology
for electricity production, 10 countries are developing countries that include the Philippines, Kenya,
Indonesia, Mexico, and several Central American states [30]. The geothermal heat pump is derivedSustainability 2018, 10, 4269 4 of 20
from geothermal energy and is considered an efficient application [24]. It uses the Earth as a source
of heat and extracts it to heat spaces in winter [24]. Conversely, it uses the Earth as a heat sink by
transporting heat from the space to earth, and thus cooling the space during the summer session [24].
2.1.4. Hydro Energy
Hydropower generation technology is considered clean, efficient, and trouble-free [31]. Globally,
it plays a significant role in electricity generation and is currently the largest renewable source in the
world [32]. It is also one of the cheapest and readily available energy sources [33]. When compared to
other renewable technologies, it has a typically small social and environmental impact [31]. Because
hydropower technology is both flexible and reliable in integrating and developing energy systems, it is
amongst the oldest techniques and consists of small to large-sized systems [32,33]. Impulse momentum
is the basic principle governing hydropower technology [31]. It consists of two main steps: firstly,
the potential energy of the water is converted into mechanical energy; and secondly, the mechanical
energy is transformed into electrical energy [31]. The rotation of the turbines achieves the first step
and generators achieve the second step [31]. However, hydropower generation technology also faces
several vital social and environmental hindrances and restrictions that obstruct its development [15].
Hydropower generation technology is already being exploited in many developed countries [15].
2.1.5. Biomass Energy
Biomass energy is a renewable source that consists of carbon, nitrogen, hydrogen, and oxygen [34].
The name biomass is given to the substance as a result of the photosynthesis process, where the energy
from the sun converts water and carbon dioxide into an organic substance [35]. It encompasses
biological waste (i.e., domestic, forest or organic waste), agricultural production by-products,
and agro-industrial or food industry waste [34,35]. Furthermore, it is one of the earliest sources
of energy for human beings [35]. Many applications exist for biomass energy including electricity
generation, heating, and vehicle fuel [35]. Biomass energy can assist with the issues of global warming
and climate change, as well as providing energy reliance and safety [36]. Biomass energy gets to
the heart of sustainable development, due to its strong links to food security and the environment,
which is a point that is disregarded by policy makers when favoring contemporary energy [37].
The promotion of biomass energy generation in several developed and developing countries is made
through regulated policies and financial incentives [34]. In developing countries, biomass energy is
used mainly for cooking and heating, and in industrialized countries it is used mainly for heating,
combined heat, and power (CHP), and biofuels [38]. When compared to fossil fuel, biomass fuel
has a moderately cleaner combustion [39]. Transportation fuels such as biodiesel and bioethanol,
or biogas such as biomethane can be produced from biomass [40]. It is forecasted that the importance
of biomass energy will increase with forestry, agriculture, and organic waste being the essential base of
the biomass energy option [15].
2.1.6. Wave Energy
Wave energy is the most abundant source of energy in the world [41]. It is an unconventional
renewable energy source that is interesting because of its high density and presence worldwide [42].
The energy density is considered to be the highest amongst all renewable sources [43]. The last few
decades have seen a significant increase in wave energy due to the need to decrease greenhouse gas
emissions [44]. It is expected that wave energy will also play a large role in the future of energy supply
systems, even though presently none of the wave energy convertors have been commercialized [44].
Wave energy depends on the motion of the waves and harnesses kinetic and potential energy [45].
The wave characteristics such as the wave height, period, location, and seasonal variation all affect the
total amount of energy generated [45]. One of the great challenges for energy engineers and scientists
is the harvesting of wave energy, and many methods have been attempted [46]. It was found that
it was very difficult to adopt most of the wave energy methods in a real ocean environment, due toSustainability 2018, 10, 4269 5 of 20
the technological and economic complexity [46]. Wave energy harvesting methods still lack maturity
overall [45]. It might still take decades to obtain significant energy generation from wave energy
systems [15].
2.2. Willingness to Pay and Invest in Renewable Energy Technologies Worldwide
A significant requirement to the successful adoption of any technology is social acceptance,
which may be often overlooked [47]. With regard to the perception and public acceptance of
new expanding forms of energy, limited number of works exist in the theoretical and empirical
literature [47]. Investors and decision-makers are faced with extra challenges, because of the increasing
significance of renewable energy systems on electricity generation [48]. Private investors believe that
it is fundamental to guarantee public acceptance in order to reduce the risk of cost overruns, failure,
or cancellation [48]. Public acceptance differs with the technology type and is associated with the
local financial reimbursement regulations, as well as other fundamentals, such as job creation or local
development [48]. Several European governments are progressively using public resources to enable
the switch from fossil fuel energy systems to sustainable energy systems [49]. The unwillingness of
the public to adopt renewable energy and resistance to the construction of renewable energy facilities
remain key barriers to the evolution of renewable energy in a number of European and North American
countries, including the United Kingdom [50]. Citizens that oppose renewable energy are referred to
as NIMNYs (Not In My Back Yarders) [50].
A study in Portugal has investigated the significance of RETs for electricity generation and has
examined the social acceptance of hydro, wind, biomass, and solar RETs along with identifying
the major concerns [48]. The study results show that there is a positive outlook toward RETs in
Portugal with the public being well aware of these systems [48]. Nevertheless, the public’s knowledge
on capital cost, electricity bill effect, and feed-in-tariffs availability was low [48]. A study took
place in Lithuania to investigate the public’s willingness to pay for a number of renewable energy
technologies [7]. It revealed that house owners are interested and are ready to pay extra for solar
energy-based technologies over biomass and wind [7]. In another study that took place in Yemen,
the public’s knowledge, attitudes, and behavioral intention to do with the use of several renewable
energy sources, especially solar energy, was studied [51]. These data were then used to determine the
basis for setting policies that motivate the use of renewable energy [51]. An evaluation of the public
willingness to pay extra, to change their current source of electricity, and to invest in feed-in-tariffs
were a portion of the study [51]. The results showed that 76% of people living in an urban area
and 60.1% of people living in a rural area knew about renewable energy sources [51]. Solar and
wind renewable energy sources were the most well-known and geothermal energy source was the
least known [51]. Generally, the public of Yemen showed a constructive attitude toward the use of
renewable energy, specifically solar energy [51]. Furthermore, the public was willing to pay extra and
to invest in feed-in-tariffs, with a moderate willingness to change their current source of electricity [51].
The public perception and willingness to pay was studied in Greece and revealed similar results to
other European countries such as Spain and Slovenia [52]. Study participant showed a positive attitude
toward RETs and willingness to pay was directly linked to education, subsidies and government
support [52]. Another study that targeted the western part of Greece found that the willingness to pay
for renewable energy projects is linked to income and environmental organization memberships as well
as the renewable energy potential [53]. In Crete, a study was completed to analyze and evaluate the
public acceptance and willingness to pay for renewable energy sources [54]. The study revealed that
most of the public was very progressive toward the implementation of renewable energy sources [54].
Social acceptance of wind energy was investigated in China [17]. There was a general level of support
for wind energy, but it was largely reduced when citizens were asked to install wind turbines on their
properties or when asked to pay for higher electricity prices [17]. Thus, it is significant to highlight that
the acceptance of renewable energies does not indicate the willingness to pay for them [17]. The study
also showed that factors such as age, income, education level, and property location had an effectSustainability 2018, 10, 4269 6 of 20
on the social acceptance of wind energy [17]. In Hong Kong, the public willingness to pay for green
housing attributes (including RETs) was explored [55]. It was concluded that the willingness to pay
was derived mainly by economic incentives [55]. The willingness to pay for sustainable buildings
(includes RETs) by office building tenants was investigated in Singapore [56]. The study showed
that older tenants have a lower willingness to pay for sustainable features, and that the demand for
sustainable buildings is for improving the image of the organization [56].
3. Methodology
To achieve the main objective of this research study, a quantitative research design was followed
using a random sampling process to collect cross-sectional data using a mixed mode survey.
Both printed paper and online questionnaire survey versions, which were created via Google Forms,
were used in this study. This is to ensure independency of data (i.e., every response comes from
a different person), and targeting higher data coverage of hard-to-reach sociodemographic groups of
respondents. Both paper and online surveys were randomly circulated using different online channels
(i.e., Gmail, WhatsApp, LinkedIn, and Twitter). The online questionnaire survey was designed to
collect detailed data pertaining to the respondents’ sociodemographic characteristics, background
knowledge on RETs, and willingness to adopt RETs. The option of limiting the response to one for each
respondent was used on the Google Form settings menu. This option assist in stopping the repeated
completion of questionnaire survey by the same respondent.
The sociodemographic characteristics of respondents included: gender, nationality, age,
educational level, income level, employment status, marital status, accommodation type,
and accommodation ownership status. The depth of background knowledge on six RETs (i.e., solar,
wind, sea wave, hydroelectric, geothermal, and biomass) was also collected. Moreover, data on the
willingness to adopt RETs was collected. This was accomplished by collecting data on five willingness
perspectives (i.e., willingness to save the environment, willingness to change from traditional energy
sources to RETs, willingness to pay more for using RETs, willingness to own RETs, and willingness to
invest in RETs infrastructure).
Respondents were asked to rate their background knowledge on a scale of two (i.e., I have, or,
I do not have a background knowledge) for each of the six RETs. The willingness to adopt RETs
was measured on a scale of three (i.e., willing, neutral, or unwilling) for each of the five perspectives
mentioned above.
The used data in this research study was restricted to the residential sector public in the western
region (i.e., Jeddah, Rabigh), Kingdom of Saudi Arabia (KSA). All data were collected in the first and
second quarters of 2017 from 416 respondents, 251 (60.33%) and 165 (39.67%) responses were collected
from paper and online questionnaire surveys, respectively.
The sufficiency of the sample size was ensured using the G*Power 3.0.10 software [57,58]. It was
used to calculate the statistical power and effect size for the chosen statistical method in this study
(i.e., Pearson’s chi-square test). Typically, a sample size is selected such that a probability level of
0.05 (i.e., α-level of 0.05) is considered statistically significant. This also avoids Type II errors at
0.8 (i.e., 1 − β = 0.80), which is considered acceptable [59]. A stricter condition was used in this
research study. The used sample size (i.e., N = 416) allowed for a probability of statistical significance
at 0.01 (i.e., α-level = 0.01), and significant statistical power (i.e., 1 − β = 0.99). Based on the degrees
of freedom (df ) used in the conducted tests ranging from df = 1 to df = 12, the calculated effect sizes
range from 0.240 to 0.318, respectively. These effect sizes fall between the small and medium effect
size range of 0.2 to 0.5 [60,61], respectively. Therefore, the sample size was deemed sufficient for
this study. Moreover, representation of the collected sample was also checked by comparing the
sociodemographic characteristics of respondents versus characteristics of the targeted population,
as will be shown in the next section.
For a general understanding of the collected data, descriptive statistics and graphical
representations were used. This is to answer questions such as: What are the sociodemographicSustainability 2018, 10, 4269 7 of 20
characteristics of respondents? How do their sociodemographics compare to the targeted population?
How is background knowledge rated on each of the six RETs? How is willingness to adopt RETs on
each of the five willingness perspectives rated?
Subsequently, inferential statistics were used to study correlations between sociodemographic
characteristics of respondents and their level of background knowledge on each of the six RETs.
Furthermore, it was used to study correlations between sociodemographic characteristics of
respondents and their level of willingness to adopt RETs on each of the five willingness perspectives.
For this statistical study, the variables were categorical and the Pearson’s chi-square (χ2 ) test was
used [62,63]. This statistical test is based on a cross-tabulation technique of frequencies between a pair
of categorical variables to test for the significant correlations. A contingency table was generated to
test for correlations between each pair of categorical variables using Equations (1)–(3) [59,62,63].
2
Oij − Eij
χ = 2
∑ Eij
(1)
where,
• χ2 is the Pearson’s chi-square statistic
• i is the row number in the contingency table
• j is the column number in the contingency table
• Oij is the observed frequency
• Eij is the expected frequency
RTi × CTj
Eij = (2)
n
where,
• RTi is the row total
• CTj is the column total
• n is the total number of observations
d f = (r − 1)(c − 1) (3)
where,
• df is degrees of freedom
• r is number of rows
• c is number of columns
The statistical significance of the conducted χ2 -statistic was assessed based on the probability
level calculated above (i.e., p < 0.01) for the used sample size (N = 416). The two assumptions of the
χ2 -test: independence of data and having a minimum expected count value of five for frequencies
in the contingency table [59] were satisfied. The first assumption was satisfied because each of the
data points were from a different respondent. The second assumption was also satisfied by ensuring
a minimum expected value of five as well as using the Fisher’s exact test to ensure the statistical
significance of the χ2 -statistic, in case a minimum expected count was less than five [59,62].
Following this method and using SPSS Version 21.0 [64], correlations among all categorical
variables were tested. This was to reveal the significant subsets of the respondents’ sociodemographic
characteristics based on level of background knowledge for each of the six RETs and their level of
willingness to adopt RETs based on each of the five willingness perspectives. The results of this
statistical study will assist in pinpointing characteristics of potential early adopters of RETs, such that
better-targeted awareness campaigns on RETs can be designed. It will also reveal the willingness
enablers and barriers for adoption.Sustainability 2018, 10, 4269 8 of 20
4. Data Analysis and Results Discussion
4.1. Sociodemographic Characteristics
An approximately equal numbers of males and females took part in this survey, with only 6%
more male participants. This assists in the robustness of the study and the results. Table 1 presents the
survey participants’ gender profile.
Table 1. Research sample demographics.
Demographics Groups Frequency Percentage (%)
Gender Male 231 55.5
Female 185 44.5
Nationality Saudi 380 91.3
Non-Saudi 36 8.7
Age (Years) 18 to 29 123 29.6
30 to 39 132 31.7
40 to 49 87 20.9
50 or more 74 17.8
Education level NA 11 2.6
Secondary 43 10.3
Diploma 19 4.6
Bachelor’s 223 53.6
Master’s 69 16.6
PhD 51 12.3
Monthly Income (Saudi Riyal) Less than 5000 98 23.6
5001 to 10,000 86 20.7
10,001 to 15,000 93 22.4
15,001 to 20,000 82 19.7
20,001 to 30,000 30 7.2
More than 30,000 27 6.5
Employment Public sector employee 143 34.4
Private sector employee 107 25.7
Student 61 14.7
Retired 40 9.6
Housewife 32 7.7
Self-employed 22 5.3
Unemployed 11 2.6
Marital Status Married 290 69.7
Single 104 25
Other 22 5.3
Accommodation Type Apartment 225 54.1
Villa 161 38.7
Other 30 7.2
Accommodation Ownership Owner 222 53.4
Rental 158 38
Other 36 8.7
The majority of participants had received a bachelor’s degree (54%), followed by master’s degree
holders (17%), and then Doctor of Philosophy degree holders (12%). Thus, 83% of participants received
degrees in higher education. The remainder of the participants (17%), were secondary degree holders
(10%) and diploma degree holders (4%), with 3% having no educational degrees. The participants’
educational level profiles are presented in Table 1.
As part of the study, it was important to investigate the perception of both Saudi citizens and
non-Saudi residents on the subject. The majority of participants were Saudi citizens (91%). Table 1
presents the nationality profile of the survey sample.Sustainability 2018, 10, 4269 9 of 20
In terms of participants’ monthly income, which has a significance influence on purchasing
power, Table 1 shows the monthly income profile of participants. It shows that the highest number of
participants had the lowest income of less than SR5000 (24%), and the least number of participants
had the highest income of more than SR30,000 (6%). The distribution of participants with respect to
monthly income for the remainder of groups was adequate, with 21% of participants at SR5001
Sustainability 2018, 10, x FOR PEER REVIEW 9 of 20
to
SR10,000, 22% at SR10,001 to SR15,000, and 20% at SR15,001 to SR20,000. Similarly, to those with the
highest monthly
SR10,000, 22%income,
at SR10,0017% of toparticipants
SR15,000, and has
20%anatincome
SR15,001 of SR20,001
to SR20,000. to SR30,000,
Similarly, towhich
thoseiswith
considered
the
highest
relatively high.monthly income, 7% of participants has an income of SR20,001 to SR30,000, which is
considered relatively high.
Different age groups of participants were engaged in this study. According to Table 1, the majority
Different
of participants wereage30groups of participants
to 39 years were engaged
old, representing 32% ofinthe thissample
study. size.
According
This wasto Table
followed 1, theby 18
majority of participants were 30 to 39 years old, representing 32%
to 29 years old at 29% of the sample size. The ages 40 to 49 years old represented 21% of the sample of the sample size. This was
followed by 18 to 29 years old at 29% of the sample size. The ages 40 to 49 years old represented 21%
size, and 18% of participants were 50 years old or older.
of the sample size, and 18% of participants were 50 years old or older.
Participant employment status was identified in this study (see Table 1). The majority of
Participant employment status was identified in this study (see Table 1). The majority of
participants were from the public sector (34%) and the private sector (26%). Students did take part in
participants were from the public sector (34%) and the private sector (26%). Students did take part in
this study
this study represented
and and represented 15% of15% the of
sample size. The
the sample restThe
size. of the sample
rest of theincluded
sample limited
includedparticipation
limited
of retired, housewives,
participation self-employed,
of retired, housewives,and unemployedand
self-employed, at 9%, 8%, 5%, and
unemployed 3%, 8%,
at 9%, respectively.
5%, and 3%,
The study participants’ marital status is presented in Table 1. This figure shows that 70% of
respectively.
participants were married,
The study participants’ 25%marital
were status
singleisand the remainder
presented in Table 1. of This
participants
figure shows(5%)that
were 70% of of
other
participants
marital status, suchwereasmarried,
divorced, 25% were single
widowed, etc.and the remainder of participants (5%) were of other
marital status, such as divorced,
The accommodation widowed, etc.is presented in Table 1. Most of participants lived in
type of participants
apartment The accommodation
units (54%). Thosetype whooflive
participants is presented
in villa units represent in 39%
Tableof1.theMost of participants
sample size, and lived
7% livedin in
apartment units (54%). Those who live in villa
other types of accommodations such as compounds, townhouses, etc. units represent 39% of the sample size, and 7% lived
in other types of accommodations such as compounds, townhouses, etc.
Participants were asked to state their accommodation ownership status as part of this study.
Participants were asked to state their accommodation ownership status as part of this study. The
The results presented in Table 1 shows that the majority of participant (53%) own their accommodation
results presented in Table 1 shows that the majority of participant (53%) own their accommodation
units, while 38% rent. The remainder of participant (9%) have other statuses, which may include,
units, while 38% rent. The remainder of participant (9%) have other statuses, which may include,
living withwith
living parents
parentsor or
other
otherfamily
familymember,
member,on onloans,
loans, etc.etc.
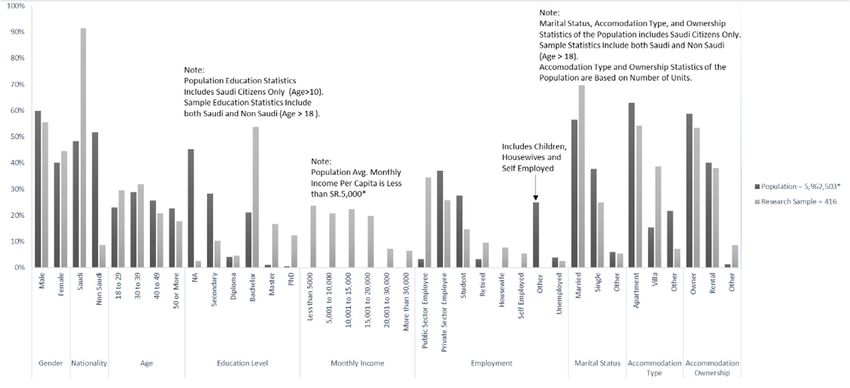
TheThesociodemographic
sociodemographic characteristics of 416 respondents ininthe
characteristics of 416 respondents theused
used sample
sample areare compared
compared to to
characteristics of the targeted population of 5,962,503 people aged 19 years
characteristics of the targeted population of 5,962,503 people aged 19 years or older living in the or older living in the western
region of Saudi
western Arabia
region in 2017
of Saudi (Figure
Arabia 1). This
in 2017 is to1).check
(Figure This is fortolevel
checkofforrepresentativeness of the collected
level of representativeness of
sample. The 2017
the collected population
sample. The 2017 data was adopted
population data was from the General
adopted from theAuthority of Statistics,
General Authority Kingdom
of Statistics,
Kingdom
of Saudi Arabia of Saudi
[65]. Arabia
Figure[65]. Figure 1 percentages
1 compares compares percentagesof demographicof demographic
groupsgroups
used in used
thisinresearch
this
research study. Despite the higher percentage of Saudi respondents
study. Despite the higher percentage of Saudi respondents in the sample versus the non-Saudis when in the sample versus the non-
Saudis to
compared when comparedpercentages,
population to populationthe percentages,
sample is the sample is representative,
representative, because non-Saudi
because non-Saudi residents are
residents are most likely to be a transient workforce, and almost all real estate properties are owned
most likely to be a transient workforce, and almost all real estate properties are owned by Saudi citizens.
by Saudi citizens.
Figure 1. Research
Figure sample
1. Research versus
sample 20172017
versus population
population demographic
demographic characteristics (Western
characteristics Region,
(Western Saudi
Region,
Arabia). Source: General Authority for Statistics, Saudi Arabia [65].
Saudi Arabia). Source: General Authority for Statistics, Saudi Arabia [65].Sustainability 2018, 10, 4269 10 of 20
4.2. Background
SustainabilityKnowledge
2018, 10, x FORon RETs
PEER REVIEW 10 of 20
Varied results were
4.2. Background seenonon
Knowledge the participants’ background on the different types of RETs (see
RETs
Figure 2). The results show that the
Varied results were seen on the majority of survey
participants’ participants
background were familiar
on the different with (see
types of RETs solar RETs,
but were unfamiliar
Figure withshow
2). The results biomass RETs.
that the Thus,
majority out of participants
of survey the six RETs
wereconsidered
familiar with insolar
this RETs,
study, 76.7%
of participants were aware
but were unfamiliar withof solar energy,
biomass followed
RETs. Thus, bysix60.3%
out of the of participants
RETs considered in this being aware
study, 76.7% of of wind
energy.participants
Both sea wavewere aware
energyofandsolarhydroelectric
energy, followed by 60.3%
energy had of participants
very being aware
similar numbers of windand 45%,
at 46.2%
energy. Both sea wave energy and hydroelectric energy had very similar numbers at 46.2% and 45%,
respectively. Participants with background knowledge on geothermal energy represented 34.9% of the
respectively. Participants with background knowledge on geothermal energy represented 34.9% of
sample. Finally, only 15.4% of participants had a background on biomass energy.
the sample. Finally, only 15.4% of participants had a background on biomass energy.
Background on RETs Sources (%)
0 10 20 30 40 50 60 70 80 90 100
Solar
Wind
Sea wave Yes
No
Hydroelectric
Geothermal
Biomass
Figure
Figure 2. Participantsbackground
2. Participants background knowledge
knowledgeon six
on types of RETs.
six types of RETs.
4.3. Sociodemographic
4.3. Sociodemographic Characteristics
Characteristics versusBackground
versus Background Knowledge
Knowledgeon RET Sources
on RET Sources
As mentioned earlier in the Methodology section, the χ -test was used to study correlations
2
As mentioned earlier in the Methodology section, the χ2 -test was used to study correlations
between sociodemographic characteristics of respondents and the level of background knowledge on
between sociodemographic characteristics of respondents and the level of background knowledge
each of the six RETs, as well as willingness perspectives to adopt RETs. Table 2 presents only
on each of the six
statistically RETs, as
significant well as willingness
correlations between all perspectives to adopt RETs.
tested sociodemographic Table and
characteristics 2 presents
only statistically
background significant correlations
knowledge. Table 2 revealsbetween allsignificant
statistically tested sociodemographic
correlations betweencharacteristics
educational and
level and
background background
knowledge. knowledge
Table 2 revealson statistically
five RET sources (namely
significant solar, wind,
correlations geothermal,
between educational
hydroelectric,
level and background andknowledge
biomass) and onbetween
five RETnationality
sources and sea wave
(namely solar,RET. Figures
wind, 3–7 present
geothermal, bar
hydroelectric,
charts of respondents’ background knowledge on RET sources based on percentages within their
and biomass) and between nationality and sea wave RET. Figures 3–7 present bar charts of respondents’
educational level categories. Positive correlations between educational level and background
background knowledge
knowledge on RET
on the five sourcesmentioned
RET sources based onearlier
percentages within
are evident fromtheir educational
the charts. Figure level categories.
8 shows
Positivethat
correlations
a higher percentage of non-Saudi respondents have background knowledge on the sea wave RET sources
between educational level and background knowledge on the five RET
mentioned earlier
than Saudi are evident
national from the charts. Figure 8 shows that a higher percentage of non-Saudi
respondents.
respondents have background knowledge on the sea wave RET than Saudi national respondents.
Table 2. Significant correlations between sociodemographic characteristics and background
knowledge on renewable energy technologies (RET) sources.
Table 2. Significant correlations between sociodemographic characteristics and background knowledge
Sociodemographic
on renewable energy technologies (RET) sources.
Background Knowledge on RET Source df a χ2 b
Characteristic
a
Sociodemographic Characteristic
Education Level Background Knowledge
Solar on RET Source 5 df 16.173 **,cχ2 b
Education
Education Level
Level Wind
Solar 5 520.971216.173
**
,c
**,c
Education
Education Level
Level Geothermal
Wind 5 529.05320.9712
***,c **,c
Education
Education Level
Level Hydroelectric
Geothermal 5 5 14.018 * ,c
29.053 ***,c
Education Level
Education Level Biomass
Hydroelectric 5 5 15.554 **,c
14.018 *,c
Nationality
Education Level Sea Wave
Biomass 1 5 6.673 *
15.554 **,c
,d
Nationality Sea Wave 1 6.673 *,d
a df : Degree of freedom. b χ2 : c
Chi-square statistics. Based on Fisher’s Exact statistical significance level (2-sided).
d Exact statistical significance level (2-sided). * p < 0.05, ** p < 0.01, *** p < 0.001.Sustainability 2018, 10, x FOR PEER REVIEW 11 of 20
Sustainability 2018, 10, x FOR PEER REVIEW 11 of 20
adf: Degree of freedom. b χ2: Chi-square statistics. c Based on Fisher’s Exact statistical significance
a df: Degree of freedom. b χ2: Chi-square statistics. c Based on Fisher’s Exact statistical significance
Sustainability 2018, 10, 4269 11 of 20
level (2-sided). Exact statistical significance level (2-sided). * p < 0.05, ** p < 0.01, *** p < 0.001.
d
level (2-sided). d Exact statistical significance level (2-sided). * p < 0.05, ** p < 0.01, *** p < 0.001.
Figure 3. Background knowledge on solar energy source (percentages within educational level
categories).
Figure
Figure 3. Background
3. Background knowledge
knowledge on energy
on solar solar energy
source source (percentages
(percentages within educational
within educational level
level categories).
categories).
Figure
Figure 4. Background
4. Background knowledge
knowledge on wind
on wind energyenergy
sourcesource (percentages
(percentages within within educational
educational level
level categories).
categories).
Figure 4. Background knowledge on wind energy source (percentages within educational level
categories).Sustainability 2018,10,
Sustainability2018, 10,4269
x FOR PEER REVIEW 1212ofof2020
Sustainability 2018, 10, x FOR PEER REVIEW 12 of 20
Figure 5. Background knowledge on geothermal energy source (percentages within educational level
categories).
5. Background
Figure
Figure knowledge
5. Background on geothermal
knowledge energy
on geothermal sourcesource
energy (percentages withinwithin
(percentages educational level categories).
educational level
categories).
FigureFigure 6. Background
6. Background knowledge
knowledge on hydroelectric
on hydroelectric energy
energy source source (percentages
(percentages within educational
within educational level categories).
level categories).
Figure 6. Background knowledge on hydroelectric energy source (percentages within educational
level categories).Sustainability2018,
Sustainability 2018,10,
10,4269
x FOR PEER REVIEW 1313ofof20
20
Sustainability 2018, 10, x FOR PEER REVIEW 13 of 20
Figure 7. Background knowledge on biomass energy source (percentages within educational level
categories).
Figure
Figure 7. Background
7. Background knowledge
knowledge on biomass
on biomass energyenergy
sourcesource (percentages
(percentages within within educational
educational level
level categories).
categories).
Figure 8. Background
Figure 8. Backgroundknowledge on sea
knowledge onwave
sea energy source (percentages
wave energy within nationality
source (percentages categories).
within nationality
categories).
Figure 8. Background knowledge on sea wave energy source (percentages within nationality
4.4. Willingness
categories). Perspectives to Adopt RET Sources
4.4. Willingness Perspectives to Adopt RET Sources
Participants’ willingness was examined against five perspectives related to RET adoption.
Participants’
4.4. Willingness willingness
Perspectives was examined
to Adopt RET Sources against five perspectives related to RET adoption. The
The perspectives were: (1) save the environment;
perspectives were: (1) save the environment; (2) own (2) own an RET
an RET source;
source; (3) change
(3) change traditional
traditional source
source of
of Participants’
energy willingness was examined against five perspectives related to RET adoption.
energyThe
energy toto
anan RET
RET source;(4)(4)invest
source; investininananRET
RETsource
sourceinfrastructure;
infrastructure;and
and(5)
(5)pay
paymore
morefor
forenergy by
by
perspectives
using an RET were:
source (1) save the
instead of aenvironment;
traditional (2) own
source. Theandata
RETanalysis
source;in(3) change
Figure 9 traditional
shows that sourcethe
saving of
using an RET source instead of a traditional source. The data analysis in Figure 9 shows that saving
energy to an RET
environment was source;to(4)
found be invest
the in an RET
highest source infrastructure;
willingness perspective for and (5) pay more
participants, with for
a energy by
majority of
the environment was found to be the highest willingness perspective for participants, with a majority
using an RET
participants source
(96%) instead
having of a traditional
expressed source.
willingness Thethe
to save data analysis in Figure 9 shows that source,
saving
of participants (96%) having expressed willingness to saveenvironment. For owning
the environment. an RET
For owning an RET
the environment was found to be the highest willingness perspective for participants, with a majority
of participants (96%) having expressed willingness to save the environment. For owning an RETSustainability 2018, 10, 4269 14 of 20
Sustainability 2018, 10, x FOR PEER REVIEW 14 of 20
changing to an RET source and investing in an RET source infrastructure, the participants’ willingness
source, changing to an RET source and investing in an RET source infrastructure, the participants’
perspectives were similarwere
willingness perspectives at 79%, 74%, at
similar and 72%,
79%, respectively.
74%, and 72%, Only 26% of the
respectively. participants
Only 26% of the were
willing to pay
participants more
were for RET
willing sources
to pay moreover traditional
for RET sources sources, meaning
over traditional the majority
sources, arethe
meaning not willing to
majority
spend more money to adopt RET sources.
are not willing to spend more money to adopt RET sources.
Figure
Figure9.9.Willingness
Willingnessperspectives
perspectivestotoadopt
adoptRET
RETsources (percentages).
sources (percentages).
4.5.
4.5. Sociodemographic Characteristicsversus
Sociodemographic Characteristics versusWillingness
WillingnessPerspectives
Perspectivesto to Adopt
Adopt RET
RET Sources
Sources
Correlations between all
Correlations between all sociodemographic
sociodemographiccharacteristics
characteristicsandand each
each of of
thethe
fivefive willingness
willingness
perspectives
perspectives to adopt RETs were
were determined. As presented in Table 3, among all all
determined. As presented in Table 3, among tested
tested
sociodemographic characteristics,
sociodemographic characteristics, statistically
statisticallysignificant
significantcorrelations
correlationsonly exist
only between
exist between the the
employment status
employment status ofof respondent,
respondent,their age,
their andand
age, theirtheir
willingness to save
willingness the environment.
to save A
the environment.
significant correlation exists between the age of respondents and the willingness
A significant correlation exists between the age of respondents and the willingness to pay more to pay more for
using
for RETRET
using sources as an
sources asalternative to traditional
an alternative energy
to traditional sources.
energy sources.
Table 3.
Table 3. Significant correlations
Significant between
correlations sociodemographic
between characteristics
sociodemographic and willingness
characteristics to adopt to
and willingness
RETs. RETs.
adopt
Sociodemographic Characteristic Willingness Perspective df χ2 a
Sociodemographic Characteristic Willingness Perspective df χ2 a
Employment status Save the environment 12 22.257 **
Employment status Save the environment 12 22.257 **
Age Save the environment 6 14.126 **
Age Save the environment 6 14.126 **
Age Age Pay
Pay more for using
more for usingRETs
RETs 6 6 18.852
18.852
** **
a Based on Fisher’s
a Based Exact statistical significance level (2-sided). ** p < 0.01.
on Fisher’s Exact statistical significance level (2-sided). ** p < 0.01.
Figure 10 presents bar charts of respondents’ willingness to save the environment based on
Figure 10 presents bar charts of respondents’ willingness to save the environment based on
percentages within their employment status categories. Results showed that most respondents were
percentages within
willing to save their employment
the environment based status categories.status.
on employment Results showed
A small that most
proportion of respondents
9.4% and 9.3% were
willing to save the environment based on employment status. A small proportion
of housewives and private sector employees, respectively were neutral to the topic. A very small of 9.4% and 9.3%
of housewives
percentage and private
of 2.5% and 0.9%sector employees,
of retired and respectively
private sectorwere neutral were
employees to theunwilling
topic. A very small
to pay,
percentage of 2.5% and 0.9% of retired and private sector employees were unwilling
respectively. Results in Figure 11 show that 4.07% and 7.58% of respondents 18–29 and 30–39 years to pay, respectively.
Results
old werein neutral
Figure 11 show
about that 4.07%
saving and 7.58% ofrespectively.
the environment, respondentsAdditionally,
18–29 and 30–39 years
a very old1.35%
small were and
neutral
about
0.81%saving the environment,
of respondents respectively.
aged 50 years Additionally,
or older and 18–29 years a very
were small 1.35%
unwilling toand
save0.81% of respondents
the environment,
aged 50 yearsNotably,
respectively. or older none
and 18–29
of theyears were unwilling
respondents to save
aged between 30the
andenvironment,
49 years wererespectively.
unwilling to Notably,
save
none of the respondents aged between 30 and 49 years were unwilling to save the environment.
the environment.
As
As presented earlier in
presented earlier inFigure
Figure9,9,aatotal
totalofof74.5%
74.5%ofofrespondents
respondents (i.e.,
(i.e., 35.3%
35.3% neutral
neutral andand 39.2%
39.2%
unwilling)were
unwilling) wereneutral
neutraland
and unwilling
unwilling to pay
to pay more more for using
for using RET sources
RET sources as an alternative
as an alternative to
to traditional
traditional
sources. sources.
Results Results
in Figure 12in Figurethat
showed 12 showed
48.5% ofthat 48.5% of respondents
respondents between 30 and between 30 and
39 years were39unwilling
years
were
to payunwilling to payRET
more for using more for using
sources. RET sources.
Furthermore, Furthermore,
47.1% 47.1% between
of respondents of respondents
40 andbetween
49 years40 wereSustainability 2018, 10, 4269 15 of 20
Sustainability 2018, 10, x FOR PEER REVIEW 15 of 20
neutral
and 49about
yearspaying
were more.
neutralConversely, the largest
about paying more. percentage
Conversely,(34.1%) of respondents
the largest willing
percentage to pay
(34.1%) of
more for using RETs were 18 to 29 years old.
respondents willing to pay more for using RETs were 18 to 29 years old.
Sustainability 2018, 10, x FOR PEER REVIEW 15 of 20
and 49 years were neutral about paying more. Conversely, the largest percentage (34.1%) of
respondents willing
Figure 10.
Figure 10. to payto
Willingness
Willingness tomore for environment
save the
save using RETs (percentages
were 18 to 29 yearsemployment
within old. status categories).
100%
90%
80%
70%
60%
Unwilling
50%
Neutral
40% Willing
30%
20%
10%
0%
18 to 29 30 to 39 40 to 49 50 or more
Figure 10. Willingness
Figure to save the
11. Willingness environment
to save (percentages
the environment within employment
(percentages status categories).
within age categories).
Figure 11. Willingness to save the environment (percentages within age categories).
100%
90%
80%
70%
60%
UnwillingSustainability 2018, 10, 4269 16 of 20
Sustainability 2018, 10, x FOR PEER REVIEW 16 of 20
Figure
Figure 12.
12. Willingness
Willingness to
to pay
pay more
more for using RETs (percentages within age
age categories).
categories).
This research
research study
studyrevealed
revealedthat thatrespondents
respondentsare aremore
morelikely to to
likely have
havebackground
background knowledge
knowledge on
RET
on sources
RET sourcesin in
thethe
following
following order:
order:solar,
solar,wind,
wind,sea
seawave,
wave,hydroelectric,
hydroelectric, geothermal, biomass.
geothermal, and biomass.
Moreover, results revealed that the educational level of respondents was the most significant
determinant of background knowledge on RET RET sources. Respondents were
sources. Respondents were likely
likely toto save the
environment, own ownRETs,
RETs,change
changefrom fromtraditional
traditionalenergy
energy sources
sources to to
RETRET sources,
sources, andand to invest
to invest in
in the
the infrastructure
infrastructure of RETs,
of RETs, withwith
onlyonly
a smalla small percentage
percentage neutral
neutral or unwilling.
or unwilling. However,
However, it is evident
it is evident that
that 74.5%
74.5% are neutral
are neutral or unwilling
or unwilling to pay tomore
pay more for using
for using RET sources
RET sources as an as an alternative.
alternative. The results
The results show
showemployment
that that employment statusstatus
and andage agewere werethethe mostsignificant
most significantsociodemographic
sociodemographic determinants
determinants of
respondents’ willingness
respondents’ willingnessto save
to savethe environment.
the environment.Additionally, age is theage
Additionally, mostis significant
the mostdeterminant
significant
of respondents’
determinant willingness towillingness
of respondents’ pay more for using
to pay RETfor
more sources. It worth
using RET mentioning
sources. It worththat employment
mentioning that
status and age may have acted as overarching proxy variables to other variables
employment status and age may have acted as overarching proxy variables to other variables (e.g., (e.g., income level,
and marital
income level,status) in determining
and marital status) in the willingness
determining theof respondents.
willingness Despite the fact
of respondents. that the
Despite none ofthat
fact the
respondents
none aged 30 toaged
of the respondents 49 were
30 tounwilling to save the
49 were unwilling environment,
to save it was itthe
the environment, wasmost neutral
the most and
neutral
unwilling
and group
unwilling to pay
group moremore
to pay for theforusethe of
useRETs. ThisThis
of RETs. result is important,
result especially
is important, because
especially this this
because age
category
age represents
category represents53%53%of the
of total sample
the total size.size.
sample
5. Conclusions
5. Conclusions
Results of
Results of this
thisresearch
researchstudy
studydisclose
disclose thethe status
status of the
of the background
background knowledge
knowledge on sixonRETs
six RETs
and
and the willingness of adoption in the western region of Saudi Arabia.
the willingness of adoption in the western region of Saudi Arabia. The contribution of this study The contribution of this
is
study is the revealed information on: how respondents rated and ranked their
the revealed information on: how respondents rated and ranked their level of background knowledge level of background
knowledge
on on RET
RET sources; sources;
their their willingness
willingness perspectives perspectives
to adopt RET to adopt
sourcesRET
and sources
how they and rank
how them;
they rank
the
significant sociodemographic determinants of background knowledge on RET sources; and and
them; the significant sociodemographic determinants of background knowledge on RET sources; the
the significant
significant sociodemographic
sociodemographic determinants
determinants of willingness
of willingness perspectives
perspectives to adopt
to adopt RETRET sources.
sources.
Respondents were
Respondents were likely
likely to
to have
have background
background knowledge
knowledge on on RET
RET sources
sources in in the
the following
following order:
order:
solar, wind, sea wave, hydroelectric, geothermal, and biomass. Results also indicate that the main
solar, wind, sea wave, hydroelectric, geothermal, and biomass. Results also indicate that the main
factor influencing
factor influencingthe thewillingness
willingnesstoto adopt
adopt RETs RETs is economical.
is economical. Further,
Further, resultsresults revealed
revealed thatmost
that the the
most significant sociodemographic determinant is the educational level of
significant sociodemographic determinant is the educational level of respondents. This finding respondents. This finding
indicates that
indicates thateducation
educationis is paramount
paramount for for
increasing the level
increasing of awareness
the level on RETs.
of awareness onMoreover, findings
RETs. Moreover,
revealed that
findings the employment
revealed status and age
that the employment of respondents
status and age were also significant
of respondents were sociodemographic
also significant
sociodemographic determinants of their willingness to save the environment and pay more for using
RET sources as alternatives. The analysis showed that younger respondents aged 18 to 29 were moreYou can also read