Performance Evaluation of Stormwater Management Systems and Its Impact on Development Costing - MDPI
←
→
Page content transcription
If your browser does not render page correctly, please read the page content below
water
Article
Performance Evaluation of Stormwater Management
Systems and Its Impact on Development Costing
Farjana Akhter *, Guna A. Hewa, Faisal Ahammed , Baden Myers                and John R. Argue
 School of Natural and Built Environments, University of South Australia, Mawson Lakes 5095, Australia;
 guna.hewa@unisa.edu.au (G.A.H.); faisalahammed.ahammed@unisa.edu.au (F.A.);
 baden.myers@unisa.edu.au (B.M.); john.argue@unisa.edu.au (J.R.A.)
 * Correspondence: akhfy002@mymail.unisa.edu.au; Tel.: +610470257234

 Received: 29 November 2019; Accepted: 24 January 2020; Published: 30 January 2020

 Abstract: The contribution of this paper is a comparison of the installation cost of a conventional
 drainage system consisting of a network of pits and pipes, with that of a hybrid drainage system
 comprising a network of pits and pipes, supported by allotment scale infiltration measures in a modern
 greenfield residential development. The case study site is located in Pipers Crest, near Strathalbyn,
 South Australia. This as-built site consists of 56 allotments, 42 pits (hence 42 sub-catchments),
 one detention basin and over 1000 m of drainage pipes. In this study, conventional and hybrid
 (combination of conventional and Water Sensitive Urban Design, WSUD systems) drainage systems
 were designed to convey minor storm events of 10% annual exceedance probability (AEP), and checked
 for major storm events of 5% AEP, using the DRAINS model and/or source control principles.
 The installation costs of the conventional and hybrid drainage systems were estimated and compared
 based upon cost estimates derived from Australian literature. The results of the study indicate that
 satisfactory drainage was possible using the conventional or hybrid system when the two systems
 were designed to have outflow not exceeding the pre-developed flow. The hybrid drainage system
 requires smaller pipe sizes compared to the conventional system. Also, the size of the detention basin
 and maximum outflow rate of the hybrid system were smaller than those for the conventionally
 drained site. The installation cost of the hybrid drainage system was 18% less than that of the
 conventional drainage system when the objective was to accommodate 10% and 5% AEP storms.

 Keywords: urban drainage; DRAINS model; source control; WSUD; costing

1. Introduction

1.1. Backgraound
     Urban hydrology is a part of land hydrology, defined as an interdisciplinary science of water,
investigating biochemical and physical changes to the hydrological processes and their impacts on
an urban catchment [1–4]. Bajracharya et al. [5] stated that urbanization is a universal trend of the
twenty-first century. Population growth and the movement of people from rural to urban settings
cause land use changes in the form of urbanization [6]. Around 55% of the global population currently
lives in urban areas, and over 500 of the world’s cities have more than one million residents [1,7].
Australia has a population of 25.1 million, where 67% of total population lives in eight major urban
developed cities [8,9]. Land use changes affect storm runoff characteristics; significant increases in
runoff volume are caused by increased impervious areas such as roofs, roads, parking lots, footpaths
and other imperviousness in the urbanized landscape [4,5,10,11]. Urbanization can also lead to a
reduction in infiltration, decreases in groundwater recharge and deteriorating water quality in the
drainage system [5,12–14].

Water 2020, 12, 375; doi:10.3390/w12020375                                       www.mdpi.com/journal/water
Water 2020, 12, 375 2 of 19
As a result, urbanization increases the possibility of regular flooding, can compromise the effect
of existing drainage facilities, increase the erosion of natural streams and can lead to water quality
deterioration in receiving water bodies [1,5,15,16]. So, urban hydrology has been developed as a
specialized field to explore these problems [17].
Urbanization can also affect local wind and climate systems, leading to increase in runoff and
evaporation. Local effects can include reduced vegetation and reduced soil moisture, resulting in
temperature increases [18,19]. Changes in vegetation cover and radiation can have a significant effect
on precipitation over a local urban area and its surroundings [20].
To overcome problems associated with urbanization, innovation in urban stormwater management
has become vital for urban planning, design and management [21]. Prior to the 1980s, stormwater
runoff was considered as a waste product requiring quick disposal to receiving water bodies [22,23].
The main objective of a conventional drainage system is to collect and dispose of stormwater runoff as
quickly as possible from residential and commercial areas to nearby receiving water bodies to avoid
flooding [24–28].
Conventional systems provide no opportunity to save stormwater as a resource because the
objective is to remove runoff within as short a time as possible [29–33]. A range of stormwater
management approaches including conventional drainage systems, water sensitive urban design
(WSUD) systems and Best Management Practices (BMPs), have been developed to mitigate flooding
and water quality problems over the last few decades [1,34]. These WSUD concepts were introduced
in Australia in the 1990s [22,35]. A component of the WSUD approach to water management
is “source control”. The main aim of source control is to hold the rainwater where it falls,
thereby minimizing the negative impact of changes to the water cycle caused by urbanization.
Applying source control and other WSUD techniques helps not only to manage the quantity of
urban runoff, but also improves water quality before it reaches the receiving water bodies [34,36,37].
The concept of WSUD is known by different names in other countries; for example: Low Impact
Development (LID), Low Impact Urban Development and Design (LIUDD), Sustainable Drainage
Systems (SuDS) and Experimental Sewer System (ESS) [1,24,38].
1.2. Aims of the Paper
The first task of the project was to design the elements of a conventional storm drainage system
for the 56-lot greenfield development case study at Pipers Crest in South Australia. This was followed
by the design of on-site elements of the development considered from the water-sensitive perspective,
as well as a supporting street drainage system, including pipes and pits. The result was a “hybrid”
drainage system comprising conventional drainage and WSUD elements.
The natural, pre-development state of the catchment was used as the benchmark for the two systems.
The development stage of the catchment is defined as that which occurs after a residential development
has occurred, including all residential allotments, the road network and drainage infrastructure.
The common practice to design a conventional drainage system in Australia is to develop a
DRAINS model for the development [39]. According to local government of South Australia guidelines,
storm events at 10% annual exceedance probability (AEP) are considered as minor storms for designing
conventional stormwater drainage systems in the DRAINS model, and those at 5% AEP are considered
as major storms for checking the design. The 2016 design rainfalls provide more accurate estimates
than Australian Rainfall and Runoff (ARR1987), combining contemporary statistical analysis and
techniques with an expanded rainfall database [39]. Therefore, the 2016 Intensity–Frequency–Duration
(IFD) design rainfalls with the 2016 edition of ARR2016 have been used for the design [39,40].
Hybrid drainage system refers to the developed catchment with a combination of conventional
drainage system and WSUD elements, where stormwater comes from the roof of each allotment, and is
managed by infiltration or reuse systems. The runoff that comes from roads and other pervious areas
of total study area, excluding the roof area of each allotment, are managed by the conventional part of
the hybrid system.Water 2020, 12, 375 3 of 19
The hybrid drainage system is a multi-beneficial drainage system, because with WSUD, part of the
stormwater can be saved for re-use, and the rest can be managed by a conventional drainage system.
The main aim of the paper was to compare the costs of the two drainage systems referred to above
as conventional and hybrid systems for the modern 56-lot residential development at Pipers Crest in
South Australia. These tasks are summarized as follows:
• Design of conventional and hybrid drainage systems for the selected catchment, using the DRAINS
modeling tool and source control principles.
• Estimation of the installation cost of the two drainage systems based on the guidelines from the
Australian literature, and
• Comparison of the performance and the cost-effectiveness of the two drainage systems by taking
the pre-developed scenario as the benchmark.
2. Materials and Methods
2.1. Study Area
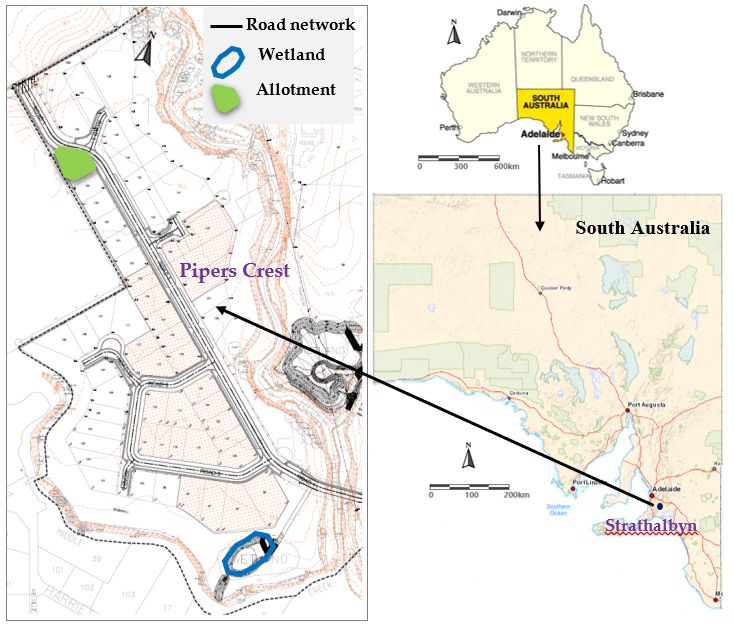
Pipers Crest is a residential subdivision located on the Fleurieu Peninsula of South Australia.
The site is located 60 km southeast from the state capital, Adelaide, and sits on the banks of the Angas
River [41]. The subdivision area is 6.71 ha, in which a total of 56 allotments were constructed between
2015 to 2019. The allotment areas vary from 491 m2 (allotment no. 121 with a roof area of 198 m2 )
to 2787 m2 (allotment no. 146 with a roof area of 760 m2 ), with a mean of 917 m2 . Roof area in the
development ranges between 130 and 826 m2 with a mean of 316 m2 . The mean annual rainfall and
evapotranspiration are 491.9 and 1472.2 mm respectively, based on data 0.4 km and 2.6 km from
the site (Australian Bureau of Meteorology Station 023747 and 024580) [42]. The site is generally dry
in summer and wet in winter. The dominant soil type is considered in the study to be sandy clay.
Based upon procedures in local stormwater management design guidelines—Australian Rainfall and
Runoff—rainfall intensities for one-hour storm duration (design) at 10% and 5% AEPs are 23.7 and
28.3 mm/h, respectively [39]. The layout of the existing conventional drainage system at Pipers Crest
was made available by the design consultant, Aurecon Australasia Pty Ltd. (An engineering and
infrastructure consulting company), and consists of 42 on-grade single pits and 43 concrete pipes of
varying sizes to convey stormwater to the adjacent creek. Based on this information, the detailed road
and drainage networks are shown in Figure 1.
2.2. Study Approach
Two types of drainage systems, namely a conventional and a hybrid drainage system,
were designed for 10% storm events, and were checked for 5% AEP storm events with a one-hour
storm duration. In designing any conventional system, total areas including allotment (pervious and
impervious) and road areas are considered as the contributing area; while in designing hybrid drainage
systems, the roof area (only) of each allotment is managed by the WSUD elements, and the remainder
is considered as contributing to the street drainage system. After designing both drainage systems,
the installation cost of each system was estimated using local construction and WSUD cost estimation
data [44,45]. The design and cost estimation procedure of both drainage systems are described in
Sections 2.2.1–2.2.3.Water 2020, 12, 375 4 of 19
Water 2020, 12, 375 4 of 20
Figure 1. Pipers Crest development site, Strathalbyn, South Australia [43].
Figure 1. Pipers Crest development site, Strathalbyn, South Australia [43].
2.2.1. Design Procedure of Conventional Drainage System
2.2. Study Approach
DRAINS is a stormwater drainage system design and analysis tool that was first released in
Two in
Australia types of drainage
January 1998, and systems, namely
is widely a conventional
used for and a system
urban stormwater hybrid drainage
design andsystem, were
analysis in
designed and
Australia for 10%Newstorm events,
Zealand and to
at small were checked
large for 5% AEP
scales [46,47]. stormconsists
DRAINS events of
with a one-hour
several storm
components,
duration. ILSAX,
including In designing any conventional
the rational system,rational
method, extended total areas
methodincluding allotment
(ERM) and (pervious
ARR 2016 IL-CLandfor
converting rainfall inputs to runoff; it also includes several flow routing procedures [48,49]. The hybrid
impervious) and road areas are considered as the contributing area; while in designing ILSAX
drainage systems,
component the roof
of DRAINS is aarea (only) simple
relatively of eachmathematical,
allotment is managed by the
event-based WSUDcommonly
model, elements, used
and the
in
remainder is considered as contributing to the street drainage system. After designing both
Australia to simulate runoff flows in urban catchments based on the time-area routing procedure [49,50]. drainage
systems,
ILSAX theuses
installation cost of
Manning’s each system
equation wasrouting
for pipe estimated
andusing
the local construction
Horton equation and WSUD cost
to estimate the
infiltration losses of pervious areas. The DRAINS model needs design rainfall data, user specified are
estimation data [44,45]. The design and cost estimation procedure of both drainage systems pit
described
details, in Sections 2.2.1
sub-catchment to 2.2.3.
details and travel time data, pipe layout and overflow route details as inputs.
The “AS/NZS 3500.3.2018: Stormwater Drainage” provides specifications for selecting these elements
2.2.1. Design Procedure of Conventional Drainage System
of stormwater drainage systems. Finally, resulting runoff hydrographs and suitable pipe sizes are
givenDRAINS
as outputs.is aThough DRAINS
stormwater is widely
drainage systemused for commercial
design andtool
and analysis consulting
that waswork, only a few
first released in
studies
Australiahave adopted1998,
in January it for and
research [51,52].
is widely Wefor
used adopted
urban the DRAINSsystem
stormwater stormwater
designdrainage system
and analysis in
design tooland
Australia for New
identifying
Zealandtheatappropriate
small to largepipe requirements
scales for the case
[46,47]. DRAINS study
consists of site. Thecomponents,
several elements of
the design ILSAX,
including proceduretheare described
rational in theextended
method, followingrational
sections.
method (ERM) and ARR 2016 IL-CL for
converting rainfall inputs to runoff; it also includes several flow routing procedures [48,49]. The
ILSAX component of DRAINS is a relatively simple mathematical, event-based model, commonly
used in Australia to simulate runoff flows in urban catchments based on the time-area routing
procedure [49,50].Water 2020, 12, 375 5 of 19
The Hydrological Model Set Up
The ILSAX hydrological model requires the following to be nominated as input parameters: soil
type and depression storage for impervious, supplementary and pervious areas. These are sensitive to
both runoff volume and peak flow rate [53]. Depression storage is an initial loss: it is the depth of
rainfall that is retained in depressions after infiltration on both pervious and impervious surfaces [54,55].
According to the DRAINS user manual, depression storage varies from 0 to 5 mm for impervious and
supplementary areas and from 2 to 10 mm for pervious areas. The parameter “soil type “defines the
infiltration process of pervious areas: it follows the US soil conservation service system of four soil
types [56]. These are sand, sandy clay, medium clay and heavy clay soil types, respectively. In this
paper, the values of depression storage were set as 1 mm for impervious and supplementary areas,
and 5 mm for pervious areas, the latter value corresponding to that applicable to sandy clay soil type.
Rainfall Data Set Up
Any study involving design rainfall needs historical rainfall data or rainfall
Intensity–Frequency–Duration (IFD) relationships [57,58]. In Australia, conventional drainage systems
are generally designed using IFD relationships available from the Australian Bureau of Meteorology.
IFD is defined as a three-way relationship to explain the statistical distribution of rainfalls occurring
over different time periods in a study location [47,59,60]. In this study, the 2016 IFD design rainfall
data were used, as they provide more up-to-date estimates. DRAINS needs values for nine parameters
in order to calculate the IFD relationship at a specific location. These parameter values are: rainfall
intensities at 50% and 2% AEPs for 1-, 12- and 72h durations; skewness, G of the log-transformed daily
rainfall; frequency factors, F50 and F2 for 50% and 2% AEPs.
The study area, Pipers Crest, is located in Zone 6: the South Australian Gulf [61]. The critical
storm duration was calculated to be one hour, based on the overland flow travel time estimation
technique proposed by Argue [62]. The average rainfall intensities for the 10% and 5% AEPs events
were calculated as 24.6 and 30.7 mm/h, respectively.
Pit Locations and Types
The pit in a storm drainage system is a node where water enters the drainage system. At a node
point, the pipe can change its direction, slope or size [47]. A stormwater pit serves several purposes
from a modeling perspective [63]. A node can be used to represent a street gully pit (or inlet), a manhole,
a junction and a flow diversion [64,65]. There are two types of gully pits used in Australia: (a) on-grade
pits and (b) sag pits. On-grade pits are generally located on slopes, and these allow bypass flows
to travel past one gully pit to the next. Sag pits are in hollows or depressions, so that water cannot
readily escape. The pressure (head) loss coefficient, Ku is a dimensionless coefficient for full pipe flow,
whose value varies with the geometry of the pit [66]. It defines the changes between the hydraulic
grade line (HGL) and the total energy line (TEL) at a pit due to turbulence and other effects. The HGL
is the most crucial property of a drainage system because it indicates the pressure level operating
in a pipe or channel. The pressure loss coefficient, Ku enables changes of HGL in a pipe system to
be calculated.
The DRAINS manual suggests the value of Ku to be 4 or 5 at the starting point (top point) of a
drainage line, and 0.5, a conservative value, for pits in straight flow. However, Ku of 1.5 is recommended
when any pit changes the direction by more than 60◦ .
The DRAINS model includes a gully pit blockage factor taking account of the capacity reduction
due to blockage by debris: it varies from 0 (fully open) to 1 (entirely blocked) [67,68]. Based on
recommendations given in the DRAINS software manual, the blockage factor was assumed to be 0.2 for
on-grade gully pits and 0.5 for sag pits.
As noted earlier, the Pipers Crest development consists of a total of 42 pits. Their locations
were verified through field visits. On-grade gully pits were considered to have 3% crossfall and 1%Water 2020, 12, 375 6 of 19
longitudinal grade. Finally, the surface elevation of each pit was determined using a contour map of
the site.
Sub-Catchment Data
The input parameters of a DRAINS sub-catchment include: size, impervious (paved) area,
supplementary paved area, pervious (grassed) area and travel time (or time of concentration) for
runoff to concentrate at the catchment outlet [69]. The impervious area (road area and roof area),
supplementary area (other paved, e.g., footpath and driveway) and pervious area of each sub-catchment
were estimated from the Google map of Pipers Crest. For the conventional drainage system, the total
impervious area included allotment roofs, driveways and road area. For the hybrid drainage system,
only the road area fronting each allotment was considered to calculate impervious area, as it was
assumed that allotment roof area was connected to an adequate infiltration system using the design
procedures described below.
Travel Time Calculation
“Travel time” is a hydrological concept that provides the critical storm duration, and hence, critical
flow rates in a catchment. It is the time required for stormwater to flow from the most remote point in
a catchment to the outlet through the natural and formal flow paths. It is a function of the topography,
geology and land use within a catchment [70]. In the DRAINS tool, separate travel time is required for
pervious and impervious areas. The travel time was calculated using the procedures described by
Argue [62]. As recommended by Argue [62], a 5 min travel time should be used for residential roofs
where water is directly conveyed to the nearest drainage channel. Thus, a minimum travel time, 5 min,
was adopted for the impervious area of each sub-catchment. The estimated travel time for the pervious
area of the 42 sub-catchments varied from 10 to 60 mins.
Pipe Type and Details
A pipe is a circular, closed conduit that drains stormwater from one pit to another [71]. For pipe
design in DRAINS, this includes variables relating to pipe type (material and class), the minimum pipe
cover, Manning’s roughness, the pipe length, pipe size, invert levels at the upstream and downstream
ends and the pipe slope (%). Manning’s roughness (n) value is the most commonly used parameter to
account for losses in open channel flows. The flow velocity and flow rate at a cross section is calculated
using Manning’s equation. The total energy line (TEL) of each pipe defines the surface elevation of the
connecting pit, while the pipe invert levels are the lowest point on its interior surface [48]. Upstream
and downstream invert levels of each pipe are calculated by subtracting minimum pipe cover and
pipe size from the total energy line level. The slope of each pipe was determined from upstream and
downstream invert levels data and pipe length.
According to the “AS/NZS 3500.3.2018: Stormwater Drainage” and local council’s (City of
Alexandrina) guidelines, minimum values for pipe size, pipe cover and slope and maximum pipe
length were adopted as 300 mm, 600 mm, 0.5% and 100 m, respectively. The material and class of pipe
were selected as concrete, under roads: 0.5% minimum slope was adopted for each pipe in the study
area. Pipe roughness (n) was entered as a default value for concrete, 0.013 s/m1/3 .
Overflow Route Details
Overflows are defined as the stormwater flows that bypass the conventional drainage system
during events which exceed the design capacity [72]. Upwelling can happen when a downstream
pipe has insufficient flow capacity. Overflow routes are used to define the hydraulic characteristics of
the surface flow paths along which water flows from pits, headwalls or detention basins [47]. In the
DRAINS model, the required inputs for overflow pathways are: the reach length of the channel,
the overflow travel time between pits, the invert levels, the channel cross section, slope, safe depth and
acceptable velocity. The cross section of the overflow route wizard produces a shape of cross sectionWater 2020, 12, 375 7 of 19
that should be specified as physically realistic for the flows that will occur. The DRAINS tool selects
pipe sizes in a way that ensures the resulting overflow from the design event meets the requirements of
safe depths, velocity and flow rates. “Percentages of downstream areas” are used to define the quantity
of sub-catchment flow appearing at the downstream pit in an overflow situation. This allows for flow
characteristics to be calculated at all points along the overflow route.
Overflows follow the drainage pipe pathways, and hence the corresponding overflow reach
lengths are identical to the underlying pipe lengths. According to the DRAINS manual, 2 mins of
travel time is adopted for each overflow route. The surface elevations of the upstream and downstream
pits were taken as the invert levels at the upstream and downstream ends of each overflow route,
respectively. Based on field observations, the shape of each overflow route was decided to be a 7.5%
roadway with 3% crossfall and barrier curb. According to the local council’s guidelines (those of the
Alexandrina city council) for stormwater system design, the safe depth for major storm and minor
storm and the safe depth ×velocity values were set as 0.3 m, 0.15 m and 0.4 m2 /s, respectively [73].
Detention Basin
Stormwater management design guidelines for local councils [73,74] require several design
criteria. One of the most important is that the outflow peak flow at the post-development stage should
not exceed the pre-development outflow rate for both minor and major storm events. To meet this
guideline, a downstream detention basin is typically included to limit and control post development
flows to pre-development flows in urban developments. The input characteristics that are required for
designing a detention basin in DRAINS include: initial water level, storage infiltration characteristics
(elevation–perimeter and hydraulic conductivity), an elevation–surface area (or elevation–volume)
relationship and a low-level outlet specification. The low-level outlet includes five options: an orifice
acting as a free outfall, a pit or sump outlet, a circular conduit, a rectangular channel and no outlet.
An orifice outlet was selected as the low-level outlet in this project. Based on guidelines provided
by the local government authority [74], the detention basin was assumed to be a trapezoidal prism
with an average coefficient of discharge (Cd ) of 0.61, 1:5 ratio batters and a maximum water depth
of 1.2 m. The diameter of the orifice plate was taken as 140 mm and 160 mm for 10% and 5% AEP
events, respectively, where the pipe diameter was 375 mm; the center elevation was taken as 68.30 m.
Cd depends on the ratio of orifice to pipe diameter called the beta ratio and Reynold’s number [75].
Water 2020, ratio
The beta 12, 375was calculated as 0.37, and Cd has been found as 0.61 from the following Figure 82.of 20
Figure 2. Bar diagram of coefficient of discharge (Cd ) for different beta ratios
Figure 2. Bar diagram of coefficient of discharge (Cd) for different beta ratios
Inputs into the infiltration data wizard were; perimeter and elevation of the two detention basin
Inputs into the infiltration data wizard were; perimeter and elevation of the two detention basin
cases and hydraulic conductivity of sandy clay soil (3 × 10⁻⁵ m/s). These data enabled the infiltration
cases and hydraulic conductivity of sandy clay soil (3 × 10⁻⁵ m/s). These data enabled the infiltration
losses from basin areas to be calculated. Detailed design of the two detention basins is presented in
losses from basin areas to be calculated. Detailed design of the two detention basins is presented in
Section 3.2.
Section 3.2.
Dummy Outlet
The outlet node is the end or the receiving point of a drainage system: it can be connected to a
detention basin [47]. The dummy outlet was placed at the end of the last pipe (Pipe43), as this
particular pipe cannot re-enter the system due to the surface elevation constraints of the site.Water 2020, 12, 375 8 of 19
Dummy Outlet
The outlet node is the end or the receiving point of a drainage system: it can be connected to
a detention basin [47]. The dummy outlet was placed at the end of the last pipe (Pipe43), as this
particular pipe cannot re-enter the system due to the surface elevation constraints of the site.
Design Criteria
After defining all necessary design inputs, the DRAINS model was run many times under
conditions of the selected storm events (minor and major), varying pipe sizes until no flooding,
adequate freeboard at all pits and ‘safe’ flows occurred through all overflow routes. The detailed
results of the model output are presented in Section 3.
2.2.2. Design Procedure of Hybrid Drainage System
The design of hybrid WSUD systems has been previously described by Akhter et al. [76]. In the
project at Pipers Crest, hydraulic designs of three infiltration systems (a leaky well, soakaway or
infiltration trench for each allotment) were undertaken simultaneously for the sandy clay soil condition
using procedures developed by Argue [22]. As in conventional system design, the hybrid systems
were also designed for 10% and 5% AEP storm events. One of the three infiltration systems was then
selected based on satisfactory performance in meeting clearance distance criteria for footings and
property boundaries (2 m for sandy clay soil), as well as emptying time criteria (2 days for 10% AEP
and 2.5 days for 5% AEP storm events). In any allotment where all three infiltration systems failed to
meet the design criteria, the option of using a large rainwater tank was available. Finally, from the
possible WSUD systems (infiltration systems/rainwater tank), the most economical one was selected to
install in each allotment. The detailed design outcomes of the infiltration systems investigation in the
sandy clay soil condition is summarized in Section 3.1.
2.2.3. Installation Cost of Drainage Systems
As explained above, this study sets out to design two drainage systems, one conventional, the other
hybrid, and to compare the costs of installation of each. Taking account of the two flood conditions
under consideration (minor and major events), this leads to a total of four scenarios to be costed.
Installation cost of any system consists of two major components; material cost and labor cost.
In this costing process, two sources were used: Australian cost estimation dataset [45] and
local construction cost estimation data [44]. In costing a conventional drainage system, the following
components are to be considered:
• trench excavation,
• backfilling trenches using the excavated material,
• pipes
• dual rubber ring joints for pipes,
• precast concrete base, walls and pipe cover,
• gully pits,
• inclined bend from one pit to another, and
• detention basin construction cost.
The cost of the detention basin includes trench excavation (exceeding 300 mm wide) by machine
with 1000/2000 mm total depth and extra cost for disposal of surplus excavated material in sandy
clay soil.
On the other hand, the cost components of a hybrid drainage system include those of the
supporting conventional system together with the following components of the infiltration systems:
• excavation for the infiltration system,Water 2020, 12, 375 9 of 19
• installation of the geofabric liner,
• placement of a perforated pipe, gravel storage layer and topsoil layer,
• application of grass seed, fertilizer and watering, and
• the rainwater tank unit, where applicable.
The items that are to be considered in estimating the cost of a rainwater tank unit include the
supply and installation of a round, galvanized tank, pumps, plumbing and fittings, float system and
concrete base.
The cost of pipes, pits and the detention basin was estimated in Australian dollars ($AUD),
using Rawlinsons’ unit rates in 2018 [45]. The cost of WSUD systems was estimated in $AUD using
the WSUD technical manual 2010 [44] and was converted into 2018 using an inflation calculator [77].
The details of the costing process are presented in Section 3.6.
3. Design Outcomes of the Two Drainage Systems
3.1. Design Result of WSUD Systems
In the paper published by Akhter et al. [76], it was found that satisfactory performance for
draining the roof areas of all allotments located in sandy clay should be achieved using the available
three infiltration systems (leaky well, soakaway or infiltration trench) in combinations with a 1 KL
rainwater tank. However, when costs of these alternatives were considered, the leaky well emerged
as the preferred option. In particular, considering the design outcomes of 10% AEP events, it was
found that installation of one leaky well was required for 54 allotments, while two leaky wells were
required for two large allotments (no. 146 with roof area 826 m2 and no. 140 with roof area 769 m2 ).
When the consideration was 5% AEP events, leaky well was also found to be the most economical
option. However, two leaky wells were needed for an additional allotment (no. 135 with roof area
497 m2 ).
3.2. Detention Basin Design: Dimensions, Inflow Rate, Outflow Rate and Water Levels
A detention basin fitted with an orifice plate outlet was placed at the end of both the conventional
and hybrid drainage systems to limit discharge in accordance with the local government requirement
that the outflow peak after development should not exceed that from the pre-development site.
The pipe40 (diameter 675 mm, length 7.55 m and slope 1.32%) which drains directly to the detention
basin, was found to be the pipe with the highest peak flow rate.
As a result, pipe40 needed to be the largest pipe to effectively deliver stormwater to the detention
basin of the conventional drainage system. It was required that the detention basin should be able to
attenuate pipe40 peak flow to the pre-development peak flow rates of 0.045 m3 /s and 0.060 m3 /s for
10% and 5% AEP events, respectively.
The dimensions of the detention basins for the conventional and hybrid drainage systems are
shown in Figure 3a–d, respectively.
These results show that the required detention basin volumes for conventional and hybrid
drainage systems are 1785.60 m3 and 738 m3 , respectively, under 10% AEP events. Similarly, in 5%
AEP events, the required detention basin volumes for conventional and hybrid drainage systems are
2239 m3 and 943 m3 , respectively. These outcomes show that the detention volume requirement to
maintain the pre-developed peak runoff can be reduced by more than 50% in the hybrid drainage
system, compared with the requirements for the conventional system, for both minor and major storm
events. Details of the detention basin design for 10% AEP events are presented in Appendix A.As a result, pipe40 needed to be the largest pipe to effectively deliver stormwater to the
detention basin of the conventional drainage system. It was required that the detention basin should
be able to attenuate pipe40 peak flow to the pre-development peak flow rates of 0.045 m3/s and 0.060
m3/s for 10% and 5% AEP events, respectively.
The dimensions of the detention basins for the conventional and hybrid drainage systems
Water 2020, 12, 375
are
10 of 19
shown in Figures 3a–d, respectively.
(a) (b)
(c) (d)
Figure
Figure 3. Detention
3. Detention basin
basin dimension
dimension for minor
for minor storm storm (a) conventional
(a) conventional and (b)drainage
and (b) hybrid hybrid system
drainage
and majorand
system storm (c) conventional
major and (d) hybrid
storm (c) conventional drainage
and (d) hybridsystem.
drainage system.
The question:
These how
results effective
show that are
the the detention
required basins likely
detention basintovolumes
be meeting
for the council requirements
conventional and hybrid
relating to flow
drainage attenuation.
systems Them
are 1785.60 question is answered
3 and 738 in Tableunder
m3, respectively, 1, following.
10% AEP events. Similarly, in 5%
AEP events, the required detention basin volumes for conventional and hybrid drainage systems are
Table 1. Comparison of design output of detention basin for the two drainage systems.
2239 m3 and 943 m3, respectively. These outcomes show that the detention volume requirement to
maintain the pre-developed peak runoff canStorm
Minor be reduced by more than 50% in the
Major hybrid drainage
Storm
system, compared
Design Aspect with the requirements
Conventional forHybrid
the conventional
Drainage system, for bothHybrid
Conventional minorDrainage
and major
storm events. Details of the detention basin designSystem
Drainage System for 10% AEP Drainage
events are presented in
System Appendix A.
System
The outflow
Maximum question:
rate (mhow
3 /s) effective
0.034are the detention
0.032 basins likely to be meeting0.045
0.048 the council
Maximum water level (m) 69.16 69.17 69.28
requirements relating to flow attenuation. The question is answered in Table 1, following. 69.29
Storage volume (m3 ) 667.11 269.81 867.78 365.78
It can be seen in Table 1 that the maximum outflow rates from the detention basin at 10% AEP
are 0.034 and 0.032 m3 /s, respectively (for the two systems), which are significantly smaller than the
pre-development peak flow of 0.045 m3 /s. While the peak values at 5% AEP are 0.048 and 0.045 m3 /s
(for the two systems), which are also much smaller than the pre-development peak flow of 0.060 m3 /s.
The explanation for this is linked to an additional council requirement that water depth in
the detention basin be limited to 1.2 m. The lowest design level of the basin was 68.33 m. Hence,
the maximum allowable water level should be 69.53 m. Table 1 shows variation of the water level at
10% and 5% AEP for the two drainage systems. Taking account of this consideration the maximum
water levels achieved at 10% AEP are 69.16 and 69.17 m, respectively, for the conventional and hybrid
drainage systems. The values at 5% AEP are 69.28 and 69.29 m. Consequently, the maximum water
level in each scenario is below the maximum allowable level of 69.53 m. Therefore, the detention
system satisfies the council requirements and freeboard does not exceed maximum depth for each case.Water 2020, 12, 375 11 of 19
Table 1 illustrates the variation of storage volume during minor and major storm events for the
two drainage systems. When the conventional drainage system is considered, the maximum storage
volumes of the detention basin for 10% and 5% AEP storms are 667.11 and 867.78 m3 , respectively:
values for the hybrid system are 269.81 and 365.78 m3 . These values are well below the full capacity
of 1785.60, 2239, 738 and 943 m3 , respectively. So, the maximum storage volume for both drainage
systems does not exceed the design volume of the detention basin during minor and major storms.
3.3. Vulnerability of Flooding
As noted earlier, the hydraulic grade line (HGL) indicates water level variation along the pipes.
HGL at the pit locations indicates if there is a possibility of upwelling. Upwelling will happen when
HGL is at the total energy line (TEL). One of the design requirements is to have enough height difference
(freeboard) between TEL and HGL for all 42 pits, so that the safety of the public is assured. TEL and
HGL were recorded at each pit from the DRAINS output. Freeboard was produced by analyzing
the height difference between HGL and TEL, using Microsoft Excel for the two drainage systems.
Large values of freeboard at a pit imply less chance of upwelling (in the pit) during flood events; zero
overflows may be possible under this scenario. Small values of freeboard imply the greater chance of
pit overflows. So, large freeboard is better to get later or no water upwelling from any pit to make safe
the study site from the risk of flood. Figure 4a,b produced by analyzing the freeboard values of 42 pits
resulted from the consideration of minor and major storms. It is clear from Figure 4 that median and
minimum freeboard values of the hybrid system are greater than those from the conventional system.
This indicates that the hybrid system gives a better safety margin than the conventional system in both
minor and12,major
Water 2020, 375 storms. 12 of 20
(a) (b)
Figure 4. Freeboard
Figure 4. Freeboardvariation
variationdetermined
determinedforfor
conventional and
conventional hybrid
and drainage
hybrid systems
drainage for (a)
systems for5%
(a)and
5%
(b) 10% annual exceedance probability (AEP) storm events.
and (b) 10% annual exceedance probability (AEP) storm events.
The freeboard data were statistically analyzed to assess if the observed differences in Figure 4
are significant. Table 2 shows the significance results of the normality test.
Table 2. Normality test of freeboard for the two drainage systems.Water 2020, 12, 375 12 of 19
The freeboard data were statistically analyzed to assess if the observed differences in Figure 4 are
significant. Table 2 shows the significance results of the normality test.
Table 2. Normality test of freeboard for the two drainage systems.
Minor Storm Major Storm
Normality Test Conventional Hybrid Drainage Conventional Hybrid Drainage
Drainage System System Drainage System System
Kolomogorov–Smirnov 0.191 0.000 0.028 0.200
Shapiro–Wilk 0.011 0.000 0.000 0.240
Table 2 shows that the freeboard conditions for the hybrid system when subjected to minor events,
and that from the conventional system when subjected to major events, are not normally distributed
(Kolomogorov–Smirnov test). Therefore, the significance between the median freeboard of the two
systems (at minor and major events) was separately assessed through the non-parametric method
(Wilcoxon Signed Rank test). Table 3 (below) shows that the freeboard values of the two systems are
significantly different only at major events. Therefore, the hybrid system shows significantly reduced
risk of flooding (upwelling at the pits) at major events.
Table 3. Hypothesis test of freeboard for the two drainage systems.
Null Hypothesis Test Significance Value Storm Events Decision
Median freeboard of 0.117 Minor storm Values are not significantly different (>0.05)
the two systems 0.000 Major storm Values are significantly different (Water 2020, 12, 375 13 of 19
3.5. Comparison of Overflow Routes
Overflow routes are commonly the flow paths along road surfaces. The overflow route where
the highest flow rate is observed for minor and major events can be seen in the hydrograph plots in
Figure 5. 12, 375
Water 2020, 14 of 20
(a) (b)
Figure 5.
Figure 5. Comparison
Comparison of
of overflow
overflow routes
routes for
for (a)
(a) 10%
10% and
and (b)
(b) 5%
5% AEP
AEP storm
stormevents.
events.
Peak
Peakoverflows
overflowsresulting
resultingfrom
fromboth minor
both andand
minor major storms
major in the
storms in hybrid system
the hybrid are almost
system zero.
are almost
However, with the conventional system, peak overflows varied from 6.8 L/s to 12.2 L/s for 10% and
zero. However, with the conventional system, peak overflows varied from 6.8 L/s to 12.2 L/s for 10% 5%
AEP events.
and 5% AEP events.
3.6.
3.6. Installation
Installation Cost
Cost of
of Drainage
Drainage Systems
Systems
The
The installation
installation costs
costs of
of the
the conventional
conventional andand the
the hybrid
hybrid systems
systems were
were estimated
estimated based
based on on the
the
cost components given in Section 2.2.3. The installation costs of the detention basin,
cost components given in Section 2.2.3. The installation costs of the detention basin, pipes, pits and pipes, pits and
other
otheritems
itemsdetermined
determinedininthisthisstudy
studyarearepresented
presentedin in
Tables
Tables5–7.
5, The
6 andcost
7. of
Thethecost
conventional drainage
of the conventional
system
drainage is quantified by the totalby
system is quantified installation cost of eachcost
the total installation itemofineach
$AUD itemusing the unit
in $AUD ratesthe
using in unit
2018rates
[45].
The installation
in 2018 [45]. costs of various items of (on-site) WSUD systems for the smallest allotment of
Pipers Crest was calculated in $AUD using the WSUD technical manual 2010 [44] and are presented in
Table 7. Then the cost was converted
Table into
5. Cost of 2018 values
detention using
basin for bothinflation
drainagecalculator
systems. [77].
The total installation cost of the conventional drainage system has been estimated as $603.17k
and 637.63k designed for 10% and 5% AEP events, respectively. However, for Detention Total
the hybrid drainage
Price, Storm Drainage
Item installation costs have been
system, the total Unitestimated as $494.66k and $521.17k basinforsize,
10% and 5% cost,
AEP
$AUD event system
m
events, respectively. The installation cost of the hybrid drainage system is about 18% less than that of
3 $AUD
theExceeding 300 mm
conventional wide system for both 10% and 5% AEP
drainage Conventional
storm events. 1785.60 135,706
Minor
trench excavation by 76 $/m
A major factor in achieving a smaller cost for the hybrid drainage system compared56,088
3 Hybrid 738 to the
machine
conventional with 1000/2000
system is the significantly smaller detention Conventional
basin volume required. 2239 170,164
Major
mm total depth Hybrid 943 71,668
Table 5. Cost of detention basin for both drainage systems.
Table 6. Cost of different items of the conventional drainage system (pipe and pit network).
Drainage Detention Total Cost,
Item Price, $AUD Unit Storm Event
System Total Size, m3
BasinPipe $AUD
Price, Pipe Size, Total Cost,
Item
Exceeding 300 mm wide Unit Conventional Length, m
1785.60or 135,706
$AUD Minor mm $AUD
trench excavation by Hybrid Total Pit
738no. 56,088
76 $/m 3
machine with 1000/2000 Pipe Details
Conventional 2239 170,164
Major
mm
300 total
mm depth
wide trench Hybrid 943 71,668
11.75 $/m 300 207.01 2,432
excavation
Exceeding 300 mm wide
77.5 $/m 581.08 45,034
trench excavation
500 mm soil depth
backfilling with excavated 65 $/m3 300 7.73 75
material
1000 mm soil depth
backfilling with excavated 65 $/m3 375 74 1,804Water 2020, 12, 375 14 of 19
Table 6. Cost of different items of the conventional drainage system (pipe and pit network).
Total Pipe
Pipe Size, Total Cost,
Item Price, $AUD Unit Length, m or
mm $AUD
Total Pit no.
Pipe Details
300 mm wide trench excavation 11.75 $/m 300 207.01 2432
Exceeding 300 mm wide trench excavation 77.5 $/m 581.08 45,034
500 mm soil depth backfilling with
65 $/m3 300 7.73 75
excavated material
1000 mm soil depth backfilling with
65 $/m3 375 74 1804
excavated material
Dual rubber ring joints 138 $/m 300 207.01 28,567
Pit Details
Precast base and walls with 900 mm diameter &
1005 $/no. 42 42,210
900 mm deep
Extra cost for each additional 100 mm in depth 72 $/no. 42 3024
Precast concrete cover 160 $/no. 42 6720
Pipe bend
360 $/no. 300 360
45 degree 610 $/no. 450 610
1035 $/no. 525 1035
88 degree 760 $/no. 375 760
Table 7. Unit cost of smallest allotment (area 496 m2 ) for the water sensitive urban design (WSUD)
process installation.
Item Quantity Unit Rate Cost ($/m)
Excavate and stockpile 2.93 m3 /m 20 58.6
Supply and install geofabric liner 59 m2 /m 5 295
Supply and place perforated pipe (100 mm diameter) 5 m/m 13 65
Supply and place gravel storage layer 2.93 m3 /m 65 190.45
Supply and place topsoil layer (300 mm minimum thick) 0.44 m3 /m 70 30.8
Supply and apply grass seed, fertilizer and watering 1.47 m2 /m 1 1.47
Indicative 1 KL rainwater tank system costs $1590
Note: Cost = Quantity * rate.
4. Conclusions
This paper has explored the drainage infrastructure comparison of two categories of drainage
systems applied to a developed residential sub-division of a modern suburb in South Australia.
The objectives were to design a conventional and a hybrid drainage system for Pipers Crest using
the DRAINS modeling tool and for the installation of both systems. Pipe size, length, detention
basin and other important elements were modeled for both drainage systems, taking account of the
local council’s guidelines and the DRAINS manual. The impervious, supplementary and pervious
area percentages were properly classified and entered for each drainage system. DRAINS output
showed adequate freeboard, safe flow, and no water upwelling from any pit for both 10% and 5%
AEP events. The stormwater flow was passed through upstream pipes to downstream pipes and
finally discharged through a detention basin at the outlet of the study catchment. Considering the
installation cost, the hybrid drainage system was more economic, strongly influenced by the cost
of the larger detention basin required by the conventional drainage system. The hybrid system has
reduced material consumption and reduced urbanization impact downstream when compared to the
conventional system
In this paper, the performances of both drainage systems have been performed for 10% and
5% AEP events. Checking the performance of the system when exposed to a much greater storm
intensity such as the 1% AEP, was considered out of scope with this typical design scenario, but willWater 2020, 12, 375 15 of 19
be considered for future work. The findings of this paper may contribute to the economic analysis
of WSUD systems by other researches. The installation cost of the hybrid drainage system has been
estimated at the development stage by adding the cost of WSUD components. However, WSUD
systems have several additional direct and indirect benefits, which have not been examined in this
paper. In future, life cycle cost and benefit of WSUD systems need to be estimated to assess the full
economic feasibility of WSUD systems.
Author Contributions: Conceptualization, F.Ak., G.A.H., F.A., B.M. and J.R.A.; methodology, F.Ak., G.A.H., F.A.
and B.M.; software, F.Ak., G.A.H., F.A. and B.M.; validation, F.Ak., G.A.H., F.A. and B.M.; formal analysis, F.Ak.;
investigation, G.A.H., F.A., B.M. and J.R.A.; resources, G.A.H., F.A. and B.M.; data curation, F.Ak.; writing—original
draft preparation, F.Ak.; writing—review and editing, G.A.H., F.A., B.M. and J.R.A.; visualization, F.Ak., G.A.H.,
F.A., B.M. and J.R.A.; supervision, G.A.H., F.A., B.M. and J.R.A.; project administration, G.A.H., F.A., B.M. and
J.R.A. All authors have read and agreed to the published version of the manuscript.
Funding: This research is funded by the Australian Government Research Training Program Scholarship (RTPs)
awarded to the primary author.
Conflicts of Interest: We declare no conflict of interest between the authors.
Appendix A
Appendix A.1. Detention Basin Design for Conventional Drainage System (Figure 2a,b)
The critical storm duration was calculated as 60 min using urban stormwater runoff design
guidelines (Argue 1986). For a 60 min storm duration, the rainfall intensity was found to be 24.6 mm/h
from BOM 2018. Total area of the catchment was 67,100 m2 . The pre-development flow was calculated
for a 10% AEP storm event as follows:
Runoff coefficient, C10 pervious = 0.10; Conversion factor, FY = 1.0; C = C10 pervious × FY = 0.10 × 1.0
= 0.10
CIA
Qpre−development = (A1)
360
0.10 × 24.6 mm/h × 67100 m2
Qpre−development = = 0.045 m3 /s
360 × 104
The DRAINS model simulated a post-development flow:
For a conventional drainage system, QPost-development (10% AEP) = 0.541 m3 /s
For the hybrid drainage system, QPost-development (10% AEP) = 0.250 m3 /s
To limit discharge to pre-development flows, an orifice plate is required before the drainage outlet.
Discharge through a circular orifice plate,
π
Q = Cd A 2gH [where A = D2 ]
p
(A2)
4
Here, average coefficient of discharge (Cd ) = 0.61 and a maximum water depth, H = 1.2m as per
Council guidelines.
r q
4Q
So, the diameter of orifice, D = √ = 4×0.045
√ = 0.140 mm = 140 mm
πCd 2gH π×0.61 2×9.81×1.2
Required detention basin volume size:
For conventional drainage system, V = (QPost-development − QPre-development ) × (Time)
= (0.541 − 0.045) × 60 × 60 = 1785.60 m3
For hybrid drainage system, V = (QPost-development − QPre-development ) × (Time)
= (0.25 − 0.045) × 60 × 60 = 738 m3
The basin design is based upon a trapezoid shape and the geometric properties are shown
as follows:Water 2020, 12, 375 17 of 20
= (0.25 − 0.045) × 60 × 60 = 738 m3
WaterThe
2020,basin
12, 375design is based upon a trapezoid shape and the geometric properties are shown
16 ofas
19
follows:
Figure A1. Design of Trapezoidal detention basin
Figure A1. Design of Trapezoidal detention basin
Table A1. Design parameters of detention basin for two drainage systems.
Table A1. Design parameters of detention basin for two drainage systems.
Conventional Drainage System Hybrid Drainage System
Using geometric formulas,
Conventional Drainage the following basin
System UsingHybrid
geometric formulas,
Drainage the following basin
System
design parameters have been obtained: design parameters have been obtained:
Using geometric formulas, the following Using geometric formulas, the following
b = 3 m, for 1V:5H batters y = 1.2 m b = 3 m, for 1V:5H batters y = 1.2 m
basin design
and m = 6 m, parameters have been obtained: basin
and design
m = 6 m,parameters have been obtained:
Top Width B = b + 2my = 17.40 m,
b = 3 m, for 1V:5H batters y = 1.2 m Top Width Bfor
b = 3 m, = b1V:5H
+ 2my batters
= 17.40 m,
y = 1.2 m
Flow Area = y
and m = 6 m, × (b + bmy) = 12.24 m 2, Flow Area = y
and m = 6 m, × (b + bmy) = 12.24 m2 ,
Bottom Width LBb==b+2my
Top length, V/A = 145.88 m.m,
= 17.40 Bottom Bb==bV/A
length, L
Top Width = 60.29
+ 2my m. m,
= 17.40
Top length, Lt = Lb + 2my = 160.28 m Top length, Lt = L b + 2my = 74.69 m
Flow Area = y × (b+bmy) = 12.24 m , 2 Flow Area = y × (b + bmy) = 12.24 m ,
2
Bottom length, Lb = V/A = 145.88 m. Bottom length, Lb = V/A = 60.29 m.
References
Top length, Lt = Lb + 2my = 160.28 m Top length, Lt = Lb + 2my = 74.69 m
1. Fletcher, T.D.; Andrieu, H.; Hamel, P. Understanding, management and modeling of urban hydrology and
References
its consequences for receiving waters: A state of the art. Adv. Water Resour. 2013, 51, 261–279. [CrossRef]
1.2. Jacobson,
Fletcher, C.R.Andrieu,
T.D.; Identification and quantification
H.; Hamel, P. Understanding,of the hydrological
management andimpacts of imperviousness
modeling in urban
of urban hydrology and
catchments: A review. J. Environ. Manage. 2011, 92, 1438–1448. [CrossRef] [PubMed]
its consequences for receiving waters: A state of the art. Adv. Water Resour. 2013, 51, 261–279.
2.3. Linton, J.;C.R.
Jacobson, Budds, J. The hydro
Identification andsocial cycle: Defining
quantification of the and mobilizing
hydrological a relational-dialectical
impacts of imperviousness approach
in urbanto
water. Geoforum 2014, 57, 170–180. [CrossRef]
catchments: A review. J. Environ. Manage. 2011, 92, 1438–1448.
3.4. Miller, J.D.;
Linton, Kim, H.;
J.; Budds, Kjeldsen,
J. The hydroT.R.; Packman,
social J.; Grebby,and
cycle: Defining S.; Dearden, R. aAssessing
mobilizing the impact ofapproach
relational-dialectical urbanization
to
on storm
water. runoff2014,
Geoforum. 57, 170–180.catchment using historical change in impervious cover. J. Hydrol. 2014,
in a peri-urban
4. 515, 59–70.
Miller, J.D.; [CrossRef]
Kim, H.; Kjeldsen, T.R.; Packman, J.; Grebby, S.; Dearden, R. Assessing the impact of
5. Bajracharya, A.R.; Rai, R.R.; Rana, S. Effects of urbanization on storm water run-off: a case study of
urbanization on storm runoff in a peri-urban catchment using historical change in impervious cover. J.
Kathmandu Metropolitan City, Nepal. J. Inst. Eng. 2015, 11, 36–49. [CrossRef]
Hydrol. 2014, 515, 59–70.
6. Yazdanfar, Z.; Sharma, A. Urban drainage system planning and design–challenges with climate change and
5. Bajracharya, A.R.; Rai, R.R.; Rana, S. Effects of urbanization on storm water run-off: a case study of
urbanization: A review. Water Sci. Technol. 2015, 72, 165–179. [CrossRef] [PubMed]
Kathmandu Metropolitan City, Nepal. Journal of the Institute of Engineering 2015, 11, 36–49.
7. United Nations. World urbanization prospects: The 2017 revision; United Nations Department of Economic and
6. Yazdanfar, Z.; Sharma, A. Urban drainage system planning and design–challenges with climate change
Social Affairs: New York, NY, USA, 2018.
and urbanization: a review. Water Sci. Technol. 2015, 72, 165–179.
8. James, P. Measuring community sustainability: The social Life Questionnaire. In Urban. Sustainability in
7. United Nations. World urbanization prospects: the 2017 revision. United Nations Department of
theory and practice: Circles of sustainability, 1st ed.; Routledge: London, UK; New York, NY, USA, 2015.
Economic and Social Affairs, New York, USA; 2018.
9. Yigitcanlar, T. Smart cities: An effective urban development and management model? Aust. Plan. 2015,
8. James, P. Measuring community sustainability: The social Life Questionnaire. Urban. Sustainability in
52, 27–34. [CrossRef]
theory and practice: circles of sustainability, 1st ed.; Routledge: London and New York, 2015.
10. Dams, J.; Dujardin, J.; Reggers, R.; Bashir, I.; Canters, F.; Batelaan, O. Mapping impervious surface change
9. Yigitcanlar, T. Smart cities: an effective urban development and management model? Aust. Plan. 2015, 52,
from remote sensing for hydrological modeling. J. Hydrol. 2013, 485, 84–95. [CrossRef]
27–34.
11. Moglen, G.E.; Kim, S. Limiting imperviousness: Are threshold-based policies a good idea? J Am. Plan. Assoc.
10. Dams, J.; Dujardin, J.; Reggers, R.; Bashir, I.; Canters, F.; Batelaan, O. Mapping impervious surface change
2007, 73, 161–171. [CrossRef]
from remote sensing for hydrological modeling. J. Hydrol. 2013, 485, 84–95.
12. Guan, M.; Sillanpää, N.; Koivusalo, H. Storm runoff response to rainfall pattern, magnitude and urbanization
11. Moglen, G.E.; Kim, S. Limiting imperviousness: are threshold-based policies a good idea? J Am. Plan.
in a developing urban catchment. Hydrol. Processes 2016, 30, 543–557. [CrossRef]
Assoc. 2007, 73, 161–171.
13. McGrane, S.J. Impacts of urbanization on hydrological and water quality dynamics, and urban water
12. Guan, M.; Sillanpää, N.; Koivusalo, H. Storm runoff response to rainfall pattern, magnitude and
management: A review. Hydrol. Sci. J. 2016, 61, 2295–2311. [CrossRef]
urbanization in a developing urban catchment. Hydrol. Processes 2016, 30, 543–557.
14. Patil, A. Urban hydrology, need of India. Environ. We Int. J. Sci. Tech. 2015, 10, 29–36.
15. Jia, H.; Yao, H.; Shaw, L.Y. Advances in LID BMPs research and practice for urban runoff control in China.
Front. Env. Sci. Eng. 2013, 7, 709–720. [CrossRef]You can also read