CYANOTOXIN AND CYANOBACTERIA MONITORING IN LAKE ELSINORE AND CANYON LAKE 2015-2017
←
→
Page content transcription
If your browser does not render page correctly, please read the page content below
Final Report   June 2018

CYANOTOXIN AND CYANOBACTERIA
MONITORING IN LAKE ELSINORE AND
CANYON LAKE
2015-2017

Prepared by:

Dr. Meredith Howard, Biological Oceanographer,
Southern California Coastal Water Research Project

SWAMP-MR-RB8-2018-0004
Cyanotoxin and Cyanobacteria Monitoring in Lake Elsinore and
                      Canyon Lake
                               2015-2017

                            Meredith Howard

 1
     Southern California Coastal Water Research Project, Costa Mesa, CA

                                 May 2018

                                     2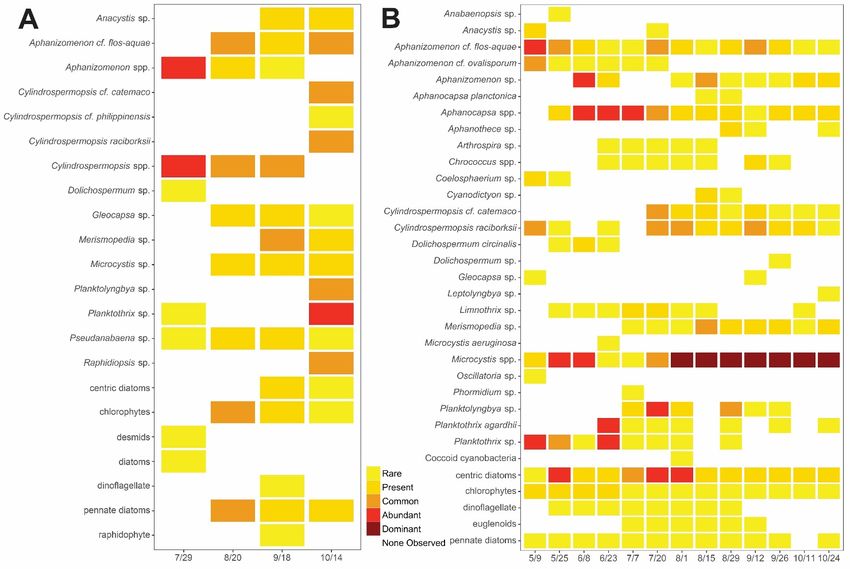
ACKNOWLEDGEMENTS
The author thanks the boat operations crews of the City of Lake Elsinore and Canyon Lake for providing
boat time for sample collection. The author thanks the following individuals for assistance: Avery Tatters
and David Caron (taxonomic identifications), Raphael Kudela and Kendra Hayashi (cyanotoxin analysis),
Miranda Roethler (figures, maps and sample collection), Carly Beck and Justin VanderWaal (sample
collection), John Rudolph and Chris Stransky (AMEC Foster Wheeler) and Heather Boyd for project
management. Funding was provided by the State of California Surface Water Ambient Monitoring
Program (SWAMP) through the Santa Ana Regional Water Quality Control Board.

                                                    3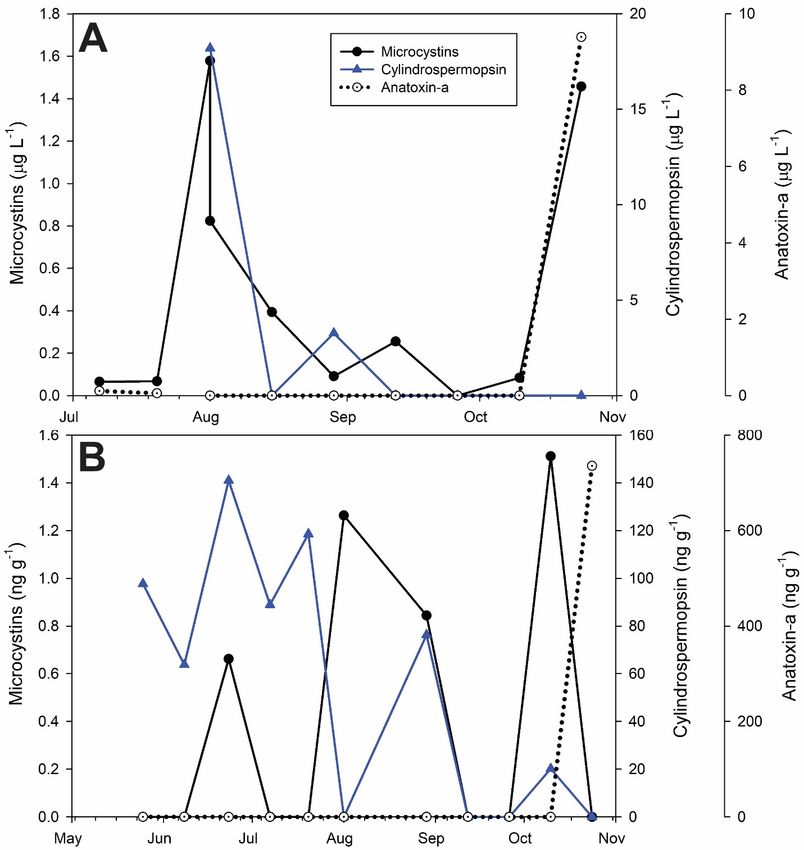
EXECUTIVE SUMMARY
Harmful cyanobacteria blooms (cyanoHABs) have gained national attention in recent years due to the
global increase in frequency, severity and spatial extent of blooms. CyanoHABs cause many water
quality issues and can cause illness and mortality in humans, domestic pets, wildlife and livestock. As
such, there is a growing recognition that water quality programs should include these biological
contaminants, and cyanotoxins should be considered in ecological and human health risk assessments
(Chapman, 2015, Brooks et al., 2016). Health advisory thresholds have been developed by EPA for
drinking water and draft recreational water quality criteria have been proposed. California established
health-based trigger thresholds to protect human and canine health in recreational waterbodies for
three cyanotoxins, microcystins, cylindrospermopsin and anatoxin-a. There are 3 human health trigger
thresholds established for recreational waters, including the Caution Trigger, the Warning Tier I trigger
and the Danger Tier II trigger.

The goals of the current study were to provide an assessment of cyanobacteria and cyanotoxins present
in Lake Elsinore and Canyon Lake. The specific objectives were to (1) determine if cyanotoxins are
routinely present and if so, determine if concentrations exceed human and canine health trigger
thresholds, (2) determine the potential toxin-producing cyanobacteria taxa routinely present, (3)
determine if cyanotoxin monitoring is warranted on a routine and frequent basis to protect the health of
humans, wildlife, domestic pets and the beneficial uses of the lakes

The results from Lake Elsinore indicate the following findings:

 •   Cyanotoxins were chronically detected at relatively high concentrations that frequently exceeded
     California human and canine health trigger thresholds for recreational waterbodies
      o These are currently the highest recorded concentrations from Southern California lakes
 •   Multiple cyanotoxins were frequently detected simultaneously; the health risks and
     consequences are unknown for co-occurring toxin exposure because health trigger thresholds are
     based on exposure to a single cyanotoxin
 •   Cyanobacteria taxonomic identifications indicated a high risk for multiple cyanotoxins to be
     routinely produced and co-occur in Lake Elsinore
 •   DNA barcoding was a useful tool to identify cyanobacteria and determine relative abundance

The results from Canyon Lake indicate the following findings:

 •   Microcystins were chronically detected at lower concentrations that occasionally exceeded
     California human health trigger thresholds
      o There is a high risk of health consequences from chronic exposure to microcystins
 •   Cylindrospermopsin and anatoxin-a were detected half of the time and only occasionally
     exceeded CA health trigger thresholds
 •   Cyanobacteria taxonomic identifications indicated a high risk for multiple cyanotoxins to be
     routinely produced and co-occur in Canyon Lake

Based on the results of this assessment program, the following is recommended: Cyanotoxins should be
frequently and routinely monitored in both Lake Elsinore and Canyon Lake. The dominance of

                                                     4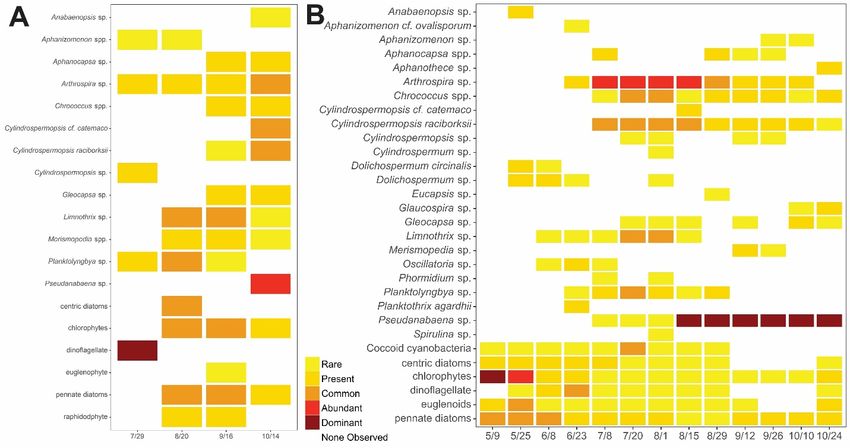
cyanobacteria, the ubiquitous and persistent detection of cyanotoxins, and the exceedance of CA human
and canine health trigger thresholds in these highly frequented recreational lakes, indicate routine and
frequent monitoring of cyanotoxins should be implemented to protect public health as well as wildlife
and domestic pets.

Figure ES1. The cyanotoxin results from (A) Lake Elsinore and (B) Canyon Lake from 2015 – 2017.

The percentage of toxin samples that exceeded each health threshold are shown in the bar plots. The
percent of samples that were positive but below human health trigger thresholds (blue), above human
health trigger thresholds, yellow, orange and red, corresponding to Caution, Warning and Danger
thresholds, respectively).

                                                   5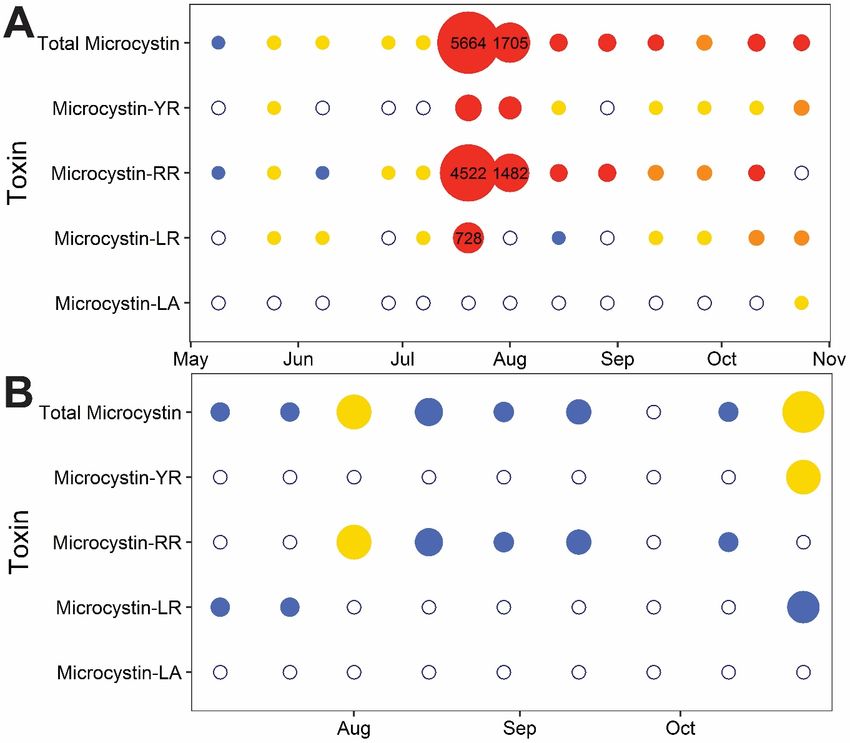
Table of Contents
Acknowledgements....................................................................................................................................... 3
Executive Summary....................................................................................................................................... 4
Table of Figures ............................................................................................................................................. 7
Table of Tables .............................................................................................................................................. 8
Introduction .................................................................................................................................................. 9
Materials and Methods............................................................................................................................... 11
Results ......................................................................................................................................................... 14
Discussion and Recommendations ............................................................................................................. 26
References .................................................................................................................................................. 30
Appendices.................................................................................................................................................. 37

                                                                                 6
TABLE OF FIGURES
Figure ES1. The cyanotoxin results from (A) Lake Elsinore and (B) Canyon Lake from 2015 – 2017. .......... 5
Figure 1. Map of study area and sampling locations at Lake Elsinore (A) and Canyon Lake (B). ............... 12
Figure 2 Cyanotoxin concentrations detected in water samples (A) and SPATT samples (B) collected from
Lake Elsinore in 2016. ................................................................................................................................. 17
Figure 3 Relative abundance of cyanobacteria, diatoms and dinoflagellates from Lake Elsinore collected
in (A) 2015 and (B) 2016. ............................................................................................................................ 19
Figure 4 Surface water cyanobacterial genera relative abundance as measured by DNA barcoding. ....... 20
Figure 5: Chlorophyll concentrations collected in 2016 at (A) Lake Elsinore and (B) Canyon Lake............ 22
Figure 6 Cyanotoxin concentrations detected in water samples (A) and SPATT samples (B) collected from
Canyon Lake in 2016. .................................................................................................................................. 24
Figure 7 Relative abundance of cyanobacteria, diatoms and dinoflagellates from Canyon Lake collected
in (A) 2015 and (B) 2016. ............................................................................................................................ 25
Figure 8. The cyanotoxin results from(A) Lake Elsinore and (B) Canyon Lake from 2015 – 2017. ............. 29
Figure 9. The number of cyanotoxins detected simultaneously from Lake Elsinore (top panel) and Canyon
Lake (bottom panel) from 2015 – 2017. ..................................................................................................... 29

                                                                            7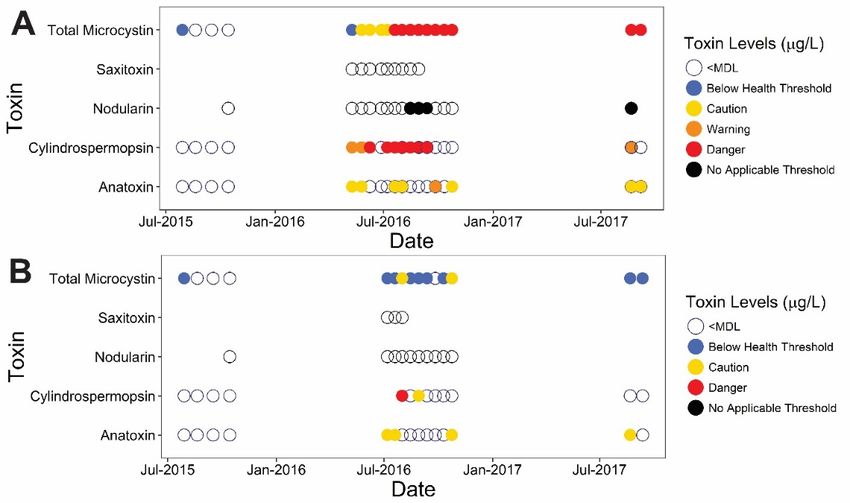
TABLE OF TABLES

Table 1. Cyanobacteria harmful algal bloom triggers for recreational waters (all concentrations are listed
in μg L-1). ...................................................................................................................................................... 10
Table 2 Cyanotoxin results from all SPATT samples collected from Lake Elsinore (LE) and Canyon Lake
(CL) in 2015. ................................................................................................................................................ 15
Table 3 Table showing all scum and foam sample results for cyanotoxins collected from Lake Elsinore in
2016 and 2017. ........................................................................................................................................... 16
Table 4. Results of statistical analyses of genetic barcoding results. ......................................................... 21

                                                                                 8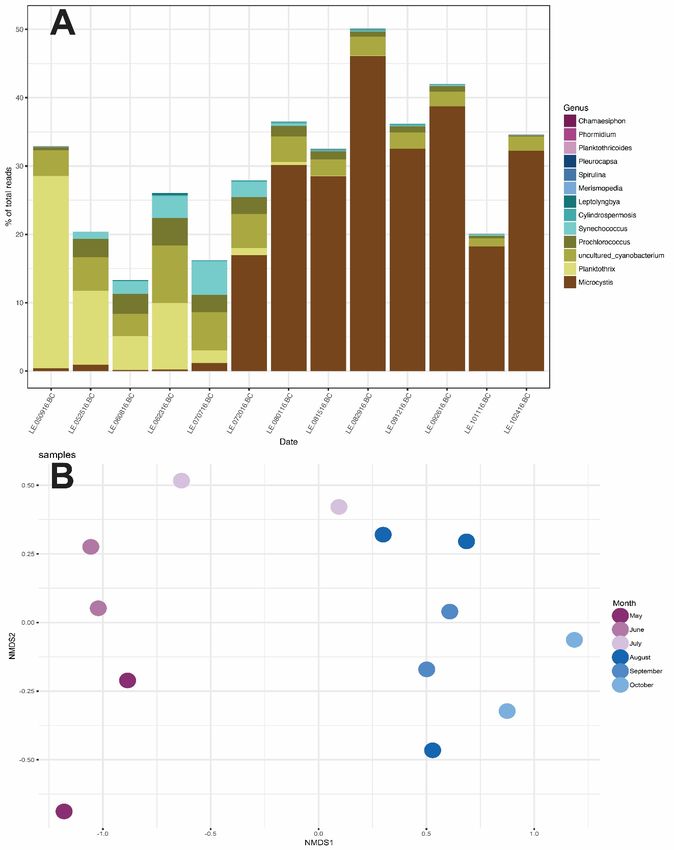
INTRODUCTION
Cyanobacteria are photosynthetic prokaryotes that have existed naturally for billions of years (Summons
et al. 1999, Schopf 2000), inhabiting a wide variety of aquatic environments, including freshwater,
brackish and marine ecosystems and can form dense blooms (Paerl 1988, Paerl and Fulton 2006,
Whitton 2012). Many cyanobacteria are capable of producing toxins, referred to as cyanotoxins, which
have gained national attention in recent years due to the global increase in frequency and duration of
toxic blooms (Carmichael 2008, Hudnell and Dortch 2008, Paerl and Huisman 2009, O’Neil et al. 2012,
Paerl and Paul 2012, Paerl and Otten 2013, Quiblier et al. 2013, Hudon et al. 2014, Wood et al. 2014).
These increases have been attributed to a wide variety of environmental factors such as nutrient
overenrichment and eutrophication, increased temperature, salinity, water residence time, vertical
stratification and pH, many of which will likely be exacerbated with climate change (Paerl 1988, Paerl
and Fulton 2006, Carmichael 2008, Paerl and Huisman 2009, Paerl et al. 2011, O'Neil et al. 2012, Paerl
and Paul 2012, Paerl and Otten 2013).

Cyanotoxins represent a significant risk for humans, livestock, pets, and wildlife, causing illness and
mortality (Edwards et al. 1992, van Halderen et al. 1995, Mez et al. 1997, Pouria et al. 1998, Carmichael
et al. 2001, Backer et al. 2008, Stewart et al. 2008, Wood et al. 2010, Li et al. 2011, Backer et al. 2013,
Trevino-Garrison et al. 2015). The acute poisoning symptoms in humans and animals include nausea,
vomiting, diarrhea, cough, sore throat, rash and liver damage (Li et al. 2011, Backer et al. 2013, Weirich
et al. 2014, Trevino-Garrison et al. 2015). Illness and mortality related to cyanotoxin poisoning in pets
and livestock is likely significantly under-reported (Wood et al. 2010, Backer et al. 2013, Trevino-
Garrison et al. 2015). The routes of human exposure to cyanotoxins include ingestion, inhalation and
dermal contact. Ingestion pathways include consumption of contaminated shellfish or drinking water, as
well as consumption of vegetables that are irrigated with contaminated water (Mohamed et al. 2009).
Inhalation of aerosolized cyanotoxins can be a significant exposure route during recreational activities in
bloom-ridden lakes (Backer et al. 2008, 2009, Levesque et al. 2014). Finally, many studies have
documented the accumulation of cyanotoxins in aquatic and terrestrial organisms including freshwater
and saltwater mussels, farmed crustaceans, corals, fish, zooplankton, crabs, oysters, clams, snails, and
ducks (Williams et al. 1997, Amorim and Vasconcelos 1999, Matsunaga et al. 1999, Vasconcelos et al.
2001, Malbrouk and Kestemont 2006, Zimba et al. 2006, Richardson et al. 2007, Lehman et al. 2010,
Miller et al. 2010). The accumulation and biomagnification of cyanotoxins into food webs is the main
mechanism that causes illness and mortality in both terrestrial and aquatic wildlife, and represents a
poorly understood exposure pathway in humans (see reviews by Stewart et al. 2008, Havens 2008).

Cyanotoxins produced in these freshwater systems have been shown to have effects far downstream of
their biological origin, in marine ecosystems. A recent mass mortality of over 30 marine sea otters in
Monterey Bay was due to microcystin intoxication from ingestion of contaminated shellfish (Miller et al.
2010). Microcystin was produced in Pinto Lake, a eutrophic water body that experiences frequent
cyanobacterial blooms and drains to Monterey Bay via a 15-km segment of the Pájaro River (Miller et al.
2010, Kudela 2011). Watershed studies of Monterey Bay have shown that this downstream transport of
microcystins is a persistent and prevalent issue throughout the watershed (Gibble and Kudela 2014).
These studies underscore an important role of rivers as conduits that can transport intact toxins from
inland waters to downstream marine environments.

                                                     9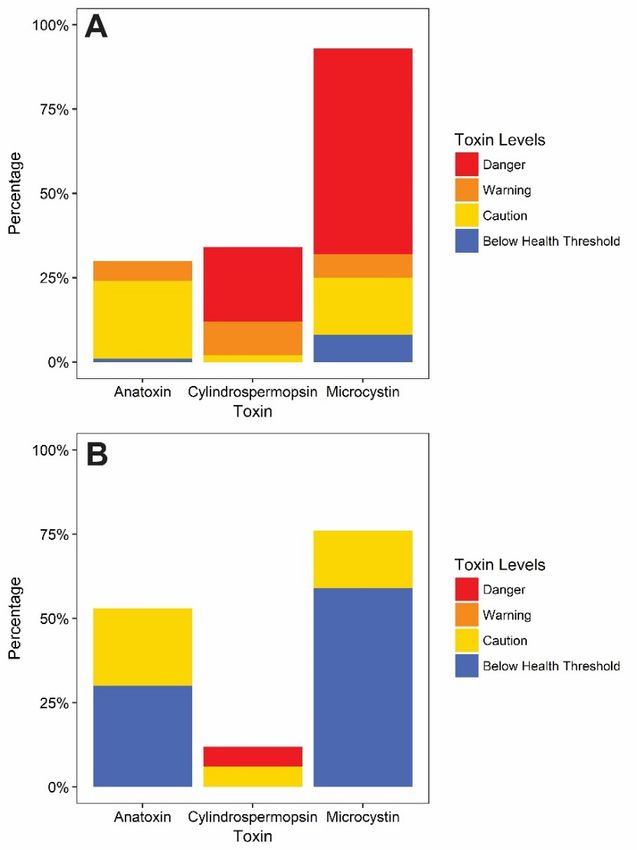
At both the federal level and within California, there is a growing recognition of the health and beneficial
use risk of cyanotoxins. Due to this growing recognition that HABs can severely impact water quality and
should be routinely monitored (Chapman 2015, Brooks et al. 2016), the U.S. Environmental Protection
Agency has recently released health advisory thresholds for cyanotoxins in drinking water, has listed
three cyanotoxins on the Contaminant Candidate List 3 (CCL3) (U.S. Environmental Protection Agency
2010) and has drafted proposed human health recreational ambient water quality criteria and/or
swimming advisories for 2 cyanotoxins (https://www.epa.gov/wqc/draft-human-health-recreational-
ambient-water-quality-criteria-andor-swimming-advisories). USGS has recently prioritized 12
cyanotoxins as Tier 1, or highest priority for inclusion in ambient water monitoring in the US (an
additional 3 were listed at intermediate or low priority) (Olsen et al. 2013). California established health-
based exposure thresholds to protect human and canine health in recreational waterbodies for three
cyanotoxins, microcystins, cylindrospermopsin and anatoxin-a (OEHHA, 2012). There are separate
thresholds for water, fish, and cyanobacterial mat matrices. In 2016, there was an amendment to the
OEHHA voluntary guidance that established 3 human health trigger thresholds for recreational waters.
These thresholds are the following:

Table 1. Cyanobacteria harmful algal bloom triggers for recreational waters (all concentrations are
listed in μg L-1).
                             Caution Trigger Level     Warning Tier I*             Danger Tier II*
 Microcystins                         0.8                      6                         20
 Anatoxin-a                        Detection                  20                         90
 Cylindrospermopsin                    1                       4                         17
http://www.mywaterquality.ca.gov/monitoring_council/cyanohab_network/docs/triggers.pdf\.
*The CA Danger Tier II trigger thresholds recommends “people, pets and livestock should stay out of the
water and away from water spray” and the Warning trigger threshold states “ swimming is not
recommended and that pets and livestock should be kept away from the water”
(http://www.mywaterquality.ca.gov/monitoring_council/cyanohab_network/docs/appendix_a.pdf).

These recreational health advisory thresholds were created in response to recurring hotspots of toxic
blooms in the Klamath River watershed, Clear Lake, Pinto Lake, Sacramento and San Joaquin River Delta,
Lake Elsinore, and East San Francisco Bay Area lakes. Additionally, Copco and Iron Gate Reservoirs, the
Klamath River, and Pinto Lake were placed on the State’s 303d list due to impairment caused by
microcystins, the first such listing in the State.

Preliminary samples collected in response to visible cyanobacterial blooms in May 2014 detected
multiple cyanotoxins in Lakes Elsinore, Menifee and Canyon. Lake Elsinore samples exceeded CA
recreational health trigger thresholds for humans for microcystin and cylindrospermopsin (Table 1). The
concentrations detected were 1.2 µg/L and 4.1 µg/L respectively. Cylindrospermopsis spp. dominated
the community composition and Anabaena spp. was also observed (both potential toxin producers).
Canyon Lake had 3 cyanotoxins present, microcystins, 0.3 µg/L, cylindrospermopsin, 2.7 µg/L and
anatoxin-a, 4.6 µg/L simultaneously, and 2 were above health trigger thresholds for recreational waters
(Table 1). The goals of the current study were to expand on these results and provide a more
comprehensive assessment of cyanobacteria and cyanotoxins present in the lakes. The specific
objectives were to:

                                                     10
• Determine if cyanotoxins are routinely present and if so, determine if concentrations exceed
human health trigger thresholds
• Determine the potential toxin producing cyanobacteria taxa routinely present
• Determine if cyanotoxin monitoring is warranted on a routine basis to protect human and
wildlife health and the beneficial uses of the lakes
MATERIALS AND METHODS
Discrete Sample Collection
Discrete surface water samples were collected based on where the highest biomass had accumulated in
the lake. This was determined by conducting boat surveys on the City of Lake Elsinore operations boat. A
YSI sonde was deployed at the side of the boat to determine the location of highest chlorophyll-a in the
highest recreational area of the lake (northwest side of the lake). Scum and foam samples were
collected when present, usually at the northwest shoreline shown in Figure 1 (La Laguna Recreational
Beach). Samples were collected monthly in 2015 from July through October, bi-monthly or every 2
weeks in 2016, and there were two collection dates in 2017 (21 August 2017 and 06 September 2017).
For Canyon Lake, a similar approach was employed that focused on the east arm of the lake based on
historical chlorophyll-a data illustrating high biomass in that arm of the lake.
Discrete surface water samples were collected in a 1-L glass bottle and then individual samples were
collected for cyanotoxin, chlorophyll-a and DNA barcoding analysis. Whole water cyanotoxin samples
were collected in 250-mls glass jars in 2016 and 2017 and frozen immediately in the field, and stored at -
20oC. The 2015 samples were collected in 100-mls HPDE plastic bottles, not glass, and stored as
described above.
Chlorophyll-a (chl-a) samples were collected in 2016 and 2017 at Lake Elsinore and in 2016 at Canyon
Lake. Chl-a samples were filtered onto 25mm Whatman GF/F filters (GE Whatman, Marlborough, MA,
USA), frozen immediately, stored at -80oC and analyzed within 2 weeks of collection.
DNA barcoding samples were collected from Lake Elsinore in 2016 for 16S rRNA gene sequencing and
community analysis as part of a pilot study to compare with microscopy samples. These samples were
filtered onto a 0.2 um Whatman Nucleopore polycarbonate filter (GE Healthcare Life Sciences,
Buckinghamshire, UK) and submerged in bead solution storage buffer (Mo Bio Laboratories, Inc.,
Carlsbad, CA) before being stored at -80°C. Before extraction, filters were thawed at 4°C. DNA
extractions were performed with the PowerLyzer PowerSoil DNA isolation kit (Mo Bio Laboratories, Inc.,
Carlsbad, CA) according to the manufacturer’s instructions. DNA yield was assessed with the Nanodrop
8000 (Thermo Scientific, Wilmington, DE, USA).
Discrete samples for cyanobacterial identification and relative abundance via microscopy were collected
simultaneously with the other discrete samples in a 1.5-L HPDE bottle, placed inside a cooler, stored in
an incubator overnight at the Southern California Coastal Water Research Project and analyzed live the
following day.
Passive sampling devices, Solid Phase Adsorption Toxin Tracking, SPATT (MacKenzie et al., 2004, Lane et
al., 2010, Kudela, 2011), were deployed continuously between site visits and provided time-integrated
dissolved toxin samples of cyanotoxin presence. SPATT were deployed in 1 location of each lake in 2015
11and 2016 (but none deployed in 2017), determined by the accessibility in high recreational use areas
and ease of deployment, under a floating dock (see Figure 1 for locations).
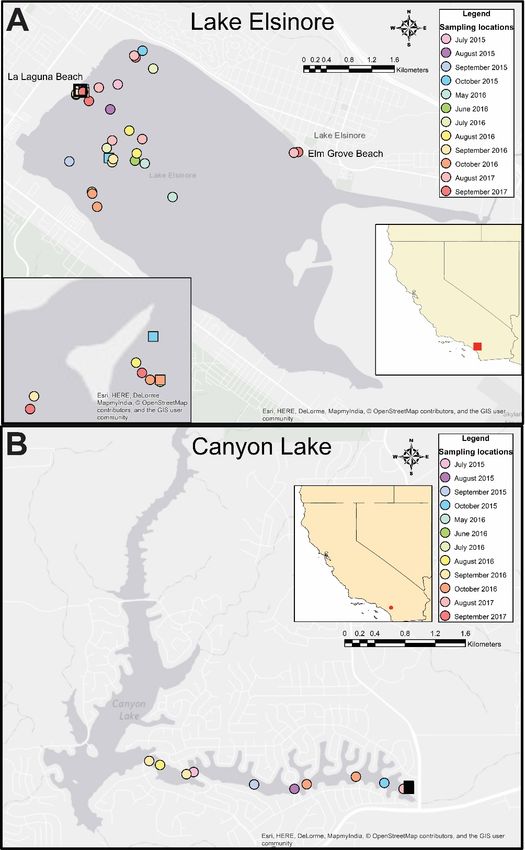
Figure 1. Map of study area and sampling locations at Lake Elsinore (A) and Canyon Lake (B).
SPATT sampling locations are shown by the black and colored squares and discrete sample locations are
shown by the circles. Colors indicate collection timepoints.
12Cyanotoxin Analysis
Discrete cyanotoxin samples were analyzed at the University of California, Santa Cruz and were
extracted and processed according to methods described in Mekebri et al. 2009 and Kudela 2011, for
four microcystin congeners (MCY-LA, MCY-LR, MCY-RR, MCY-YR) and nodularin with the modifications
described in (Miller et al. 2010, Kudela et al 2011). The 2017 sample analysis also included an additional
congener, MCY-LF. Anatoxin-a and cylindrospermopsin were analyzed according to EPA 545
(https://19january2017snapshot.epa.gov/sites/production/files/2015-11/documents/epa_815-r-15-
009_method_545.pdf). Briefly, samples were stored frozen until extraction and processing, and
analyzed by liquid chromatography/mass spectrometry (LC-MS) with electrospray ionization (ESI) with
selected ion monitoring (SIM) on an Agilent 6130 instrument equipped with a Phenomenex Kinetix C18
column (microcystins and nodularin) or Agilent Polaris-Ether C18 column (anatoxin-a and
cylindrospermopsin). Blanks were analyzed for every 10 samples, and standard curves were run at the
beginning and end of each set of samples. Matrix Spike recoveries were completed with each sample
run. Cyanotoxin samples were processed by mixing with 100% MeOH (1:1; final concentration 50%) and
processed by sonication.
Anatoxin-a samples were prepared by sonicating whole water and syringe-filtering (using a 0.2
µm Teflon filter) with direct-injection of 20 µL sample. The analytical method followed Cogent
KnowledgeBase article AA-00807 using anatoxin-a dissolved in 7:93 MeOH:H20 with 0.1% formic acid
(National Research Center Canada) as the reference. Cogent, AA-00807. Accessed at http://kb.mtc-
usa.com/article/AA-00807/0/Anatoxin-a-ANTX-A.html.
Saxitoxin samples were analyzed using the BIOO Scientific MaxSignalTM Saxitoxin (PSP) ELISA
test kit (BIOO Scientific Corp., Austin, TX, Cat. No. 1034). The manufacturer’s instructions were followed
for sample extraction and analysis.
Shoreline samples were collected from 2 locations at Lake Elsinore, Elm Grove Beach and La
Laguna Beach, on 21 August 2017 and 06 September 2017 (Figure 1). Those samples were collected as
described above in the Discrete Sample Collection section, but cyanotoxin analysis was conducted at
Bend Genetics, LLC (Sacramento, CA) using Abraxis ADDA ELISA Kit PN520011 for microcystins, Abraxis
ELISA kit, PN520060 for anatoxin-a, and Abraxis ELISA kit, PN622011 for cylindrospermopsin.
SPATT samples were analyzed at the University of California, Santa Cruz for four microcystin
congeners (MCY-LA, MCY-LR, MCY-RR, MCY-YR) and nodularin by liquid chromatography/mass
spectrometry (LC-MS) with electrospray ionization (ESI) with selected ion monitoring (SIM) on an Agilent
6130 with a Phenomenex Kinetix (100x2.10) C18 column. The method was adapted from Mekebri et al.,
2009 with minor modifications to account for the choice of column and LCMS/SIM instead of tandem mass
spectrometry (Kudela, 2011). Anatoxin-a and cylindrospermopsin were analyzed using the same LCMS.
The samples were prepared as described in Kudela, 2011. Analysis included replicates and matrix-
additions, with the quantification based on external standards. The Method Detection Limit was 0.05 ng
g-1 for all congeners. Percent recovery is reported in Kudela, 2011, and was ~58-100% for the congeners
using a standardized recovery method, with MCY-RR being lowest followed by MCY-LR (~88%), MCY-YR
(~100%), and MCY-LA (~100%).
13Cyanobacteria Identification by Microscopy and Genetic Barcoding
Relative Abundance by Microscopy: Potential toxin-producing cyanobacteria were identified to the
genus level (species when possible). Briefly, samples were homogenized by successive inversions and an
aliquot was poured into 20mL tissue culture dishes, settled overnight and viewed under an Olympus
CKX41 inverted microscope, at the University of Southern California. Each cyanobacteria genus
identified was assigned a relative abundance code based on the percentage of the community
composition of the sample. Relative abundance codes are as follows: dominant (D) (>50% of the
community composition), Abundant (A) (25-49% of the community composition), Common (C) (10-24%
of the community composition), Present (P) (1-9% of the community composition), and Rare (R) (1 mismatch to the barcode sequence. Sequences were further processed using the Illumina MiSeq
Recorder software to remove adapter, barcode, and primer sequences. DNA sequences were further
processed using QIIME v1.9.1 (Caporaso et al., 2010), forward and reverse DNA reads were merged into
contigs, singleton reads were removed, chimeric sequences were removed, reads were discarded with
ambiguous ‘N’ base calls, and files were converted into fasta format. De novo, furthest-neighbor
operational taxonomic units (OTU) were assembled and representative sequences chosen from
UCLUST’s OTU clustering algorithm as implemented in QIIME with a maximum sequence identity
difference of 3% (corresponding to OTU identity threshold of 97%) (Edgar, 2010). The most abundance
sequence in each OUT cluster was chosen as a representative sequence. The taxonomic assignment of
the representative OUT sequences was determined using UCLUST in QIIME against the SILVA v128
taxonomy database (Yilmaz et al., 2013). All samples were rarified down to the lowest total reads of the
sample set (45,000). To better understand community structure, we performed Analysis of Similarity
(ANOSIM) analyses as implemented in the R package vegan (Oksanen et al., 2013) using Bray-Curtis
distances. We performed non-metric multidimensional scaling (NMDS) analysis and alpha diversity
analyses using the R package phyloseq (McMurdie et al., 2013).
Chlorophyll-a Analysis
Chlorophyll-a (chl-a) samples were collected in 2016 and 2017 and analyzed within 2 weeks of collection
following EPA 445.0. Samples were extracted in 90% acetone for 24 hours at -20oC in the dark and
analyzed using a Turner Trilology fluorometer (Turner Designs, Sunnyvale, CA USA) at the Southern
California Coastal Water Research Project.
RESULTS
Lake Elsinore Cyanotoxins
Overall summary, 2015-2017: Over all three years, 68% of water samples and 71% of SPATT samples
indicated there were 2 or more cyanotoxins detected, and 37% and 7% of water and SPATT samples
14indicated 3 or more cyanotoxins detected (Figure ES3). For all years, microcystin was detected in 92.7% of water samples, which ranged from not detected to 5,665 μg L-1 and ranged from 36.5 – 45,300 μg L-1 in foam and scum samples (Figure 2, Table 3). Of the positive water samples, 17% were at the caution health threshold (0.8 - 5.9 μg L-1), 7% were at the warning health threshold (6 – 19.9 μg L-1) and 61% were at the danger health threshold (≥20 μg L-1). The SPATT sample results collected throughout 2015 and 2016 were all positive for microcystins (100% of samples detected microcystins) and ranged from 1.35 ng g-1 to 845 ng g-1 (Table 2). Anatoxin-a and cylindrospermopsin were detected in 29.3% and 34.1% of samples respectively, and 21.4% and 57.1% of SPATT samples respectively (Figure 2, Table 2). Anatoxin-a ranged from below detection to 0.5 μg L-1 in water samples and ranged from 11.7 – 37 μg L-1 in foam and scum samples. Of these samples, 23% were at the caution health threshold (detection - 19.9 μg L-1) and 6% were at the warning threshold (20 - 89.9 μg L-1). The SPATT results for anatoxin-a ranged from below detection to 299 ng g-1. Cylindrospermopsin water sample results ranged from not detected to 21.2 μg L-1 and 37 – 273 μg L-1 from foam and scum samples (Figure 2, Table 3). Of these samples, 2.4% were at the caution health threshold (1 – 3.9 μg L-1), 10% were at the warning health threshold (4 – 16.9 μg L-1), and 22% were at the danger threshold (≥17 μg L-1). The SPATT sample results ranged from not detected to 4,465 ng g-1 (Figure 2, Table 2). 2015 Results: Water samples collected in 2015 indicated cyanotoxin concentrations were extremely low or not detected in Lake Elsinore. Microcystins were detected on July 29, 2015 (0.01 μg L-1) but were not detected for the other 3 monthly sampling dates in August, September and October. However, the SPATT samplers indicated low concentrations of microcystin and ranged from 1.3 ng g-1 – 40.5 ng g-1 (Table 2, Figure 2). SPATT samplers were deployed, but not recovered from Lake Elsinore in July and August 2015. Anatoxin-a and cylindrospermopsin were not detected in any of the 4 water samples collected in 2015. There was one sample collected on September 16, 2015, that contained 1.5 μg L-1 of saxitoxin. Nodularin was analyzed on one water sample collected on 14 October 2015 and was below the method detection limit. Table 2 Cyanotoxin results from all SPATT samples collected from Lake Elsinore (LE) and Canyon Lake (CL) in 2015. Location Date MCY ANA CYL LE 18 September 40.52
health thresholds), 4% exceeded the warning health threshold and 65% exceeded the danger health
threshold. The most common microcystin congener detected from water, scum and foam samples was
MCY-RR (91% of samples), followed by MCY-LR (78%), MCY-YR (65%) and MCY-YR was only detected in 1
sample from 24 October 2016 (see Appendix A). SPATT sample results were similar, as MCY-RR was the
most common congener detected (91%), followed by MCY-LR (82%), MCY-YR (54%), and MCY-LA was
only detected from the same date as the water samples listed above. Anatoxin-a was detected in 26% of
the water, foam and scum samples collected in 2016 and ranged from below detection to 37 μg L-1
(Figure 2, Table 3). The caution threshold was exceeded in 22% of the samples, 4% exceeded warning
threshold, and none exceeded the danger threshold. Only 2 SPATT samples detected anatoxin-a, on 06
August 2016 and 24 October 2016, and concentrations in 2016 ranged from not detected to 299 ng g-1.
Cylindrospermopsin was detected in 52% of water, grab and scum samples and concentrations ranged
from below detection to 273 μg L-1. Of these, 4% were at the caution health threshold, 9% were at the
warning threshold, and 39% were at the danger threshold. The SPATT samplers detected
cylindrospermopsin in 73% of samples from 2016 and concentrations ranged from below detection to
4,465 ng g-1. Nodularin was detected in 22% of water, scum and foam samples and ranged from below
detection to 18 μg L-1 and was not detected in any of the SPATT sample results. Saxitoxin was analyzed
from water samples collected in May through August 2016, but no saxitoxin was detected in any of
these samples.
Table 3 Table showing all scum and foam sample results for cyanotoxins collected from Lake
Elsinore in 2016 and 2017.
 Sample Collection Date Type of sample MCY                ANA        CYL        NOD
 20 July 2016             Scum                 45,300     18.5       45
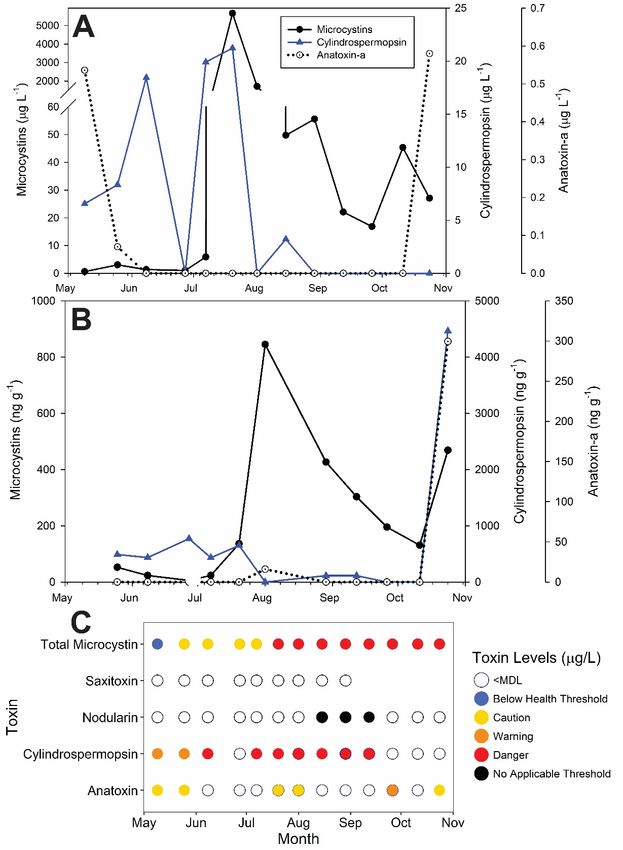
Figure 2 Cyanotoxin concentrations detected in water samples (A) and SPATT samples (B)
collected from Lake Elsinore in 2016.
Microcystins are shown by the solid black line and circles, cylindrospermopsin is shown by the blue line
and triangles and anatoxin-a results are shown by the black dotted line and white circles. The toxins that
exceeded California Recreational Health Thresholds are shown in color according to threshold (C).

                                                   17
2017 Results: The 2017 results indicated multiple, co-occurring cyanotoxins detected simultaneously,
similar to 2016. All samples collected exceeded the health thresholds for microcystins, and
concentrations ranged from 1.3 – 355 μg L-1 from water, foam and scum samples (Table 3 foam and
scum sample concentrations). The shoreline samples collected from Elm Grove Beach and La Laguna
Beach ranged from 33 – 129 μg L-1 on 21 August 2017 and 43 – 311 μg L-1 on 06 September 2017. The
water samples collected via boat ranged from 1.3 – 149 μg L-1 on 21 August 2017 and 7 – 355 μg L-1 on 06
September 2017. The congeners, MCY-LR and MCY-RR, were detected in all 6 samples collected on 21
August 2017 and in all 3 samples collected on 06 September 2017 and ranged from 0.1 – 20 μg L-1 and 1
– 121 μg L-1 respectively. MCY-YR was detected in 4 samples collected on 21 August 2017 and from 1
sample collected on 06 Sept 2017 and ranged from 2 – 76 μg L-1 and 5 – 231 μg L-1 respectively. The
MCY-LA and MCY-LF congeners were included in the analysis, however, neither of these congeners were
detected in any of the 2017 samples. Nodularin was detected in one foam sample collected on 21
August 2017 (0.08 μg L-1). Anatoxin-a exceeded the caution health advisory on both sample collection
dates in 2017. Shoreline samples ranged from 0.2-0.6 μg L-1 and from below detection to 0.3 μg L-1 from
samples collected on 21 August 2017 and 06 September 2017, respectively. Anatoxin-a was not
detected from any of the boat samples collected on 21 August 2017 and ranged from below detection to
0.3 μg L-1 from samples collected on 06 September 2017. Cylindrospermopsin was not detected in any of
the shoreline samples collected in 2017. The discrete samples collected from the boat ranged from
below detection to 11 μg L-1 collected on 21 August 2017, which exceeded the Warning Tier I health
advisory and all samples collected on 06 September 2017 were below detection.
Lake Elsinore Cyanobacterial Community Composition and Chlorophyll-a
Lake Elsinore surface water cyanobacteria abundance from 2015 relative abundance results indicated
the most abundant (25-50% of community composition) cyanobacteria genera were Aphanizomenon,
Cylindrospermopsis, and Planktothrix (Figure 3A). The commonly observed (10-25% of community
composition) genera included (in addition to those listed above) Merismopedia, Planktolyngbya and
Raphidiopsis. The 2016 results exhibited a distinct shift in dominant species between early and late July
as shown by both the microscopy relative abundance results (Figure 3B) and by the DNA barcoding (16S
rRNA gene sequencing and community analysis) results (Figure 4A).
18Figure 3 Relative abundance of cyanobacteria, diatoms and dinoflagellates from Lake Elsinore collected in (A) 2015 and (B) 2016. Relative abundance categories are the following percentages of the community composition: Rare (R)
Figure 4 Surface water cyanobacterial genera relative abundance as measured by DNA barcoding.
The relative abundance is presented as a percentage of total sequence reads throughout the Lake
Elsinore 2016 season (A). NMDS of surface water cyanobacteria sequence reads, with chlorophyll a and
toxin concentrations. Stress = 0.055 (B).

May, June, and early July 2016 cyanobacteria populations were comprised mostly of Planktothrix
species, and on some dates Aphanocapsa and Aphanizomenon as well. The Planktothrix was primarily

                                                 20
from a single operational taxonomic unit (OUT) that comprised approximately 27% of the total microbial sequence reads in early May. In mid-July, there was a shift in the most abundant cyanobacterium as indicated by both the microscopy (Figure 3) and the DNA barcoding results (Figure 4). These samples were dominated by a single Microcystis OTU that at its peak (August 29, 2016) comprised approximately 45% of the total microbial sequence reads. Putatively-toxic genera Leptolyngbya and Cylindrospermosis were both present in the lake although at levels < 1% of the total microbial population according to the sequencing results and were rare (
Figure 5: Chlorophyll concentrations collected in 2016 at (A) Lake Elsinore and (B) Canyon Lake.

Canyon Lake Cyanotoxin Results

Overall summary, 2015-2017: Over all three years, 35% of water samples and 27% of SPATT samples
indicated there were 2 or more cyanotoxins detected and 6% and 7% of water and SPATT samples
indicated 3 or more cyanotoxins detected. For all years, microcystin was detected in 76% of water
samples, which ranged from not detected to 1.5 μg L-1 (Figure 6). Of the positive water samples, 17%
exceeded Caution health threshold and none exceeded the Warning Tier 1 and Danger Tier II health
thresholds (Table 1). Microcystins were detected in 57% of SPATT samples, and ranged from below
detection to 33 ng g-1 (Figure 6 shows 2016 data, Table 2 shows 2015 data). Anatoxin-a was detected in
53% of water samples and ranged from below detection to 9.4 μg L-1. Water sample concentrations
exceeded the caution health threshold in 23% of water samples and the warning and danger thresholds
were never exceeded. Anatoxin-a was detected in 14% of SPATT samples and concentrations ranged
from below detection to 735 ng g-1. Cylindrospermopsin was detected in 12% of all water samples and
ranged from below detection to 18 μg L-1. The caution health threshold was exceeded in 6% of samples,
and the other 6% exceeded the danger threshold (none exceeded the warning threshold).
Cylindrospermopsin was detected in 50% of SPATT samples and ranged from below detection to 141 ng
g-1. Nodularin was not detected in the water samples, and was only detected in one SPATT sample
collected in 2016 (was not analyzed in 2015 samples), 0.1 ng g-1.

                                                  22
2015 Results: Water sample results collected in 2015 indicated microcystin concentrations were
extremely low or not detected in Canyon lake. Microcystins were detected on July 29, 2015 (0.02 μg L-1)
but were not detected for the other 3 monthly sampling dates (August, September and October). The
SPATT results from Canyon Lake indicated there was consistent low microcystin concentrations
throughout the study period with concentrations ranging from 4.5-34 ng g-1 (Table 2). Anatoxin-a and
cylindrospermopsin were not detected in any of the 4 water samples or SPATT samples collected in
2015. Saxitoxin was detected from Canyon Lake water samples collected on July 29,2015 (1.8 μg L-1) and
September 16, 2015 (1.4 μg L-1).
2016 Results: In 2016, microcystins were detected in 90% of water samples, and 27% of samples
exceeded the caution health threshold, while no samples exceeded the warning and danger thresholds
and concentrations ranged from not detected to 1.5 μg L-1 (Figure 6). MCY-RR was the most common
congener detected and ranged from not detected to 0.8 μg L-1, MCY-LR ranged from below detection to
0.6 μg L-1 and MCY-YR and MCY-LA were only detected in 1 sample on 24 October 2016 and 1 August
2016 respectively. Microcystins were detected from 36% of SPATT samples and concentrations ranged
from below detection to 1.5 ng g-1, all of which was MCY-RR, and none of the other congeners analyzed
were detected. Anatoxin-a was detected in 27% of water samples and all of those exceeded the caution
thresholds (none exceeded warning and danger thresholds), and concentrations ranged from below
detection to 9.4 μg L-1. Anatoxin-a was detected in 18% of SPATT samples and ranged from below
detection to 735 ng g-1. Cylindrospermopsin was detected in 18% of water samples, and ranged from
below detection to 18 μg L-1. The caution health threshold was exceeded in 9% of samples and the
danger health threshold was also exceeded in 9% of health thresholds. SPATT samples detected
cylindrospermopsin in 63% of samples and ranged from below detection to 141 ng g-1. Nodularin was
not detected from water samples but was detected in 1 SPATT sample at 0.1 ng g-1. Saxitoxin was
analyzed from 3 samples collected in July and August but no toxin was detected.
23Figure 6 Cyanotoxin concentrations detected in water samples (A) and SPATT samples (B)
collected from Canyon Lake in 2016.
Microcystins are shown by the solid black link and circles, cylindrospermopsin is shown by the blue line
and triangles and anatoxin-a results are shown by the dotted line and white circles.
2017 Results: The 2017 sample results indicated microcystins at 0.1 μg L-1, anatoxin-a ranged from below
detection to 0.6 μg L-1 and no cylindrospermopsin was detected. The 21 August 2017 sample exceeded
the caution health threshold for anatoxin-a, but no other health thresholds were exceeded based on the
2 sample results collected in August and September 2017.
24Canyon Lake Cyanobacterial Community Composition and Chlorophyll-a Canyon Lake surface water cyanobacteria abundance from 2015 relative abundance results indicated dinoflagellates dominated the composition in July, and for the remaining field study period common cyanobacteria identified were Cylindrospermopsis spp., Limnothrix, and Planktolyngbya and Pseudoanabaena was abundant (Figure 7A). In 2016, chlorophytes dominated the community composition in May, but the composition transitioned to cyanobacteria dominance in July with common cyanobacteria identified including Cylindrospermopsis spp., Limnothrix, and Planktolyngbya (similar to 2015 results) and Arthrospira was abundant. In August, the community composition switched to clear dominance of Pseudoanabaena (Figure 7B). Figure 7 Relative abundance of cyanobacteria, diatoms and dinoflagellates from Canyon Lake collected in (A) 2015 and (B) 2016. Relative abundance categories are the following percentages of the community composition: Rare (R)
DISCUSSION AND RECOMMENDATIONS
Lake Elsinore

Cyanotoxins were chronically detected at relatively high concentrations that frequently exceeded
California health trigger thresholds. The cyanotoxin concentrations detected during this study are
currently the highest recorded concentrations of microcystins, anatoxin-a and cylindrospermopsin in
southern California lentic waterbodies (Magrann et al., 2015, Howard et al., 2017), and among the
highest reported within the State. There were human illnesses reported during the monitoring period.
The concentrations of microcystins were higher in Lake Elsinore than in other studies resulting in human
illness. For example, microcystin concentrations in Uruguay that resulted in a family becoming ill,
including acute liver failure requiring a liver transplant, had maximum concentrations ranging from 56-
8200 μg L-1 (Vidal et al., 2017). That is 5.4 to 800-fold lower than the maximum concentrations detected
in Lake Elsinore (5,600 to 45,300 μg L-1).

Microcystins were detected in 93% of water, scum and foam samples and 100% of SPATT samples. From
the water, scum and foam samples, 61% exceeded the Danger Tier II health threshold (7% and 17%
exceeded the Warning Tier I and Caution health thresholds respectively). Anatoxin-a was detected in
30% of water, scum and foam samples and 21% of SPATT samples. Water, scum and foam samples never
exceeded the danger threshold but did exceed the Warning Tier I and Caution thresholds in 23% and 6%
of samples respectively. Cylindrospermopsin was detected in 35% of water, scum and foam samples and
57% of SPATT samples. The Danger Tier II health threshold was exceeded in almost a quarter of water,
scum and foam samples, while the Warning Tier I and Caution Trigger thresholds were exceeded in 10%
and 2.4% of samples respectively. Figure 8 summarizes these results.

The results from this study suggest that 68% of the time, recreational swimming is not recommended
based on CA guidance and health based trigger thresholds (OEHHA, 2012;
http://www.mywaterquality.ca.gov/monitoring_council/cyanohab_network/docs/appendix_a.pdf).
Therefore, the recreational beneficial uses of Lake Elsinore were severely impacted due to the high
acute concentrations of cyanotoxins as well as the chronic detections at the most accessible recreational
locations. The toxin results indicated a high risk for immediate impacts to human, wildlife and domestic
pet health.

In addition to high acute concentrations detected, there were cyanotoxins were also chronically
detected in water and SPATT samples, across multiple months and seasons, similar to findings in other
CA studies (Kudela, 2011, Gibble and Kudela 2014, Gibble et al., 2016, Howard, et al., 2017, Peacock et
al., 2018). Chronic exposure to microcystins can have human and wildlife health implications (Bury et al.,
1995, Wiegand et al., 2000, de Figueiredo et al., 2004, Jacquet et al., 2004, Malbrouk et al., 2006, Backer
et al., 2008, Backer et al., 2009, Li et al., 2011, Trevino-Garrison et al., 2015, Li et al., 2016) and can be
transported into riparian food webs (Moy et al., 2016). While exposure studies were beyond the focus of
this assessment study, there were human health illnesses reported during the monitoring period.
Therefore, both acute and chronic exposure mechanisms are present in Lake Elsinore and both should
be considered a predominant stressor with a high risk of human, wildlife and domestic pet health
consequences.

                                                     26
Multiple cyanotoxins were frequently detected simultaneously, the health risks and consequences are
unknown for co-occurring toxin exposure. The health consequences and risks from exposure to co-
occurring cyanotoxins is poorly characterized because health thresholds are typically based on
exposures to a single cyanotoxin. These biotoxins have different mechanisms of toxicity that could have
synergistic effects and act as different, but additive, physiological stressors. The study results indicate
frequent detection of multiple cyanotoxins simultaneously. There were 2 or more cyanotoxins detected
in 68% of water, scum and foam samples and 71% of SPATT samples (Figure 9). There were 3 or more
cyanotoxins detected in 37% of water, scum and foam samples and 7% of SPATT samples. The co-
occurrence of multiple cyanotoxins from a single location has been documented in other studies, both
within and outside of the U.S. (Graham et al., 2010, Gkelis et al., 2014, Rodriquez et al., 2014, Sabart et
al., 2015, Pekar et al., 2016) and in southern California (Howard et al., 2017, Tatters et al., 2017).
Cyanobacteria genera and species identifications indicated a high risk for multiple cyanotoxins to be
routinely produced and co-occur in these systems. The initial study design was based on a tiered
system to analyze toxins, based mostly on the presence of potential toxin-producing cyanobacteria
genera and species. The results indicated multiple potential toxin-producing cyanobacteria observed in
all samples. Therefore, the risk of cyanotoxin presence was high, and other cyanotoxins were potentially
present (but not tested) including lyngbyatoxin, BMAA, homoanatoxin-a, neosaxitoxins.
DNA barcoding is a useful tool to identify cyanobacteria and determine relative abundance. DNA
barcoding can be used to estimate the relative abundance of organisms in each sample and allows for
high throughput of samples. The identification of cyanobacterial species using DNA barcode sequencing
for taxonomic identification has been successful in the Sacramento-San Joaquin Delta and Clear Lake
(Kurobe et al., 2013). The microscopy and DNA barcoding results from this study were effective in
identifying cyanobacteria species abundances. There was good agreement of broad community
composition results between both methods suggesting that DNA barcoding could be used on a routine
basis to determine the relative abundance of cyanobacteria. Both measurements indicated that in May,
June, and early July 2016 cyanobacteria populations were comprised mostly of Planktothrix spp. In mid-
July, there was a shift in the dominant cyanobacterium to Microcystis spp. as indicated by both the
microscopy and DNA barcoding results. The use of DNA barcoding will allow the development of a gene-
specific screening tool for potential biotoxins and specific quantitative PCR assays using the sequences
obtained in this study. Future studies should focus on the development of these tools for effective
cyanobacteria and cyanotoxin management.
The combination of multiple potential cyanotoxin producing species identified, and the detection of
multiple cyanotoxins simultaneously, highlights the need to monitor cyanotoxins in Lake Elsinore on a
routine and frequent basis.
Canyon Lake
Microcystins were chronically detected at low concentrations that occasionally exceeded California
health trigger thresholds. Microcystins were detected in 76% of water samples, and 57% of SPATT
samples. However, only 17% of water samples exceeded the Caution trigger threshold and no samples
exceeded the Warning Tier I and Danger Tier II trigger thresholds (Figure 8). These results indicate low
chronic and persistent microcystins present in Canyon Lake, across multiple months and seasons. As
27stated above, there are health consequences that result from chronic exposure to microcystins for
human and wildlife (Bury et al., 1995, Wiegand et al., 2000, de Figueiredo et al., 2004, Jacquet et al.,
2004, Malbrouk et al., 2006, Backer et al., 2008, Backer et al., 2009, Trevino-Garrison et al., 2015) as well
as documented transport into riparian food webs (Moy et al., 2016). Therefore, chronic exposure to
microcystins should be considered a predominant stressor with a high risk of human, wildlife and
domestic pet health consequences.
Cylindrospermopsin and anatoxin-a were detected half of the time and only occasionally exceeded CA
health trigger thresholds. Cylindrospermopsin and anatoxin-a were detected less often in Canyon Lake
compared with Lake Elsinore. Water samples detected cylindrospermopsin and anatoxin-a in 12% and
53% of samples respectively and SPATT samples detected these toxins in 50% and 14% respectively.
Cylindrospermopsin exceeded the Danger Tier II trigger threshold in 6% of samples and the Caution
trigger in 6% of samples while anatoxin-a exceeded the Caution trigger in 23% of water samples and no
other trigger thresholds were exceeded.
Cyanobacteria genera and species identifications indicated a high risk for multiple cyanotoxins to be
routinely produced and co-occur in these systems. The results indicated multiple potential toxin-
producing cyanobacteria observed in most samples. There was a high risk of multiple cyanotoxins to be
present and 35% of water samples and 27% of SPATT samples detected 2 or more cyanotoxins. Three or
more cyanotoxins were detected in 6% of water samples and 7% of SPATT samples (Figure 9).
Recommendation
The dominance of cyanobacteria and the ubiquitous and persistent detection of cyanotoxins in these
highly frequented recreational lakes suggest that cyanotoxins should be included in routine and
systematic monitoring programs to protect public health.
28Figure 8. The cyanotoxin results from(A) Lake Elsinore and (B) Canyon Lake from 2015 – 2017.
The positive toxin samples are indicated by a colored circle, with the color corresponding to the CA
health trigger thresholds (yellow, orange and red circles indicate Caution, Warning and Danger
thresholds exceeded, respectively). There are currently no established thresholds for nodularin. Open
circles indicate that no toxin was detected.
Figure 9. The number of cyanotoxins detected simultaneously from Lake Elsinore (top panel) and
Canyon Lake (bottom panel) from 2015 – 2017. The top row in each plot shows results from water,
scum and foam samples while the bottom row shows results from the passive samplers, called SPATT,
that were deployed continuously and represent a time-integrated measurement.
29REFERENCES
Amorim, A., V. Vasconcelos, 1999. Dynamics of microcystins in the mussel Mytilus galloprovincialis.
Toxicon 37(7), 1041-1052.
Backer, L.C., W. Carmichael, B. Kirkpatrick, C. Williams, M. Irvin, Y. Zhou, T.B. Johnson, K. Nierenberg,
V.R. Hill, S.M. Kieszak, Y.S. Cheng, 2008. Recreational exposure to low concentrations of microcystins
during an algal bloom in a small lake. Marine Drugs 6(2), 389-406.
Backer, L.C., S.V. McNeel, T. Barber, B. Kirkpatrick, C, Williams, M. Irvin, Y. Zhou, T.B. Johnson, K.
Nierenberg, M. Aubel, R. LePrell, A. Chapman, A. Foss, S. Corum, V.R. Hill, S.M. Kieszak, Y.S. Cheng, 2009.
Recreational exposure to microcystins during algal blooms in two California lakes. Toxicon, 55: 909-921.
Backer, L.C., J.H. Landsberg, M. Miller, K. Keel, T.K. Taylor, 2013. Canine cyanotoxin poisonings in the
United States (1920s-2012): Review of suspected and confirmed cases from three data sources. Toxins
5(9), 1597-1628.
Brooks, B. W., J. Lazorchak, M.D.A. Howard, M.V. Johnson, S. Morton, D. Perkins, E. Reavie, G. Scott, S.
Smith, J. Steevens, Jeffery, 2016. Are Harmful Algal Blooms Becoming the Greatest Inland Water Quality
Threat to Public Health and Aquatic Ecosystems? Environmental Toxicology and Chemistry, 35(1): 6-13.
Bury, N.R.; Eddy, F.B.; Codd, G.A. 1995. The effects of the cyanobacterium Microcystis aeruginosa, the
cyanobacterial hepatotoxin microcystin–LR, and ammonia on growth rate and ionic regulation of brown
trout. J. Fish Biol., 46, 1042–1054.
Caporaso, J.G., Kuczynski, J., Stombaugh, J., Bittinger, K., Bushman, F.D., Costello, E.K., Fierer, N., Peña,
A.G., Goodrich, J.K., Gordon, J.I., Huttley, G.A., Kelley, S.T., Knights, D., Koenig, J.E., Ley, R.E., Lozupone,
C.A., McDonald, D., Muegge, B.D., Pirrung, M., Reeder, J., Sevinsky, J.R., Turnbaugh, P.J., Walters, W.A.,
Widmann, J., Yatsunenko, T., Zaneveld, J., Knight, R., 2010. QIIME allows analysis of high-throughput
community sequencing data. Nature methods 7, 335–336. doi:10.1038/nmeth.f.303
Caporaso, J.G., Lauber, C.L., Walters, W.A., Berg-Lyons, D., Lozupone, C.A., Turnbaugh, P.J., Fierer, N.,
Knight, R., 2011. Global patterns of 16S rRNA diversity at a depth of millions of sequences per sample.
Proceedings of the National Academy of Sciences 108, 4516–4522. doi:10.1073/pnas.1000080107
Caporaso, J.G., Lauber, C.L., Walters, W.A., Berg-Lyons, D., Huntley, J., Fierer, N., Owens, S.M., Betley, J.,
Fraser, L., Bauer, M., Gormley, N., Gilbert, J.A., Smith, G., Knight, R., 2012. Ultra-high-throughput
microbial community analysis on the Illumina HiSeq and MiSeq platforms. ISME J 6, 1621–1624.
Carey, C.C., J.F. Haney, K.L. Cottingham, 2007. First report of microcystin-LR in the cyanobacterium
Gloeotrichia echinulata. Environmental Toxicology 22(3), 337-339.
Carmichael, W. 2001. Peer Review of Cyanotoxin Toxicity Criteria and Health Based Water
Concentrations to Protect Human Swimmers, Dogs and Cattle. Prepared for: State Water Resources
Control Board-Division of Water Quality. Wright State University, Dayton, Ohio 45435.
30Carmichael, W., 2008. A world overview - One-hundred-twenty-seven years of research on toxic
cyanobacteria - Where do we go from here? Hudnell, H. K., editor. Cyanobacterial Harmful Algal Blooms:
State of the Science and Research Needs, Chapter 4: pp. 105-125.
Chapman, P.M., 2015. Harmful algal blooms should be treated as contaminants. Integrated
Environmental Assessment and Management, 11, 523-524.
de Figueiredo, D.R.; Azeiteiro, U.M.; Esteves, S.M.; Goncalves, F.J.; Pereira, M.J. 2004. Microcystin-
producing blooms--a serious global public health issue. Ecotoxicol. Environ., 59, 151-163.
Edgar, R.C., 2010. Search and clustering orders of magnitude faster than BLAST. Bioinformatics 26,
2460–2461. doi:10.1093/bioinformatics/btq461
Edwards, C., K.A. Beattie, C.M. Scrimgeour, G.A. Codd, 1992. Identification of anatoxin-a in benthic
cyanobacteria (blue-green algae) and in associated dog poisonings at Loch Insh, Scotland. Toxicon
30(10), 1165-1175.
Gibble, C.M., R.M. Kudela, 2014. Detection of persistent microcystin toxins at the land–sea interface in
Monterey Bay, California. Harmful Algae 39, 146-153.
Gibble, C.M.; Peacock, M.B.; Kudela, R.M. 2016. Evidence of freshwater algal toxins in marine shellfish:
Implications for human and aquatic health. Harmful Algae, 59, 59-66.
Gkelis, S.; Zaoutsos, N. 2014. Cyanotoxin occurrence and potentially toxin producing cyanobacteria in
freshwaters of Greece: A multi-disciplinary approach. Toxicon, 78, 1-9.
Graham, J.L.; Loftin, K.A.; Meyer, M.T.; Ziegler, A.C. 2010. Cyanotoxin mixtures and taste-and-odor
compounds in cyanobacterial blooms from the midwestern United States. Environ. Sci. Technol., 44,
7361-7368.
Havens, K.E., 2008. Cyanobacteria Blooms: effects on aquatic ecosystems. In H.K. Hudnell (Ed.),
Cyanobacterial Harmful Algal Blooms: State of the Science and Research Needs (pp. 733-747). Springer-
Verlag New York.
Hudnell, H. K., Q. Dortch, 2008. Chapter 2: A synopsis of research needs identified at the interagency,
international symposium on cyanobacterial harmful algal blooms (ISOC-HAB). Pages 17-43 in H. K.
Hudnell, editor. Cyanobacterial Harmful Algal Blooms: State of the Science and Research Needs.
Hudon, C., M, De Sève, A, Cattaneo, 2014. Increasing occurrence of the benthic filamentous
cyanobacterium Lyngbya wollei: a symptom of freshwater ecosystem degradation. Freshw. Science
33(2), 606-618.
Jacquet, C.; Thermes, V.; de Luze, A.; Puiseux-Dao, S.; Bernard, C.; Joly, J.S.; Bourrat, F.; Edery, M. 2004,
Effects of microcystin-LR on development of medaka fish embryos (Oryzias latipes). Toxicon, 43, 141-
147.
31You can also read