2020 GREATER VICTORIA POINT-IN-TIME HOMELESS COUNT AND HOUSING NEEDS SURVEY - EVERYONE COUNTS - CRD
←
→
Page content transcription
If your browser does not render page correctly, please read the page content below
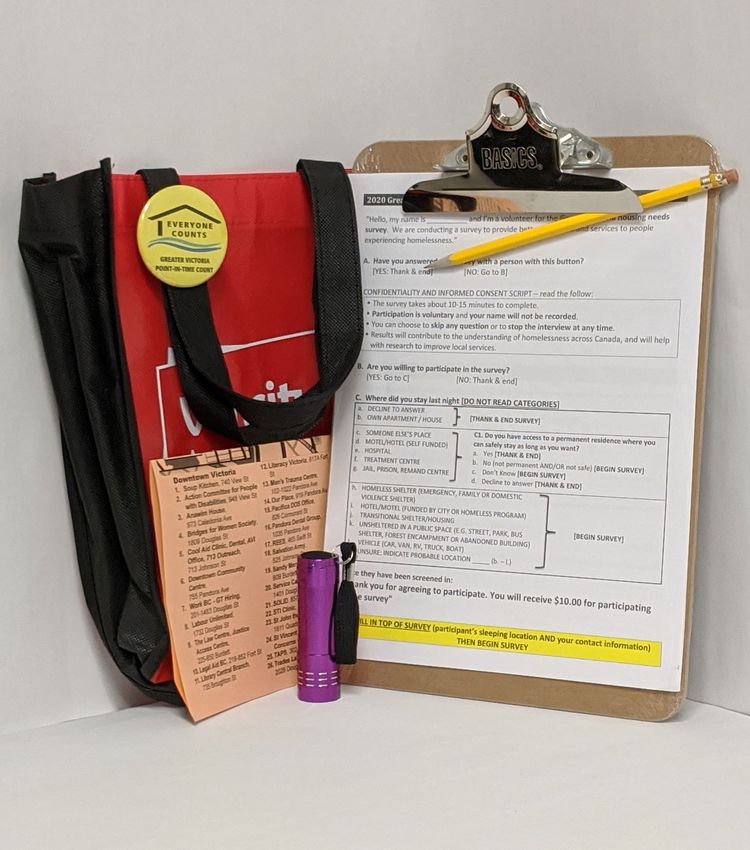
EVERYONE
    COUNTS
2020 GREATER VICTORIA
 POINT-IN-TIME COUNT

2020 GREATER VICTORIA POINT-IN-TIME
HOMELESS COUNT AND HOUSING NEEDS SURVEY

                                               L COA
                                    INA                               L
                               IG
                                                                       IT
                          R
                         ABO

                                                                             ION
                                                                             SS
                         TO

                                                                          NE
                          EN

                                               Artist: Evan      James
                                                        Artist: Evan James

                               D     Artist: Evan James

                                    HOMELES
                                                                    S
Greater Victoria is a vibrant, fast-growing region; however, it faces complex
challenges with housing vulnerable citizens who are homeless.

We would like to extend a special thank-you to all of those experiencing the challenges
of homelessness who so generously shared your personal and often difficult stories.
Those stories paint a detailed backdrop that will help to support our efforts and those
of our community and government partners to prevent, reduce, and end homelessness.

2020 GREATER VICTORIA POINT-IN-TIME HOMELESS COUNT AND NEEDS SURVEY

Community Report / July 2020 / For detailed data results, download the Technical Appendix
at crd.bc.ca/about/what-we-do/regional-housing/research-and-planning

Prepared by Chelsea Fiorentino, Diana Gibson, and Bernie Pauly

PROJECT TEAM AND PARTNERS                                        ACKNOWLEDGEMENTS

Community Social Planning Council: Chelsea Fiorentino,           We would like to thank everyone who contributed
Project Coordinator; Mikaila Montgomery, Facilities              their valuable time, support, and expertise to
Coordinator and Lead Project Assistant; Heather                  the 2020 Point-in-Time survey. A special thanks
Parks and Brooklyn Goryniuk, Youth Engagement                    to all of our community partners, including
Coordinators; and Fraser Fyfe, Project Assistant.                emergency and transitional housing, health
                                                                 services, food banks, meal programs, libraries,
Aboriginal Coalition to End Homelessness: Sally
                                                                 drop-in centres, local municipalities, regional
Hunter-Brady, Indigenous Engagement Coordinator; and
                                                                 police officers and other local service providers.
Emma Paul, Indigenous Youth Engagement Coordinator.
                                                                 Thank you to the sponsors, supporters, and 175
Volunteer Victoria: Lisa Mort-Putland and                        volunteers who made the survey possible.
Pooja Tole, Volunteer Coordinators.
                                                                 Design: Nadene Rehnby, Hands on Publications.
People with Lived/Living Experience
Engagement Committee of the Greater
Victoria Coalition to End Homelessness.
University of Victoria: Dr. Bernie Pauly,
Canadian Institute for Substance Use Research.

                                                                                                  L COA
                                                                                          INA                           L
                                                                                     IG
                                                                                                                          IT
                                                                                R
                                                                               ABO

                                                                                                                                ION
                                                                                                                               SS
                                                                               TO

                                                                                                                            NE
                                                                                EN

                                                                                                     Artist: Evan James
                                                                                                           Artist: Evan James

                                                                                     D     Artist: Evan James

                                                                                          HOMELES
                                                                                                                       S

                                                                                                                                       This project was funded by
                                                                                                                                      the Government of Canada’s
                                                                                                                                       Reaching Home: Canada’s
                                                                                                                                        Homelessness Strategy.
CONTENTS
EXECUTIVE SUMMARY / 4                  BEHIND THE NUMBERS: GREATER VICTORIA
                                       PiT 2020 SURVEY FINDINGS / 12
INTRODUCTION / 6                       Gender / 12
Definition of homelessness / 6         Age / 13
                                       Age of first homeless experience / 13
BACKGROUND / 7
                                       Households / 14
Homelessness in Greater Victoria / 7
                                       Families with children / 14
PiT project methodology / 8            Indigenous identity / 15
Lived experience / 8                   Residential school history / 17
Connecting with populations with       Sexual orientation / 17
unique experiences and needs / 9       Experiences of foster care / 19
Limitations / 9                        Immigrants and refugees / 19
                                       Length of time in Greater Victoria / 19
ENUMERATION: GREATER VICTORIA
                                       Emergency shelter stays / 20
POINT-IN-TIME COUNT 2020 / 10
                                       Income / 21
Changes over time / 11
                                       Health conditions / 21
                                       Reasons for homelessness / 22

   A CLOSER LOOK AT                    Chronic homelessness / 22
   EXPERIENCES OF                      Obstacles to accessing housing / 25
   HOMELESSNESS
                                       Service needs / 25
   Indigenous people / 16

   Youth / 18                          CONCLUSION / 27

   Seniors / 23
                                       References / 28
   Veterans / 24
                                       Appendix A: Engagement with
   District of Sooke / 26              communities with unique needs / 29

                                       Appendix B: Community Supporters and Partners / 31
EXECUTIVE SUMMARY
BETWEEN MARCH 11 AND 12, 2020, over 175 citizen            used to provide insight into the nature and extent of
volunteers and staff, along with a cross-sector            homelessness within a community. The survey collects
of service agencies and community partners,                data about the demographics, history, and service
participated in the Capital Region’s third Point-in-Time   needs of those experiencing homelessness to help
Homeless count and survey. This extensive effort           guide decision-makers, planners, and service providers
counted at least 1,523 individuals who experienced         in directing resources to areas of greatest need.
homelessness on the night of March 11, 2020. On
March 12, volunteers conducted over 850 surveys
with people experiencing homelessness across               ENUMERATION RESULTS FOR
the region, providing an invaluable set of personal        THE NIGHT OF MARCH 11, 2020
histories, experiences, and needs.
                                                           This PiT count should be treated as an under-estimate.
This year’s Point-in-Time (PiT) count occurred at a        Some individuals value their privacy and prefer not
unique time in history, during the local emergence         to participate in the survey while others experiencing
and response to the global COVID-19 pandemic.              “hidden” homelessness are difficult to reach and,
Although a formal pandemic response from homeless          therefore, would not be included in this count.
supporting agencies and federal, provincial and
                                                              • At least 270 individuals were unsheltered
local governments occurred a few days following
the enumeration, awareness and information were               • At least 350 were emergency sheltered
circulating about the pandemic at the time of the
                                                              • At least 145 were couch-surfing
count that could have influenced people’s decisions
to isolate out of doors or attend PiT count-related           • At least 743 were provisionally accommodated
events. More recent initiatives put into place, such            in transitional housing and institutions
as repurposing hotel rooms to allow individuals to            • At least 15 stayed in unknown locations
safely shelter in place, will have shifted the numbers
between unsheltered and provisionally sheltered            Homelessness is a fluid experience where one’s
since the PiT count.                                       shelter circumstances and options can change quite
                                                           dramatically night-to-night, and one may move in
The Point-in-Time project is much more than a tool         and out of homelessness over time. For example, a
used to count the number of people experiencing            significant number of those couch surfing on March 11
homelessness on a given night. It is a strategy            had stayed in a homeless shelter in the past year.

4
KEY HIGHLIGHTS
                                                           270           350       145         198           545
PiT COUNT

                     The night of March 11, 2020                                                                           On the night of March 12, 2020,
                     at least 1,523 people were         UNSHELTERED EMERGENCY
                                                                     SHELTERS
                                                                                    COUCH
                                                                                   SURFING
                                                                                                PUBLIC
                                                                                               SYSTEMS
                                                                                                           TRANSITIONAL
                                                                                                             HOUSING       854 individuals participated in the
                     experiencing homelessness                                                                             homeless needs survey, representing
                     in Greater Victoria.                                                                                  over half of those enumerated.
                                                                                          15 WERE IN UNKNOWN LOCATIONS

                                                                                AGE                                              LONG-TERM
GENDER

                     Two thirds                                                                                36%
                                                                                                     34%                         HOMELESSNESS
                     identified                                                 The majority
                     as male.             63%    33%          2%                are aged                                         ■■ 1 in 2 respondents
                                                                                25–55.                                19%           first experienced
                                                                                              8%                                    homelessness as
SEXUAL ORIENTATION

                     12% identify as LGBTQ2S+                                                                                       youth (under 25).
                                                                                    2%
                     Among youth,                          Don’t know/                                                           ■■ 82% have been
                     the number                             no answer
INTRODUCTION
BETWEEN MARCH 11 AND 12, 2020, over 175 citizen              DEFINITION OF HOMELESSNESS
volunteers and staff, along with a cross-sector of service
agencies and community partners, participated in the         The Canadian Observatory on Homelessness
Capital Region’s third Point-in-Time Homeless Survey.        defines Homelessness in Canada as the inability
                                                             of an in individual, family or community to access
Over 50 shelter, transitional housing and health
                                                             or acquire stable, safe, permanent and appropriate
facilities provided data, and surveys were conducted
                                                             housing (COH 2012). Homelessness describes a
at nearly 50 facility locations and walking routes. This
                                                             range of housing and shelter circumstances and
extensive effort resulted in counting at least 1,523
                                                             encompasses a range of physical living situations,
individuals who experienced homelessness on the
                                                             including:
night of March 11, 2020. On March 12, volunteers
conducted over 850 surveys with people experiencing             • UNSHELTERED – Absolute homelessness
homelessness across the region, providing an                      and living on the streets or in places not
invaluable set of personal histories, experiences, and            intended for human habitation (e.g., public
needs.                                                            spaces, vehicles, abandoned buildings).

The PiT project happened just as the COVID-19                   • EMERGENCY SHELTERED – Those staying
pandemic was breaking across the region. The                      in overnight shelters for people who are
enumeration between unsheltered and emergency                     homeless, or in shelter for those impacted
sheltered will have changed as a result of the reduced            by family violence.
number of shelter beds to accommodate social                    • PROVISIONALLY ACCOMMODATED – Staying
distancing (which will have increased the unsheltered).           in accommodation that is lacking security
Additionally, the repurposing of hotels and other                 of tenure (e.g., transitional housing with
temporary shelters for those in the camps will have               a maximum stay of three years, living in
impacted the number of people who are provisionally               hotels/motels, staying at someone else’s
accommodated for the time being.                                  place or couch-surfing, staying at treatment/
                                                                  mental health/corrections facilities with no
The Point-in-Time (PiT) project is much more than a
                                                                  secure permanent housing to return to).
tool used to count the number of people experiencing
homelessness on a given night. The PiT count project            • AT RISK FOR HOMELESSNESS – People who
is a strategy to help provide insight into the nature             are not homeless, but current economic and/
and extent of homelessness within a community. The                or housing situation is precarious or does
PiT project collects community information about the              not meet public health and safety standards.
demographics, history, and service needs of those
                                                             The Greater Victoria 2020 PiT count definition of
experiencing homelessness.
                                                             homeless aligns with this widely-accepted definition
While enumeration provides a snapshot of the numbers,        of homelessness and includes people who are
the homeless needs survey provides valuable data to          unsheltered, emergency sheltered, and provisionally
guide decision-makers, planners, and service providers       accommodated. The PiT project does not enumerate
in directing resources to areas of greatest need.            or survey people who are at risk of homelessness.

6
BACKGROUND
HOMELESSNESS IS A CONCERN across the                     HOMELESSNESS IN GREATER VICTORIA
country, affecting an estimated 35,000 Canadians
on a given night, and at least 235,000 Canadians         The Victoria Census Metropolitan Area (CMA),
in a given year (Rech 2019). The widespread              commonly referred to as Greater Victoria, contains 13
nature of homelessness and the growing length            municipalities, spans the territories of approximately
                                                         20 First Nations, and is home to nearly 380,000 people
of periods of homelessness for many Canadians,
                                                         (for a map of the region, see the Technical Appendix).
sparked the Government of Canada to launch the
                                                         The region is thriving with vibrant urban and non-
National Poverty and Housing strategy to reduce
                                                         urban communities where residents work, play, and
homelessness nation-wide (Rech 2019). To help
                                                         have access to a diverse range of services. But Greater
reach its goal of reducing homelessness by 50%
                                                         Victoria is also known to have some of the least
by 2028, the Government of Canada’s Reaching             affordable housing and rental markets in Canada.
Home Program funds Nationally Coordinated
                                                         High rental housing costs, low vacancy rates, lack of
Point-in-Time counts and surveys to help track the
                                                         affordable housing, the long waitlist for BC Housing,
extent and experiences of homelessness in various
                                                         and inadequate incomes make it challenging for many
communities across the country.
                                                         local community members to afford housing, find
The Point-in-Time approach includes core standards       housing, and meet the costs of daily living, contributing
and a consistent methodology to guide communities        to homelessness.
in gathering essential information to help provide       As of October 19, 2019, the vacancy rate in Victoria
a national, provincial, and local lens of people         CMA was at 1.0% (CMHC 2020). Although there have
experiencing different types of homelessness. PiT        been some improvements in that rate with new
homeless data only represents people staying in          purpose-built rental housing (up from 0.5% in 2016), it
participating facilities and those who are approached    falls short of the 3.0% threshold for a healthy vacancy
and consent to participating in the survey. Therefore,   rate (RBC Economics 2019). The average 2019 rent
the PiT enumeration is known to be an undercount         for private apartments in the Victoria CMA was $1221,
of the homeless population in the community.             which is 30% higher than in 2017 (CMHC 2020).
                                                         Income has not increased apace. Since 2018, the
Although the enumeration is a minimum count of
                                                         minimum wage has increased by 8.6% and falls far
people experiencing homelessness, the detailed PiT
                                                         short of the region’s living wage. Most recent figures
survey provides valuable data to guide decision-
                                                         are that one-fifth of the CRD’s households were in
makers, planners, and service providers in directing
                                                         Core Housing Need, spending over 30% of their income
resources to areas of greatest need.                     on rent and utilities (Statistics Canada, 2016 Census).
Under the leadership of the Capital Regional District    These housing market and income factors are
and with coordination by the Community Social            exacerbated by other systemic, economic, structural,
Planning Council of Greater Victoria, the region has     societal, and personal contributing factors that affect
participated in the biennial PiT count and survey        many homeless and at-risk residents in the area.
since the first national PiT count in 2016.              People experiencing homelessness in Greater Victoria

                                                                                                               7
are diverse in age, gender, and ethnic backgrounds;                providing the number of individuals
have unique experiences and needs for services; and                experiencing homelessness who spent the
have varied incomes, household arrangements and                    night of March 11 at their facilities.
reasons for becoming homeless. This report reflects
                                                               • SURVEY DATA: Individuals who stayed in an
that diversity while drawing out important trends.
                                                                 unsheltered location (e.g., outdoors, vehicle), or
                                                                 with someone else were reached by volunteers
PIT PROJECT METHODOLOGY                                          conducting surveys the following day.1

A high-level summary of the methods is included            HOMELESS NEEDS SURVEY
in this report, but for those seeking a more detailed
methodology, data set or the survey forms, see the         The homeless needs survey aims to connect with
Technical Appendix.                                        as many people as possible that were experiencing
                                                           homelessness on the night of March 11, using a
The Greater Victoria Point-in-Time count and survey        community effort involving staff and volunteers.
took place over a 24-hour period, providing a snapshot     A team of approximately 175 trained community
of homelessness across the region for that particular      volunteers, people with lived experience, service
night. The 2020 PiT project followed the methodology       providers and homelessness outreach workers
of previous Greater Victoria PiT counts and the            conducted over 850 surveys from early morning to
national and provincial guidelines. There is one           late evening on March 12. The survey included a short
notable change from the 2018 PiT count and survey          set of screening questions based on the PiT definition
method: respondents were asked where they slept            of homelessness. The survey was conducted by
the night before instead of where they anticipated         volunteers and staff in outdoor locations, temporary
sleeping that night. This was done to avoid the high       housing/shelter facilities, homeless and non-
level of “don’t know” responses on the 2018 survey         homeless serving agencies (e.g., food banks, meal
                                                           programs), and magnet events.
The two key components of the PiT project include the
enumeration and the homeless needs survey.
                                                           LIVED EXPERIENCE
ENUMERATION METHODS
                                                           The PiT project engaged people with lived experience
The enumeration component of the PiT project               in the following ways:
provides the minimum number of people staying
                                                               • A third of the CSPC PiT staff team have lived
in emergency shelters, transitional housing, on
                                                                 experience of homelessness, including a
the streets, staying in public systems without
                                                                 lived experience work placement through the
permanent housing, and people experiencing hidden
                                                                 Victoria Immigrant and Refugee Centre Society
homelessness such as couch surfing or staying with
                                                                 (VIRCS).
family and friends because they have nowhere else to
go (see page 6 for definition of homelessness).                • Outreach through the Greater Victoria Coalition
                                                                 to End Homelessness’s Lived Experience
The PiT count uses two key methods for enumeration:
                                                           1 If survey respondents reported spending the night of
    • ADMINISTRATIVE DATA: Administrative staff
                                                             March 11 in a sheltered facility, they were not counted
      from participating homeless shelters,                  in the enumeration, since they would have already been
      transitional housing facilities, and institutional     captured in the administrative data provided directly from
                                                             the facility for that night — these individuals still would
      settings (health, treatment and correctional           have been surveyed, however, to collect the broader survey
      facilities) filled out an enumeration form,            information not covered in the facility enumeration form.

8
committee (survey design, volunteer              outreach. This included: involvement in survey
       recruitment and a training session for the       design, cultural sensitivity training for volunteers,
       lived experience researchers).                   targeted outreach with local Indigenous serving
                                                        agencies, increased participation of Indigenous people
   • Lived experience volunteers participated in
                                                        conducting surveys in Indigenous-specific areas, Elder
     the survey, supporting survey teams and
                                                        participation in the training sessions and opening
     conducting surveys.
                                                        the headquarters, Indigenous cleansing offered for
This engagement led to survey modifications, an         volunteers, and medicine bags for volunteers and
increase in the honoraria to reflect the living wage,   survey participants (see Appendix A for more detail).
and a team of lived experience volunteers to support
survey teams on March 12.
                                                        LIMITATIONS

CONNECTING WITH POPULATIONS WITH                        The PiT count enumeration is not meant to reflect
UNIQUE EXPERIENCES AND NEEDS                            the experiences of homelessness through a year,
                                                        or the complete scope of homelessness within the
While structural and socioeconomic factors often        region. Homelessness is a fluid experience where
contribute to experiences of homelessness, each         one’s shelter circumstances and options can change
incidence is a unique experience. There are,            quite dramatically night-to-night due to personal and
however, some specific population groups that are       external factors, and one may move in and out of
particularly impacted by the factors that contribute    homelessness over time.
to homelessness and, therefore, experience higher
                                                        Furthermore, the PiT count enumeration cannot
rates of homelessness than the general population.
                                                        provide a completely accurate count of the people
The Greater Victoria Point-in-Time project focuses
                                                        experiencing homelessness in a region — it is
efforts on making contact with populations that have
                                                        not meant to be a census. People experiencing
higher rates of experiencing hidden homelessness,
                                                        homelessness may not always identify as homeless,
including Indigenous people, newcomers to Canada,
                                                        may not access typical shelters or services designed
and youth. Specific efforts were undertaken to engage
                                                        for homeless populations, and may not be at indoor
more deeply with these groups to make the survey
                                                        and outdoor survey locations on the day of the
more inclusive, to reach out to hidden homelessness,
                                                        PiT project survey activities, making it challenging
and to engage them in conducting the homeless
                                                        to reach out to, count, and survey every person
needs survey (see Appendix A for more detail on
                                                        experiencing homelessness in the region. Further,
the engagement strategies used). The PiT count and
                                                        fluctuations in numbers might, in some part, be
survey team also made special efforts to reflect the
                                                        due to an increase or decrease in response rates of
geographic diversity of the region including outlying
                                                        individuals, which could be driven by methodological
areas such as Sooke.
                                                        changes or other external factors that have caused
Indigenous people: In recognition that Indigenous       a higher or lower number of unsheltered individuals
people are disproportionately represented among the     completing the survey.
total population experiencing homelessness, the 2020
                                                        Because of these limitations, data from successive PiT
Greater Victoria PiT count project partnered closely
                                                        counts and surveys cannot be used to suggest trends
with the Aboriginal Coalition to End Homelessness
                                                        in the types of homelessness being experienced
(ACEH). The CSPC and ACEH worked to significantly
                                                        from year to year in the region and must take into
improve engagement with Indigenous people by using
                                                        consideration a variety of contextual factors each time
a much stronger cultural focus and greater targeted
                                                        a count and survey takes place.

                                                                                                               9
ENUMERATION
GREATER VICTORIA POINT-IN-TIME COUNT 2020

     AT LEAST

     1,523                  people were experiencing homelessness in
                            Greater Victoria on the night of March 11, 2020

      270
    UNSHELTERED
                               350
                              EMERGENCY
                                                         145COUCH
                                                                                    198
                                                                                      PUBLIC
                                                                                                               545
                                                                                                            TRANSITIONAL
                               SHELTERS                    SURFING                   SYSTEMS                  HOUSING

        270 stayed in        350 in emergency         At least 145a stayed       198 stayed in public           545 stayed in
       an unsheltered        shelters, seasonal           with a friend,           system settings          transitional housing,
      location, such as       shelters, youth           family member,             with no home to            a temporary type
       a public space,         shelters, and             or stranger, or          return to, such as         of accommodation
     park, tent, vehicle,    domestic violence         at a hotel/motel,         correctional halfway          meant to bridge
        or other place          shelters for          because they do not         houses, hospitals,             the gap from
       not intended for         emergency             have a secure place           and treatment             homelessness to
     human habitation         accommodation               of their own                 centres               permanent housing

         In total, 620 people were                         A total of 888 were provisionally accommodated
    unsheltered and emergency sheltered                  Another 15 spent the night in an unknown sleeping location.

The total number of people counted to be couch surfing is a gross undercount as it solely relies on the survey outreach
a

methodology. There are likely many couch surfing individuals not accessing services who did not know about the count.

10
CHANGES OVER TIME Between 2018 and 2020, the total
The table below illustrates the minor changes between
number of people experiencing
unsheltered, emergency sheltered, provisionally homelessness may appear to remain
sheltered, and total homeless individuals identified
the same; however, there is a notable
by the PiT count enumeration over time. The higher
number of people experiencing homelessness fluctuation in types of homelessness.
identified in the 2020 count from the first PiT count
completed in 2016 is due to improved survey and homelessness may have been the result of the
enumeration outreach methods and community growing fear and rapid spread of COVID-19 that may
participation, rather than a demonstration of any have been interpreted to be in confined, crowded
increase in the number of people experiencing locations.
homelessness.
Rather than seeking to draw information from
Between 2018 and 2020, the total number of people what appears to be slight variations from year to
experiencing homelessness may appear to remain the year, the real value must be seen in the collection
same. However, there is a notable fluctuation in the of data from the comprehensive survey completed
types of homelessness people are experiencing — this with a high proportion of the people identified as
is due to methodology changes and external factors experiencing homelessness from the enumeration.
that are beyond the control of the researchers, such As the community continues to regularly complete
as COVID-19. On the night of March 11, 2020, a higher PiT counts and surveys with improved methodology
number of people sleeping outdoors were contacted efforts, the data will continue to provide valuable
by PiT survey volunteers than in the previous 2018 insight into the progress towards preventing and
PiT enumeration. This increase in unsheltered addressing homelessness in the region.
Sleeping location 2020 2018 2016
UNSHELTERED in outdoor locations, vehicles, and
270 158 192
other places not intended for human habitation
EMERGENCY SHELTERED in seasonal and emergency
350 359 333
shelters, including domestic violence shelters
COUCHING SURFING (without secure housing and sleeping
145 95 74
at someone else’s places or in a self-funded hotel/motel)a
PUBLIC SYSTEMS temporary stay with no permanent housing of own 198b 248 150
TRANSITIONAL HOUSING (typically a maximum stay of three years) 545 588 573
Unknown Sleeping location 15 77 40
TOTAL (minimum number of people counted) 1,523 1,525 1,362
a
The survey does not accurately measure hidden homelessness such as couch surfing. This is a gross underestimate but provides
important data on experiences and needs.
b
Vancouver Island Regional Correctional Centre was not able to participate in the 2020 Greater Victoria PiT Count, which likely
explains the lower number counted in correctional facilities this year. In 2018, 84 individuals were counted at VIRCC.
11BEHIND THE NUMBERS
GREATER VICTORIA PiT 2020 SURVEY FINDINGS
THE FOLLOWING RESPONSES are taken from the 854 people who answered the Point-in-Time Homeless needs
survey between March 11 and March 12, 2020 (refer to the Technical Appendix for the survey questions and data
tables). The number of surveys represents over half of the population enumerated, meaning the results can be
considered a good representation of the broader homeless population in the region.
The graphs in this section are based on all 854 respondents, unless otherwise indicated. Some figures are based
on sub-populations, such as youth or Indigenous survey respondents. Any charts or figures based on these
subpopulations are noted.
GENDER
GENDER
Respondents to the 2020 PiT mostly identified as
male: 63.1% male, 32.6% female, and 2.2% another
gender identity.2 This is similar to the 2018 survey;
both years over-represent men in experiencing
homelessness in the Greater Victoria Region. 2020 63% 33% 2%
There are notable differences in the type of 2018 66% 30% 2%
sheltering location by gender. The table below Percentages do not total 100 as some chose not to answer.
shows that substantially more women were
provisionally accommodated than emergency Two thirds identify as male.
sheltered or unsheltered; whereas, men’s sheltering
locations were relatively even between the three sheltering categories. In contrast, there were considerably
more individuals who identify as another gender identity sheltered outdoors than in an indoor location.
Gender Emergency Provisionally
Unsheltered sheltered sheltered Total
Man/male 35.1% 28.6% 36.4% 63.1%
Woman/female 29.1% 20.9% 50.0% 32.6%
Another gender identity 50.0% 22.2% 27.8% 2.1%
Don’t know/no answera 31.6% 31.6% 36.8% 2.2%
a
The exact percent is not identified in some areas to protect the identity of the respondents.
Unsheltered = unsheltered in a public space, vehicle, unsure, don’t know/unclear answers. Emergency sheltered = emergency
shelters, domestic violence shelters, seasonal shelters, and hotel/motel vouchers funded by homeless program). Provisionally
sheltered = transitional housing, someone else’s place, self-funded hotel/motel, hospital, and treatment centre.
2 Other gender identities include two-spirit, trans female/trans woman, trans male/trans man, and others.
12AGE
36%
A wide range of ages are represented in the survey
34%
population, with the youngest age 16 and the oldest
age 78 (as part of the research ethics, surveys were
not conducted with anyone under the age of 16).
The majority (70.7%) are adults between the ages AGE
of 25 and 54. The ageing population on the street is 19%
a growing concern, and the survey reinforces that:
8%
nearly one-fifth (19%) of survey respondents were
aged 55 and older.
2% 1%
Summaries of youth and senior’s experiences of
homelessness are outlined later in this report.Consistent with previous PiT surveys, a large FAMILIES WITH CHILDREN
portion of respondents had their first experience
with homelessness as a youth. For 51.4% of survey Families with children experiencing homelessness
respondents, that first experience happened as youth account for 30 (3.5%) of the survey respondents and
under the age of 25 with a considerable number include 42 children/dependents.
(37.6%) first experiencing homelessness as a
teenager under the age of 19. For the night of March 11, of those 30 survey
respondents with dependents: 24 were single, 18
Similar to the 2018 PiT homeless needs survey were single mothers, 6 were male, 21 were female
results, a notable number of respondents had their (3 identified as other gender identities), 12 were
first experience of homelessness as older adults age Indigenous, and 7 were youth under the age of 25.
55 and above (7.1% in 2020 and 7.6% in 2018).
More than one in three were homeless by the age of 19.
18 respondents 7 were
HOUSEHOLDS with dependents youth under
were single 12 were age 25
More than three quarters of respondents were single mothers Indigenous
or had no family members staying with them the
night of March 11, while 21% were accompanied While half of the children under
by a partner, friend, family member, or child(ren)/
dependents.
16 stayed with parents in
transitional housing, 28% were
Most spent the night alone unsheltered or slept in vehicles.
without a partner, family
Of the 42 dependent children, one quarter (32) were
member, or friend. under the age of 16. While 50% of these children
under the age of 16 stayed with parents in transitional
77%
housing, 28% were unsheltered or slept in vehicles.
WHERE FAMILIES WITH CHILDREN
HOUSEHOLDS SPENT THE NIGHT
Someone
Unsheltered else’s place/
28% motel
22%
18%
3.5% 2%
Transitional
Alone Partner/ Family with Don’t housing
family/ children/ know/no 50%
friend dependents answer
Reflects who the survey respondent stayed with This chart is based on the 32 children who were
on the night of March 11, 2020. Percentages do under the age of 16 and stayed with a parent/family
not add to 100 due to rounding. member on the night of March 11, 2020.
14INDIGENOUS IDENTITY Almost one third of Indigenous respondents (96) are
from 29 communities within Vancouver Island’s three
Widespread research indicates that colonial distinct tribal regions:
treaties, policies and practices designed to eradicate • Kwakwaka’wakw = 16 respondents
Indigenous cultures across Canada, including
• Nuu-chah-nulth = 45 respondents
residential schools and the Sixties Scoop, have led to
• Coast Salish = 36 respondents
intergenerational trauma, causing extensive health
and social implications for Indigenous people today.
This impact of colonization has led to Indigenous
peoples living off-reserve in urban centres to Kwakwaka’wakw
16
experience homelessness at a disproportionate rate
and make up a substantial percentage of people
experiencing homelessness in cities.
The 2020 PiT survey found 35% (299 people) of all Coast Salish
respondents identifying as Indigenous. This is slightly 36
Nuu-chah-nulth
higher than the 2018 PiT survey results, where 290 45
(32%) identified as Indigenous. With approximately
4.7% of the Greater Victoria population identifying
as Indigenous (2016 Census), Indigenous individuals
Map VIEA.ca
are disproportionately represented among those
experiencing homelessness.
Almost one third of Indigenous
Of those 299 survey respondents who identify as
Indigenous, one half are First Nations with status.
respondents are from 29
Nearly 80% of Indigenous respondents shared the
communities within Vancouver
Indigenous community they are from, and over 100 Island’s three distinct tribal regions
communities from across the country were listed.
25 people are from other Indigenous communities
51% throughout BC, and 99 respondents are from
Indigenous communities and Nations outside of BC.
INDIGENOUS 12% of Indigenous respondents are on a waitlist for
IDENTITIES on-reserve housing, 15% are on an urban Indigenous
housing waitlist, and 7% are on a waitlist for both. It
28% should be noted that, since the majority of Indigenous
communities/reserves place a priority on housing for
18% families, many single individuals may not consider
putting their name on a housing waitlist.
11%
Given that 35% of respondents self-identify as
1%
Indigenous, regional housing strategies, such as BC
First Nation Métis First Nation Indigenous Inuit Housing’s coordinated access supportive housing
with without ancestry
status status resources, should consider increasing Indigenous
Among the 299 respondents who identified as Indigenous. uptake in supportive and subsidized housing from
More than one response was possible. 33% (which is based on the 2018 PiT survey results).
15INDIGENOUS PEOPLE’S EXPERIENCES OF HOMELESSNESS
The concept and definition of Indigenous homelessness is complex and goes beyond the basic colonialist
definition of lacking access to stable, permanent, or appropriate housing. The Canadian Observatory on
Homelessness’ (COH) definition of Indigenous homelessness recognizes that Indigenous individuals, families
or communities lacking access to stable housing, also experience disconnected relationships with their land,
family, community, culture, and identities. The concept of Indigenous homelessness goes beyond the lack of
a physical structure of residence, as it comprises of the need for Indigenous people to “culturally, spiritually,
emotionally or physically reconnect with their indigeneity or lost relationships” (Thistle 2017, 6).
Experiences of homelessness, along with the personal challenges that act as contributors to homelessness
such as substance use, addiction and health challenges, can be directly linked to historical trauma, oppression,
residential schools, and other acts of colonization (Thistle 2017). See survey data on the following page for the
high level of residential school experience reported.
FACTS ABOUT THE HOMELESS INDIGENOUS POPULATION IN GREATER VICTORIA (299 surveys)
• More Indigenous women are homeless
than non-Indigenous women: 44% female, 80%
52% male, 3% had another gender identity AGE AMONG
(e.g., transgender, two-spirit) — only 33% of the INDIGENOUS
general survey population identify as female. RESPONDENTS
• 13% identify as LQBTQS2+, which is slightly
higher than the general survey population (12%). 10% 10%
• More than one third (36.0%) were sleeping Youth Adults 55+
outdoors on the night of March 11, and (under 25)
71.0% were single or had no family
members staying with them that night.
• 89% identify living with at least one
• 84% are experiencing chronic homelessness, health challenge:
meaning that they have been homeless for a total o Substance use issue = 72%
of 6 or more months of the past 12 months. o Mental health issue = 59%
• 59% had their first experience of homelessness o Illness/medical condition = 45%
as a youth (under the age of 25), with 46% o Learning/cognitive limitation = 41%
having their first experience of homelessness
o Physical disability = 37%
at the age of 18 or younger. This is higher
than the general survey population. • The top three reasons for housing loss:
Not enough income for housing (26%),
• Over half (52%) indicate being in foster care, a
conflict with spouse or partner (14%),
youth group home or a child welfare program as
and substance use issues (13%).
a child or youth. This is a much higher percentage
than the broader survey population, where 35% • Most common needed services include:
indicate being a child or youth in government/ Primary care (65%), addiction or substance use
ministry care — this is consistent with the (55%), mental health (51%), life skills (36%),
cross-Canada over-representation of Indigenous and Indigenous treatment/support (35.8%).
children and youth in the foster care system.
16RESIDENTIAL SCHOOL HISTORY SEXUAL ORIENTATION
61.5% of Indigenous respondents report having The majority of respondents identify as straight/
a personal or close family history of attending a heterosexual (84.7%), while 11.9% identify as
residential school. LGBTQ2S+ (lesbian, gay, bisexual, questioning,
queer, two-spirit, and more).
It is valuable to understand whether or not
Indigenous people experiencing homelessness SEXUAL ORIENTATION
have personally attended residential school or
had a parent or grandparent attend a residential LGBTQ2S+ Don’t know/
12% no answer
school. Much of the literature shows the interrelated
3%
connections between the effects of colonization and
residential schools with homelessness. Having an
understanding of this incidence and the prevalence
within the local homeless population can help inform Straight/
the degree to which housing and support solutions heterosexual
85%
might consider incorporating strategies to address
trauma, including intergenerational and historical
trauma and work towards the provision of culturally Of those who identified as LGBTQ2S+, 24.5% were
safe and appropriate spaces and services. youth, 67.6% were adults, and 7.8% were aged
55+. These results are similar to the 2018 PiT
44% survey results.
RESIDENTIAL
37% Findings also indicate that respondents who
SCHOOL
ATTENDANCE identify as LGBTQ2S+ are more likely to have first
experienced homelessness as a youth (70%) than
those who identify as straight (49%).
21%
17% Respondents who identify as
LGBTQ2S+ are more likely
5%
to have first experienced
At least At least No family/ Self Don’t know/
one one personal no answer homelessness as a youth than
grandparent parent history
those who identify as straight.
Among the 299 respondents who identified as Indigenous.
More than one response was possible.
While national data is limited, some studies
suggest that LGBTQ2S+ members maybe be more
61.5% of Indigenous likely to live in poverty than their non-LGBTQ2S+
respondents report having counterparts. Furthermore, LGBTQ2S+ youth are
over-represented in poverty and homelessness
a personal or close family statistics, due to rejection of family members
and lack of services to address the needs of
history of attending a LGBTQ2S+ youth living in poverty (Canadian
residential school. Observatory on Homelessness, n.d.).
17YOUTH (AGE 16–24) EXPERIENCES OF HOMELESSNESS
Youth homelessness typically refers to young people aged 13 to 24 who are living independently of parents and
caregivers and do not have a stable or consistent residence and source of income or have adequate access to
the support networks necessary to transition from childhood to independent adulthood.
In 2018, the PiT project surveyed 157 youth aged 15 to 24 experiencing homelessness in the Greater Victoria
Region. While the 2020 PiT project surveyed only 84 youth, this does not necessarily reflect a decrease in youth
homelessness. There was a change in which facilities participated in the count and lower attendance at the
magnet event due to COVID, both of which significantly affected the number of youth surveyed (see the Technical
Appendix for a detailed outline of the methodology changes). Still, with 84 youth surveys completed, the data
presents a robust picture of youth homelessness.
Youth homelessness remains a salient issue, as the literature estimates that approximately 20% of the
homeless population in Canada is comprised of youth; therefore, continuous efforts are needed to address and
prevent youth homelessness in the region.
FACTS ABOUT HOMELESS YOUTH IN GREATER VICTORIA (84 surveys)
• Gender identity and sexual orientation • 92.9% identify living with at least one health challenge:
are bigger factors for youth o Substance use issue 71%
homelessness: 7% identify as another
o Mental health issue = 70%
gender identity compared to 2% in
the broader group and 30% identify o Learning disability or cogitative limitation = 49%
as LGBTQ2S+ compared with 11%. o Illness/medical condition = 21%
o Physical disability = 21%
• 88% of respondents aged 18 and
under are female (16 respondents). • Top three reasons for losing housing most recently
for youth: conflict with/experience of abuse by
• One in five spent the night of March 11
a parent or guardian (21%), substance use issue
sleeping outdoors and 60% have spent the
(21%), and not enough income for housing (20%).
night in a homeless shelter in the past year.
• The top five needed services for youth were the
• The majority (73%) were single or
same as the general survey population; however, a
had no family members or friends
higher percentage of youth request needing mental
staying with them that night.
health services (52%) and life skill services (40%).
• Over one third (36%) identify as Indigenous,
similar to the broader survey population. Research suggests that experiences of homelessness
exacerbate the risk of substance use among youth,
• 80% are experiencing chronic as youth use alcohol and other drugs to cope with the
homelessness, meaning they have been traumas of homelessness. Substance use among street-
homeless for a total time of six months involved youth can lead to health implications, addiction,
or longer over the past 12 months. sexual exploitation, and criminal behaviour. Inexperience
• Over half (55%) are or were in with independent living, family conflict, and lack of
foster care, a youth group home, or available interventions and services often lead to youth
government care, a much higher portion homelessness; therefore, ensuring services and programs
than the broader survey group. specifically designed to address the unique needs of
youth and families and is essential in preventing youth
homelessness (Sekharan 2015).
18EXPERIENCES OF FOSTER CARE IMMIGRANTS AND REFUGEES
Over one-third (35%) of all survey respondents were While the majority of respondents (92.7%) do not
in foster care, a youth group home, or a child welfare identify as immigrants or refugees, 4.6% identify as
program of some sort as a child or youth. immigrants and less than 1.0% identify as refugees.
Approximate 30% of those who were in government Those who have come to Canada as an immigrant,
care (300 respondents) became homeless less than refugee or a refugee claimant have lived in Canada
one month after leaving their foster care/group home. as long as 2 to 64 years, with the majority (76.4%)
residing in Canada for more than 10 years.
Only 15% of these respondents feel that Child
Protective Services were helpful with transitioning to
LENGTH OF TIME IN CANADA
independence after leaving foster care.
Don’t know/
5 years or less
no answer
Experience of homelessness Percent of total 11%
5%
after ministry care in ministry care
6–10 years
7%
Still in care84% have lived in Greater not to, prefer to stay with friends, not LGBTQ2S+
friendly, etc. The primary reasons for avoiding
Victoria for one year or longer. homeless shelters are the same among different
sub-populations (i.e., youth, Indigenous, and senior).
LENGTH OF TIME IN GREATER VICTORIA These two questions about emergency shelters stays
demonstrate that, although shelters are an important
Under a year Don’t know/
no answer part of homelessness services in terms of emergency
12%
4% response, they may not work for everyone, and some
aspects could be improved.
1–5 years Always
20% been here
22% REASONS TO NOT STAY IN A HOMELESS SHELTER
Longer than Fear for safety 43%
5 years
42% Noise/crowding/ 36%
germs/sickness
Cleanliness/bugs/pests 32%
Alberta (18%) and Ontario (12%) are the next most
Substance use 21%
popular locations respondents have come from.
Turned away
(shelters are full) 13%
The top five reasons for moving to Victoria include (for
the full list of reasons, see data tables in the Technical Fear of theft 9%
Appendix): Accessibility/chronic
7%
health issues
• Family moved here (18.5%); Not women or
children friendly 6%
• To visit friends and family (13.2%);
Turned away (banned) 5%
• Employment (seeking and secured) (11.7%);
• Multiple reasons (11.5%); and Don’t allow pets 5%
• Access to supports and services (5.7%). Curfews/policies/rules 4%
Lack of transportation 3%
EMERGENCY SHELTER STAYS
Other 17%
Survey participants were asked if they have stayed in Don’t know/no answer 1%
an emergency shelter in the past year: 68% have.
Percentage based on 549 respondents who answered the question.
More than one response possible.
However, 64% indicate that there are reasons they
would not stay in a homeless shelter in the greater
Victoria region. The top reasons are: a fear for Other reasons given to not
safety (42.8%), noise/crowding/germs (36.2%), and stay in a homeless shelter
cleanliness/bug/pests (31.5%).
included: “they close early
Youth and seniors were less likely than adults to have
stayed in a homeless shelter in the past year.
or are full,” “don’t want to
Other reasons include: can’t stay with a partner,
take place of older person,”
mental health/anxiety issues, issues with staff, prefer and “hostile environment.”
20INCOME HEALTH CONDITIONS3
The vast majority (94%) report having at least one When asked about health challenges, 90% of survey
source of income, whether it is a formal or informal respondents identify as having at least one health
source. The most common source of income reported challenge. Youth (93%), seniors (92%), and veterans
is welfare/social assistance, closely followed by (94%) report slightly higher incidences of health
disability benefits, and employment (17.4% with challenges than the general survey population.
casual, part-time and full-time combined). Informal
Well over half of the respondents identify as having
sources of income were also significant at 16%, which
a substance use issue (67%) and/or a mental
may include bottle returns, panhandling, sex work,
health issue (59%). While it might be assumed that
etc. These results are consistent with the 2018 survey.
substance use and mental health are causes of
Sources of income # % homelessness, much of the literature demonstrates
Government transfers
that substance use and mental health are often a
response to and consequence of homelessness and
Welfare/income assistance 313 36.7%
exacerbated by trauma and loss associated with
Disability benefits 308 36.1% homelessness (Didenko & Pankratz 2007).
GST/HST refund 64 7.5%
Seniors benefits 56 6.6%
90% have at least one health
(CPP, OAS, GIS, pensions, etc.)
challenge, including substance
Child & family tax benefits 14 1.6%
use (67%), mental health (59%),
Employment insurance 11 1.3%
MCFD youth agreement 6 0.7% and brain injury (29%).
Government programs 4 0.5% 67%
HEALTH
Veteran/VAC benefits 2 0.2%
59% CHALLENGE/
Employment DISABILITY
Casual (contract work, etc.) 73 8.5%
45%
Part-time employment 50 5.9% 40%
37%
Full-time employment 26 3.0%
Other sources
Informal sources (bottle return, 139 16.3%
panhandling, sex work, etc.)
Money from family/friends 34 4.0%
Other sources not listed 19 2.2%
Substance Mental Illness/ Physical Learning/
Other money from a service agency 9 1.1% use issue health medical disability cognitive
issue condition limitation
Crime 6 0.7%
Investments/savings 4 0.5% 3 One question about health challenges and one
question about brain injury are new to the 2020
No income 55 6.4% Greater Victoria PiT Count survey. The health challenge
question was newly added to the federal survey, and
Decline to answer 21 2.5%
the brain injury question was added to the survey at
More than one response possible. the request to local community service providers.
21Strategies for addressing and preventing When survey respondents were asked how long ago
homelessness should tackle the health challenges they lost their most recent housing, 65% lost their
that can be both a cause and a consequence of housing one year ago or longer. At the time of the
homelessness. It is also essential to consider that survey, respondents reported losing their housing as
individuals and specific populations experiencing recent as the day before to 25 years ago.
homelessness (youth, Indigenous, seniors, veterans)
may have different experiences and incidences of Respondents reported losing
particular health challenges, as shown in this report.
their housing as recently as
Emerging literature suggests a correlation between
homelessness and acquired brain injury. When survey the day before, but for most it
respondents were asked if they identify as having an had been a year or longer.
acquired brain injury that happened after birth, (e.g.,
from injury related to an accident, violence, overdose,
51%
a stroke or brain tumour), 29.3% responded yes.
TIME SINCE
MOST RECENT
REASONS FOR HOMELESSNESS HOUSING LOSS
Survey participants were asked what caused them to
lose their housing most recently, and many indicated
multiple responses; there are multiple and potentially
14%
interrelated factors that contribute to housing loss, 12%
8% 9%
including a variety of structural, systemic, and 6%
personal factors. A lack of income for housing (whichWith seniors becoming the
fastest growing population,
strong measures need to be
taken to address and prevent
senior homelessness.
SENIORS’ (55+) EXPERIENCES OF HOMELESSNESS
The 2018 PiT survey found that at least 174 seniors (aged 55 and older) were experiencing homelessness
in the Greater Victoria Region. Comparably, for the 2020 PiT survey, 160 seniors experiencing homelessness
completed the survey, making up nearly 19% of all survey respondents. Much of the literature shows that
older adults are finding it increasingly challenging to afford housing with low or fixed incomes and increasing
housing costs, and tend to have unique needs and experiences of homelessness. The risk of homelessness
also increases in seniors with deteriorating physical and mental health, death of a partner or spouse, social
isolation, and a lack of awareness (Canadian Observatory on Homelessness, n.d.). With seniors becoming the
fastest growing population, strong measures need to be taken to address and prevent senior homelessness.
FACTS ABOUT HOMELESS SENIORS IN GREATER VICTORIA (160 surveys)
• A much higher portion of the seniors are • 38% had their first experience of homelessness
male: 70% identify as male, and 28% identify in recent years as a senior (55+).
as female. 5% identify as LGBTQ2S+.
• 92% identify living with at least
• 29% spent the night of March 11 sleeping one health challenge:
outdoors, and 66% have spent the night
o Illness/medical condition = 65%
in a homeless shelter in the past year.
o Physical disability = 64%
• The vast majority (84%) were single o Substance use issue = 50%
or had no family members or friends
o Mental health issue = 48%
staying with them that night.
o Learning/cogitative limitation = 29%
• 19% identify as Indigenous, much lower
than the general survey group. • Most common services needed by seniors:
Primary care (e.g., doctor, pharmacy, dentist)
• 83% are experiencing chronic homelessness, (62%), mental health (52%), addiction or
meaning that they have been homeless substance use (50%), and life skills (e.g., cooking,
for a total time of six months or finance planning, computers) (40.5%).
longer over the past 12 months.
23VETERANS’ EXPERIENCES OF HOMELESSNESS
5.5% of respondents (47) indicate they served in the Canadian Military (Canadian Army, Navy, or Air Force) or
RCMP. This finding is only slightly different from the 2018 PiT survey where 6.6% identified as veterans. Of these
veterans, the majority (92%) served in the Canadian Military Forces, with 8% having served in the RCMP.
Studies indicate that veterans may make up a significant percentage of Canada’s homeless population, and may
have unique needs and experiences of homelessness; therefore, it is essential to consider this population in
homelessness prevention planning.
• 93% of veteran respondents identify living with at least one health challenge,
which is slightly higher than the general survey respondents (90%):
o Mental health issue = 62%
o Illness/medical condition = 60%
o Substance use issue = 55%
o Physical disability = 49%
o Acquired brain injury = 49%
o Learning/cognitive limitation = 47%
47 survey respondents
indicated they served in the
Canadian military (Army,
Navy, or Air Force) or RCMP.
24OBSTACLES TO ACCESSING HOUSING The primary barriers to accessing housing are the
same among different subpopulations of the survey
Homelessness can be a traumatic experience caused respondents (i.e., Indigenous, youth, and seniors).
by challenging structural, systemic, and personal
Even though respondents were not asked what type
factors, and it is very rarely a choice. The survey
of housing they are looking for, it is evident that people
reflects that: 92.5% want permanent housing. This is
experiencing homelessness are heterogeneous and
consistent with previous PiT surveys.
have diverse housing needs. Therefore, housing
When asked about the challenges or problems in planning should include varied options and offer
trying to find housing, there was a lot of variety in clients’ choice, in alignment with the federal
the answers. The top three most common challenges government’s Housing First policy principles of self-
reported include: the high costs of rent (58.2%), low determination and without expectations such as sobriety.
income (49.2%), and lack of available housing options
(42.0%). These findings are not surprising, as they SERVICE NEEDS
are consistent with previous Greater Victoria PiT
surveys, and reflect the current economic conditions When survey respondents were asked to identify
of the high cost of living, excessive rents, and lack of which services applied to them from a list of services,
affordable independent housing options in the region. 85% of respondents selected a wide range of
needed services. The most prominent service needs
92.5% of respondents said are: primary care services (62.3%), addiction and
they want permanent housing. substance use services (49.3%), and mental health
services (47.5%).
Rents too high 58% A small percent of other mentioned services not
listed include services for housing/accommodations,
Low income 49%
employment services, family trauma and counselling,
Lack of available options 42%
and financial planning.
Discrimination 22%
Addiction 16% Primary care 62%
Mental health issues 12% Addiction/substance use 50%
CHALLENGES Mental health 48%
Poor housing conditions 11%
TO FINDING
Health/disability issues 10% Life skills 32%
HOUSING
No income assistance 9% Harm reduction 29%
Criminal history 9% Intergenerational trauma 23%
Pets 8% Learning disability 20% SERVICE
Family breakdown 7% 8% Indigenous treatment/support 14% GAPS
Other 28% Culturally sensitive services 11%
Don’t know/no answer 4% Gender specific services 5%
Newcomer/settlement support 4%
More than one response was possible.
Pregnancy 3%
The “other” category contains a broad range of Other 3%
answers, the most common of which are: no None of the above 9%
references (4.3%), domestic/sexualized violence Don’t know/no answer 6%
(4.1%), and no/bad credit (3.3%). More than one response was possible.
25DISTRICT OF SOOKE EXPERIENCES OF HOMELESSNESS
Greater Victoria spans a large area and is comprised of urban, suburban, and rural areas.
The District of Sooke is the westernmost municipality in the CRD.
Currently, there are limited services to address homelessness available in Sooke.
Current resources available for people experiencing homelessness in Sooke include:
• Sooke Transition House Society — a women’s domestic violence shelter;
• JDF Extreme Weather Shelter — this extreme weather shelter, which operates
from October to March when an emergency weather protocol is activated,
was started as a result of the findings from the 2018 PiT project;
• Sooke Shelter Society — offers outreach and basic necessities such as
temporary outdoor survival shelter gear, and access to food;
• Sooke Food Bank; and
• Sooke Family Resource Society.
As the community of Sooke is working to address homelessness in the area, an increased effort was made to
include Sooke in the 2020 PiT survey. While survey data was collected from a number of people experiencing
homelessness in the Sooke region, the findings may not be representative of the entire Sooke homeless
population — homelessness in non-urban communities often goes unnoticed and is challenging to track, as
many people tend to sleep in their vehicles or couch surf (Canadian Observatory on Homelessness, n.d.).
FACTS ABOUT SOOKE HOMELESSNESS (37 surveys)
• 64.9% (24) male and 27% (10) female. 11% (4) • 89% identify living with at least
identify as LQBTQS2+ one health challenge:
• Over half (20) of the respondents are adults, while o Mental health issue = 78.4%
16.2% (6) are youth, and 27.0% (10) are seniors. o Substance use issue = 64.9%
o Physical disability = 45.9%
• Nearly half (49% or 18 respondents) spent the
night at someone’s else’s place, 24% (9) slept o Illness/medical condition = 43.2%
outdoors unsheltered, 16% (6) slept in vehicles, o Learning/cognitive limitation = 40.5%
and less than 15% (You can also read