COMPARATIVE ANALYSIS OF THE NORTH SASKATCHEWAN AND YUKON INDIGENOUS LABOUR MARKETS 2006 TO 2020
←
→
Page content transcription
If your browser does not render page correctly, please read the page content below
Photo by: Alcangel144 on Pixabay

COMPARATIVE ANALYSIS OF THE NORTH
SASKATCHEWAN AND YUKON INDIGENOUS LABOUR
MARKETS 2006 TO 2020
Policy North (North West Saskatchewan Policy Unit)
Johnson Shoyama Graduate School of Public Policy
University of Saskatchewan
Kirk Hall Building, 117 Science Place
Saskatoon, SK S7N 5C8
Canada

June 2020
POLICY NORTH (NORTH WEST SASKATCHEWAN POLICY UNIT)

TABLE OF CONTENTS

 1.    Introduction ..................................................................................................................................... 3
 2.    Datasets and logic ............................................................................................................................ 5
 3.    indigenous labour market statistics, census 2006 and 2016 ........................................................... 6
 4.    Educational attainment cross referenced to labour force ............................................................ 11
       4.1       Progress? Far North and Yukon Census Educational Attainment ....................................... 13
       4.2       Literacy, Numeracy and Digital Capacity ............................................................................ 16
       4.3       Education and Income Briefly Correlated ........................................................................... 18
 5.    Self-Employment and Entrepreneurship ....................................................................................... 20
 6.    SEPH Data and Census Household Income .................................................................................... 21
 7.    EI beneficiairies data ...................................................................................................................... 22
 8.    Other Factors for Future Research ................................................................................................ 24
 9.    Lessons and Recommendations..................................................................................................... 25
 10.   Statistical Bibliography................................................................................................................... 28
       2016 Census Based Report ............................................................................................................ 28
       2006 Census Based Reports ........................................................................................................... 29
       Other Reports ................................................................................................................................ 29

                                                                                                     www.schoolofpublicpolicy.sk.ca | i
POLICY NORTH (NORTH WEST SASKATCHEWAN POLICY UNIT)
First Minister’s round tables on the economy,
1. INTRODUCTION health, transportation, and even down to the
national statistical council.
The North is all too often seen as a
homogenous region by southern Canadians and Figure 1: Comparing Two Circumpolar
our Federal government, yet those of us living Communities, 2016
the northern reality we know that there are as CATEGORIES SASK, YUKON SASK.
many different Norths each with different FAR
socio-economic profiles and different needs and NORTH
Population 2016 36850 35110 1070555
challenges. This short paper compares two of Population 2006 33919 30372 992314
these “Norths” Yukon and the Far North of Percentage Change 8.6% 15.6% 7.9%
Saskatchewan. These two regions exist under Median Age 2016
23.6 33 41
very different jurisdictional regimes, one a Aboriginal
Pop. Aboriginal
semi-autonomous Territory – Yukon, the other 2016
32205 8195 175020
a provincial “far” north, with no regional Pop. Aboriginal
29085 7580 141890
government body representing its residents 2006
also known as Census District 18 (CD-18) or Far Percentage Change 10.7% 8.1% 23.3%
North. 1 Both jurisdictions have similarities in Percentage
87.4% 23.3% 16.3%
Aboriginal 2016
demography and geography, although Yukon is
Percentage
some 200,000sq km larger than the 85.7% 25.0% 14.3%
Aboriginal 2006
Saskatchewan’s Far North. They also have Population First
25575 8195 114570
similar mining resource economies and are Nation, 2016
Population Métis,
considered part of the Circumpolar North 2016
6435 1015 57875
region. Both regions have severe winters and Population Non-
4650 26915 895535
limited business seasons for tourism and Aboriginal, 2016
Land area (square
mineral exploration (although more winter km.)
270,068 474,711 651,900
exploration happens in Saskatchewan’s Far Median Household
North). Both are distant from major Canadian Earnings 2015* $ 44,494 $78,112 $67,816
Non-Aboriginal
urban centres: Edmonton and Vancouver for
Median Household
Yukon and, Winnipeg and Edmonton for Far Earning 2015* $19,771 $61,781 $53,967
North. And both have substantial Indigenous Aboriginal
communities and economies (Figure 1). *Median after-tax income of households in 2015 ($)
Sources: Census of Canada 2016, CD-18, and Yukon
But there are also key and substantial
For example, in 2017 the Federal government
differences. Yukon is a Federal Territory acting
employed 476 workers in the Territory while
under the Yukon Act. It has a substantial public
the Yukon government listed 3914 employees.
service associated that includes Territorial and
Local and municipal governments had 574
Federal employees at a scale and level of
workers. Finally, Aboriginal or First Nation
investment unseen in Far North Although small
governments, most of them operating under
in population, Yukon, like NWT and Nunavut,
modern treaties, tallied 1614 employees.
have a seat at the Premier’s conferences, at the
1 the label Far North for effectively the same area within its
CD-18 is Census District 18 within the Statistics Canada
nomenclature but is commonly called Northern economic development zone regional assessments. We
Saskatchewan. While the Saskatchewan government uses use these terms interchangeably.
www.schoolofpublicpolicy.sk.ca | 3Comparative Analysis of the North Saskatchewan and Yukon Indigenous Labour Markets 2006 to 2020
According to the 2016 Census Far North in total Yukon’s road system connects all communities
had, in total, 1520 public administration but Old Crow to the central service hub in
positions, of which 1185 were occupied by Whitehorse.
Aboriginal people. Those are 6578 high paying
Yukon also had one of the fastest growing
jobs in Yukon with security and benefits, or
Canadians economies in the decade 2006 to
5393 more secure government pay cheques
2016. The GDP in 2012 dollars in 2016 GDP
than in northern Saskatchewan. These Yukon
reached $2,483 million, an increase of 43.4%
government jobs provide a secure income for
from the, 2006 GDP (2012 dollar) of $1,731
investment, retail purchases and taxes and
million. (Statistics Canada and Executive Council
stabilize the otherwise seasonal and cyclical
Office of the Yukon). While requests have been
northern economy. It raises a significant
made to the Saskatchewan Bureau of Statistics
question about why Saskatchewan’s Far North
response on the GDP of Far North and other
has such a comparatively small administrative
quests have gone unanswered due to the Covid-
presence.
19 shutdown. Statistics Canada data for 2018
Secondly, Far North lacks a major urban hub shows a per capita GDP for Yukon being higher
within its region. In contrast, Yukon is home to than Saskatchewan at $75,002 compared to
the largest Canadian city north of 60ON. $69,373. 2
Whitehorse acts is the territorial capital, and Both Yukon and Far North have fast growing
the focal point for federal government populations. The Yukon saw a 15.6% increase
activities, as well as an economic development over ten years in its population, while the Far
hub for the mining sector, for energy North slightly outpaced the province at 8.6%
management, for retail, and warehousing and versus 7.9% for the province. For the Far North
transportation, especially the Whitehorse this is attributable to natural increase; for
airport. In March 2019, the Whitehorse area Saskatchewan immigration is the key factor.
had a population of 32,000 people. For Far
North, the cities of Saskatoon, Prince Albert, The Yukon’s Aboriginal population is also much
and Battleford, all external to the Far North older than most northern Indigenous
labour market, control the northern resource communities, with a mature median age of 33.
hinterland, while political administration is ASs expected the comparative number for
again external being in Regina and, for First Indigenous Far North is a decade younger at
Nations reserves, Ottawa. Yukon has 23.6, while the province has a median age of 41.
centralized its economy around Whitehorse, yet
Finally, a few core differences between the
still suffers extensive outflow of capital to
Indigenous experiences in Far North and
Vancouver, Edmonton, Toronto, and other
Yukon need to be commented upon. Far
points in the south. I Saskatchewan, few of the
North is a majority Indigenous region with
investment decisions that impact the Far North
87.4% of the population declaring as First
are made with input from the dispersed
Nation or Metis, while the Yukon has
communities of Far North. They are dispersed
around a 23.3% Indigenous population and
on separate trunk roads coming out of Prince
dropping. Yukon’s Indigenous community
Albert, Saskatoon, and Battleford, with many
includes eleven (11) self-governing First
Far Northern communities lacking road access.
Nations, which adds a substantial number
2This can be updated when SBS returns to work assuming
they can generate the number.POLICY NORTH (NORTH WEST SASKATCHEWAN POLICY UNIT)
of First Nation government jobs and higher the increase in the number of Aboriginal
paying salaries for their employment people. Increasingly, Saskatchewan’s future
numbers as we will see below. These workforce will depend on either educating and
mostly self-governing First Nations have a training its Indigenous people, or on
strong land and resources base and self- immigration and foreign workers. The choice
government budget dollars, as well as should be obvious: educate and train locally.
substantial settlement funds that are The ramifications of not doing so, which would
invested in trust funds. In the Far North, continue the current pattern, are highly
many First Nation people reside on problematic.
“reserves” a constant reminder of a
colonial regime; worse, they exist in a
perpetual anxiety in communities that are 2. DATASETS AND LOGIC
just not economic places. As Robert Bone
This research exercise uses publicly
notes
available Statistics Canada date bases,
The lack of an economic foundation including the Census of Canada, specifically
had proven to be the Achilles heel of the Aboriginal profiles for Yukon 2006 and
the relocation ‘strategy” (read 2016 and the Far North of Saskatchewan
Reserves). Under normal Far North in this case, 2006 and 2016. The
circumstances, urban places that lose Survey of Household Spending (2017),
their economic function soon die, Survey Employment and Payroll Hours
whether they are single-industry towns (February 2020) and, where possible the
or rural communities. Native settlement Labour Force Survey are utilized. Finally, a
does not follow this pattern of urban ten-year run from the Employment
evolution because they generally have Insurance file for Far North versus Yukon is
been located within cultural homelands used as a proxy for change in employment
and close to traditional hunting lands. 3 in the region through to April 2020.
(Bone, 2003: 187) The Census provides a range of labour
force statistics including employment by
Another major gap exists between
North American Industrial Classification
Aboriginal household earnings and the non-
(NAIC), which is used in Canada, USA, and
Aboriginal incomes in Saskatchewan, with a
Mexico, and so is highly comparative. The
63.4% gap between the two levels of
study also looks at the links between labour
earnings. Non-Aboriginal Saskatchewan
and education as well as a full break-out of
households earn 2.72 times that of
LFS comparable data using the slightly
Aboriginal households in Far North.
different “period worked” definition in the
Finally, the growth in Saskatchewan’s Census. Added to this are the labour
population is strongly supported by the increase descriptors for average weeks worked and
in the number of Aboriginal citizens of the full-time and part-time employment.
province, with 42.3% or 33,130 of the 78,241 Educational attainment is a common
increase in the population being attributable to means of interpreting a labour force’s
3Robert M. Bone (2003), The Geography of the Canadian
North: Issues and Challenges, Toronto: Oxford University
Press. pp: 186-187.
www.schoolofpublicpolicy.sk.ca | 5Comparative Analysis of the North Saskatchewan and Yukon Indigenous Labour Markets 2006 to 2020
readiness for work and capacity. In an age both groups struggle to find work, entering the
of computers where numeral and labour force is the biggest difference between
computer literacy are as important today them. Yukon Aboriginals have a high
as literacy was fifty years ago, the Far participation rate, 70%. Which is higher than
North Aboriginal population is at a major the national average of 65%. On the other hand,
disadvantage, one that given the speed of Far North Aboriginals have a participation rate
technological change and transition may be of only 44.2%, a significant and alarming
impossible to resolve for the current difference. The majority of Far North’s
generation of workers. For this Aboriginals are neither working nor, more
information we turn to PIAAC and OECD importantly, looking for work. They have
studies undertaken with Statistics Canada become discouraged workers, effectively an
participation. 4 increasingly disenfranchised population. They
are in the majority in Far North with 11855 Not
in the Labour Force (NILF) and a Participation
3. INDIGENOUS LABOUR MARKET Rate of less than 50%. The numbers for
STATISTICS, CENSUS 2006 AND 2016 Aboriginal Saskatchewan being somewhat
better. Not captured here by the western or
The labour statistics displayed in Figure 2 (next settler society systems of data capture is the
page) indicate a strong divide between the role of traditional lifestyle. Being on the land,
Aboriginal and non-Aboriginal populations for hunting, fishing, and harvesting as part of the
all three jurisdictions. The statistics show non- way of life which helps feed families. Statistics
Aboriginals have a much stronger labour Canada would record these workers as not
market. Far North and the Yukon have strong looking for employment while being
economic divides between their Aboriginal and unemployed. This extends to the employment
non-Aboriginal populations, as does rate, showing less than a third of those able to
Saskatchewan as a province. This can easily be work are at only 29.9%. Both these phenomena
summed up by looking at labour statistics for can be linked to Far North’s population being
both regions. The most significant indicator is majority Indigenous, making up almost 84% of
the high unemployment rate seen in both Far the total population. The majority living On-
North and Yukon Aboriginals: 29.9 and 22.3%, Reserve a topic addressed later in this report
respectively, the non-Aboriginal populations see under non-economic places.
a sharp decline, recording unemployment rates
of 4.6 (Far North) and 5.9 (Yukon). It is evident
from these statistics that Aboriginal people find
it difficult to find employed.
Far North and the Yukon’s Aboriginal
populations differ in two important statistics:
participation and employment rates. Though
4 at work and in the wider community. This international
Programme for the International Assessment of Adult
Competencies (PIAAC) is a programme of assessment and survey is conducted in over 40 countries/economies and
analysis of adult skills. The major survey conducted as part measures the key cognitive and workplace skills needed for
of PIAAC is the Survey of Adult Skills. The Survey measures individuals to participate in society and for economies to
adults’ proficiency in key information-processing skills prosper. This includes the Canadian Territories and the
- literacy, numeracy and problem solving - and gathers breakout of Aboriginal populations.
information and data on how adults use their skills at home,POLICY NORTH (NORTH WEST SASKATCHEWAN POLICY UNIT)
Figure 2: Comparing Labour Statistics Saskatchewan Far North with Yukon and Saskatchewan, 2016
FAR NORTH SASKATCHEWAN YUKON
Aboriginal Non- Aboriginal Non- Aboriginal Non-
Aboriginal Aboriginal Aboriginal
Aged 15 and older 21240 4050 117325 739970 6280 22595
Labour Force 9390 2965 66815 518720 4395 17405
Employed 6590 2830 54380 489710 3415 16375
Unemployed 2805 135 12430 29010 980 1030
Not in Labour Force- 11855 1085 50510 221245 1890 5195
NILF
Employment rate (%) 31 69.9 46.3 66.2 54.4 72.5
Unemployment rate 29.9 4.6 18.6 5.6 22.3 5.9
(%)
Participation rate (%) 44.2 73.2 56.9 70.1 70 77
Average weeks 37.1 43.4 39.3 43 37.5 41.9
worked total
Sources: Census of Canada, 2016, Saskatchewan, Saskatchewan Division 18, and Yukon, see bibliography
One source excellent source of information for On-the-Land data is the NWT Bureau of Statistics
Community survey program. An example of their work is shown here from the South Slave lake region
close to the Saskatchewan border. 5 No comparable survey exists in the provincial northern regions.
Consuming country foods is important to Inuvialuit identity, and the culmination of a series
of cooperative activities—harvesting, processing, distributing, and preparing—that require
behaving in ways that emphasize Inuvialuit values of cooperation, sharing and generosity.
(Inuvialuit Regional Corporation, 2007)
In addition to community and cultural benefits, country foods are healthy, rich in essential
nutrients and low in sugars and unhealthy fats. (Makivik Corporation, 2000)
Figure 2b: Comparing Labour Statistics Saskatchewan CD-18, with Yukon and Saskatchewan, 2016
90
77
80 69.9 73.2 70.1 70 72.5
66.2
70
56.9 54.4
60
44.2 46.3
50
40 31 29.9
30 18.6
22.3
20
4.6 5.6 5.9
10
0
Aboriginal Non-Abo. Aboriginal Non-Abo. Aboriginal Non-Abo.
CD-18 Saskatchewan Yukon
Employment rate (%) Unemployment rate (%) Participation rate (%)
5 See: https://www.statsnwt.ca/community-data/
www.schoolofpublicpolicy.sk.ca | 7Comparative Analysis of the North Saskatchewan and Yukon Indigenous Labour Markets 2006 to 2020
Figure 2b provides a graphic representation of Aboriginals by part and full-time. This will show
the data in Figure 2. Here the difference us an in-depth view of these populations’ work
between Aboriginal Saskatchewan and Yukon structures. For annual full-time weeks worked,
unemployment rates (UR) makes it appear that there is a sharp difference between Aboriginal
Yukon has a higher Aboriginal UR. The study and non-Aboriginal populations, as expected
must also account for the difference between (Figure 3). One can see that non-Aboriginals
the two jurisdictions’ participation rates with a work 49-52 weeks, or between 6 (Yukon) and
higher percentage of Yukon Aboriginal workers 14 (Far North) percentage points more than
being both employed and participating in the Aboriginals. The difference is shifted to the 1-
economy. 26-week periods. This could be connected to
traditional Indigenous jobs being seasonal, with
There is, however, a positive sign in the analysis
hunting being an example. In both the Yukon
of the average weeks worked. The difference
and Far North, twice as many members of the
between Aboriginal and non-Aboriginal is only
Aboriginal population work full-time between 1
11%. This shows that once Aboriginals enter the
and 26 weeks as do their non-Aboriginal
labour force they work almost as frequently as
counterparts. This could also be connected to
non-Aboriginals. The main struggle for
Aboriginal employment being task oriented,
Aboriginal populations looks to be access to the
community-based jobs, and not standard
labour market. This leads to breaking down the
positions in an organization.
weeks worked by Aboriginal and non-
Figure 3: CD-18, Yukon Weeks Worked Full-Time Annually—Aboriginal, Non-Aboriginal Comparison
70.0%
60.0%
50.0%
40.0%
30.0%
20.0%
10.0%
0.0%
1 to 13 weeks 14 to 26 weeks 27 to 39 weeks 40 to 48 weeks 49 to 52 weeks
Yukon Aboriginal CD-18 Aboriginal Yukon Non-Aboriginal CD-18Non-Aboriginal
This poses challenges for those Aboriginal Seasonal employment is common, while both
communities that are not receiving income regions contribute workers to the Alberta oil &
throughout the whole year, with almost a third gas industries. Though these jobs are well paid,
of the people in both regions earning income they are hazardous and risky, and are normally
during less than half the year. This trend could fly-in/fly-outs positions requiring between two
be connected to the natural resources and three weeks onsite with a week off in
industries. Mining and mineral exploration are between. This adds more challenges to these
two of the largest industries in both regions.POLICY NORTH (NORTH WEST SASKATCHEWAN POLICY UNIT)
communities. 6 Additionally, these jobs tend to contrast between Far North Aboriginals and
keep their employees in camps for up to two to Yukon Aboriginals. A divide between part-time
three weeks at a time, away from their weeks worked by Yukon and Far North
communities. Aboriginals is visible. Unlike full-time work,
which saw a much closer relationship, part-time
Part-time work is much more evenly distributed
work sees Yukon Aboriginals working almost
compared to full-time work (Figure 4). This
identically to their non-Aboriginal counterparts.
makes sense, as part-time work is more flexible,
As was shown earlier, Aboriginals have difficulty
allowing a more diverse group of people to
entering the work force, but what is clear here
enter the labour force: mothers, students, and
is the difference between employment types
the elderly. What is interesting is the now sharp
once they have entered.
Figure 4: CD-18 and Yukon Weeks Worked Part-Time Aboriginal, Non-Aboriginal Comparison
35.0%
30.0%
25.0%
20.0%
15.0%
10.0%
5.0%
0.0%
1 to 13 weeks 14 to 26 weeks 27 to 39 weeks 40 to 48 weeks 49 to 52 weeks
Yukon Aboriginal CD-18 Aboriginal Yukon Non-Aboriginal CD-18 Non-Aboriginal
6 It should be noted that many Saskatchewan fly-in/fly-out
G.F. Finnegan and Jacobs, John (2015) “Canadian
interprovincial employees in the Canadian Arctic: a case workers drive long distances to reach job sites within and
study in fly-in/fly-out employment metrics, 2004–2009,” out of the province as seen during the Covid-19 Pandemic,
when the Far North was widely infected by one of more
Polar Geography 38.3 (2015): 175-193.
workers returning form the Alberta oilsands projects
https://www.tandfonline.com/doi/abs/10.1080/1088937X.
driving across the region infecting communities,
2015.1034795
www.schoolofpublicpolicy.sk.ca | 9Comparative Analysis of the North Saskatchewan and Yukon Indigenous Labour Markets 2006 to 2020
As shown, Far North Aboriginals
are working fewer weeks of the Figure 5: Employment by Sector 2016, SASK. Far North Compared to
year part-time, eleven percentage Yukon
points more than Yukon’s between FAR NORTH YUKON
1-13 weeks. On the other hand, NAICS Industries Non- Non-
Aboriginal Aboriginal
Yukon Aboriginals are working Aboriginal Aboriginal
more often, part-time (40-52 Total Industries 9390 2965 4390 17405
weeks). This could be linked to the Industry - Not Applicable 16.5% 0.7% 5.6% 0.9%
Yukon economy having more 11 Agriculture, forestry,
traditionally Western economic fishing, and hunting 2.4% 0.5% 1.5% 1.0%
roles that are accessible to the 21 Mining, quarrying, and oil
and gas extraction 8.8% 11.5% 3.5% 2.0%
Indigenous population. Not least
of which are government 22 Utilities 0.9% 0.3% 0.7% 0.7%
positions, such as the some 1600 23 Construction 6.5% 6.6% 12.1% 8.8%
in First Nation public 31-33 Manufacturing 1.1% 1.7% 1.4% 1.6%
administration (see below). 41 Wholesale Trade 0.6% 1.7% 0.9% 1.6%
As mentioned above, the reason 44-45 Retail Trade 8.0% 8.6% 6.7% 9.7%
48-49 Transportation and
more Aboriginal people work full-
warehousing 2.4% 7.4% 4.2% 5.1%
time for fewer weeks of the year 51 Information and cultural
than their non-Aboriginal industries 0.5% 1.2% 1.9% 2.6%
counterparts may be due to 52 Finance and insurance 0.3% 2.4% 1.4% 1.4%
traditional seasonal work. NAICS 53 Real estate and rental
categorization helps prove this leasing 0.6% 0.8% 0.6% 1.0%
narrative. Non-Aboriginals working 54 Professional, scientific, and
in the “Not Applicable” industry technical services 1.1% 2.2% 4.0% 6.4%
55 Management of companies
make up 0.7 and 0.9% of their
& enterprises 0.0% 0.0% 0.0% 0.1%
respective economies. Yet, the 56 Administrative and
percentage of the Far North support, waste management
Aboriginal population working in and remediation services 2.7% 2.2% 2.8% 2.5%
this “not applicable” industry is 61 Education services 14.5% 17.9% 6.2% 7.8%
16.5%, the largest single category. 62 Health care and social
In the Yukon, it is less at 5.6%, but services 13.3% 14.0% 9.8% 9.4%
still significantly higher than for 71 Arts, entertainment, and
recreation 0.7% 0.8% 2.4% 2.8%
Yukon’s non-Aboriginal
72 Accommodation and food
population. services 4.9% 4.4% 6.0% 7.4%
The difference between the 81 Other services 1.4% 3.7% 2.2% 3.9%
economies of Far North and the 91 Public administration 12.6% 11.3% 26.4% 23.3%
Yukon could be a reason for the Sources: Census of Canada 2016, Saskatchewan Division 18, and Yukon
sharp contrast between Far North
and Yukon Aboriginals working would be required to develop this line of
part-time. It is hard to decipher, as the NAICS inquiry.
data does not break down industries by part
and full-time employment. Further researchPOLICY NORTH (NORTH WEST SASKATCHEWAN POLICY UNIT)
As previously mentioned, the reason more Non-Aboriginal workers in Far North were also
Aboriginal people work full-time for fewer at around the same rate of employment in
weeks of the year than their non-Aboriginal mining and construction at 18.1%, while, in the
counterparts may be due to traditional seasonal expanded public services sector, they
work. NAICS categorization helps prove this accounted for a full 42.2% of positions held by
narrative. Non-Aboriginals working in the “Not non-Aboriginal workers. Retail trade, which is
Applicable” industry make up 0.7% and 0.9% of often an entry point for employment,
their respective economies. Yet, the percentage represents roughly an equal percentage of each
of the Far North Aboriginal population working groups’ labour force, although Yukon’s is
in this “not applicable” industry is 16.5%, the slightly lower. This may be attributed to the
largest industrial sector grouping for Aboriginal small number of retail stores in rural Yukon.
workers. In the Yukon it is far lower, at 5.6%, for
While there are no other significant
undefined or Not Applicable Aboriginal workers
employment groupings, it is apparent that the
but still significantly higher than the Yukon’s
Aboriginal population is underrepresented in
non-Aboriginal population.
the Transportation sector at only 2.4 in Far
The largest difference by category behind North. In Yukon, they are 4.2% and non-
Aboriginal/non-Aboriginal labour differences is Aboriginal workers in the sector are almost
in the “Not Applicable” (Figure 5). Traditional three times greater at 7.4%.
Indigenous practices may be an aspect in this
It is clear though, the Far North economy is not
difference whereby community members are
allowing many individuals to enter the western
active culturally and economically on the land.
labour market, either through traditional or
But we must also recognize that many residents
Western employment. What may be holding
in what are essentially “non-economic places”
back the Aboriginal population of the Yukon and
are active in the grey or underground economy,
Far North from improving their labour statistics
from having multiple roles doing odd jobs
and catching up to their non-Aboriginal
through to trading and bartering for goods and
counterparts? Looking at education is a good
services, to working off the books. Subsistence
window to understand why Aboriginals are
and employment are all too often a day-to-day
struggling to enter the labour force.
exercise.
Other significant differences in employment
relate to Educational service which represented 4. EDUCATIONAL ATTAINMENT CROSS
a higher percentage of Far North workers than REFERENCED TO LABOUR FORCE
those in Yukon and the highest percentage of
Aboriginal workers in any specified category at Both human capital and correspondence
14.5%, which was followed by Health care theories imply that an effective anti-poverty
workers and public administration. These three strategy should incorporate the enhancement
categories which all fall under the public of education and skills among households as
services rubric accounted for 40.4% of all there seems to be significant linkages between
workers. These are jobs that are more poverty and lower educational attainment. In
commonly associated with female workers. remote communities, this relationship may
More male-dominated industrial categories actually be exacerbated by success. This means
such as construction and mining and oil and gas that to improve the educational attainment of
accounted for 15.3% of Aboriginal employment. the community, it is necessary for the people in
that community to travel out to major urban
www.schoolofpublicpolicy.sk.ca | 11Comparative Analysis of the North Saskatchewan and Yukon Indigenous Labour Markets 2006 to 2020
centres to access higher education. In so doing What is equally disconcerting is the drop in the
they leave their community, often for good, percentage of Aboriginal students attaining
resulting in a declining local skill pool in human degrees and or certificates the trades between
capacity. 2006 and 2016. The percentage dropped from
9.8% to 5.4% over the decade. In 2006, 8,910
A high percentage of the Aboriginal
Aboriginal people were listed as having an
Saskatchewan’s population continued to have
“Apprenticeship or trades certificate or
very limited formal education, with 38.9%
diploma” but, by 2016, this number had
failing to graduate having “no certificate,
dropped to only 6280 potential workers while
diploma or degree”. This compares poorly with
the Aboriginal population increased by 28.5%
the non-Aboriginal population that reported
(Figure 6). It is often assumed that the trades
only 17.8% failing to acquire a school certificate.
are a sector of the economy which requires
However, we can see an improvement in the
more workers and where Indigenous workers
educational attainment of Aboriginal people
have a more ready entry through training
over time for 2006, when a full 49.4% had no
programs and corporate partnerships.
certificate of any kind.
What has happened here?
Figure 6: Educational Attainment Aboriginal Compared with non-Aboriginal, Sask., Census 2016
NON-
SIMPLIFIED EDUCATIONAL CATEGORIES ABORIGINAL AS A % AS A %
ABORIGINAL
Total - Highest certificate, diploma or degree for the
population aged 15 years and over in private households - 117325 739970
25% sample data
No certificate, diploma, or degree 45655 38.9% 131555 17.8%
Secondary (high) school diploma or equivalency certificate 33065 28.2% 228145 30.8%
Apprenticeship or trades certificate or diploma 6280 5.4% 31765 4.3%
College, CEGEP or other non-university certificate or
15900 13.6% 130870 17.7%
diploma
University certificate or diploma below bachelor level 2495 2.1% 25695 3.5%
University certificate, diploma, or degree at bachelor level
8945 7.6% 145530 19.7%
or above
Statistics Canada. 2018. Aboriginal Population Profile. 2016 Census.
One explanation may be the porous borders of region in 2006 are still working in the region but
Far North. The likely scenario would be that have relocated themselves and their families to
locally hired skilled labour active in the region in southern cities. This has certainly been the case
2006 are still working in the region but have in many northern villages where local hires
relocated themselves and their families to become fly-in worker, based in southern cities,
southern cities. This has certainly been the case overtime.
in many northern villages where local hires
Saskatchewan Aboriginal educational
become fly-in worker, based in southern cities,
attainment is drastically below the provincial
overtime. One explanation may be the porous
average and is a negative indicator of
borders of Far North. The likely scenario would
community capacity and resilience in a world
be that locally hired skilled labour active in the
that is increasing driven by the knowledgePOLICY NORTH (NORTH WEST SASKATCHEWAN POLICY UNIT)
economy. (Figures 6 and 7). Saskatchewan population 15+ acquiring a university degree or
Aboriginal educational attainment is drastically higher, having barley moved in a decade from
below the provincial average and is a negative the 3.2% of 2006.
indicator of community capacity and resilience
Figure 8: Far North 2016 Aboriginal and Non-Abo
in a world that is increasing driven by the
Saskatchewan
knowledge economy.
2016 non-
4.1 Progress? Far North and Yukon Census 2016 Aboriginal
Aboriginal
Educational Attainment
Category Number As a % Number As a %
Using the 2006 and 2016 Census reports for Far Total
North and Yukon, this section tracks the change Aboriginal
over time in educational attainment within the identity
21245 4055
population
region compared to Yukon for Aboriginal
15 years and
people. One uncontrolled factor here is
over
mobility. The best and brightest move south,
No
east, or west to gain educational credentials or certificate;
specialized trades programs and 12210 57.5% 655 16.2%
diploma or
apprenticeships. They are often absorbed by degree
the demand for Indigenous employees by High school
southern governments and industries looking to certificate or 4280 20.1% 920 22.7%
diversify and tap into the Indigenous economy. equivalent
Tracking these individuals would require a Apprenticesh
special data tabulation at considerable expense, ip or trades
1575 7.4% 510 12.6%
but it may be worthwhile looking to do. certificate or
diploma
Educational Attainment for 2006 and 2016 College;
compared shows little progress is being made in CEGEP or
the general population. The number of other non-
1950 9.2% 865 21.3%
Indigenous people failing to acquire a high university
certificate or
school degree or any certification at all actually
diploma
increased from 12135 to 12210. Although this
University
is a slight improvement as a percentage, many certificate or
of the older population, the Elders, will have diploma
naturally left the working population (Figures 8 345 1.6% 130 3.2%
below the
& 9). bachelor
level
The apprenticeships/trades sector of the labour
University
force has declined as a percentage of the labour certificate or 730 3.4% 980 24.2%
force although it did increase from 1380 degree
individuals to 1575. This sector is driven by male Sources: Census of Canada 2016, Saskatchewan
employment and educational attainment with Division 18
1125 males compared to 435 females (rounding
accounting for difference). University Again, the porous nature of the Northern
attainment remains a challenge for the Saskatchewan region means that those most
Indigenous North, with only 3.4% of the capable of acquiring educational certificates are
www.schoolofpublicpolicy.sk.ca | 13Comparative Analysis of the North Saskatchewan and Yukon Indigenous Labour Markets 2006 to 2020
also most capable of relocating to where the Figure 9: Yukon Aboriginal (ABO), 2016 & 2006
jobs are. Many of these jobs are not in the Change over a Decade
north.
HIGHEST
CERTIFICATE, ABO ABO ABO ABO
Comparing Aboriginal educational attainment
DIPLOMA, OR 2016 AS % 2006 AS %
against non-Aboriginal for 2016, does to some DEGREE
extent control for geography and mobility. No certificate,
Clearly, jobs and lifestyle have attracted and diploma, or 1955 31.1% 2280 41.3%
degree
retained non-Aboriginal settlers to the Far Secondary
North. While only some 4055 in number, they (high) school
represent a very different educational profile diploma or 1635 26.0% 1135 20.6%
equivalency
with 24.2% of the settler population having certificate
attained university graduation some 980 in total Apprenticeship
compared to only 730 for the much larger or trades
715 11.4% 645 11.7%
certificate or
Aboriginal population (greater by a factor of diploma
five). In 2016, 70.6% of the Aboriginal College, CEGEP
population 15+ had educational attainment of or other non-
university 1350 21.5% 1050 19.0%
high school or less compared to 38.9% of the
certificate or
settler community, while even in the trades the diploma
settler society outpaced the Aboriginal by University
12.6% to 7.4%. Finally, under College degrees certificate or
125 2.0% 115 2.1%
diploma below
or certificates, that are commonly about job bachelor level
training, 21.3% of settler residents had acquired University
specialist training compared to only 9.2% of certificate,
diploma, or
Aboriginal residents. degree at
505 8.0% 295 5.3%
bachelor level
In Yukon, the Aboriginal community has a much or above
lower percentage of its 15+ population failing to Total
6285 100.0% 5520 100.0%
obtain at least a certificate diploma or degree at Population
Sources: Census of Canada 2016 and 2006,
31.1% compared to a staggering 57.5% in
Saskatchewan Division 18
northern Saskatchewan (Figure 10). Yukon’s
Aboriginal community also scores higher on Finally, education and employment are strongly
Trades’ certificates, on College degrees and on correlated in Northern Saskatchewan as seen in
University completion rates, at 11.4%, 21.5% Figure 11which covers labour force activity
and 8%, suggesting a better educated, and based on three educational attainment
more adaptable workforce. They still lag behind categories: No High School,
the settler society for educational Apprenticeships/Trades, and University
accomplishments, with 30% of Yukon’s 15+ graduates. There is no breakout of Aboriginal,
population having attained a Bachelor level non-Aboriginal here, but the Aboriginal
degree or higher in 2016, meaning that over population is overrepresented in the “No High
50% of the population had College or University School” population and underrepresented in
certificates, diplomas or degrees at 54.1% University graduates. Without belabouring the
compared to 31.5% for Aboriginal Yukon and point, securing employment in the modern
only 14.2% for Aboriginal Far North or the economy is becoming ever more dependent on
Saskatchewan Far North (Figure 10). education. It is important though to alsoPOLICY NORTH (NORTH WEST SASKATCHEWAN POLICY UNIT)
address the extremely high number of people with low educational attainment who are “Not in the
Labour Force.” This means they neither working nor looking for work, many are probably not “work-
ready”. This group is reflected in the dreadfully low participation rate of only 31%, less than half the
rate of those with Trades certificates or diplomas and almost three times lower that the participate rate
for university graduates. This is effectively a disenfranchised population, dependent individuals who are
a strain on the community, forcing the small workforce to spread ever more thinly their earnings to
support them. These are not children. They are the 15+ population and they are ill-educated and poorly
prepared for the modern economy. This is the group which requires immediate support and attention
to reduce poverty. But that is easier said than done. Some workers probably work in the shadow
economy and many have become overly dependent upon welfare; others are suffering from mental
health and addiction issues. The situation for roughly 69% of the Far North labour force is bleak and it is
not helped by low rates of literacy, numeracy, and digital capacity.
Figure 10: Yukon Aboriginal and non-Aboriginal Educational Attainment Compared, 2016
HIGHEST CERTIFICATE, ABORIGINAL AS NON-
ABORIGINAL NON-ABO AS %
DIPLOMA, OR DEGREE % ABORIGINAL
No certificate, diploma, or degree 1955 31.1% 2760 12.2%
Secondary (high) school diploma
1635 26.0% 5195 23.0%
or equivalency certificate
Apprenticeship or trades
715 11.4% 2430 10.7%
certificate or diploma
College, CEGEP or other non-
1350 21.5% 4770 21.1%
university certificate or diploma
University certificate or diploma
125 2.0% 700 3.1%
below bachelor level
University certificate, diploma, or
505 8.0% 6750 29.9%
degree at bachelor level or above
Total Population 6285 100.0% 22605 100.0%
Statistics Canada. 2018. Aboriginal Population Profile. 2016 Census.
Statistics Canada Catalogue no. 98-510-X2016001. Ottawa. Released July 18, 2018.
http://www12.statcan.gc.ca/census-recensement/2016/dp-pd/abpopprof/index.cfm?Lang=E
Figure 11: Far North Employment Prospects – No certificate, diploma or degree, Census 2016
LABOUR FORCE STATUS NO HIGH SCHOOL TRADES UNIVERSITY
Total - Labour force
status 12870 2080 1860
In the labour force 3990 1420 1610
Employed 2435 1135 1545
Unemployed 1560 280 65
Not in the labour force 8875 665 255
Participation rate 31% 68.3% 86.6%
Employment rate 18.9% 54.6% 83.1%
Unemployment rate 39.1% 19.7% 4.0%
Statistics Canada - 2016 Census. Catalogue Number 98-400-X2016365.
www.schoolofpublicpolicy.sk.ca | 15Comparative Analysis of the North Saskatchewan and Yukon Indigenous Labour Markets 2006 to 2020
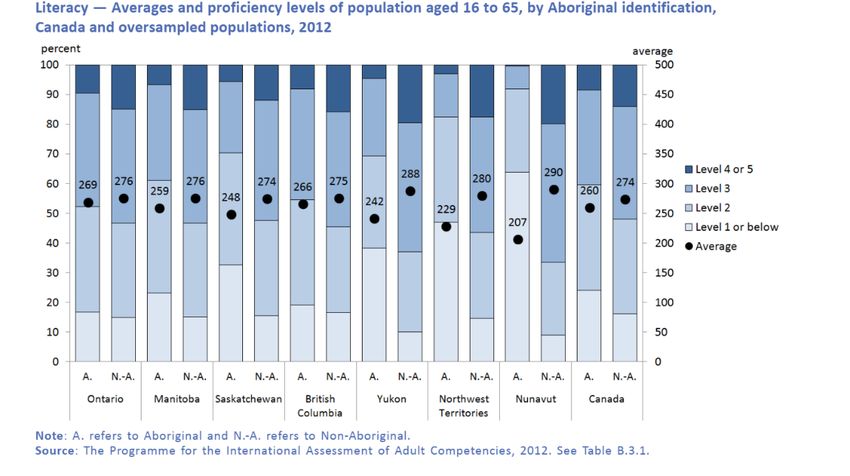
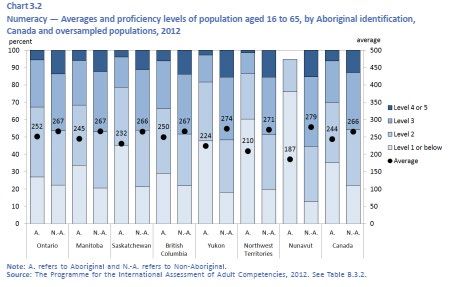
4.2 Literacy, Numeracy and Digital Capacity Numeracy, which we can associate or used as a
proxy for the fast-growing, high demand STEM
PIAAC is the Programme for the International
sector of the economy is again a problematic
Assessment of Adult Competencies, an
indicator for Aboriginal populations. Residents
international assessment of the foundational
scored 232 in Saskatchewan, 224 in Yukon, and
information-processing skills required to
only 210 in NWT. The Canada average was 266,
participate in the social and economic life of
while in non-Aboriginal Yukon the score rose to
advanced economies in the 21st century. PIACC
274. In these three Aboriginal communities, less
data breaks out Aboriginal and non-Aboriginal.
than 10% of the population scored in the Level
Once again, the Aboriginal population
4/5 ranges, which would be professional
demonstrates frighteningly low literacy,
competency. Almost half of Yukon and
numeracy and technology competency scores
Saskatchewan’s Aboriginal populations were
on technology learning or PS-TRE (a composite
effectively numerically challenged, scoring at
score). These scores are related to the ability
level 1 or below. The STEM sector represents
of test subjects to navigate a computer and
people educated in science, technology,
perform various functions related to navigation,
engineering and mathematics and statistics.
writing and numeracy. Canada ranks above the
Presently only 4.7% of Saskatchewan’s STEM
OECD average in PS-TRE. Only Sweden exceeds
educated residents are of Aboriginal origin
Canada in the proportion of its population at
(2,740 of 57,845) but Aboriginal people
the highest level of proficiency. No minority
represent 16.3% of the provincial population.
population in our society should be falling
Of the total Aboriginal educational attainment
behind the core of the population.
population, only 2.3% have studied in the STEM
The author was involved with the PIACC 2012 in sector, or 2,740 of 117,325 people. 7
Yukon and was responsible for the increase in
Figure 12: Composite PIACC Average Scores
sample size for the three Territories which
Northern Saskatchewan, Canada, and the
allowed for individual reporting versus the usual
OECD, 2012
Territories* which had been the standard
methodology, aggregating three very different REGION LITERACY NUMERACY PS-TRE
populations from Nunavut, NWT and Yukon. AVERAGE AVERAGE AVERAGE
SCORE SCORE LEVEL 1 OR
The Yukon results were unexpected when BELOW AND
compared to other Indigenous populations. On NON-
RESPONDENTS
“Literacy,” Yukon Aboriginal scored higher that AS %
Nunavut and NWT at 242 compared to 229 and OECD 273.3 269.4 66.0%
Countries
207, but worse than Saskatchewan Aboriginal at
Canada 273.5 265.5 57.4%
248. The gap between the Aboriginal and non- Yukon 277.2 263.1 64.3%
Aboriginal was higher in Yukon at 46 points than NWT 253.3 239.4 71.7%
in Saskatchewan. However, if the entries for Nunavut 219.1* 200.5* 88.2%
Aboriginal
Saskatoon and Regina were removed, Sask. 248.2 231.6 78.7%
Saskatchewan have a score closer to that for Source: Statistics Canada: Catalogue no. 89-555-X ISBN 978-1-100-22678-
1 Skills in Canada: First Results from the Programme for the International
Yukon and NWT for the Indigenous portion of Assessment of Adult Competencies (PIAAC) Skills in Canada: First Results
the province (Figure 12). from the Programme for the International Assessment of Adult
Competencies (PIAAC). *Lowest scores in OECD PIACC Test, 2012
7
Statistics Canada - 2016 Census. Catalogue Number 98-
400-X2016263.POLICY NORTH (NORTH WEST SASKATCHEWAN POLICY UNIT)
Figure 13: PIAAC Reference Material
In Saskatchewan, 32.6% of the ‘Aboriginal’ Population are operating at Level 1 - or below. For non-
aboriginal Canada, the Level 1 population represented 16.2% in 2012 (Figure 13).
What does this mean?
PIAAC Level 1 individuals have skills that enable them to undertake tasks of only a limited complexity,
such as locating single pieces of information in short texts in the absence of other distracting
information. Those jobs categorized as “below Level 1,” do not command these skills. They
demonstrate only basic vocabulary but also the ability to read brief texts on familiar topics to locate a
single piece of specific information. The situation is even more problematic on numeracy with Level 1 or
below standing at 45.2% of the Aboriginal population (Canada non-aboriginal equals 22.1%), which
means that they do not have the skills to perform simple mathematical operations involving a single
step, such as counting or ordering. Those categorized as “below Level 1,” means they can cope with
simple tasks placed in concrete, familiar contexts where the mathematical content is explicit and
requires only simple processes. What does this mean for the economy? Bluntly, it means that the
existing labour body is ill-prepared for changing workforce demands, and that the educational gap is
probably widening not narrowing.
If the future of Canada’s economy is to be based, if not dependent upon, STEM graduates, the Aboriginal
North will essentially not be participating.
The link between Education and Employment is further supported when Participation Rates (PR) are
reviewed. The PR for people with no formal educational attainment is depressingly low, at only 31%, or
31 percentage points below those that hold at least a High School certificate. Meanwhile, Indigenous
www.schoolofpublicpolicy.sk.ca | 17Comparative Analysis of the North Saskatchewan and Yukon Indigenous Labour Markets 2006 to 2020
people who hold a trade’s certificate in Far North have a PR of 68.3%. Participation continues to climb
with educational attainment to 87.4% for university graduates in the North (Figure 14).
Figure 14: PIAAC Reference Material 2
4.3 Education and Income Briefly Correlated settler community fails to exceed. The graph
also includes data points for Far North
Figure 15 demonstrates how Indigenous and
Aboriginal and non-Aboriginal and for Yukon
settler communities have significantly different
Aboriginal and non-Aboriginal. The Far North
outcomes in both educational attainment and
Aboriginal community has a low average
employment income. This correlation uses the
income of only $20,101 associated with an
“2015 Median Employment Income” from the
extremely high percentage (57%) of the
Census of Canada 2016, to differentiate income
population not having graduated from, high
levels between two randomly selected groups
school. This is less so the case with the Yukon
of Saskatchewan communities: 20 First Nation
Aboriginal population where the educational
communities and 20 settler communities. The
attainment levels are higher, and income rises
correlation uses smaller scale settler
to above $30,000 not unlike the “lower-
communities to better compare with the
income” settler communities. The small settler
usually, small First Nation settlements (X axis).
society population in Far North is both better
Secondly, on the Y-axis is plotted - Educational
educated with only 16% not having completed
Attainment of each community based on the
high school and has a much higher average
percentage of the population 15+ years of age
employment income of $52,563.
that had not graduated high school as of 2016.
The correlation has a definitive break point at Employed Indigenous people on average
around $25,000, which no Saskatchewan First (community value) barely make $20,000
Nation community crosses and for which no annually. The range for ‘% of Education LessPOLICY NORTH (NORTH WEST SASKATCHEWAN POLICY UNIT)
than High School’ or low educational similarly poorly educated people being paid
attainment is dramatic in these communities. different wages.
The range is from a low of 23% to a high of 70%.
Indigenous communities fare worse than their
This range of 47 percentage points is in sharp
settler counterparts. Settler communities in
contrast from the range within settler
Saskatchewan are wealthier and appear to have
communities which is only 19 percentage
better paying employment opportunities
points. Even if ignoring the 70% outlier, the
compared with Saskatchewan’s Indigenous
Indigenous community range would still be 26
communities, even when controlling for poor
percentage points worse than settler
educational outcomes. One northern
communities.
community, describing itself as being at the
The next point to highlight is the income “breaking point,” said that they had been
difference between similarly educated starved for money for 30 years. Many homes
communities. There is a clear grouping of were in disrepair and overcrowding was
indigenous and settler communities along the endemic. Mortality rates stood well above
employment axis. Interestingly, indigenous national norms, and members had limited
communities that have less than or equal to access to standard health care. Mental health
education rates earn a few thousand dollars less supports were limited or non-existent, cultural
than their comparable settler communities. This and tradition activities had stalled, many
could indicate that settler communities have families lacked reliable access to food, talented
stronger economic opportunities within or students struggled to get beyond high school,
nearby, while Indigenous communities have job and business opportunities were sparse,
lower paying opportunities. It also could and overall services stood well below provincial
indicate industries are stronger and wealthier in norms. The numbers are disturbing, but much
settler communities than Indigenous less so than the painful reality of poverty and
settlements, leading to similar jobs earning less marginalization.
in Indigenous communities. This is evidence of
Figure 15: Saskatchewan Education and Employment Income Regression with Yukon and CD-18
Added, 2016
80%
% of Education Less than High School
70%
Indigenous Communities
60%
Settler Communities
Linear (Indigenous Communities)
50%
CD-18 Abo Linear (Settler Communities)
40%
30% Yukon Abo
20%
CD-18 non-Abo
10%
Yukon non-Abo
0%
$- $10,000 $20,000 $30,000 $40,000 $50,000 $60,000
Median Employment Income
www.schoolofpublicpolicy.sk.ca | 19Comparative Analysis of the North Saskatchewan and Yukon Indigenous Labour Markets 2006 to 2020
risk takers, and generally have an element of
5. SELF-EMPLOYMENT AND professional qualification that lends itself to
ENTREPRENEURSHIP investing time and expertise into the
development of a new concept and company.
There are currently no publicly accessible and Many of the self-employed captured here, are
comprehensive databases for Aboriginal people running small firms from farms through
business activity in Canada which are as to the building trades and mechanical services,
inclusive and yet are divisible into multiple not future Bill Gates necessarily.
metrics as the Census data available from
Statistics Canada (Finnegan & Djokic 2017). The 2011 National Household Survey (which
However. Aboriginal definers exist throughout unsuccessfully replaced the long-form census in
the Statistics Canada universe including their 2011) reported that 4.7% of all First Nation
business survey data, which could be accessed workers were self-employed. The rate of self-
through special data linkage services by employment for Saskatchewan Aboriginal
Statistics Canada staff. The Custom Data workers was 6.1% in 2016 compared to 15.8%
Tabulation acquired allow one to look at for non-Aboriginal, people while non-Aboriginal
Aboriginal and non-Aboriginal Canadians under self-employed workers represented 95.6% of all
the workforce definitions of Self-employed and those self-employed. Figure 16 shows that this
Employee at the national level, at the regional dropped to only 2.2% when focused on just First
level and, where population allows, at the Nation self-employment, having removed the
provincial and territorial levels of geography. Métis element. If the private sector is expected
Self-employment is used here as a proxy for to lead the charge in job creation and wealth
entrepreneurship; it is an uneasy marriage of growth, then there is little chance that
concepts. Entrepreneurs are usually much more Aboriginal entrepreneurs will be leading the
than just self-employed: they are innovators, charge.
Figure 16: Rate of Self-employed First Nations and Non-Aboriginal Ancestry Workers in Canada and
Regions (from age 15 years and above)
8.4%
3.2%
5.1%
3.7%
7.0%
6.0%
7.2%
4.8%
7.8%
2.2%
11.3%
2.2%
9.2%
5.1%
9.2%
5.8%
7.6%
4.7%
0.0% 2.0% 4.0% 6.0% 8.0% 10.0% 12.0%
Non-Aboriginal Self-Employed Rate First Nations Self-Employeed RatePOLICY NORTH (NORTH WEST SASKATCHEWAN POLICY UNIT)
As shown above, Saskatchewan with its historical small farm business sector leads the nation in self-
employment at 11.3%.
Figure 17: Comparison of First Nation Ancestry, Self-employed workers to non-Aboriginal Self-
employed workers, Saskatchewan, 2011
50.0% 45.5%
45.0%
40.0%
35.0%
30.0% 24.9% 26.3%
25.0%
20.0% 16.1%
14.9% 14.7%
15.0%
7.7% 4.2% 7.8%4.7% 4.8% 9.0% 8.4% 5.7%
10.0% 6.9% 2.8%
3.8% 4.8% 5.4% 0.0%
5.0% 1.2% 0.0%
0.0%
Self-Employed First Nations (NAI) Ancestry Self-employed non-Aboriginal ancestry only
In Saskatchewan, First Nation ancestry (FNA) have made inroads to this higher paying sector
self-employed workers are highly of the economy. FNA self-employed workers in
underrepresented compared to the size of the Saskatchewan have also made inroads into
non-Aboriginal self-employed workforce (Figure other well-paying sectors such as education,
17). This is the greatest disparity in Canada at law and government and community services –
the provincial level. Once again, FNA self- representing 7.8% of the labour force compared
employment is underrepresented in to 4.7% for non-Aboriginal workers. 8
management occupations at 24.9% compared
to 45.5% for non-Aboriginal workers and
6. SEPH DATA AND CENSUS HOUSEHOLD
overrepresented in trades and transportation,
INCOME
sales and services, and resources occupational
sectors, which are all considered lower paying
Saskatchewan First Nations are currently
fields of employment. While health only
underfunded, and their staff are some of the
represents 4.8% of the FNA self-employed
lowest paid in Canada, by whatever metric
population, they are overrepresented
used. That said, they are currently fighting to
compared to the non-Aboriginal labour force,
safeguard their communities and their families,
suggesting that FNA self-employed workers
working long hours in uncertain and perhaps
8 Population Aged 15 Years and Over in Private Households of
Source: CRO0156912_CT.1 (2011): Aboriginal Identity (11), Area
of Residence (3), Highest Certificate, Diploma or Degree (10), Class Canada, Provinces and Territories, and of Selected Regions, 2011,
of worker (5), Selected Characteristics (204) and Adjusted Base for National Household Survey
Incompletely Enumerated Reserves 2006-2011 (2) for the
www.schoolofpublicpolicy.sk.ca | 21You can also read