REGION 3 RPA - Northwest Iowa Planning & Development ...
←
→
Page content transcription
If your browser does not render page correctly, please read the page content below
REGION 3 RPA
           Northwest Iowa Planning
             and Development
                Commission

                2021-2025 Passenger
                 Transportation Plan
                      Prepared by

                      Northwest Iowa Planning &
                      Development Commission
                      Spencer, Iowa

RPA 3 PTP 2021-2025                               i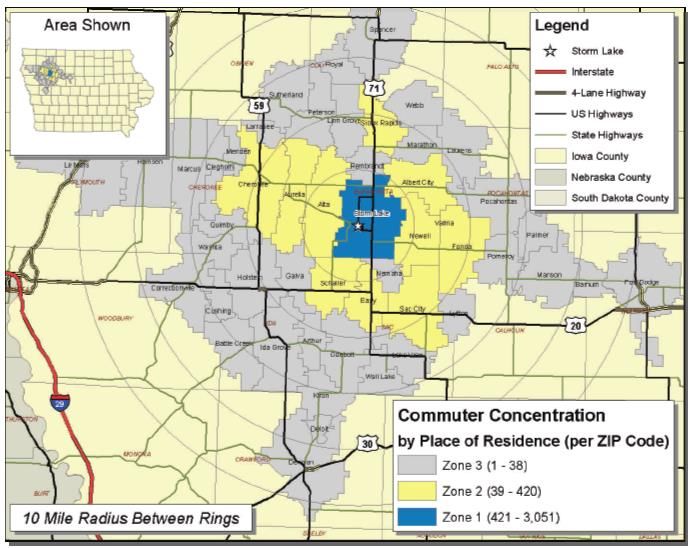
Table of Contents
Northwest Iowa Planning and Development Commission Technical Committee ...................................... 1
Transportation Advisory Group ................................................................................................................. 2
Northwest Iowa Planning and Development Commission-RPA 3 Staff ...................................................... 2
Chapter 1: Introduction and Process ......................................................................................................... 3
   Planning Partners ...................................................................................................................................... 6
   Goals for the PTP Identified by the TAG Group: ....................................................................................... 7
Chapter 2: Inventory and Area Profile ....................................................................................................... 8
   Inventory ................................................................................................................................................... 8
   RTA/RIDES ................................................................................................................................................. 8
      Table 1: Fleet Utilization Analysis ....................................................................................................... 10
   School Districts ........................................................................................................................................ 14
      Table 2: Annual Transportation Data for Iowa Public Schools............................................................ 16
      Table 3: School District Vehicle Count and Number of ADA School Buses ......................................... 18
   St. Luke’s Lutheran Home ....................................................................................................................... 19
   Village Northwest.................................................................................................................................... 19
   Hope Haven ............................................................................................................................................. 19
   ECHO Plus (Now under the umbrella services of Hope Haven) .............................................................. 20
   Imagine the Possibilities ......................................................................................................................... 20
   Spencer Cab Company ............................................................................................................................ 20
   Storm Lake Cab Company ....................................................................................................................... 21
   Map of Location of Medical Services in NWIPDC Region ....................................................................... 22
   Map Location of Essential Community Facilities in NWIPDC Region ...................................................... 23
   Area Profile ............................................................................................................................................. 24
   Population Characteristics ...................................................................................................................... 24
   Age Distribution ...................................................................................................................................... 27
      Table 4: Population by Age Group and Percentage of the Total Population ...................................... 28
      Table 5: Median Age by County .......................................................................................................... 29
      Table 6: Percentage of Population Over Age 65 ................................................................................. 29
      Table 7: Disability Status Percentage Breakdown by County in RPA 3 ............................................... 30
   Employment ............................................................................................................................................ 30
      Table 8: Employment by Industry for Buena Vista County ................................................................. 30
      Table 9: Employment by Industry for Clay County ............................................................................. 31

RPA 3 PTP 2021-2025                                                                                                                                          ii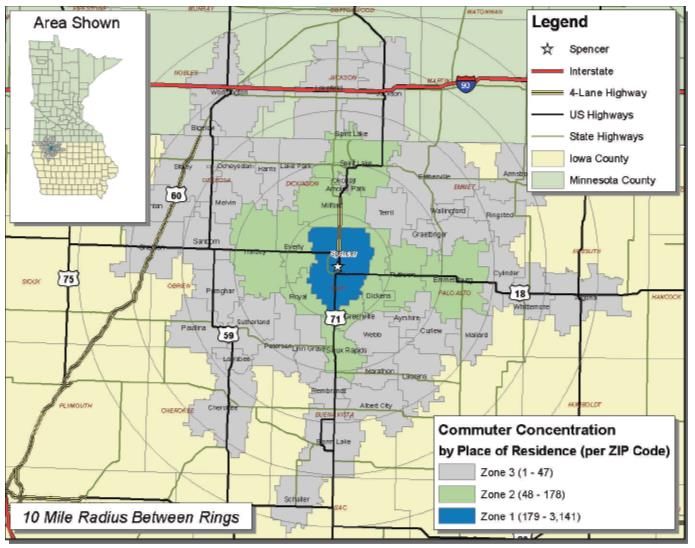
Table 10: Employment by Industry for Dickinson County .................................................................. 32
       Table 11: Employment by Industry for Emmet County ...................................................................... 32
       Table 12: Employment by Industry for Lyon County .......................................................................... 33
       Table 13: Employment by Industry for O’Brien County ...................................................................... 34
       Table 14: Employment by Industry for Osceola County ..................................................................... 34
       Table 15: Employment by Industry for Palo Alto County ................................................................... 35
       Table 16: Employment by Industry for Sioux County ......................................................................... 36
   Limited English Proficiency Analysis ....................................................................................................... 47
       Table 17: Language Spoken at Home .................................................................................................. 47
       Table 18: Languages Spoken ............................................................................................................... 48
Chapter 3: Coordination Issues ................................................................................................................ 50
   Service Needs .......................................................................................................................................... 50
   Management Needs................................................................................................................................ 51
   Fleet Needs ............................................................................................................................................. 51
   Facility Needs .......................................................................................................................................... 52
   Previously Recommended Priorities/Projects ........................................................................................ 52
   Review of Public Input ............................................................................................................................ 54
Chapter 4: Priorities and Strategies ......................................................................................................... 55
   Strategies ................................................................................................................................................ 55
Chapter 5: Funding................................................................................................................................... 58
   State Transit Assistance .......................................................................................................................... 58
   Statewide Planning Program (Section 5303, 5304, 5305) ...................................................................... 59
   Non-urbanized Area Formula Program (Section 5311) .......................................................................... 59
   Transit Capital Program (Section 5339) .................................................................................................. 59
   State of Good Repair (Section 5337).......................................................... Error! Bookmark not defined.
   Iowa Clean Air Attainment Program (ICAAP) .......................................................................................... 60
   Surface Transportation Projects (STBP) .................................................................................................. 60
   State Transit Assistance (STA) ................................................................................................................. 61
   STA Special Projects ................................................................................................................................ 61
   Public Transit Infrastructure Grants........................................................................................................ 61
   Local Funding .......................................................................................................................................... 61
Appendix A: Health and Human Service Agency Survey ............................................................................ 63
Appendix B-TAG Meeting Minutes .......................................................................................................... 65

RPA 3 PTP 2021-2025                                                                                                                                         iii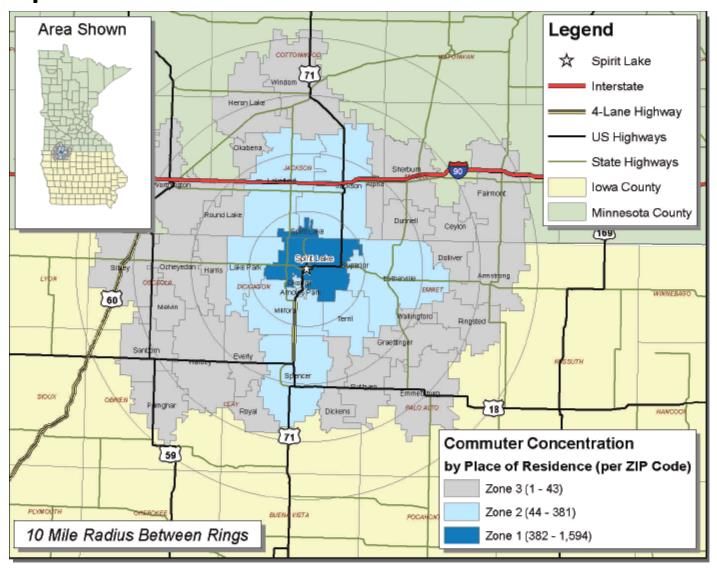
Northwest Iowa Planning and Development Commission Policy Council

Buena Vista County                             Jordan Kordahl (City)
Kelly Snyder (County)                          Steve Simons (Econ. Dev.)
Keri Navratil (City)
Dale Arends (At Large)                         O'Brien County
                                               John Steensma (County)
Clay County                                    Jim Zeutenhorst (City)
Art Hamrick (County)                           Marjean Westerman (Econ. Dev.)
George Moriarty (City)
Kristi Gross (Econ. Dev.)                      Osceola County
                                               Mike Schulte (County)
Emmet County                                   Glenn Anderson (City)
Tim Schumacher (County)-Board Vice             Stephanie Neppl (Econ. Dev)
Chair
Penny Clayton (City)-Board Chair               Palo Alto County
                                               Roger Faulstick (County)
Dickinson County
W.C. Leupold (County)                          Sioux County
Ron Walker (City)                              Al Bloemendaal (County)
Clark Reekers (Econ. Dev.)                     Duane Feekes (City)
                                               Don Schreur (Econ. Dev.)
Lyon County
Merle Koedam (County)

 Northwest Iowa Planning and Development Commission Technical Committee

Bret Wilkinson, Buena Vista County             Scott Rinehart, O'Brien County Engineer
Engineer                                       Sam Kooiker, Sheldon City Administrator
Keri Navratil, Storm Lake City Administrator   Duane Feekes, Orange City City
William Rabenberg, Clay County Engineer        Administrator
Mark White, Spencer Public Works Director      Charlie Bechtold, Osceola County Engineer
Dan Eckert, Dickinson County Engineer          Glenn Anderson, Sibley City Manager
Gregg Owens, Spirit Lake City Administrator    Walter Davis-Oath, Palo Alto County
Walter Davis-Oath,Emmett County                Engineer
Engineer                                       Kim Kibbie, Emmetsburg Public Works
Penny Clayton, Estherville City                Director
Administrator                                  Doug Julius, Sioux County Engineer
Laura Sievers, Lyon County Engineer            Murray Hulstein, Sioux Center Public Works
Jordan Kordahl, Rock Rapids City               Director
Administrator                                  Hugh Lively, RIDES Director

RPA 3 PTP 2021-2025                                                                    1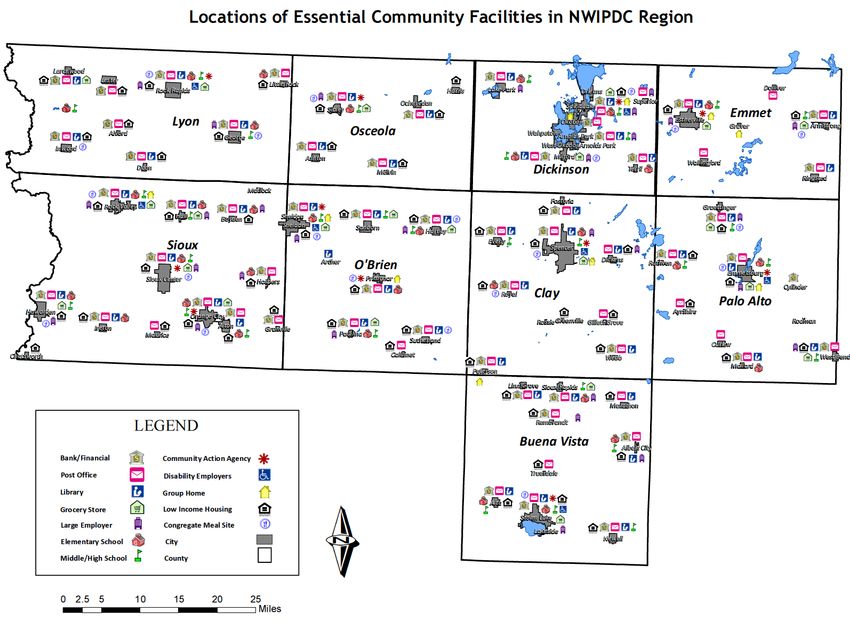
Transportation Advisory Group

Michaela Boyd, Sunshine Services              Dawn Mentzer, Buena Vista County CPC
Sandy Pingle, Genesis                         Kim Wilson, Clay County CPC
Ron Askland, Horizons Unlimited               Shane Walter, Sioux County CPC
Roger Kempema, Hope Haven                     David Adoplph-Taxiway
LeAnn Blau, Hope haven                        Bonnie Taggert, Storm Lake Cab
Jerry Postma, Village Northwest               Hugh Lively, RIDES Executive Director
Nancy Dykstra, Greater Sioux

       Northwest Iowa Planning and Development Commission-RPA 3 Staff

Executive Director-Ted Kourousis              Cara Elbert
                                              Erin Pingel
Finance Officer/Administrative-Jackie         Kristin Larsen (Housing)
Huckfelt
                                              Training Director-Val Bonney
SHIELD Safety Director-Michael Raner
                                              Employment & Training Specialists
Planners
                                              Staci Kleinhesselink
Darren Bumgarner

RPA 3 PTP 2021-2025                                                                   2
Chapter 1: Introduction and Process

The Northwest Iowa Planning and Development Commission is the transportation planning
authority for Buena Vista, Clay, Dickinson, Emmet, Lyon, O'Brien, Osceola, Palo Alto and Sioux
Counties in northwest Iowa. NWIPDC was formed by a 28E agreement in 1973 as designated in
the Iowa Code and whose mission is to provide community and economic development and job
training services for a nine-county area. The agency's full time, professional staff assists the
member counties and municipalities in such areas as community planning and zoning, federal
and state grant preparation and administration, economic development planning activities,
general governmental technical assistance, Workforce Investment Act/Workforce Development
and a SHIELD safety program. In effect, the NWIPDC staff functions as an extension of member
governments' staffs, providing the specialized services and technical assistance that would not
be financially feasible for each governmental entity to provide on its own.

The Passenger Transportation Plan (PTP) process is designed to promote joint, coordinated
passenger transportation planning programs that further the development of the local and
regional public transportation systems. Public transportation systems in Iowa include the 35
public transit systems PLUS a wide array of human service and private transportation providers.

The goals are:
   •   Improve transportation services to Iowans
   •   Increase passenger transportation coordination
   •   Create awareness of unmet needs
   •   Develop new working partnerships
   •   Assist decision-makers, advocates, and consumers in understanding the range of
       transportation options available
   •   Develop justification for future passenger transportation investments
   •   Save dollars and eliminate overlapping of services

RPA 3 PTP 2021-2025                                                                          3
The PTPs are an Iowa creation, providing needs-based justification for passenger transportation
projects and as well as incorporating federal requirements for coordinated planning. The PTP will
cover a five-year period, from 2021 to 2025, and provide further justification for passenger
transportation projects. The format of the PTP is as follows:

    1. Introduction and Process Discussion
Briefly, discuss the process that was undertaken to complete the PTP. Include documentation
from advisory group meetings and related public input, including a summary of input received
and a listing of all participants.

    2. Inventory and Area Profile
Include a discussion of the existing passenger transportation operations (human service
providers, private providers, school districts, and public transit systems) within the planning area.
This information needs to be gathered from all providers of public and human service
transportation, using the most effective means of communicating with these agencies. Also
includes discussion of the demographic (socio/economic) characteristics within your area, and
specifically how these characteristics directly impact your passenger transportation needs
assessment. Include an analysis of the region’s limited English proficient (LEP) population, i.e.
concentrated areas where LEP persons live, work, attend school, etc. Identify the LEP
population’s needs to ensure meaningful access to passenger transportation programs and
activities. Examples of needs include printing of schedules and brochures in languages other than
English, providing an interpreter at public hearings or public input meetings, or hiring a bi-lingual
dispatcher to assist with ride scheduling. Describe the layout of the study area including activity
centers such as employers, banks, health care facilities, groceries, etc. and population’s access to
services and how this impacts transportation needs.

    3. Coordination Issues
Discuss coordination issues within your planning area. This discussion should consider:
            •   General assessment of service, management, fleet, and facility needs

RPA 3 PTP 2021-2025                                                                               4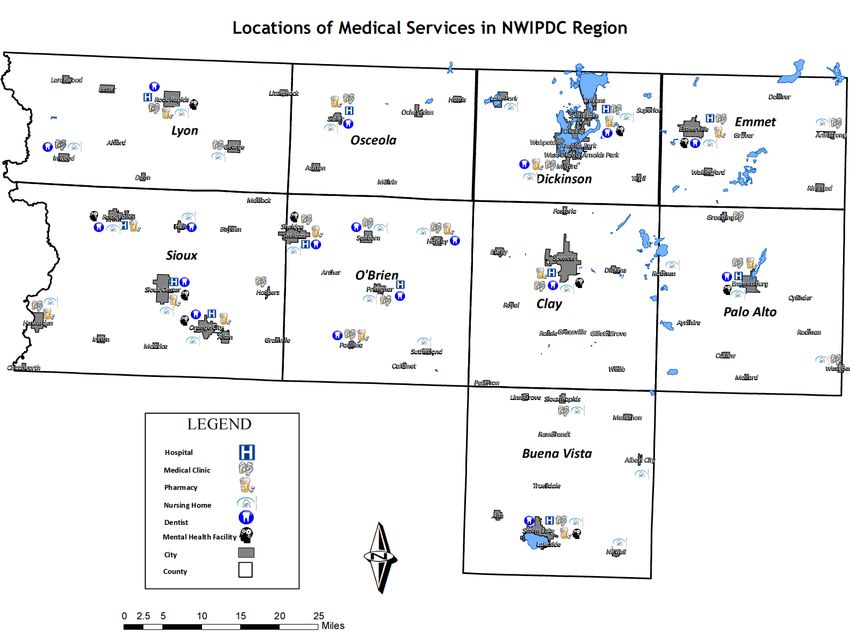
•    Status of previously recommended priorities and strategies
           •    Any other recent developments affecting coordination issues
           •    Public input received concerning needs and/or coordination issues

   4. Priorities and Strategies
Describe proposed passenger transportation investment strategies for the next five years, as
identified by the TAG. The purpose of this section is to focus on identifying meaningful priorities
and strategies that could meet identified needs and could eventually lead to projects.

If your area receives Section 5310 formula grants (Enhanced Mobility for Seniors and Individuals
with Disabilities): In addition to identifying priorities and strategies, all 5310-funded projects
must be specifically included in the PTP. Projects that are included should specify the federal
fiscal year and estimated amount of funding for which the project is programmed. Please include
projects for all five fiscal years that the plan covers and which issue/strategy these projects will
help address.

   5. Funding
This section should include a brief overview of funding opportunities and expectations. The Iowa
DOT will provide state and federal financial projections for formula funds annually as they are
provided by Federal Transit Administration (FTA).

Amendments to the PTP
For areas receiving Section 5310 formula grants, any change in the proposed 5310-funded
projects will require an amendment to the PTP. The amendment should be reviewed with the
TAG and follow the public input process outlined in the agency’s Public Participation Plan. RPA 3
does not receive 5310 grant funding and this area will not be addressed as part of the passenger
transportation plan.

RPA 3 PTP 2021-2025                                                                              5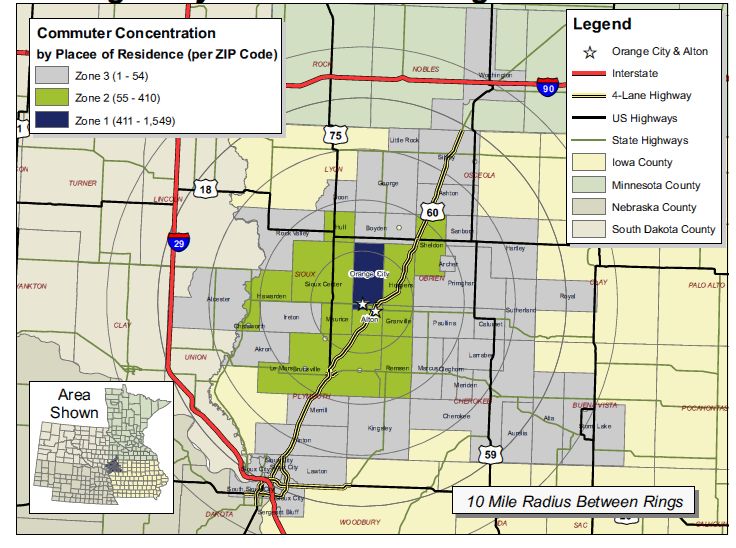
Planning Partners

The Region 3 RPA – Northwest Iowa Planning and Development Commission and the Regional
Transit Authority/aka RIDES, along with the Region 3 Transit Advisory Group (TAG) were the
primary partners on the development of the 2016-2020 Region 3 PTP.

The Northwest Iowa Planning and Development Commission (Region 3) is the regional planning
authority (RPA) for Lyon, Sioux, Osceola, O’Brien, Dickinson, Clay, Buena Vista, Emmet and Palo
Alto Counties in extreme northwest Iowa.

The Regional Transit Authority is the single administrative agency (private non-profit) for public
transportation in the region. The RTA policy board consists of ten members, one representative
from each of the nine county boards of supervisors and one ex-officio member from Northwest
Iowa Planning and Development Commission. The county board representatives to the policy
committee are selected by each of the nine county boards of supervisors.

The RTA administrative office is located in Spencer, Iowa. RTA provides the majority of its
services directly. In several instances RTA does contract for some services by leasing vehicles to
cities or agencies for general transportation within their communities. These services are strictly
contractual, with each of the providers supplying drivers and paying operating and maintenance
expenses. RTA retains policy control over use of the leased vehicles.

The RTA has become responsible for the administration and overhead support services for the
overall regional transit system with the designation by the Boards of Supervisors as the Regional
Transit provider. This consolidation of transit services into one agency has been mutually agreed
upon by the nine county boards of supervisors.

The Transit Advisory Group (TAG) is a volunteer group representing local municipalities, county
government, health and human service agencies, private/public transportation providers, school
districts, health care and private industry. The group is an integral part of the overall planning

RPA 3 PTP 2021-2025                                                                             6
process because from within their ranks comes the majority of the information used to formulate
needs, identify gaps in transportation service and develop goals or programs to address the gaps.
The final task for the TAG is to recommend the final draft of the PTP to the regional policy council
for adoption.

During this planning process the TAG met four (4) times: 4-15-19, 6-24-19 , 8-29-19 and 6-26-20.
The specifics of the meetings and minutes of each are attached to this document, however the
culmination has been summarized and is found listed below as the goals.

Goals for the PTP Identified by the TAG Group:

   •   Expand scope of service for elderly, particularly low-income that can’t afford
       transportation. Elderbridge was adamant that these services continue as they are just
       now seeing the effects of the poor economy on this age group within Region III. Regional
       Transportation Authority (RIDES) RIDES will not be able to meet their contractual
       obligations due to Elderbridge’s because of a lack of funding at the State level.
   •   Continue with services that assist passenger transportation to health centers, shopping
       trips, etc. These services are ongoing and need to potentially expand where possible.
   •   Need for continued government subsidy of transportation programs. This goal is always
       an issue with the TAG group and will continue to be so. With government programs being
       ever changing, continue to seek new funding options for operations and vehicle
       replacement for RIDES.
   •   Potentially add new public transportation services. Continue to adapt with the changing
       transit needs. Work with other agencies and disability providers in Region III to determine
       what the needs are and investigate expanding services and keep them involved in the
       planning process. This process will also include expanding employment transportation.

RPA 3 PTP 2021-2025                                                                              7
Chapter 2: Inventory and Area Profile Inventory Northwest Iowa Planning and Development Commission mailed out information sheets to all known providers within the region. Unfortunately, there was no feedback from school districts or county veteran departments. For their inventory, previous data was used and assumed to be current. Providers such as the Regional Transit Authority/RIDES, several health and human service agencies and cab companies did reply with inventory information to be included in this PTP. The following is the information which was obtained from providers within the Region 3 RPA. All information that was available and provided is written in the plan. RTA/RIDES RIDES is the main public transportation provider in Region 3. They provide fixed route, and demand responsive service programs to individuals. The type of transit service offered by the RTA is a demand-response or subscription service, meaning that rides must be scheduled by contacting the provider in advance of the needed ride. RIDES, like all other demand responsive services, offers door to door services and is flexible with scheduling to meet the needs of its riders. RIDES provides general transportation services as well as special medical trips. Like many rural regional transit providers, RIDES has seen the change in the primary use of its vehicles from nearly all elderly service in the late 1970’s to a key component in the everyday movement of people from schools, day cares, sheltered workshops, hospitals, nursing homes, shuttle services and other general public rides. RIDES hours of operation vary depending on the service being provided, but some of RIDES programs are available 24 hours a day, 7 days a week. Listed below is the fare structure for the different areas RIDES serves. RPA 3 PTP 2021-2025 8
Buena Vista County- Storm Lake-$4.00
Clay County-          Spencer-$4.00

Dickinson County-     Spirit Lake-$2.50
                      Okoboji-$2.50
                      Arnolds Park-$2.50
                      Milford-$2.50

Emmet County-         Estherville-$2.50

Lyon County-          Rock Rapids-$3.00

O’Brien County-       Sheldon-$3.00

Osceola County-      Sibley-$1.50

Palo Alto County-    Emmetsburg-$2.50

Sioux County-        Orange City-$1.00
                    Sioux Center-$3.00
                    Hawarden-$2.00

In 2019, RIDES provided a total of 201,955 trips generated from contracts and services to the
general public. Elderly RTA comprised 19,166 of the total and 52,072 disabled individuals were
figured into the total as well. The total vehicle miles for the nine county operations were
1,229,874 with 1,011,307 revenue miles and 83,673 revenue hours. Total operating costs were
$3,764,802 for the year.         Passenger revenue comprised $698,420, contract revenue for
operations was $1,877,782, other revenue for operations was $313,185, $162,500 local funds
and $34,350 in local capital revenue. FTA for operations was $666,160 and STA for operations
was $456,450. The following table provides the listing of the Regional Transit Authority’s Fleet
Utilization Analysis for 2019.

RPA 3 PTP 2021-2025                                                                          9
Table 1: Fleet Utilization Analysis
Transportation Provider: Regional Transit Authority-RIDES January 2015
Vehicle
Vehicle: Base What type of
No. of Hours Is it Used Equipment
Model Year/Body No. of Seats/ Location service is it Mileage as of Year for
Fleet Per Week Evg/Wkn (see codes
Manufacturer and # of veh. Wheelchairs (Where is it performing? 12-2019 Replacement
ID Used d? below)
Model housed?)
2009 Ford Eldorado
0901 1 158089
E450 Aerotech 176” 18 / 3 Clay Demand-Response Varies Y L; MR; MDT; SC 2020
2009 Ford Eldorado
0902 2 18 / 3 Clay Demand-Response Varies L; MR; MDT; SC 154785
E450 Aerotech 176” Y 2021
2010 Eldorado L; MR; MTD; SC
0903 3 14 / 4 Clay Demand-Response Varies Y 144836 2020
Aerotech 158”
2010 Eldorado L; MR; MTD; SC
0905 4 14 / 4 Clay Demand-Response Varies Y 143269 2021
Aerotech 158”
2010 Eldorado L; MR; MTD; SC
0906 5 14 / 4 Clay Varies Y 180310 2021
Aerotech 158” Demand-Response
2010 Eldorado L; MR; MTD; SC
0907 6 14 / 4 Clay Demand-Response Varies Y 149517 2020
Aerotech 158”
2010 Dodge R; MR; MTD; SC
0908 7 5 / 2 Clay Demand-Response Varies Y 154470 2019
Caravan
2010 Dodge R; MR; MTD; SC
0909 8 5 / 2 Clay Demand-Response Varies Y 190427 2018
Caravan
2010 Dodge R; MR; MTD; SC
0910 9 5 / 2 Clay Demand-Response Varies Y 165735 2019
Caravan
2010 Dodge R; MR; MTD; SC
0911 10 5 / 2 Clay Varies Y 170164 2018
Caravan Demand-Response
2010 Dodge R; MR; MTD; SC
0912 11 5 / 2 Clay Demand-Response Varies Y 142548 2019
Caravan
2010 Dodge R; MR; MTD; SC
0913 12 5 / 2 Clay Demand-Response Varies Y 161044 2019
Caravan
2010 Ford Eldorado L; MR; MDT; SC
0914 13 18 / 3 Clay Demand-Response Varies Y 175326 2019
E450/Aerotech 176”
2010 Ford Eldorado L; MR; MDT; SC
0915 14 18 / 3 Clay Demand-Response Varies Y 127702 2022
E450/Aerotech 176”
2010 Ford Eldorado L; MR; MDT; SC
0916 15 18 / 3 Clay Varies Y 152715 2020
E450/Aerotech 176” Demand-Response
RPA 3 PTP 2021-2025 102010 Ford Eldorado L; MR; MDT; SC
0917 16 18 / 3 Clay Demand-Response Varies Y 153691 2022
E450/Aerotech 176”
2010 Ford Eldorado L; MR; MDT; SC
0918 17 8 / 3 Clay Demand-Response Varies Y 141932 2020
Aerotech 138”
2010 Ford Eldorado L; MR; MDT; SC
0919 18 8 / 3 Clay Demand-Response Varies Y 154658 2021
Aerotech 138”
2010 Ford Eldorado L; MR; MDT; SC
0920 19 8 / 3 Clay Demand-Response Varies Y 169863 2019
Aerotech 138”
2010 Ford Eldorado L; MR; MDT; SC
0921 20 8 / 3 Clay Varies Y 148761 2020
Aerotech 138” Demand-Response
L; MR; MDT; SC
2010 Ford Aero 138” 0922 21 8 / 3 Clay Demand-Response Varies Y 169850 2020
2010 Ford Eldorado L; MR; MDT; SC
0923 22 8 / 3 Clay Demand-Response Varies Y 170044 2019
Aerotech 138”
2010 Ford Eldorado L; MR; MDT; SC
0924 23 16 / 2 Clay Demand-Response Varies Y 171425 2021
Aerotech 158”
2010 Ford Eldorado L; MR; MDT; SC
0925 24 16 / 2 Clay Demand-Response Varies Y 146241 2021
Aerotech 158”
2010 Ford Eldorado L; MR; MDT; SC
0926 25 16 / 2 Clay Varies Y 141877 2022
Aerotech 158” Demand-Response
2010 Ford Eldorado L; MR; MDT; SC
0927 26 16 / 2 Clay Demand-Response Varies Y 148118 2020
Aerotech 158”
2010 Ford Eldorado L; MR; MDT; SC
0928 27 16 / 2 Clay Demand-Response Varies Y 162121 2021
Aerotech 158”
2010 Ford Eldorado L; MR; MDT; SC
0929 28 16 / 2 Clay Demand-Response Varies Y 161734 2021
Aerotech 158”
2010 Ford Eldorado L; MR; MDT; SC
0930 29 16 / 2 Clay Demand-Response Varies Y 135428 2020
Aerotech 158”
2010 Ford Eldorado L; MR; MDT; SC
0931 30 16 / 2 Clay Varies Y 131329 2022
Aerotech 158” Demand-Response
2010 Ford Eldorado L; MR; MDT; SC
0932 31 18 / 3 Clay Demand-Response Varies Y 143102 2021
E450/Aerotech 176”
2007 Ford El Dorado Clay L; MR; MDT; SC
1041 32 Demand-Response Varies 180042 2018
176 22 / 4 Y
2012 Dodge Grand R; MR; MTD; SC
1201 33 5 / 2 Clay Demand-Response Varies Y 141214 2022
Caravan MV
2015 Dodge Grand R; MR; MTD; SC
1501 34 5 / 2 Clay Demand-Response Varies Y 86245 2023
Caravan SE
2016 Ram Pro-Master
1602 35 9 / 3 Clay Demand-Response Varies Y R; MR; MDT; SC 74472 2023
2500
RPA 3 PTP 2021-2025 112017 Braun 1700 36 5 / 2 Clay Demand-Response Varies Y R; MR; MDT; SC 56544 2023
2017 Braun 1701 37 5 / 2 Clay Demand-Response Varies R; MR; MDT; SC 46444 2023
Y
2017 Braun 1702 38 5 / 2 Clay Demand-Response Varies Y R; MR; MDT; SC 52078 2023
2017 Braun 1703 39 5 / 2 Clay Demand-Response Varies Y R; MR; MDT; SC 58273 2023
Clay
2017 Braun 1704 40 5 / 2 Varies Y R; MR; MDT; SC 61158 2023
Demand-Response
2004 Chevy Diesel Bus 1705 41 31 / 0 Clay Demand-Response Varies Y MR; MDT 243033 2025
2008 Blue Bird School
1800 42 50 / 0 Clay Demand-Response Varies MR; MDT 114227 2025
H35 Bus Y
2018 Dodge Grand
1801 43 5 / 2 Clay Demand-Response Varies Y R; MR; MDT; SC 19594 2023
Caravan SE
2017 Ford E450 Super
1802 44 14 / 3 Clay Demand-Response Varies Y L; MR; MDT; SC 22728 2025
Duty Cutaway
2017 Ford E450 Super
1803 45 14 / 3 Clay Varies Y L; MR; MDT; SC 19945 2025
Duty Cutaway Demand-Response
2017 Ford E450 Super
1804 46 14 / 3 Clay Demand-Response Varies Y L; MR; MDT; SC 14890 2025
Duty Cutaway
2017 Ford E450 Super
1805 47 14 / 3 Clay Demand-Response Varies L; MR; MDT; SC 21808 2025
Duty Cutaway Y
2017 Ford E450 Super Clay
1806 48 14 / 3 Demand-Response Varies Y L; MR; MDT; SC 28380 2025
Duty Cutaway
2017 Ford E450 Super
1807 49 14 / 3 Clay Demand-Response Varies Y L; MR; MDT; SC 26456 2025
Duty Cutaway
2017 Ford E450 Super
1808 50 18 / 3 Clay Demand-Response Varies L; MR; MDT; SC 29452 2025
Duty Cutaway Y
2017 Ford E450 Super
1809 51 18 / 3 Clay Demand-Response Varies Y L; MR; MDT; SC 13932 2025
Duty Cutaway
2017 Ford E450 Super
1810 52 18 / 3 Clay Demand-Response Varies Y L; MR; MDT; SC 17078 2025
Duty Cutaway
2017 Ford E450 Super
1811 53 18 / 3 Clay Demand-Response Varies Y L; MR; MDT; SC 24810 2025
Duty Cutaway
RPA 3 PTP 2021-2025 122017 Ford E450 Super
1812 54 18 / 3 Clay Demand-Response Varies Y L; MR; MDT; SC 18305 2025
Duty Cutaway
2017 Ford E450 Super
1813 55 20 / 2 Clay Demand-Response Varies L; MR; MDT; SC 24012 2025
Duty Cutaway Y
2017 Ford E450 Super Clay
1814 56 20 / 2 Demand-Response Varies Y L; MR; MDT; SC 12549 2025
Duty Cutaway
2018 Ford E350 Super
1815 57 9 / 1 Clay Demand-Response Varies Y L; MR; MDT; SC 18517 2025
Duty Cutaway
2018 Ford E450 Super
1816 58 14 / 3 Clay Varies Y L; MR; MDT; SC 13495 2025
Duty Cutaway Demand-Response
2018 Ford E450 Super
1817 59 14 / 3 Clay Demand-Response Varies Y L; MR; MDT; SC 11690 2025
Duty Cutaway
2019 Ford Transit
1818 60 10 / 1 Clay Demand-Response Varies Y R; MR; MDT; SC 17265 2025
Conversion Van
2007 Ford El Dorado L; MR; MDT; SC
3043 61 20 Clay Demand-Response Varies 155501 2018
176 / 2 Y
2007 Ford El Dorado L; MR; MDT; SC
4044 62 Clay Demand-Response Varies 144193 2018
176 16 / 2 Y
2006 Ford Supreme L; MR; MDT; SC
5280 63 Clay 148715 2018
176 20 / 4 Demand-Response Varies Y
2006 Ford Supreme L; MR; MDT; SC
6506 64 Clay Demand-Response 152453 2018
158 20 / 4 Varies Y
2006 Ford Supreme L; MR; MDT; SC
7281 65 Clay Demand-Response 155722 2018
176 20 / 4 Varies Y
2006 Ford Supreme 7507 L; MR; MDT; SC
66 20 / 4 Clay Demand-Response 137659 2019
176 Varies Y
2006 Ford Supreme L; MR; MDT; SC
8508 67 20 / 4 Clay Demand-Response Varies Y 122474 2018
176
Source: RIDES Service Type: HS = Head Start
Equipment Code: L = Wheelchair Lift; R = Wheelchair Ramp; MR = Mobile Radio; F = Farebox;
MDT = Mobile Data Terminal/Computer; SC = Security Camera
RPA 3 PTP 2021-2025 13Additionally, the fleet of RTA vehicles contains 65 with lifts or ramps, 65 of the 67 total vehicles comply with ADA standards. RIDES employs 13 full time and 66 part time staff with most of the part time workers being drivers. The Regional Transit Authority is the single administrative agency (private non-profit) for public transportation in the region. The policy board of RTA adopted by-laws and submitted articles of incorporation to the Secretary of State in October 1979. On July 1, 1980, RTA became a free-standing agency separate from the Iowa Lakes Area Agency on Aging. The RTA administrative office is located in Spencer, Iowa. RTA provides the majority of its services directly. In several instances RTA does contract for some services by leasing vehicles to cities or agencies for general transportation within their communities. These services are strictly contractual, with each of the providers supplying drivers and paying operating and maintenance expenses. RTA retains policy control over use of these vehicles. The RTA has become responsible for the administration and overhead support services for the overall regional transit system with the designation by the Boards of Supervisors as the Regional Transit Provider. This consolidation of transit services into one agency has been mutually agreed upon by the nine county boards of supervisors. School Districts There are 27 public school districts within region 3. They are as follows: Albert City-Truesdale, Alta-Aurelia, North Union, Boyden-Hull, Central Lyon, Emmetsburg, Estherville Lincoln, George-Little Rock, Graettinger-Terril, Harris-Lake Park, Hartley-Melvin- Sanborn, Laurens-Marathon, MOC-Floyd Valley, Newell-Fonda, Okoboji, Rock Valley, Ruthven- Ayrshire, Sheldon, Sibley-Ocheyedan, Sioux Center, Sioux Central, South O’Brien, Spencer, Spirit Lake, Storm Lake, West Bend-Mallard, West Lyon and West Sioux. RPA 3 PTP 2021-2025 14
School Districts provide transportation to and from school, field trips, athletic events and special
school related outings. Districts may provide other types of services

One exceptional example in RPA 3 to highlight how public transit and school districts can work
together, is in the West Sioux School District. The West Sioux School District and the community
of Hawarden have a cooperative program whereby West Sioux transportation vehicles are made
available to various groups within the city.

Hawarden has a youth recreation program that provides activities for students on days when
there are no classes due to Teacher Development Days and during the summer months. West
Sioux buses are used to transport students to these activities. The city pays the cost of the driver,
but the school does not charge for fuel or mileage.

The city activity program also plans events for senior citizens. For these events, school vans are
supplied. They supply their own driver and there is no charge for fuel or mileage assessed by the
school district.

Churches, also, have used West Sioux vehicles with the same arrangement – pay for the driver,
but no charge for fuel or mileage. The district also indicated that this cooperative effort has
worked well for both the school and citizens of the community. School transportation is
established to serve primarily students and school staff during school hours.

RPA 3 PTP 2021-2025                                                                               15
Table 2: Annual Transportation Data for Iowa Public Schools
Revised 1/7/2020                       Enrollment                   Non-          Net            Ave #             Ave Cost    Ave Cost                 District
                                                                                                                                            Ave Cost
                                       (less shared   Route Miles   Route       Operating      Students            Per Pupil   Per Pupil                Square
                                                                                                                                            Per Mile
                                        time stds)                  Miles         Cost       Transported         Transported   Enrolled                  Miles
Dist. # District Name

    0072      Albert City-Truesdale         202.2      60,019         1,276   $183,696.74    $468.73            $184,165.47         47.0   $3,918.41   $910.81

    0171      Alta-Aurelia                  812.9     106,753       30,645    $328,958.38    $6,400.16          $335,358.54        270.9   $1,237.94   $412.55

    0333      North Union                   410.3      95,478       11,475    $270,775.22                       $270,775.22        248.7   $1,088.76   $659.94

    0747      Boyden-Hull                   583.1      67,167       31,294    $158,103.57   $65,024.67          $223,128.24        288.0   $774.75     $382.66

    1095      Central Lyon                  774.4      51,971       28,682    $166,365.49   $37,843.22          $204,208.71        292.0   $699.34     $263.70

    2088      Emmetsburg                    700.2      73,440       22,345    $255,412.85   $17,397.93          $272,810.78        176.0   $1,550.06   $389.62

    2124      Estherville Lincoln        1,269.6       72,963       59,912    $180,058.00    $468.73            $180,526.73        216.0   $835.77     $142.19

    2457      George-Little Rock            432.1      89,857       15,395    $253,448.42    $3,065.02          $256,513.44        193.0   $1,329.09   $593.64

    2556      Graettinger-Terril            382.0      52,623       15,687    $186,517.26    $1,118.56          $187,635.82        190.9   $982.90     $491.19

    2846      Harris-Lake Park              298.4      49,885       12,983    $148,350.99    $829.41            $149,180.40        181.0   $824.20     $499.93

    2862      Hartley-Melvin-Sanborn        625.3      71,211       16,390    $136,985.47   $12,416.61          $149,402.08        395.6   $377.66     $238.93

    3537      Laurens-Marathon              255.0      25,507         2,404   $86,125.48     $468.73            $86,594.21         103.0   $840.72     $339.59

    4149      MOC-Floyd Valley           1,447.1      132,369       42,410    $322,409.90   $93,001.23          $415,411.13        887.9   $467.86     $287.06

    4644      Newell-Fonda                  432.4      52,770       23,746    $214,065.73    $3,147.20          $217,212.93        155.0   $1,401.37   $502.34

    4890      Okoboji                       978.4      81,066       28,922    $335,249.98    $442.10            $335,692.08        679.7   $493.88     $343.10

    5607      Rock Valley                   804.0      57,736       10,242    $42,663.16    $117,190.49         $159,853.65        172.0   $929.38     $198.82

    5724      Ruthven-Ayrshire              217.0      49,981         5,749   $182,100.52    $2,056.79          $184,157.31        107.9   $1,706.74   $848.65

    5949      Sheldon                    1,083.9       89,585       42,734    $337,331.05   $25,284.14          $362,615.19        454.0   $798.71     $334.55

           RPA 3 PTP 2021-2025                                                                             16
5994 Sibley-Ocheyedan 750.2 80,315 23,410 $352,257.96 $5,245.23 $357,503.19 299.0 $1,195.66 $476.54
6030 Sioux Center 1,334.7 94,192 31,922 $266,747.59 $108,100.77 $374,848.36 1,075.9 $348.40 $280.85
6035 Sioux Central 483.0 78,219 31,483 $283,532.54 $283,532.54 297.0 $954.66 $587.02
6099 South O'Brien 611.5 102,321 51,037 $267,910.54 $6,544.11 $274,454.65 303.7 $903.70 $448.82
6102 Spencer 1,957.5 99,681 87,866 $397,337.35 $397,337.35 1,050.9 $378.09 $202.98
6120 Spirit Lake 1,167.7 64,221 19,780 $394,403.83 $2,073.53 $396,477.36 430.0 $922.04 $339.54
6219 Storm Lake 2,385.5 89,632 55,639 $394,940.59 $394,940.59 1,768.5 $223.32 $165.56
6921 West Bend-Mallard 284.4 69,047 10,969 $210,581.27 $6,707.58 $217,288.85 133.7 $1,625.20 $764.03
6983 West Lyon 938.2 159,335 16,040 $502,555.77 $37,266.44 $539,822.21 927.3 $582.14 $575.38
6990 West Sioux 827.8 82,103 18,139 $275,033.41 $50,146.72 $325,180.13 285.0 $1,140.98 $392.82
Totals & Averages: 22,448.8 2,199,447 748,576 $7,133,919.06 $602,708.10 $7,736,627.16 11,629.6 $665.25 $344.63
Source: Iowa Department of Education, 2019
The table below shows, a total of 370 vehicles are operated by the 33 districts. The numbers of vehicles range from a high of 22 in the
South O’Brien District to a low of 5 in Aurelia District. RIDES contracts to provide ADA services for the school districts in the region that
do not have ADA accessible vehicles.
RPA 3 PTP 2021-2025 17Table 3: School District Vehicle Count and Number of ADA School Buses
District Name Total School Number of ADA School Buses
Buses
Albert City-Truesdale 8 1
Alta-Aurelia 16 1
Armstrong-Ringsted 10 0
Boyden-Hull 11 1
Central Lyon 10 1
Clay Central-Everly 9 0
Emmetsburg 15 0
Estherville-Lincoln 15 1
George-Little Rock 10 0
Graettinger-Terril 17 0
Harris-Lake Park 7 0
Hartley-Melvin-Sanborn 12 0
Laurens-Marathon 8 0
MOC-Floyd Valley 14 2
Newell-Fonda 12 1
Okoboji 14 0
Rock Valley 6 0
Ruthven-Ayrshire 7 0
Sheldon 15 1
Sibley-Ocheyedan 12 2
Sioux Center 14 1
Sioux Central 16 1
South O’Brien 22 1
Spencer 20 3
Spirit Lake 13 1
Storm Lake 19 2
West Bend-Mallard 10 0
West Lyon 6 0
18West Sioux 9 0
Totals 370 20
Source: Iowa Department of Education, 2019
St. Luke’s Lutheran Home
St. Luke’s is a senior care provider that provides transportation for group activity to its residents
only. These are mostly trips for residents to medical appointments throughout the area. St.
Luke’s indicated that their vehicles operate Monday through Friday from approximately 7:30 a.m.
to 4:00 p.m. but on occasion they will run on a weekend. St. Luke’s does not track information
about total annual mileage or trip numbers.
St. Luke’s owns two vans with ramps. One van is used only as a backup when the primary one is
used or broken. St. Luke’s has one full time driver, and one full time maintenance staff. St. Luke’s
does not receive public funding and does not earn revenue for the service provided.
Village Northwest
Village Northwest is a non-profit community organization. Village Northwest provides general
transportation for its clients only. They also cover medical appointments, shopping (both in and
out of town), recreational outings to ballgames, concerts, etc. Village Northwest doesn’t receive
revenue for the services it provides for its residents. Currently RIDES provides Village Northwest
with ADA accessible vehicles and they have staff that are trained and drive for their residents.
Hope Haven
Hope Haven is a nonprofit community-based organization that provides transformational
services for residents. Hope Haven provides transportation for their clients to medical
appointments, worksites and community work sites. RIDES has taken over transportation
services for Hope Haven as of the summer of 2014. Hope Haven doesn’t receive revenue for the
services it provides for its residents.
19ECHO Plus (Now under the umbrella services of Hope Haven)
Echo Plus Inc. is a sheltered workshop that provides supported community living programs to its
clients. Echo vehicles are used for the residents only at their waiver homes. The minivans allow
the 3 to 5 people who live in each house to do normal household activities. The remaining
minivans utilized in the supported community living program for individuals they support and
teach in their own apartments. The Echo staff drives the vehicles to provide access to groceries,
medical appointments and prescriptions, shopping, church, recreation and other normal
activities. The vehicles operate primarily Monday through Friday. Echo doesn’t track trips or
mileage and doesn’t receive revenues for their services provided.
Imagine the Possibilities
Imagine the Possibilities, formerly known as Genesis, is an agency that helps persons with
disabilities located in Storm Lake, IA. They provide transportation services for their residents
only. They make work trips for residents, as well as medical trips for residents as well. The work
vans operate in support servicer capacity for residents. Monday through Friday while their other
three vehicles operate seven days a week. Genesis didn’t provide mileage as its not tracked but
mentioned that primarily their trips are within Buena Vista County. Genesis has five vehicles
including a 15 and 12 passenger work vans, a minivan, a car, and a wheelchair accessible van.
Genesis has no full-time drivers and uses on hand staff to make the needed trips. They do not
track operating expenses and do not receive revenues for the services provided.
Spencer Cab Company
RIDES currently contracts with Spencer Cab Company to enhance their services. The Spencer Cab
Company is a privately owned cab company in Spencer that offers demand responsive service to
anyone in Spencer. The cab operates Monday through Saturday during the week with Sunday as
an off day. Clay County. Spencer Cab only has two vehicles and the owner does majority of the
driving.
20Storm Lake Cab Company
RIDES currently contracts with the Storm Lake Cab Company. The Storm Lake Cab Company is a
privately owned cab company in Storm Lake Iowa that provides a variety of services. They
predominantly do demand responsive service, but also run a shuttle to the Omaha airport for
Buena Vista University. They are demand responsive services, and Buena Vista Students are able
to use the shuttle. The Storm Lake Cab Company is open seven days a week. They will go
anywhere but indicated that 90% of trips are within Buena Vista County or up to Spencer. Storm
Lake Cab Company is privately owned and therefore did not release any operating or revenue
information.
Both Spencer and Storm Lake Cab Companies are not currently have ADA accessible vehicles, but
when they receive a call for transportation services for someone who is needing ADA
accessibility, they work with RIDES to provide the service.
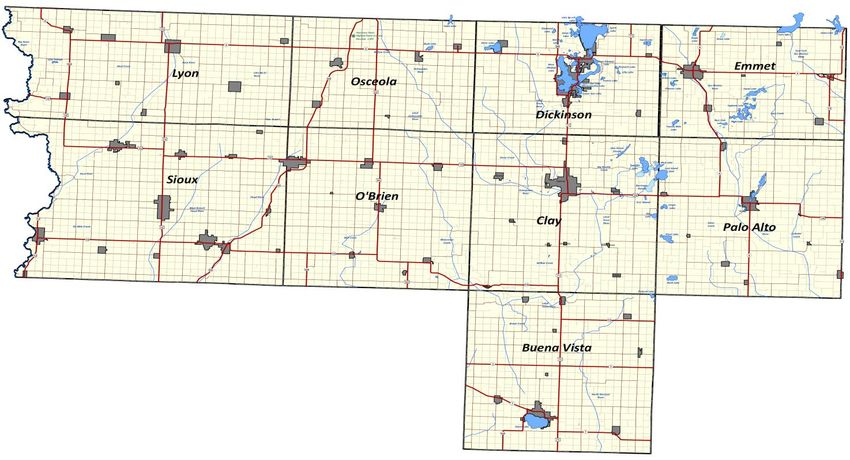
The following maps provide the locations of medical facilities that include hospitals, clinics,
pharmacies, nursing homes, dental, and mental health facilities and essential community services
that include banks, postal, libraries, grocery, large employment centers, elementary schools,
middle/high schools, community action agencies, persons with disability employers, group
homes, low-income housing, and congregate meal sites.
While no specific transit program is applicable to provide access to these aforementioned
facilities, the RTA does currently contract with persons with disability employers and group
homes to fulfill their transportation needs. In addition, transit programs to employment centers
have been tried in the past but no current programs exist. However, all of these facilities would
be accessible via transit through the on-demand service that is currently provided.
21Map of Location of Medical Services in NWIPDC Region
22Map Location of Essential Community Facilities in NWIPDC Region
23Area Profile
Population Characteristics
Population statistics help to show the bigger picture of what is going on in the RPA 3. As a whole,
the region lost 0.07% population. This isn’t significant, but it is continuing to be the trend in rural
Iowa. “Dave Peters, an Iowa State University sociologist, said the loss of manufacturing and
agricultural jobs in rural areas continues to drive people into the state’s larger cities”
Buena Vista County
Buena Vista County population saw a slight increase in population from 2010 to 2017. According
to the 2017 Census (American Fact Finder), the population was 20,369 an increase from 20,260
in 2010. This makes up a 0.6% difference in population. All Cities in Buena Vista County all
showed a slight growth in population, except for Albert City, Linn Grove, Rembrandt and Sioux
Rapids. Storm Lake, which is the county seat, had the largest change in population with an
increase of 138 people or 2.3%.
Clay County
Clay County population saw a slight decline in population from 2010 to 2017. According to the
2017 Census (American Fact Finder), the population was 16,387, dropping from 16,667 in 2010.
This makes up a -1.7% difference in population. The Cities of Dickens, Everly, Greenville and
Webb populations grew slightly, while the rest of the cities and the rural county all lost
population. Everly had the largest percentage increase in population with an increase of 80
people or 12.8%
24Dickinson County
Dickinson County saw a slight increase in population from 2010 to 2017. According to the 2017
Census (American Fact Finder), the population was 17,000, increasing from 16,667 in 2010. This
makes up a 2% difference. All cities in the County grew in population, except for Arnolds Park
and Orleans. Spirit Lake is the largest city in Dickinson County and had the largest percentage
increase in population with 127 people or 3.4%.
Emmet County
Emmet County population saw a slight decrease. According to the 2017 Census (American Fact
Finder), the population was 9,661. The largest population decline in the county was in the city of
Estherville. Their population was 6,360 in 2010 and was down to 5,930 in 2017. This makes up a
population decline of 430 or 6.8%.
Lyon County
Lyon County increased 164 persons or 1.4% from 11,581 to 11,745 persons for the period of 2010
to 2017 according to the 2017 Census (American Fact Finder). All cities in Lyon County increased
in population, except for the City of Lester. The City with the largest growth is Alvord, who grew
by 64 people or 25%.
O’Brien County
O’Brien County saw a decrease in population from 2010 to 2017. According to the to the 2017
Census (American Fact Finder), the population was 13,944, decreasing from 14,398 in 2010. This
makes up a -3.3% difference. The Cities of Archer, Hartley, Primghar and Sanborn all grew in
population, while the rest of the cities and the rural county all lost population. Hartley had the
largest population change between 2010-2017, with an additional 71 people, or 4.1%.
25Osceola County
Osceola County saw a decrease in population from 2010 to 2017. According to the to the 2017
Census (American Fact Finder), the population was 6,149, decreasing from 6,462 in 2010. This
makes up a -4.9% difference. All Cities in Osceola County decreased in population, except for
Melvin and Ocheyedan. Sibley lost the most population from 2010 to 2017, decreasing by 139
people, or -5.2%.
Palo Alto County
Palo Alto County decreased by 410 persons in from 9,421 to 9,011 persons or -4.5%. Rural Palo
Alto County and 5 of 8 cities had a decline in population. Ayrshire, Curlew, Cylinder and Rodman
all increase slightly in population. The largest City in Palo Alto County, Emmetsburg, had the
largest population loss between 2010-2017, going from 3,904 to 3,783 or 3.2%.
Sioux County
Sioux County saw an increase in population from 2010 to 2017. According to the to the 2017
Census (American Fact Finder), the population was 34,692, increasing from 33,704 in 2010 or
2.9%. All cities except for Chatsworth, Granville and Matlock. Sioux Center is the largest city in
Sioux County, and had the largest change in population with 402 people or 6%.
26RPA 3 Population 2000-2040
143,000
142,000 142123
141,000 141098
140653
140,000 140114
139,000 139158
138245
138,000
137427 137464
137,000 136937
136,000
135,000
134,000
2000 2005 2010 2015 2020 2025 2030 2035 2040
Source: Woods and Pool, Inc. 2019
The previous paragraphs show that the population has declined from 2010 to the 2017, according
to the US Census. The picture the data paints a common theme in rural Iowa. However, according
to Woods and Poole data the population in RPA 3 is projected to increase in population until
2040. Some counties in the region will steadily lose population, while others steadily gain thus
the region will gain population as a whole.
Age Distribution
Another factor that impacts the population that has declined in RPA recently, is the increasing
number of elderly citizens. The following table shows the breakdown by age of the total
population per county and the percentage that represents. The overall trend that can be seen in
the table below is that the largest group of in the population are the baby boomers ages 51-69
and school aged children-5-24. These are the groups that are going to heavily rely on public
transportation and who the public transit system continues to focus on.
27Table 4: Population by Age Group and Percentage of the Total Population
Age Group Buena Vista Clay Dickinson Emmet Lyon O’Brien Osceola Palo Alto Sioux
Under 5 1,518/7.5% 1,042/6.4% 831/4.9% 509/5.3% 867/7.4% 830/6.0% 394/6.4% 547/6.0% 2,595/7.5%
5-9 Years 1,312/6.4% 1,073/6.5% 905/5.3% 539/5.6% 1,113/9.5% 955/6.8% 423/6.9% 615/6.8% 2,729/7.9%
10-14 Years 1,477/7.3% 1,027/6.3% 930/5.5% 677/7.0% 815/6.9% 894/6.4% 392/6.4% 564/6.2% 2,588/7.5%
15-19 Years 1,716/8.4% 928/5.7% 872/5.1% 908/9.4% 760/6.5% 865/6.2% 364/5.9% 553/6.1% 3,081/8.9%
20-24 Years 2,577/12.7% 860/5.2% 842/5.0% 516/5.3% 581/4.9% 722/5.2% 293/4.8% 556/6.1% 3,165/9.1%
25-29 Years 2,160/10.6% 1,829/11.2% 1,710/10.1% 891/9.2% 1,240/10.6% 1,429/10.2% 620/10.1% 966/10.6% 3,973/11.5%
30-34 Years 2,415/11.9% 1,853/11.3% 1,772/10.4% 1,058/11.0% 1,426/12.1% 1,528/11.0% 642/10.4% 1,022/11.2% 3,789/10.9%
35-39 Years 1,347/6.6% 2,072/12.6% 2,155/12.7% 1,186/12.3% 1,360/11.6% 1,749/12.5% 835/13.6% 1,068/11.7% 3,638/10.5%
40-44 Years 1,397/6.9% 1,144/7.0% 1,379/8.1% 831/8.6% 873/7.4% 1,185/8.5% 565/9.2% 707/7.8% 2,276/6.6%
45-49 Years 1,387/6.8% 1,289/7.9% 1,478/8.7% 654/6.8% 672/5.7% 922/6.6% 370/6.0% 588/6.5% 1,787/5.2%
50-54 Years 805/4.0% 1,614/9.8% 2,208/13.0% 935/9.7% 967/8.2% 1,271/9.1% 583/9.5% 883/9.7% 2,432/7.0%
55-59 Years 698/3.4% 983/6.0% 1,337/7.9% 656/6.8% 706/6.0% 975/7.0% 404/6.6% 571/6.3% 1,801/5.2%
60-64 Years 1,518/7.5% 673/4.1% 581/3.4% 301/3.1% 365/3.1% 619/4.4% 264/4.3% 470/5.2% 838/2.4%
65-69 Years 1,312/6.4% 1,042/6.4% 831/4.9% 509/5.3% 867/7.4% 830/6.0% 394/6.4% 547/6.0% 2,595/7.5%
70-74 Years 1,477/7.3% 1,073/6.5% 905/5.3% 539/5.6% 1,113/9.5% 955/6.8% 423/6.9% 615/6.8% 2,729/7.9%
75-79 Years 1,716/8.4% 1,027/6.3% 930/5.5% 677/7.0% 815/6.9% 894/6.4% 392/6.4% 564/6.2% 2,588/7.5%
80-84 Years 2,577/12.7% 928/5.7% 872/5.1% 908/9.4% 760/6.5% 865/6.2% 364/5.9% 553/6.1% 3,081/8.9%
85 Years and Over
2,160/10.6% 860/5.2% 842/5.0% 516/5.3% 581/4.9% 722/5.2% 293/4.8% 556/6.1% 3,165/9.1%
Source: US Census, American Fact Finder 2017
Also, as seen in the table below, median ages in RPA 3 range from 33-48 years of age. The
youngest median age is Sioux County with 33.3years of age and the oldest median age is
Dickinson County. In general, Sioux County has a large amount of school aged children, thus
bringing the entire county median average down. There are a lot of young professionals in this
county, keeping the median population down. In Dickinson County, it is considered a retirement
area with the Iowa Great Lakes as the backdrop. Many of those in the baby boomer generator
choose to move to places like Dickinson County to slow down and enjoy their retirement, thus
bringing the median age higher.
28Table 5: Median Age by County
Buena Vista 35.1
Clay 42.2
Dickinson 48.7
Emmet 42.5
Lyon 38.0
O’Brien 43.3
Osceola 44.0
Palo Alto 42.3
Sioux 33.3
Source: US Census, American Fact Finder 2017
Another important factor to look at is the population over 65 years of age. This population tends
to give up driving as they age and rely heavily on public transportation. From the table below,
on average 1/5 of the total population is over 65 years of age. This is not isolated just to RPA 3 in
northwest Iowa though. The State of Iowa has 15.6% of its population over the age of 65. As the
younger groups age, this number as well as the median age will continue to steadily rise.
Table 6: Percentage of Population
Over Age 65
Buena Vista 14.2%
Clay 19.9%
Dickinson 24.3%
Emmet 19.6%
Lyon 17.3%
O’Brien 20.5%
Osceola 20.4%
Palo Alto 21.2%
Sioux 14.6%
Source: US Census, American Fact Finder 2017
29As previously stated, elderly and the disabled are the two largest users of the public
transportation system. On the table below, there is a breakdown by county of the civilized
noninstitutionalized population that has a disability. As the table below shows, on average 12.6%
of the population is disabled.
Table 7: Disability Status Percentage Breakdown by County in RPA 3
Total Civilian Number with a Percentage
Noninstitutionalized Disability
Population
Buena Vista 20,099 1,804 9.0%
Clay 16,136 2,353 14.6%
Dickinson 16,817 2,546 15.1%
Emmet 9,396 1,366 14.5%
Lyon 11,575 1,178 10.2%
O’Brien 13,733 1,841 13.4%
Osceola 6,054 887 14.7%
Palo Alto 8,906 1,274 14.3%
Sioux 34,293 2,860 8.3%
Source: US Census, American Fact Finder 2017
Employment
Employment information is very important to help paint the picture of what types of industry
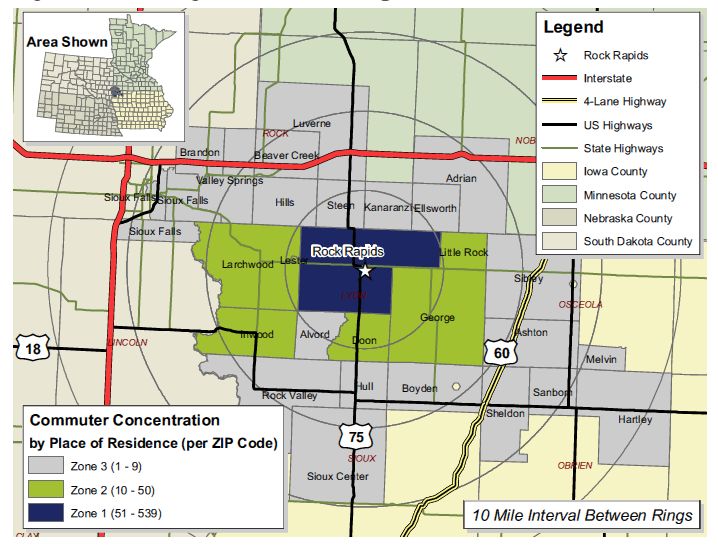
people work in, what the median income is and how commuting affects the entire big picture.
Below will be a few tables that detail this information, as well as some maps from Iowa Workforce
Development detailing commuting patterns.
Table 8: Employment by Industry for Buena Vista County
Estimate Percentage
Agriculture, forestry, fishing and hunting and mining 885 8.4%
Construction 535 5.1%
Manufacturing 2,836 26.8%
30Wholesale trade 326 3.1%
Retail trade 1,275 12.0%
Transportation and warehousing, and utilities 213 2.0%
Information 104 1.0%
Finance and insurance, and real estate and rental leasing 296 2.8%
Professional, scientific, and management, and 327 3.1%
administrative and waste management
Educational services, and health care and social 2,434 23.0%
assistance
Arts, entertainment, and recreation and accommodation 654 6.2%
and food services
Other services, except public administration 464 4.4%
Public Administration 233 2.2%
Source: US Census, American Fact Finder 2017
Table 9: Employment by Industry for Clay County
Estimate Percentage
Agriculture, forestry, fishing and hunting and mining 524 6.2%
Construction 580 6.8%
Manufacturing 1,235 14.5%
Wholesale trade 363 4.3%
Retail trade 1,428 16.8%
Transportation and warehousing, and utilities 385 4.5%
Information 274 3.2%
Finance and insurance, and real estate and rental leasing 410 4.8%
Professional, scientific, and management, and 439 5.2%
administrative and waste management
Educational services, and health care and social 1,895 22.3%
assistance
Arts, entertainment, and recreation and accommodation 500 5.9%
and food services
31You can also read


