2018 Community Labour Market Plan - Local Employment Planning Council - Ottawa Employment Hub
←
→
Page content transcription
If your browser does not render page correctly, please read the page content below
Local Employment
        Planning Council

2018 Community
Labour Market Plan

            This program is funded in part by the Government
            of Canada and the Government of Ontario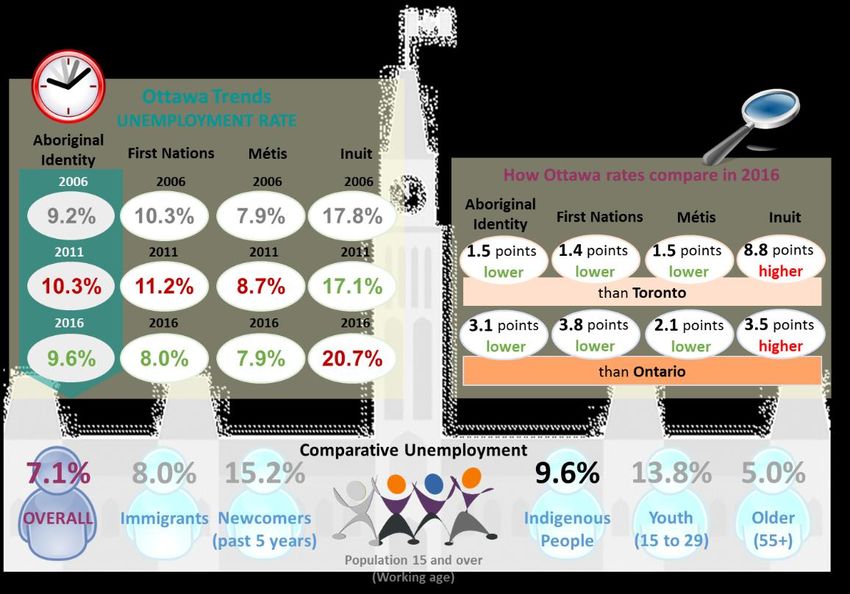
2018 OTTAWA COMMUNITY LABOUR MARKET PLAN │ OTTAWA EMPLOYMENT HUB (LEPC)
TABLE OF CONTENTS
Executive Summary
The Local Employment Planning Council Pilot
Background and context
Who we are and how we work
Key accomplishments and ongoing activities
Who lives in
Ottawa and where Building the Community Labour Market Plan
they live
(CLMP)
Overview of data sources
Ottawa’s Community consultations
labour pool and
employment The Ottawa Picture in 2018
Perceptions of the local labour market
Who lives in Ottawa and where
Where people Ottawa’s labour pool and employment
work A closer look at key talent pools
Industry view Where people work (industry view)
What people do (occupation view)
How we connect job seekers to jobs
Local workforce challenges and opportunities
What
people do
Key Considerations for Moving Forward
Occupation view
Role of the Local Employment Planning Council
Executive Steering Group Priorities / Next Steps
How we connect
Ottawa Employment Hub, your Local Employment Planning
job seekers to jobs Council, would like to thank the 150 plus community partners
who have worked with us over the course of the LEPC pilot and
who provided valuable input into this Community Labour
Market Plan.
This program is funded in part by the Government
of Canada and the Government of Ontario
Page 1 │ OTTAWA 2018 CLMP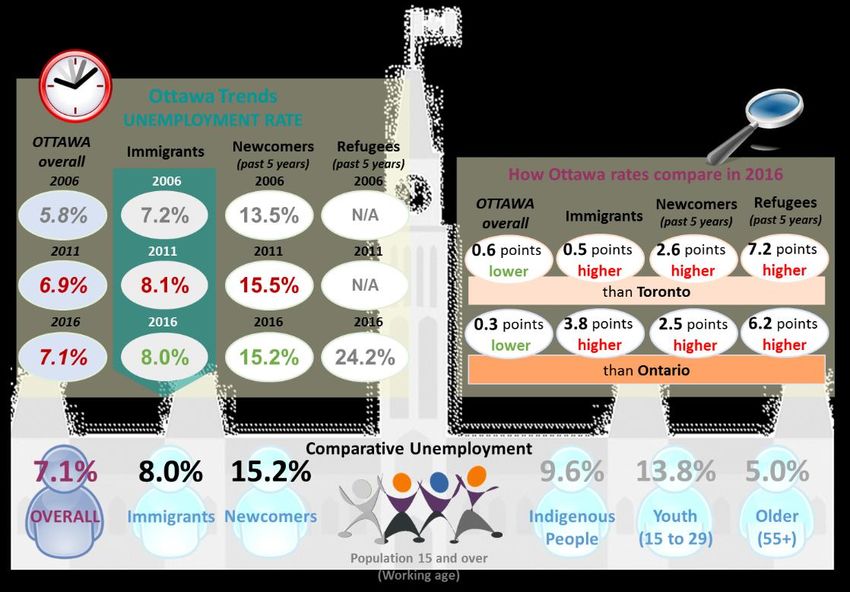
2018 OTTAWA COMMUNITY LABOUR MARKET PLAN │ OTTAWA EMPLOYMENT HUB (LEPC)
The Local Employment
The LEPC pilots in Ontario
Planning Council (LEPC) Pilot Former ADM David Fulford, MAESD:
“Expanding the activities of existing Local
Boards…the new LEPC pilots will have
BACKGROUND AND CONTEXT greater capacity to provide funding for
community-based projects to support the
Eight Local Employment Planning Councils are being piloted in Ontario,
local workforce, improve coordinated
running from December 2015 to March 2019, with funding from the
planning of employment and training
Ministry of Advanced Education and Skills Development (formerly Ministry
services, and help employers, workers and
of Colleges, Training and Universities).
people looking for work make informed
choices about training and careers. LEPCs
Building on the work done over the past four years by Labour Market
will also improve local labour market
Ottawa, Algonquin College won the bid to administer an 24-month Local
information to assist communities to
Employment Planning Council (LEPC) pilot for the Ottawa community.
better anticipate local labour gaps, and
The Ottawa LEPC, branded as “Ottawa Employment Hub”, works with
current and future employment
three formal LEPC partners:
opportunities.”
Ottawa Chamber of Commerce
Ottawa Community Coalition for Literacy Ottawa Employment Hub
Employment Ontario Ottawa Network The Local Employment Planning Council
(LEPC) in Ottawa has branded itself as
Ottawa Employment Hub to reflect the
THE OTTAWA PILOT dynamic activities included in its mandate;
those activities, and the desired client
Who we are and how we work outcomes, are reflected in its credo:
The LEPC is overseen by the Secretariat (eight staff) which is guided by
the Executive Steering Group (ESG) in the Ottawa pilot. Working groups
and the Central Planning Table feed into the ESG as advisory committees.
Connect – we will connect with
employers, service providers, and
other stakeholders for mutual
learning and leveraging each others’
knowledge and expertise to connect
job seekers and learners to jobs.
Plan – we will collaborate as a
community to identify local
opportunities and challenges in the
local labour market.
Learn & Work – through our
connecting and planning, we will
connect job seekers and learners to
the programs and services that they
need to become the human capital for
which local employers are looking.
Page 2 │ OTTAWA 2018 CLMP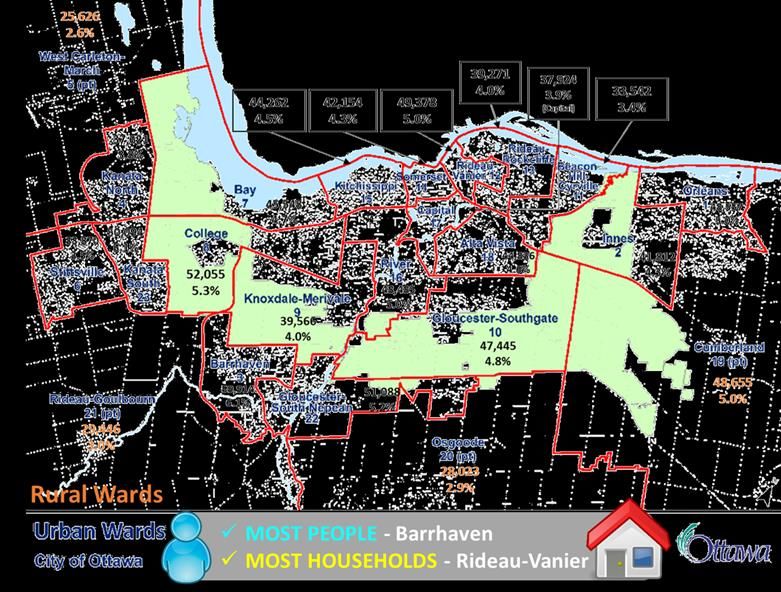
2018 OTTAWA COMMUNITY LABOUR MARKET PLAN │ OTTAWA EMPLOYMENT HUB (LEPC)
2017-18 Deliverables
The Community Labour Market Plan
ties in closely with two of the key Working within its governance structure, the Ottawa LEPC published its
activity areas for all LEPCs 2017-18 business plan in May 2017 to outline the locally-identified priorities
for the June 2017 to September 2018 period of the pilot.
Integrated Planning It is organized under five key activity areas:
The ministry expects LEPCs to serve as
key mobilizers of employers, service Integrated Planning
providers, other ministries and levels of Labour Market Information and Intelligence:
government operating locally, and other Service Coordination for Employers:
community groups to engage in more Research and Innovation:
collaborative local planning Sharing Best Practices and Promising Approaches
Service planning (with Employment The Community Labour Market Plan (CLMP) is a required operational activity
Ontario and non-Employment for each LEPC pilot.
Ontario organizations) to identify
and address service gaps and
challenges for clients accessing
OTTAWA LEPC - 2017-18 PERFORMANCE COMMITMENTS
Labour Market Information Service Coordination for
services. Integrated Planning
& Intelligence Employers
Workforce development planning 1. Career Gear school-to-work transition tool 3. LMI product suite review 4. Employer-tested on-line
roll-out to schools in English and French with end users, tools to facilitate
with local industry and community 2. A community action plan to address refinement and roll-out to employer access to local
immigrant employment priorities service providers and LMI, programs and
stakeholders, supported by local developed in partnership with Ottawa employers services
labour market information, to Local Immigration Partnership (OLIP)
determine skills needs/future skills 5. An expanded one-year Mentorship Pilot for persons in the criminal justice system
6. A dialogue session to share best practices in workforce planning/labour partnership
requirements and/or prevent skills Research
projects and identify a local project
& Innovation
shortages in growth sectors 7. A dialogue session to share best practices in collaborations between industry
associations and workforce planning entities and identify a local project
Sharing Best 8. Multi-media products that capture success stories/practices, shared at annual
Labour Market Information & Practices & Promising learning event to facilitate ongoing knowledge-sharing both locally and
Intelligence Approaches provincially
• Community Labour Market Planning Report – Identify local labour market challenges, opportunities
Expanding current understanding of and recommendations
• LMI Strategy Report – LEPCs will work collectively to identify best practices relating to LMI products
local labour market issues and Operational and develop a common LMI strategy with a roadmap for implementation
Activities • Magnet – Share insight dashboard findings and facilitate community-wide learnings
needs and improving access to • Youth Entrepreneurship Networking Group of Ottawa (YENGO) lead
• Apprenticeship Workshops – Develop and deliver in partnership with MAESD and EOON, OCCL
labour market information • ReNEW Project with OCLF – Exploring small business succession with newcomers
resources for various community
audiences (e.g., employers, service
providers, levels of government, BUILDING ON YEAR ONE ACTIVITIES
and other community stakeholders). Ottawa Employment Hub has worked with more than 150 community
While analysing and interpreting partners over the course of the pilot to advance on local priorities,
current data sources is part of this including:
work, the ministry expects LEPCs to Career Gear school-to-work transition tool development
gather local labour market Ottawa this Quarter, LMI 101 for Service Providers and Employers,
intelligence, and analyse and Sector Spotlights and other LMI publications
interpret the impacts on their Annual Building Connections learning event for 400 service
community. providers and employers (with youth networking component)
Mentorship program inventory and funded mentorship pilot for
youth in the criminal justice system
Refugee 613 Pathways event and process evaluation; Funder
inventory; Magnet platform to connect job seekers to opportunities
OTTAWA 2018 CLMP │ Page 3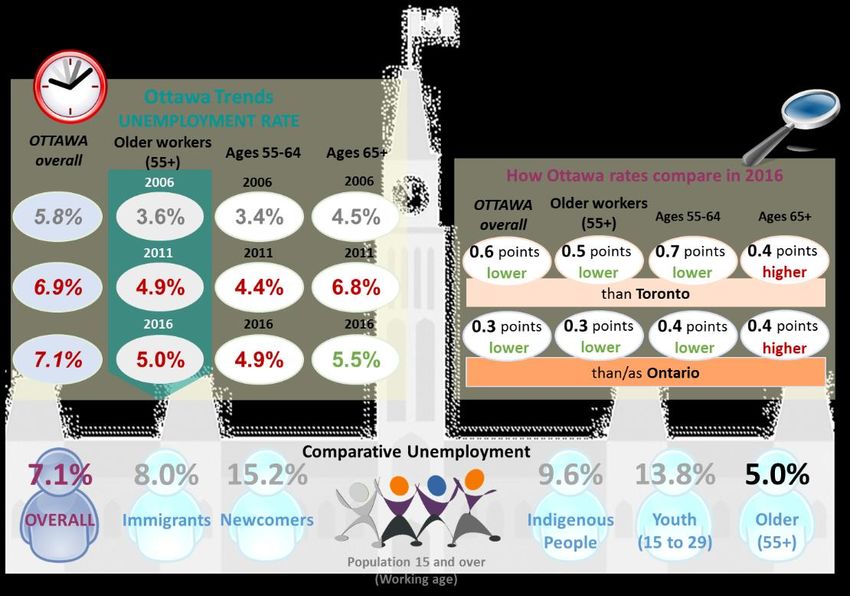
2018 OTTAWA COMMUNITY LABOUR MARKET PLAN │ OTTAWA EMPLOYMENT HUB (LEPC)
Building the Community Labour
Market Plan (CLMP)
Ottawa’s approach
The Community Labour Market Planning (CLMP) Report was submitted to
MAESD in March 2018 for review, translation, and full publication by
Overview of data sources
May 31, 2018. In Ottawa, we will be validating the initial report in
further round of local consultations with our advisory committees and Statistics Canada
formal governance components over the next two months to review the 2006 Census, 2011 NHS, 2016
data. Census
Labour Force Survey
The validated, public report will identify local labour market challenges,
Annual migration estimates
opportunities and recommendations to improve service coordination,
Estimates of population
integrated local planning, collecting and disseminating local labour
Canadian business counts
market knowledge, and addressing identified local labour market
challenges and opportunities.
Emsi Analyst 2017.3 dataset
Compiles data from:
Community consultations Canadian business counts
2001 and 2006 census, 2011 NHS
During February 2018, Ottawa Employment Hub conducted more than Survey of Employment, Payrolls
40 stakeholder interviews with members of our Executive Steering and Hours
Group, Central Planning Table and Working Groups. We also held Labour Force Survey
consultation sessions with each of these groups (five in total) to find out Canadian Occupational Projection
what our community wanted to include in the report. These interviews System
and consultations were also used to build the qualitative narrative CANSIM demographics
around the full investigation of the “numbers.” Postsecondary Student
Information System
Interviews focused on:
Local workforce challenges and opportunities (the overall local Other data sources
labour market, industry trends, skills and occupations in demand City of Ottawa
or declining, challenges in recruitment and retention, MAESD (Employment Ontario data)
opportunities that can be leveraged, barriers to employment). Immigration, Refugees and
LMI and local priorities/actions (LMI requirements, priorities and Citizenship Canada
key groups to engage). MDB Insight and Vicinity Jobs
Role of the LEPC in moving forward (what we do well and what Magnet Insight Dashboard
we could do differently; how to best engage stakeholders).
Page 4 │ OTTAWA 2018 CLMP
2018 OTTAWA COMMUNITY LABOUR MARKET PLAN │ OTTAWA EMPLOYMENT HUB (LEPC)
The Ottawa Picture
Most see Ottawa as a job seekers’ Perceptions of the Local Labour Market
market right now with low
unemployment and many Ottawa is a “hot” job market right now
opportunities.
There are still barriers for specific groups
High number of students in Ottawa seen to impact on ability to
Some still see discrepancy
find entry-level or low-skilled work for barriered clients and
between experience for which others who are new to the labour market
employers are looking and what Bilingual requirements impact job seekers’ ability to find work,
job seekers have to offer. especially for those whose first language may not be English or
French
Some report that finding entry-level work in Tech sector can still
Ottawa considered a distinct and be a challenge for new grads and those new to Ottawa
more complex, harder to predict,
labour market than rest of Eastern Some labour shortages reported
Ontario. Reports of difficulty finding workers with technical skills in the
Construction sector
Always seems to be demand for certified trades people
There is a growing tendency
Manufacturing sector has hard time finding and retaining people
toward part-time work. Demand for experienced tech workers and both entry and senior
level people in specialized areas (Big Data, AI cybersecurity)
More job seekers looking to
Mixed perceptions on key sectors
starting their own business as an
Some feel that the Tech sector has not fully recovered and that
option (many looking at self-
finding entry level jobs can still be a challenge; several questions
employment versus a start-up). the actual size of the Tech sector in Ottawa in terms of number
of local jobs created
Others see Tech sector growth as key to Ottawa’s success;
Millennials want to focus more on Some perception that Public Admin jobs may decrease but
work-life balance. others see the fact that we are government town as offering lot
of opportunities
Challenges and opportunities
Employers seem more ready to spend in money bringing in
experience from outside Ottawa versus investing in local talent
Funding should focus on increasing skills and job readiness of
barriered clients (perhaps instead of wage subsidies)
Credential recognition seen as key for immigrants
Concern that automation will have impact on lower-skilled jobs
that are most suitable for some barriered clients
Non-profit sector (not government per se) could be leveraged
more
OTTAWA 2018 CLMP │ Page 5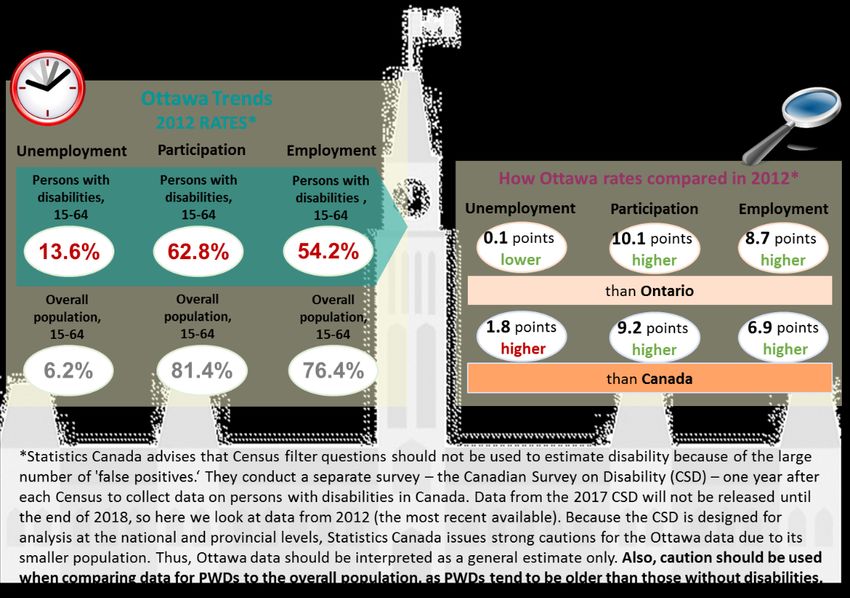
2018 OTTAWA COMMUNITY LABOUR MARKET PLAN │ OTTAWA EMPLOYMENT HUB (LEPC)
Who lives in Ottawa (2017 population) Change in population by age group1
2012 2017 Change
All ages 924,466 994,837
2012 2017 2020 0 to 4 years 50,183 52,405 4%
Past 5 years Next 3 years 5 to 9 years 49,724 52,898 6%
924,466 8% increase 994,837 1% increase 1,008,825* 10 to 14 years 50,143 51,973 4%
15 to 19 years 59,289 57,817 -2%
ONTARIO ↑ 6% ONTARIO ↑ 2%
*Projection source: Emsi Analyst 20 to 24 years 73,141 74,542 2%
25 to 29 years 69,353 81,375 17%
Under 15 to 30 to 55 &
15 29 54 over 30 to 34 years 63,802 73,585 15%
35 to 39 years 63,260 67,242 6%
157,276 213,734 343,229 280,598 40 to 44 years 66,156 65,090 -2%
100,000
45 to 49 years 72,698 65,803 -9%
75,000
50,000 74,542
81,375
73,585
67,242 65,090 65,803 71,509 70,215
50 to 54 years 71,829 71,509 0%
58,919
52,405 52,898 51,973 57,817 49,357 55 to 59 years 60,744 70,215 16%
25,000
37,919
25,931 18,359 19,898
0 60 to 64 years 51,063 58,919 15%
Under 5 5 to 9 10 to 14 15 to 19 20 to 24 25 to 29 30 to 34 35 to 39 40 to 44 45 to 49 50 to 54 55 to 59 60 to 64 65 to 69 70 to 74 75 to 79 80 to 84 85 &
over
65 to 69 years 39,551 49,357 25%
70 to 74 years 28,140 37,919 35%
Female Male 75 to 79 years 21,757 25,931 19%
507,690 487,147
80 to 84 years 16,718 18,359 10%
51% 49% 85 to 89 years 10,804 12,064 12%
90 and over 6,111 7,834 28%
OVERALL POPULATION AND MIGRATION
Over the past five years, Ottawa’s population increased by 8%, surpassing the
Migration by age group, Ottawa
growth rate for Ontario overall. Population growth is expected to slow down
2011-20162
over the next 3 years in Ottawa, with only a 1% increase forecast. Growth is
also expected to slow in Ontario overall (2% increase forecast). 80,000
70,000 71,202
The background colours in the Change in population table on this page indicate 60,000
where the 2012 population numbers would end up five years later, assuming 55,324
50,000
no migration. For example, there were 50,183 people aged 0 to 4 years in
2012; if all of these people continued to live in Ottawa in 2017 and no new 40,000
27,525
30,288 23,195
people arrived, you would expect the 2017 population number for those aged 30,000
5 to 9 years to match the 0 to 4 years figure from 2012. The table shows that 22,495 17,926 25,123
20,000
the 2017 number was actually 52,898, indicating a net in-migration for that age 15,878 10,445
9,223
cohort. 10,000
7,793 9,599
0 1,222
Ottawa saw a net increase in population in the 15 to 29 year range that could -1,928
-10,000
be related to challenges around youth employment (as demand for jobs goes 0-17 18-24 25-44 45-64 65+
up with more people). This will be explored further when we look at Ottawa’s
employment and labour force in the next section. In-migrants Out-migrants
Net-migrants
The fact that Ottawa’s population is decreasing for those between 40 and 54
years may reflect some of the difficulty reported in finding mid-level workers for
some skilled occupations.
Page 6 │ OTTAWA 2018 CLMP
2018 OTTAWA COMMUNITY LABOUR MARKET PLAN │ OTTAWA EMPLOYMENT HUB (LEPC)

                                   OTTAWA’S 2017 POPULATION PYRAMID4
Share of overall Ottawa
                                   Ottawa’s population pyramid shows that lower birth rates are being mitigated by
population, 20163
                                   increased immigration. Younger age groups tend to have slightly more males, while
2017 consultations pointed         females account for a majority share as the population ages.
to these key population
groups to explore further.
            Immigrants &
     23%     Newcomers
               (arriving in
      3%    previous 5 years)

       ?      Persons
                with
             Disabilities

             Indigenous
      3%       People

               Youth
     37%      Under 29

                Older
     28%     55 and over

Data challenges around
                                   A CLOSER LOOK AT SPECIFIC POPULATIONS6
Persons with Disabilities
A 2010 report5, referencing        Below we show trends over time. There are challenges in acquiring accurate counts of
2006 Census data, states:          persons with disabilities at the local level (explained in the note to the left).
Ottawa’s disability
prevalence increased during         Immigrants &         2006
                                                                    5 year trend
                                                                                        2011
                                                                                                   Past 5 years
                                                                                                                      2016
the period 2001-2006. In             Newcomers          178,540                       202,605                        216,505
                                       (arriving in                  13% increase                    7% increase
2006, 149,425 people in             previous 5 years)
                                                         29,650                        32,485                          30,075
                                                                    ONTARIO ↑ 6%                   ONTARIO ↑ 7%
Ottawa had disabilities,
representing                          Persons                      5 year trend                    Past 5 years
                                        with            149,425      x% increase        N/A          x% increase       N/A
17.7% of Ottawa’s                    Disabilities
                                                                    ONTARIO ↑ x%
population. This represents a                                                                      ONTARIO ↑ x%

20% increase since 2001                                            5 year trend                    Past 5 years
(25,625 more individuals).           Indigenous
                                       People
                                                        12,965*      40% increase     18,180        26% increase      22,955
                                                                    ONTARIO ↑ 24%                 ONTARIO ↑ 24%
LEPC Data Check
                                                                    5 year trend                   Past 5 years
Statistics                             Youth
Canada advises                        Under 29          309,225       8% increase     334,080        3% increase     345,220
                                                                     ONTARIO ↑ 3%                  ONTARIO ↑ 2%
that Census filter questions
                                                                   5 year trend                    Past 5 years
should not be used to estimate          Older
disability because of the large      55 and over        190,925      18% increase    224,735        18% increase     265,895
                                                                    ONTARIO ↑ 17%                 ONTARIO ↑ 16%
number of 'false positives.' See
the PWD section later in the
report for more information.

                                                                                                              OTTAWA 2018 CLMP │ Page 7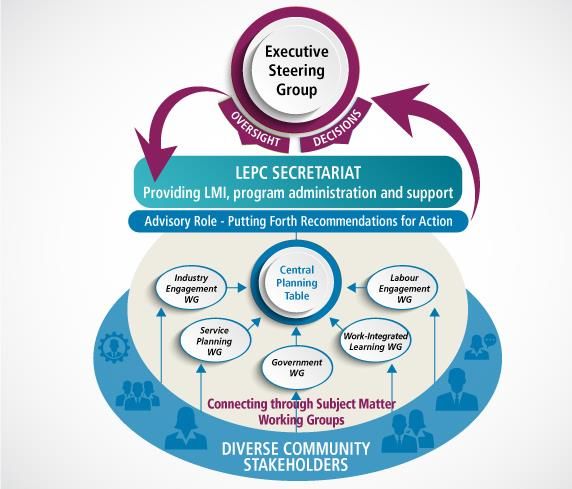
2018 OTTAWA COMMUNITY LABOUR MARKET PLAN │ OTTAWA EMPLOYMENT HUB (LEPC)
IMMIGRATION TRENDS
Immigrants make up 23% of the
In the past 5 years, the number of refugees landing in Ottawa is already at 67% of
population (216,505) in 20168
the total who landed in the previous 10 years. While the current share is lower than
the 1980 to 1990 period (24% vs. 30%), this represents a much greater number of Established immigrants (>10
refugees than those who landed in 1980, due to overall immigration increases. years) make up 17% of the
overall population
Immigrant population (of those who arrived since 1980), by admission category and Recent immigrants (5-10 years)
period of immigration, Ottawa, 20167 make up 3% of the population
Very recent immigrants
70,000
60,490 (newcomers here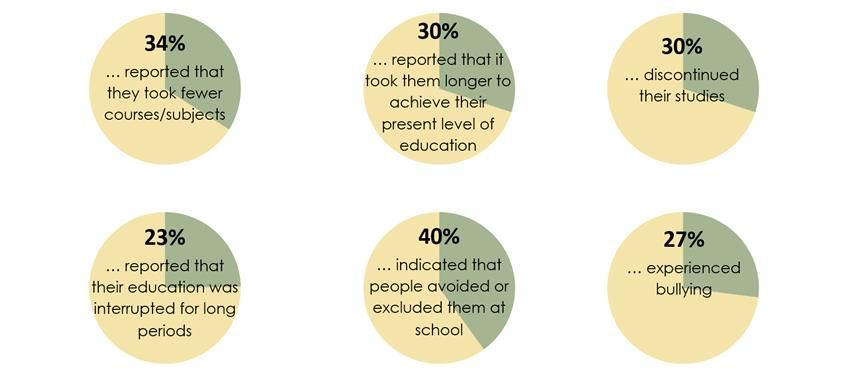
2018 OTTAWA COMMUNITY LABOUR MARKET PLAN │ OTTAWA EMPLOYMENT HUB (LEPC)

                                   Where people live in Ottawa in 201713

Pop. Change - 2015 to 2017
 2,216   Barrhaven
 2,174   Gloucester-South Nepean   DATA HIGHLIGHTS
 2,101   Cumberland
                                   In 2017, Barrhaven continued to be Ottawa’s ward with the highest population.
 2,029   Stittsville
                                   This ward also saw the most growth with 2,216 more people in 2017 than two
 2,003   Rideau-Goulbourn          years previously.
 1,388   Kanata South
 1,363   Kanata North              Five wards showed relatively small population declines from 2015 to 2017.
 1,239   Somerset                  Orléans showed the biggest decline with a drop of 358 people. All five wards
 1,119   Kitchissippi              showing decline were Urban wards.
   977   Rideau-Rockcliffe
   809   Rideau-Vanier             All four Rural wards showed growth, with Cumberland showing the third highest
   801   Innes                     growth of all wards, with a 2,101 increase in population over the past two years.
   398   Capital                   Rideau-Goulbourn’s population also grew by more than 2,000.
   341   Osgoode
   164   Gloucester-Southgate      Ottawa showed a very slight increase in the percent of the population residing in
   105   Beacon Hill-Cyrville      rural wards (from 13.2% to 13.5%).
    36   Bay
    27   West Carleton-March
   -66   Knoxdale-Merivale                     In 2017, Ottawa had 416,217 households. As in 2016, Rideau-Vanier
   -76   River                                 had the most households with 28,317. West Carleton-March had the
  -157   Alta Vista                            fewest households with 9,129.
  -216   College
  -358   Orléans

                                                                                                   OTTAWA 2018 CLMP │ Page 9
2018 OTTAWA COMMUNITY LABOUR MARKET PLAN │ OTTAWA EMPLOYMENT HUB (LEPC)
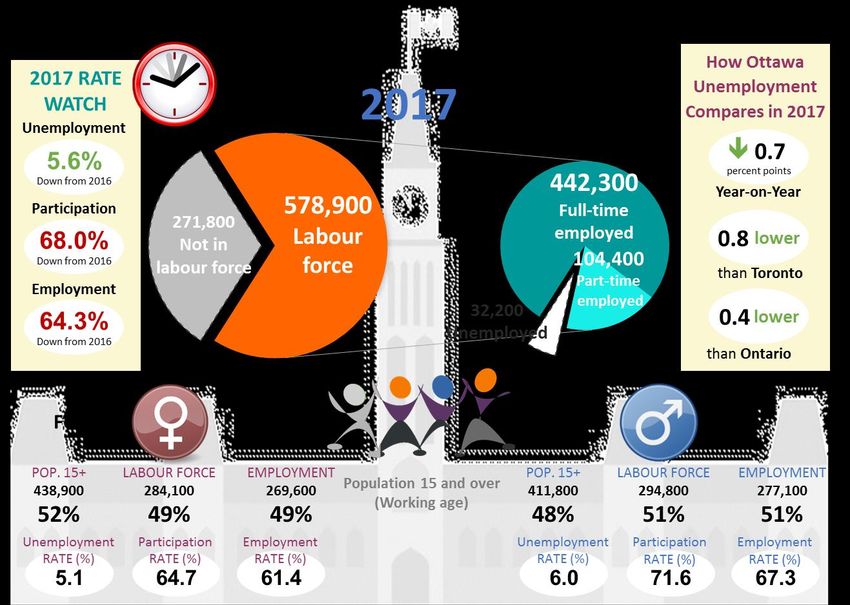
Labour pool and employment in Ottawa14
The graphic below pulls data from the Labour Force Survey (considered the most
COMMON DEFINITIONS
accurate source of employment/unemployment data for the time periods between
census surveys). Labour pool
Population 15 and over
(considered working age)
Labour force
Number of persons 15 years
of age and over who were
employed or unemployed
(actively looking for work)
Not in the labour force
Those of working age who
were neither employed nor
actively working for work
Unemployed
Number of persons who
were without work, had
looked for work in the past
four weeks, and were
available for work
A CLOSER LOOK AT EMPLOYMENT AND WORK ACTIVITY IN 201715 Unemployment rate
The percentage of the labour
force that is actively looking
for work (unemployed)
2017 Participation rate
2016 The percentage of the labour
Year-on-year
pool (pop. 15 years of age
543,400 0.6% increase 546,700 81%
and over) participating in the
ONTARIO ↑ 1.8% labour force
19%
Full-time Full-time Full-time Full-time Full-time Employment rate
The percentage of the labour
Part-time Part-time Part-time Part-time Part-time
pool (pop. 15 years of age
46% 54% 88% 12% 91% 9% 84% 16% 52% 48% and over) who are employed
Full-time employment
Persons who usually work 30
hours or more per week at
Full-time FEMALE MALE Full-time
their main or only job
Part-time Part-time
Part-time employment
75% 25% 86% 14% Persons who usually work
less than 30 hours per week
at their main or only job
Page 10 │ OTTAWA 2018 CLMP2018 OTTAWA COMMUNITY LABOUR MARKET PLAN │ OTTAWA EMPLOYMENT HUB (LEPC)
A CLOSER LOOK AT FIVE-YEAR TRENDS
Comparing Ottawa Population & Labour Force, 5 years16
2016 Census The increased population has generally tracked against employment numbers, while
and Labour the labour force and unemployment numbers fluctuated. This could speak to older
Force Survey Data workers exiting the labour force.
Census data is 900,000
836,800 850,700
814,800 825,300
considered more 802,800
OTTAWA
accurate than LFS overall
800,000
data due to 2006
increased sample 700,000
size. 2016 Census 5.8%
571,800 566,900 580,000 578,900
data shows 7.1% 600,000 559,600
2011
unemployment
rate, while 2016 6.9% 500,000 543,400 546,700
523,500 533,800 531,100
LFS data shows 2016
6.3% for 2016. 400,000
7.1% 2013 2014 2015 2016 2017
Population over 15 Labour force Employment
EMPLOYMENT AND UNEMPLOYMENT
Employment & training supports
Labour force status by age, Ottawa, 201618
38,640 unemployed workers in
In the Not in the Partici- Employ- Unemploy-
Ottawa in 2016; 14,196 were labour labour pation ment ment
Employment Ontario clients (37% force Employed Unemployed force rate rate rate
of unemployed population)17 15 to 24 83,850 69,080 14,765 47,655 63.8% 52.5% 17.6%
10,237 in Employment 25 to 34 114,650 106,320 8,330 15,985 87.8% 81.4% 7.3%
Service 35 to 44 114,440 109,335 5,100 14,305 88.9% 84.9% 4.5%
2,013 in Literacy and Basic 45 to 54 128,630 123,440 5,190 18,820 87.2% 83.7% 4.0%
Skills program 55 to 64 82,780 78,705 4,075 46,225 64.2% 61.0% 4.9%
1,528 new Apprenticeship 65 to 74 18,745 17,735 1,010 67,085 21.8% 20.7% 5.4%
registrations 75 and over 2,545 2,380 170 51,910 4.7% 4.4% 6.7%
418 in Second Career
program Unemployment rate by age and sex, Ottawa, 201619
OTTAWA 2018 CLMP │ Page 112018 OTTAWA COMMUNITY LABOUR MARKET PLAN │ OTTAWA EMPLOYMENT HUB (LEPC)
LABOUR POOL AND EMPLOYMENT FIVE-YEAR TRENDS
The Labour Force Survey is considered the most accurate source of LMI for the time
A closer look at unemployment
periods between census surveys. Over the past five years, Ottawa’s labour force has
trends over past five years
not kept pace with population increases, likely due to the aging population.
While the number of unemployed
Five-year trends, # of people in labour pool, labour force, employment, Ottawa20 has fluctuated, rates have tended
to decrease because of general
900,000 836,800 850,700 increases in the labour force.
814,800 825,300
802,800
800,000 Unemployment Rate
2013 36,100 6.5%
700,000 6.6%
2014 38,000
559,600 571,800 566,900 580,000 578,900 2015 35,800 6.3%
600,000
2016 36,600 6.3%
500,000 543,400 546,700
523,500 533,800 531,100 2017 32,200 5.6%
400,000
2013 2014 2015 2016 2017
Labour pool (pop. 15 and over) Labour force Employment
A SPOTLIGHT ON THE PAST YEAR
A closer look at
The chart below tracks month-to-month changes in Ottawa’s labour market over the the Labour Force
course of 2017. We see that both the labour force and employment generally trended Survey
downward until the final quarter (Oct. to Dec.) when there was a recovery in both. An
increase in employment in the first quarter meant that the lowest unemployment rate
Methodology
was seen in March (when only 5.0% of labour force participants were unemployed).
Conducted via telephone and
Meanwhile, July was the most difficult month for labour force participants (6.5%
in-person interviews. The
unemployment rate).
monthly LFS sample size is
approximately 56,000
Monthly labour force activity, Ottawa, 2017, seasonally adjusted 21
households nationwide,
585 7.5 resulting in the collection of
580
7
labour market information for
X1000 (seasonally adjusted)
575 approx. 100,000 individuals.
Unemployment rate (%)
6.5
570 6.5
6.1
565 5.9 Seasonally adjusted
5.7 5.8 5.8 5.8 5.9 5.7 6
560 Datasets that have been
555 5.5 adjusted to remove annually-
5.1 5
550 5.1 5 recurring fluctuations
545 attributable to climate and
4.5
540 regular events (e.g. vacations
535 4 and holiday seasons).
Seasonally unadjusted
Labour force Employment Unemployment rate Datasets that have not been
adjusted to account for
seasonal variations.
Page 12 │ OTTAWA 2018 CLMP2018 OTTAWA COMMUNITY LABOUR MARKET PLAN │ OTTAWA EMPLOYMENT HUB (LEPC)
COMPARATIVE TRENDS
A closer look at
commuting A closer look at unemployment rates show that while Ottawa consistently has lower
patterns22 unemployment than Ontario and Toronto, the gap is closing. For example, in 2013
Toronto’s rate was 1.6 higher than Ottawa’s, while this difference was only 0.8
Given that
percentage points in 2017.
Ottawa is part of the Ottawa-
Gatineau Census Metropolitan
Comparative five-year unemployment rate trends, Ottawa, Ontario, Toronto23
Area, it is important to
understand the commuter flow
between the two sides of the
provincial border.
93% of Ottawans with a
usual place of work stay in
Ottawa
5% (18,710) commute to
Gatineau from Ottawa
2% (10,010) commute
elsewhere outside Ottawa
37% of those residing in
Gatineau with a usual place
of work commute to Ottawa
OTHER WORKFORCE COMPARATORS OF INTEREST (Toronto and Ontario):
Quick Employed Workforce Facts24
Ottawa’s workers are less likely to use public transportation than workers in
20% use public transportation Toronto, and more likely than workers in Ontario overall (20% in Ottawa vs.
to get to work 24% in Toronto and 15% in Ontario)
8% are self-employed Ottawans who work full year, full time are less likely than those in Toronto
and Ontario overall to be self-employed (8% vs. 11% for Toronto and ON)
55% work full year, full time A slightly higher percentage of Ottawa’s employed labour force works full
27% use both English and year, full time (55%) than in Toronto and Ontario (both 52%)
French regularly at work Ottawa’s workers are much more likely than those in Toronto and Ontario to
regularly use both official languages in the workplace (27% vs. 2% and 5%
$52,798 average annual respectively)
income
Ottawa’s workers have a higher average annual income than those in
Toronto and Ontario ($52,798 vs. $51,801 and $47,369 respectively)
OTTAWA 2018 CLMP │ Page 132018 OTTAWA COMMUNITY LABOUR MARKET PLAN │ OTTAWA EMPLOYMENT HUB (LEPC)
Education Trends
EDUCATIONAL ATTAINMENT AND PROGRAMS OF STUDY25
A closer look at those with no post-
secondary completion
While a similar proportion of males
and females in the labour pool have
no post-secondary completion, the
unemployment rate of females with no
postsecondary completion is 0.9 points
higher than their male counterparts.
No Post-Secondary % of
Completion pool UE rate
Ottawa overall 37% 11.4%
Females 38% 11.8%
Males 36% 10.9%
Program of Study
Males more likely to have STEM
Programs of study and work status26 education and more likely to have a
The table below shows the # of those over 15 with and without trades postsecondary completion
postsecondary credentials in Ottawa, as well as field of study for those with Females Males
postsecondary credentials. It also looks at the percentage of those individuals No postsecondary
working at the time of the 2016 Census. 36% completion
38%
Postsecondary
educational # Employed % Employed
9% STEM 22%
Field of study attainment 55% BHASE (non-STEM) 40%
Females Males Females Males Females Males Overall
Trades, services,
Total (all levels of
417,360 390,260 249,570 257,425 60% 66% 63% 6% natural resources…
11%
education)
No postsecondary
certificate, diploma or 150,335 147,165 63,320 78,870 42% 54% 48% A closer look at gender gaps
degree
Males have a higher rate of
STEM 36,850 86,420 26,265 63,910 71% 74% 73% employment than females across
Science and science
technology
17,640 17,155 12,485 11,470 71% 67% 69% six fields; the biggest gap is in
Engineering and Mathematics and computer
8,585 45,895 6,230 33,560 73% 73% 73%
engineering technology information & science (10 points)
Mathematics and
Females have a higher rate of
computer and information 10,625 23,370 7,545 18,880 71% 81% 78%
science employment across two fields; the
BHASE (non-STEM) 230,180 156,680 159,985 114,645 70% 73% 71% biggest gap is in Science & science
Business and technology (4 points)
51,950 41,090 36,355 31,020 70% 75% 72%
administration Employment rates are equal for
Arts and humanities 31,120 20,360 20,115 14,135 65% 69% 67% males and females with
Social and behavioural Engineering and engineering
sciences
46,775 28,695 35,275 21,645 75% 75% 75%
Legal professions and
technology and Social and
studies
8,910 5,395 6,900 4,060 77% 75% 77% behavioural sciences credentials
Health care 45,020 9,965 30,315 7,580 67% 76% 69%
Education and teaching 21,935 6,335 13,670 4,010 62% 63% 63%
Trades, services, natural
resources and conservation
24,465 44,845 17,360 32,190 71% 72% 71%
Page 14 │ OTTAWA 2018 CLMP2018 OTTAWA COMMUNITY LABOUR MARKET PLAN │ OTTAWA EMPLOYMENT HUB (LEPC)
REGIONAL PROGRAM COMPLETIONS (2014)27
There is a delay in sharing education data. 2014 completions is the most recent data
A closer look at post-secondary
available (note that it includes those who graduated in spring 2015).
graduation numbers
More people are graduating from Regional Completions, Post-Secondary Public Institutions, 2014, Ottawa
Ottawa’s post-secondary Basic Career,
institutions every year, with an education technical or
Total
increase of 18% over the past and skills pre-university Bachelor’s Master’s Doctors
five years: in 2014 Institution program program Degree Degree Degree
University of
9,705 0 0 7,695 1,805 205
2010 20,124 Ottawa
Algonquin
2011 21,741 7,499 0 7,303 70 0 0
College
2012 22,982 Carleton
2013 23,331 5,366 University
0 18 4,095 1,118 134
2014 24,436 1,561
Cité Collégiale
4 1,545 12 0 0
Université
215 Saint-Paul
0 0 62 144 9
24,436* TOTAL 4 8,908 11,982 3,068 348
* Total includes 72 completions from University of Guelph - Kemptville College of Agricultural Technology
A closer look at post-secondary TOP PROGRAMS (number of completions in 2014)28
graduation numbers The table below shows the percentage change in completions over the past three years for
Below we show the # of 2017 jobs (in the top ten programs. All of these programs were also in the top ten for 2013, except for
occupations related to the program) Security and protective services.
and the 2015-17 job growth rate for
the top ten programs Regional Completions, Post-Secondary Public Institutions, 2011 to 2014, Ottawa
Business, management, Total TOP TEN PROGRAMS Change % Change
marketing and related support in 2014 (# of completions) 2011 2012 2013 2011 -14 2011-14
services 246,355 (4%) Business, management,
Social sciences 59,033 (19%) 3,007 marketing and related 2,647 2,662 2,782 360 14%
support services
Health professions and related Social sciences
2,477 2,104 2,388 2,387 373 18%
programs 100,406 (7%)
Health professions and
Education 54,561 (6%) 2,339 related programs
1,722 1,768 1,694 617 36%
Engineering 54,260 (-4%) 1,653 Education 1,735 1,684 1,652 -82 -5%
Legal professions and studies Engineering
1,383 917 1,011 1,129 466 51%
10,580 (11%) Legal professions and
Psychology 3,997 (85%) 1,221 studies
1,092 1,186 1,261 129 12%
Engineering technologies and 1,025 Psychology 910 911 957 115 13%
engineering-related fields Engineering technologies
76,599 (-5%) 1,024 and engineering-related 739 750 858 285 39%
fields
Communication, journalism and
Communication,
related programs 25,492 (-4%) 1,015 journalism and related 857 903 869 158 18%
Security and protective services programs
13,324 (-5%) Security and protective
810 services
690 768 668 120 17%
OTTAWA 2018 CLMP │ Page 152018 OTTAWA COMMUNITY LABOUR MARKET PLAN │ OTTAWA EMPLOYMENT HUB (LEPC)
Immigrant and newcomer labour pool in Ottawa
Ottawa’s immigrant labour pool of
208,695 has 132,200 participants
in the labour force (a participation
rate of 63.3% versus 69.4% for non-
Immigrants).29
A closer look at the Immigrant labour
force in Ottawa (showing those who
arrived between 1980 and 2016)30
EMPLOYMENT AND UNEMPLOYMENT
Employment & training supports33
Labour force status by age, Immigrant population, Ottawa, 201631
In the Not in the Partici- Employ- Unemploy- 10,635 unemployed immigrants in
labour labour pation ment ment Ottawa in 2016; 2,002 newcomers*
force Employed Unemployed force rate rate rate were Employment Ontario clients
15 to 24 9,520 7,260 2,265 8,640 52.4% 40.0% 23.8% *EO uses the term ‘newcomer’ which
25 to 34 21,855 19,665 2,185 5,045 81.2% 73.1% 10.0% does not include all immigrants; EO
newcomer data shown below
35 to 44 31,335 29,110 2,230 6,005 83.9% 77.9% 7.1%
45 to 54 38,370 36,290 2,085 6,635 85.3% 80.6% 5.4% 1,584 in Employment Service
55 to 64 23,590 22,185 1,405 10,190 69.8% 65.7% 6.0% 358 in Literacy and Basic Skills
65 to 74 6,605 6,220 385 20,255 24.6% 23.2% 5.8% program
75 and over 4.5% 4.1% 9.2% 31 in Apprenticeship
920 840 85 19,725
29 in Second Career program
Unemployment rate by age, Immigrant population vs. Overall, Ottawa, 201632
A closer look at landing periods34
Unemployment rates decrease
for immigrants in Canada longer
Before 1981 4.6%
1981 to 1990 4.9%
1991 to 2000 7.1%
2001 to 2005 9.3%
2006 to 2010 11.3%
2011 to 2016 15.1%
Page 16 │ OTTAWA 2018 CLMP2018 OTTAWA COMMUNITY LABOUR MARKET PLAN │ OTTAWA EMPLOYMENT HUB (LEPC)
EDUCATIONAL ATTAINMENT AND PROGRAMS OF STUDY
A closer look at those with no post-
100%
secondary completion35
90%
The immigrant unemployment (UE) 9,150
80% 16,810
rate is similar to that of the overall 70% 20,475
population when looking at those 60% 23,155 8,175
with no postsecondary credentials. 50% 9,795 2,075
40% 6,435 2,270
No Post-Secondary % of 30% 855 9,225
Completion pool UE rate 10,110
20% 4,755 8,375
Ottawa overall 37% 11.4% 10% 835 7,530 7,675
2,350 3,610
Immigrants 33% 12.6% 0% 1,020
Economic - Principal Economic - Secondary Sponsored by family Refugees
Economic (Primary) 10% 3.4% applicants applicants
Economic
30% 18.8% University certificate, diploma or degree at bachelor level or above
(Secondary) College, CEGEP or university certificate or diploma below bachelor
Sponsored by Apprenticeship or trades certificate or diploma
38% 9.5%
Family Secondary (high) school diploma or equivalency certificate
Refugees 47% 13.7% No certificate, diploma or degree
Immigrants by Program of Study36 Programs of study and work status
Immigrants are more likely to have The table below shows the # of immigrants with and without postsecondary
STEM education and less likely to credentials in Ottawa, as well as field of study for those with postsecondary
have a trades completion credentials. It also looks at the percentage of those individuals working at the time
Immigrants Ottawa overall of the 2016 Census and compares that to the overall Ottawa population.
No postsecondary Postsecondary
#
33% certificate, diploma 37% educational % Employed
attainment
Employed
or degree Field of study
Ottawa
22% STEM 15% Immigrants Immigrants Immigrants
overall
BHASE (non- Total (all levels of education) 208,695 121,565 58% 63%
45% STEM)
48%
No postsecondary certificate,
Trades, services, 68,670 27,920 41% 48%
diploma or degree
7% natural resources 9% STEM 46,195 32,700 71% 73%
and conservation Science and science technology 11,600 7,290 63% 69%
Engineering and engineering
A closer look at gaps in % working 22,045 15,680 71% 73%
technology
Mathematics and computer
For those with trades-related 12,550 9,725 77% 78%
and information science
education, the employment BHASE (non-STEM) 93,830 60,940 65% 71%
rate of immigrants is 11
Business and administration 25,490 17,850 70% 72%
percentage points lower than
for the overall population Arts and humanities 12,100 6,845 57% 67%
The gap for those in non-STEM, Social and behavioural sciences 16,380 10,950 67% 75%
which includes trades, was 6 Legal professions and studies 2,855 1,940 68% 77%
points, with the smallest gap
Health care 16,475 11,230 68% 69%
seen in Health care (1%)
The gap for those with STEM Education and teaching 6,425 3,615 56% 63%
credentials is 2%, with a 1% gap Trades, services, natural
14,100 8,520 60% 71%
in Mathematics and computer resources and conservation
and information science
OTTAWA 2018 CLMP │ Page 172018 OTTAWA COMMUNITY LABOUR MARKET PLAN │ OTTAWA EMPLOYMENT HUB (LEPC)
WHERE IMMIGRANTS WORK IN OTTAWA (Industry Sectors)37 2016 Share of sector jobs (average 24%):
48-49 Transportation and
The chart below and table included here show the industry sectors with 31% warehousing
more than 1,000 overall jobs in Ottawa; the chart shows the # of 30% 31-33 Manufacturing
immigrants working in the sector at the time of the 2016 Census (May 62 Health care and social
30%
2016) and the table shows the share of immigrants in the sector. assistance
72 Accommodation and food
29% services
81 Other services (except public
28% administration)
54 Professional, scientific and
27% technical services
56 Administrative and support,
27% waste management …
24% 52 Finance and insurance
24% 41 Wholesale trade
51 Information and cultural
23% industries
23% 61 Educational services
53 Real estate and rental and
22% leasing
20% 44-45 Retail trade
20% 91 Public administration
16% 23 Construction
15% 22 Utilities
71 Arts, entertainment and
14% recreation
11 Agriculture, forestry, fishing
14% and hunting
WHAT IMMIGRANTS DO IN OTTAWA (Occupations)38
2016 Share of occupation group jobs
These figures show # and share of immigrant workers by occupation group at
(average 24%):
the time of the 2016 Census (where occupation group was identifiable).
36% 9 Manufacturing and utilities
2 Natural and applied sciences
33% and related
33% 3 Health occupations
25% 6 Sales and service
4 Education, law and social,
22% community and government
services
7 Trades, transport and
21% equipment operators and related
20% 0 Management
1 Business, finance and
20% administration
5 Art, culture, recreation and
17% sport
8 Natural resources, agriculture
11% and related production
Page 18 │ OTTAWA 2018 CLMP2018 OTTAWA COMMUNITY LABOUR MARKET PLAN │ OTTAWA EMPLOYMENT HUB (LEPC)
Skill level of intended occupation (2017) 2017 INTENDED OCCUPATIONS OF NEW PERMANENT RESIDENTS40
Of those who plan to work: Newly admitted permanent residents that specified an intended occupation in
11% plan to work in a 2017 (note that this data does not include Refugees)
Managerial position # of new permanent
TOP TEN Intended Occupations (Ottawa) residents intending to work
61% plan to work in a Skill Level
A occupation (usually requires Software engineers and designers 180
university education) Computer programmers & interactive media developers 80
26% plan to work in a Skill Level Information systems analysts and consultants 75
B occupation (usually requires Electrical and electronics engineers 50
college education or University professors and lecturers 40
apprenticeship training) Computer engineers (except software engineers and designers) 35
2% plan to work in a Skill Level C Electrical and electronics engineering technologists and 30
occupation (usually require technicians
secondary school and/or User support technicians 30
occupation-specific training) Administrative assistants 25
None plan to work in a Skill Retail and wholesale trade managers 20
Level D occupation (on-the-job
training is all that is required)
2016 IMMIGRANT EMPLOYMENT (by Occupation)41
Occupations with the most immigrants Highest share of immigrants
Highest number of immigrants *occupations with 500+ overall jobs
Information systems analysts and Information systems analysts Electronics assemblers,
3,625 and consultants fabricators, inspectors & testers 79%
consultants top the list with
Taxi and limousine drivers and
3,625 immigrants. 3,430 Light duty cleaners 72%
chauffeurs
3 of the top 10 occupations fall in Nurse aides, orderlies and Nurse aides, orderlies and patient
the Sales & service category; 3 3,275 patient service associates service associates 60%
fall in Natural & applied sciences. 3,270 Retail salespersons Light duty cleaners 55%
Computer programmers and
Highest share of immigrants 2,965 interactive media developers
Software engineers & designers 51%
2,885 Software engineers & designers Pharmacists 51%
Immigrants hold 79% of Electronics Food counter attendants,
assemblers, fabricators, inspectors Estheticians, electrologists and
2,605 kitchen helpers and related
related occupations 50%
& testers jobs. support occupations
Occupations split between low 2,255
Retail and wholesale trade
Dentists 49%
paying and highly skilled, perhaps managers
Registered nurses and University professors and
reflecting immigration policy 2,235 registered psychiatric nurses lecturers 46%
around refugees and skilled Computer engineers (except
workers. 1,955 Administrative officers
software engineers & designers) 46%
Those in bold made both lists.
OTHER WORKFORCE COMPARATORS OF INTEREST:
Quick Employed Workforce Facts39
Immigrant workers are more likely than the overall employed
24% use public transportation to workforce to use public transportation to get to work (24% vs. 20%)
get to work Immigrant workers are more likely to be self-employed (10% vs. 8%)
10% are self-employed Immigrant workers are slightly less likely to work full year, full time (51%
51% work full year, full time of employed immigrants vs. 55% of overall employed)
17% use both English and French Immigrant workers are less likely to regularly use both official languages
regularly at work in the workplace (17% vs. 27%)
$49,441 average annual income Immigrant workers have a lower average annual income ($49,441 vs.
$52,798)
OTTAWA 2018 CLMP │ Page 192018 OTTAWA COMMUNITY LABOUR MARKET PLAN │ OTTAWA EMPLOYMENT HUB (LEPC)
Persons with disabilities (PWDs) labour pool
Data for persons with disabilities is collected via the Canadian Survey on Disability (see Ottawa’s population of persons with
note below). There is more data available at the provincial and national levels than the disabilities aged 15-64 in 2012
local level – thus, we look at all thee geographies in this section. included a labour pool of 73,100
OTTAWA (11% of the overall 15-64 labour
pool), of which 45,900 were
participating in the labour force (8%
of the overall 15-64 labour force and
representing a participation rate of
63% versus 81% for the overall
population).43
*See note to the left for an explanation
of why we look at 2012 data.
Employment & training supports44
1,193 persons with disabilities
accessed Employment Ontario
services in 2016-17
630 in Employment Service
254 in Literacy and Basic Skills
program
197 in Employment Assistance
Service
92 in Youth Job Connection
20 in Second Career
None in Apprenticeship
Highlights from the Social Planning Council of Ottawa’s ‘Disability Profile of the City of
Ottawa’ (2006 data) Ages 20-64,Ottawa, 2006 %
In 2010, SPCO published a report42 on people with disabilities living in Ottawa, based on % reporting disability (of
2006 Census data. As noted above, Statistics Canada warns that disability data collected overall population)
16%
from the Census based on its activity limitation questions should be used with caution due Participation rate 63%
to the large number of ‘false positives’ (i.e. over-counting). Any data collected this way Unemployment rate 7%
should not be compared to the Canadian Survey on Disability (CSD), which uses a % of Full-time/full-year
different methodology. Given the limited local data available from the CSD, however, the PWDs workers that were
comprehensive SPCO report is useful for providing some general insight into what the working poor (ages 25-
6%
local labour market for people with disabilities looked like in 2006. It found that 85,700 64)
people aged 20-64 (16%) reported having a disability in 2006. Some highlights from the 57%
report are included in the table to the right. Not in labour force (vs. 31%
overall)
Highlights from United Way Ottawa’s analysis of 2011 Census data
United Way Ottawa conducted an analysis of data from the 2011 Census, using the Ages 15+, Ottawa, 2011 %
activity limitations questions as a filter (same methodology as the SPCO report cited % reporting disability (of
overall population)
20%
above). The two main differences between the United Way analysis and the SPCO report
are that United Way looked at 2011 data (instead of 2006) and looked at the entire 15+ Participation rate 45%
age bracket (rather than breaking it down to look at 20-64). The two datasets should not Unemployment rate 8%
be compared, as a greater portion of those 65+ have a disability than those under 65, and 55%
so the labour market indicators in the United Way data will be more negative. Highlights Not in labour force (vs. 30%
from the United Way analysis are included in the table to the right. overall)
Page 20 │ OTTAWA 2018 CLMP2018 OTTAWA COMMUNITY LABOUR MARKET PLAN │ OTTAWA EMPLOYMENT HUB (LEPC)
ONTARIO
A closer look at labour force status
Labour force status by age, PWDs, Ontario, 201245
In the Employed Unemployed Not in the Partici- Employ- Unemploy 46% employment rate for 15- to
labour labour force pation ment -ment 64-year-olds with disabilities;
force rate rate rate 73% for the population without
15 to 24 87,700 22,670 9,900 47,830 40.5% 28.2% 30.4% disabilities
25 to 34 103,160 49,480 N/A 43,630 57.0% 48.7% N/A Labour force status varies by
35 to 44 174,230 83,160 N/A 48,910 68.8% 53.1% N/A severity of the disability;
45 to 54 295,510 147,400 13,130 116,980 57.9% 53.1% 8.2% specifically, the percentage
55 to 64 374,490 130,100 12,510 191,910 42.6% 38.9% 8.8% employed decreases as the
CAUTION: Statistics Canada warns that this data should be used with caution, due to global severity class increases
reliability issues; also, all rates in the table are calculated excluding non-response
categories ("refusal", "don't know", and "not stated") in the denominator
CANADA
Employment rate by age, PWDs vs. those without disabilities, Canada, 201246
Lower rates of employment
Looking at the prime working
ages of 25 to 54, PWDs have
notably lower rates of
employment than those without
disabilities
The gap is greatest for men aged
25-34 (34 percentage point gap
in employment rate)
NOTE: At this level of analysis, much of the unemployment data collected via the CSD is
considered unreliable. For that reason, we look at the employment rate in this chart.
Labour force breakdown by disability type, Canada, 201247
Disability type Total labour % of overall Participation Employment 10% of all Canadians in the
force labour force rate rate labour force report having at
Overall population 23,187,350 100% 81% 76% least one disability
All disability types 2,338,240 10% 54% 47% The most common type of
Seeing 472,220 2% 45% 38% disability of those in the labour
Hearing 424,840 2% 56% 48% force is Pain (7% of overall
1,083,500 5% 42% 36%
Canadian labour force)
Mobility
Persons reporting having a
Flexibility 1,244,570 5% 45% 39%
Developmental disability have
Dexterity 575,520 2% 38% 32%
the lowest participation (28%)
Pain 1,706,080 7% 53% 46% and employment (22%) rates
Learning 490,230 2% 37% 29% of all disability types
Memory 410,160 2% 38% 31% Those with a Hearing disability
Developmental 141,500 1% 28% 22% have the highest participation
Mental &/or psychological 852,910 4% 45% 36% (56%) and employment (48%)
rates of all disability types
OTTAWA 2018 CLMP │ Page 212018 OTTAWA COMMUNITY LABOUR MARKET PLAN │ OTTAWA EMPLOYMENT HUB (LEPC)
WHERE PWDs WORK IN CANADA (Industry Sectors)48 2012 Share of sector jobs (average 9%)52:
The chart below and table to the right show the employment of persons 56 Administrative and support,
with disabilities aged 15-64 in industry sectors across Canada; the chart 17% waste management and
remediation services
shows the # of PWDs working in the sector at the time of the 2012
11% 44-45 Retail trade
Canadian Survey on Disability and the table shows the share of PWDs. 48-49 Transportation and
11% warehousing
11% 71 Arts, entertainment & rec.
62 Health care and social
10% assistance
51 Information and cultural
10% industries
81 Other services (except public
9% administration)
9% 53 Real estate & rental & leasing
9% 31-33 Manufacturing
9% 23 Construction
72 Accommodation and food
8% services
8% 61 Educational services
11 Agriculture, forestry, fishing
7% and hunting
7% 41 Wholesale trade
7% 91 Public administration
54 Professional, scientific and
6% technical services
21 Mining, quarrying, and oil and
6% gas extraction
5% 52 Finance and insurance
5% 22 Utilities
55 Management of companies
N/A and enterprises
WHAT PWDs DO IN CANADA (Occupations)49
These figures show # and share of PWDs by occupation group at the time of
2012 Share of occupation group jobs
the 2012 CSD (where occupation group was identifiable).
(average 9%)53:
11% 9 Manufacturing and utilities
11% 6 Sales and service
5 Art, culture, recreation and
10% sport
7 Trades, transport and
9% equipment operators and related
8 Natural resources, agriculture
9% and related production
8% 3 Health
1 Business, finance and
8% administration
4 Education, law and social,
8% community and government
services
2 Natural and applied sciences
7% and related
6% 0 Management
Page 22 │ OTTAWA 2018 CLMP2018 OTTAWA COMMUNITY LABOUR MARKET PLAN │ OTTAWA EMPLOYMENT HUB (LEPC)
Modifications for labour force participation for adults with disabilities, 201250
The most common type of work
modification needed by PWDs in
Canada is reduced work hours –
while 71% who need this
modification have had it made
available to them, 80,870 (29%)
have not
Other common types of
modifications required include
special chair and/or back support,
job redesign, and modified and/or
ergonomic work station
*NOTE: There was insufficient data
to determine the number of people
that need ‘handrails, ramps and/or
widened doorways’ and ‘adapted
washrooms’ and that HAVE NOT
had these modifications made
available to them
Educational attainment and impact of disability on labour force participation51
Even when the differences in age
composition of the two populations
were taken into account, persons
with disabilities were less likely than
persons without disabilities to be
high school or university graduates
Just under half (45%) of 25- to 64-
year-olds with disabilities whose
condition existed prior to school
completion reported that the
condition influenced their choice of
courses and careers
27% of workers with disabilities
indicated that their employer was
not aware of their limitation
Among those with current or recent
labour force experience: 43%
considered themselves to be
disadvantaged in employment
because of their condition, and 44%
felt that their current employer
would be likely to consider them
disadvantaged in employment
because of their condition
OTTAWA 2018 CLMP │ Page 232018 OTTAWA COMMUNITY LABOUR MARKET PLAN │ OTTAWA EMPLOYMENT HUB (LEPC)
Self-reported median total income, persons with disabilities vs. persons without
disabilities, Canada, 201254
PWDs earn less, with the greatest
wage gap being seen in the 25 to
44 and 45 to 64 age categories
(where people with disabilities
make 57% and 56% of those
without disabilities, respectively)
Among 15- to 64-year-olds with
disabilities, self-reported income
decreased sharply at higher levels
of global severity.
Regardless of age, men with
disabilities reported significantly
higher median total incomes than
did women with disabilities
“Persons with Disabilities in the Canadian Labour Market: An Overlooked Talent Pool”
In March 2013, the Library of Parliament published a Background Paper that stated that many barriers contribute to the
employment gap for people with disabilities; the following barriers were identified:
Many people with disabilities lack access to education and training, and are not job-ready
The social isolation of numerous people with disabilities limits their encounters with key contacts and their
knowledge of opportunities to enter the workforce or access training
Some employers have negative attitudes and misconceptions with regard to people with disabilities, which can lead to
discriminatory practices; many such employers are unaware of the capacity and abilities of people with disabilities in
the workforce
Workplaces can be inaccessible, not only due to their physical location but also, for example, when it comes to a lack
of workplace tools, “enabling” computer hardware and software, websites, etc.
Employers lack knowledge about disability issues, including the duty to accommodate, how to accommodate and the
cost of accommodations
There are not enough recruitment and outreach strategies to make contact with people with disabilities
Barriers tend to be greater in the private sector: “Barriers to employment can arise in both the private and public
sectors. However, the two work environments are very different from one another. The public sector has the
financial resources necessary to provide accommodations for people with disabilities, as well as policies to
encourage their increased representation, such as the federal Employment Equity Act. Small and medium-sized
businesses in the private sector face greater challenges when it comes to ensuring accessibility or accommodations,
often due to limited resources.”
Challenges often greater for women: “Women with disabilities are three times more likely than men with disabilities
to be a lone parent, and even slightly more likely to be in that situation than women without disabilities. This
precarious financial situation can limit their ability to accept a job opportunity that involves uncertainty, part-time
work and so on. Other differences include lower average income levels in comparison to men with disabilities, as
well as unstable work patterns.”
Page 24 │ OTTAWA 2018 CLMP2018 OTTAWA COMMUNITY LABOUR MARKET PLAN │ OTTAWA EMPLOYMENT HUB (LEPC)
Indigenous labour pool in Ottawa
Aboriginal identity population in
Ottawa includes a labour pool of
20,060, of which 13,840 were
participating in the labour force (a
participation rate of 69% versus
67.6% for non-Aboriginal identity).
*Note that the Census under-reports
Aboriginal identity.
A closer look at the Indigenous
labour force in Ottawa55
EMPLOYMENT AND UNEMPLOYMENT Employment & training supports58
Labour force status by age, Aboriginal identity population, Ottawa, 201656 1,335 unemployed Indigenous
people in Ottawa in 2016; 290 were
In the Employed Unemployed Not in the Partici- Employ- Unemploy
labour labour pation ment -ment rate Employment Ontario clients (22% of
force force rate rate unemployed)
15 to 24 2,665 2,135 535 1,570 62.9% 50.4% 20.1% 212 in Employment Service
25 to 34 3,490 3,205 285 730 82.6% 75.9% 8.2% 48 in Literacy and Basic Skills
35 to 44 2,790 2,575 215 570 82.9% 76.5% 7.7% program
45 to 54 2,910 2,745 165 775 79.0% 74.5% 5.7% 30 in Apprenticeship
55 to 64 1,690 1,575 115 1,220 58.1% 54.1% 6.8% No Indigenous clients in Second
65 to 74 255 235 20 910 21.9% 20.2% 7.8% Career program
75 and over 30 30 0 450 6.2% 6.2% 0.0%
A potential gender gap for educated
Unemployment rate by age, Aboriginal Identity vs. Overall, Ottawa, 2016 57 Indigenous women
The unemployment rate for
25.0 22.7
Indigenous women with university
19.3
20.0 17.5 degrees is higher than for their male
16.0
15.0
counterparts (6.8% versus 4.9%).
11.5 This could indicate a gender gap in
9.0 8.6 8.9
10.0 7.8 7.5
6.7 6.8 6.5 6.65.5 7.6 5.5
the ability to leverage academic
5.3
4.0 4.94.1
4.9 4.3 5.2
5.0
4.0 credentials to obtain appropriate
0.0 0.0 0.0 employment and could help explain
0.0
15 to 24 years 25 to 34 35 to 44 45 to 54 55 to 64 65 to 74 75 and over
the higher unemployment rate for
women in the 35 to 44 age group.
Aboriginal identity Ottawa overall Aboriginal identity Ottawa overall
Males Females
OTTAWA 2018 CLMP │ Page 25You can also read