Working migrant women in 12 states - An analysis of the socio-economic situation of
←
→
Page content transcription
If your browser does not render page correctly, please read the page content below
An analysis of the
socio-economic situation of
working migrant
women in 12 states
of India MAY 2021
This report was prepared by
the Policy Unit at UNDP India.
The authors include
Basudeb Guha-Khasnobis,
Suvir Chandna, Jaimon Uthup,
Digvijay Singh and Upasana Sikri.
Coordination support by:
Pallavi Kashyap
Photograph credits:
Abhir Avasthi, Biju Boro,
Dhiraj Singh and Gaganjit Singh
(UNDP India), Shaishavi Project
Consultants Pvt. Ltd., Action for
Social Advancement and ANTS
Consulting Services Pvt. Ltd.
Design credit:
Grasshoppers India Pvt. Ltd.

UNDP is the leading United
Nations organization fighting to
end the injustice of poverty,
inequality, and climate change.
Working with our broad network
of experts and partners in 170
countries, we help nations to
build integrated, lasting
solutions for people and planet.
Learn more at undp.org or
follow at @UNDP.
Contents
List of Acronyms                                                              01
Executive summary                                                             02
Chapter 1: Introduction                                                       04
Chapter 2: Survey details                                                     06
Chapter 3: Demographic indicators                                             09
•   Age and size of household                                                 09
•   Social category                                                           10
•   Education status                                                          10
Chapter 4: Social indicators                                                  14
•   Interstate and intrastate migrants                                        14
•   Household responsibilities during COVID-19                                15
Back to the field: Uncertain livelihoods during unprecedented times            17
Chapter 5: Economic indicators                                                19
•   Lay-offs due to COVID-19                                                   19
•   Job category in February 2020 and December 2020                           20
•   Contribution of women migrant workers to household income                 21
•   Average monthly incomes (household and individual) in February, July      21
    and November 2020
•   Average monthly incomes (individual) in February and November 2020        23
    (by job category)
•   Average monthly incomes (individual) in February, July and                24
    November 2020 (by state)
•   Average monthly income (individual) in February, July and November 2020   24
    (interstate and intrastate migrants)
•   Debt obligations                                                          25
Reverse migration: An expensive endeavour                                     27
Chapter 6: Social protection indicators                                       29
• Food security                                                               30
Livelihoods and unpaid care work: The double burden of the pandemic           33
• Mahatma Gandhi National Rural Employment Guarantee Act                      34
• Financial Support                                                           35
• Digital infrastructure                                                      37
• Other schemes                                                               39
Chapter 7: Migrant women workers and their children                           41
•   Anganwadi services                                                        41
•   Mid-day meals                                                             42
Chapter 8: Domestic violence indicators                                       45
Chapter 9: Regression analysis                                                48
•   Debt in December 2020                                                     49
•   PMJDY account ownership                                                   50
Chapter 10: Summary of findings                                                52
Chapter 11: Policy messages                                                   55
Appendix                                                                      57
References                                                                    66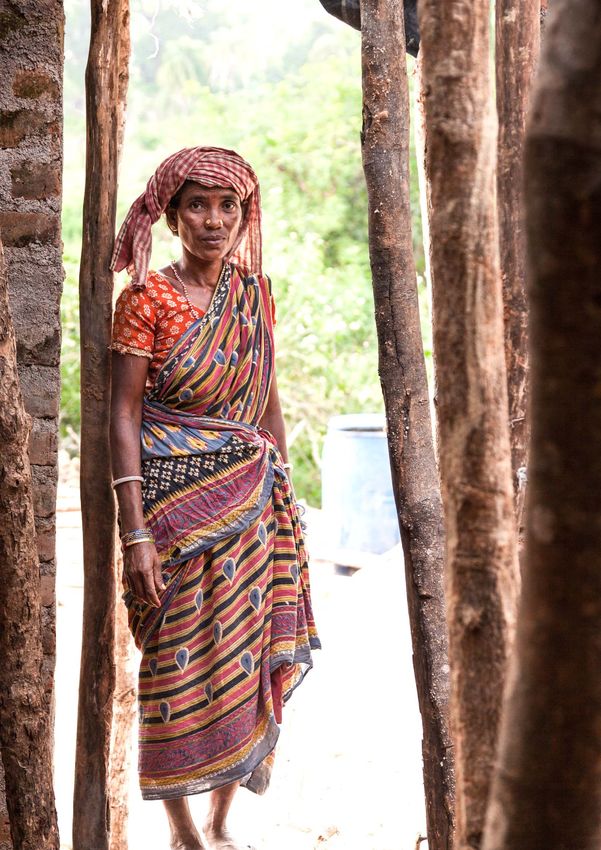
Figure                                                        Table
Figure-1: Age distribution of the respondents            09   Table-1: States covered by the survey                   7
Figure-2: Distribution of respondents by                 10   Table-2: Increase in childcare burden due to school   16
social category                                               closures
Figure-3: Educational qualifications by social category   11   Table-3: Contribution of male members in household 16
                                                              chores since the pandemic
Figure-4: Job category in December 2020 by               12
educational qualification                                      Table-4: Lay-offs due to COVID for women               20
                                                              migrant workers
Figure-5: Distribution of interstate and intrastate      14
women migrant workers by state                                Table-5: Income share of women migrant workers        21
                                                              in household income
Figure-6: Percentage of women migrant workers            15
                                                              Table-6: Monthly incomes for interstate and           24
reporting an increase in unpaid care work during
                                                              intrastate migrants (in rupees)
the pandemic
                                                              Table-7: Debt in February 2020 and December 2020 25
Figure-7: Seasonal work makes migrant workers            17   Table-8: Social protection schemes for women          29
one of the most vulnerable cohort in society.
                                                              Table-9: Reasons for not accessing the PDS             31
Figure-8: Change in job category from                    20
                                                              Table-10: Women replaced by male member in            34
February 2020 to December 2020
                                                              MGNREGA work
Figure-9: Average household and monthly incomes          22   Table-11: MGNREGA benefits for those who               34
in February, July and November 2020                           returned home during the pandemic
Figure-10: V-shaped recovery in income (by job           23   Table-12: MGNREGA benefits for respondents who         35
category in February 2020)                                    were laid off due to COVID-19 by job in December 2020
Figure-11: State-wise average of individual              24   Table-13: Average recovery in income from July to     36
monthly income                                                November 2020 for respondents with and without
Figure-12: Proportion of people reported repaying        25   PMJDY account
debt using this as one of the means of repayment              Table-14: Anganwadi service delivery during            41
Figure-13: Debt in December 2020 for the                 26   September 2020 - December 2020
subset that had a PMJDY account                               Table-15: Mid-day meal service delivery during        42
Figure-14: Migrant workers returned to their home        27   September-December 2020
towns hoping to return back to work in 2021                   Table 16: Awareness about an acquaintance's           45
Figure-15: Ration card usage                             31   experience of domestic violence
                                                              Table-17: Respondent's experience of domestic         46
Figure-16: Reason for not using ration card during       31
                                                              violence
the lockdown
                                                              Table-18: Average individual income disaggregated     49
Figure-17: State-wise reasons for not using PDS          32   by educational qualifications (in rupees)
Figure-18: Working migrant women face the                33   Table A1: Agencies commissioned by UNDP to            57
double burden of earning a livelihood for their               conduct the survey in 12 Indian states
families and unpaid care work
                                                              Table A2: State-wise distribution of interstate and   57
Figure-19: Ownership of PMJDY accounts                   35   intrastate migrants in the sample
Figure-20: State-wise PMJDY account ownership            36   Table A3 : Distribution of educational qualifications  58
Figure-21: Percentage of women migrant with PMJDY        37   Table A4: Household responsibilities                  58
accounts who received INR 1,500 under PMGKY                   Table A5: Increase in debt since February 2020        58
Figure-22: Percentage of women migrant workers           38   Table A6: Stress due to household responsibilities    58
who reported having access to the internet                    Table A7: Jobs in February 2020 and December 2020 59
Figure-23: Use of internet facilities                    38   Table A8: Use of ration card                          59
Figure-24: State-wise internet access                    39   Table A9: State-wise MGNREGA benefits (in percent) 59
Figure-25: State-wise Anganwadi service delivery         42   Table A10: State-wise PMJDY ownership (in percent) 60
during September-December 2020                                Table A11: State-wise internet access (in percent)    60
Figure-26: State-wise mid-day meal service delivery      43   Table A12: Respondents who received benefit under 60
during September-December 2020                                the Widow Pension Scheme during the pandemic
Figure-27: Awareness about sources for help when         46   Table A13: Pregnant members of the respondent's       60
faced with domestic violence                                  family who received maternity benefits under
                                                              government schemes during the pandemic
                                                              Table A14: State-wise government health insurance     61
                                                              (in percent)
                                                              Table A15: State-wise distribution of Anganwadi       61
                                                              services (in percent)
                                                              Table A16: Respondents who reported receiving         61
                                                              mid-day meal service between September and
                                                              December 2020, State-wise disaggregation (in percent)
                                                              Table A17: Logistic Regression                        62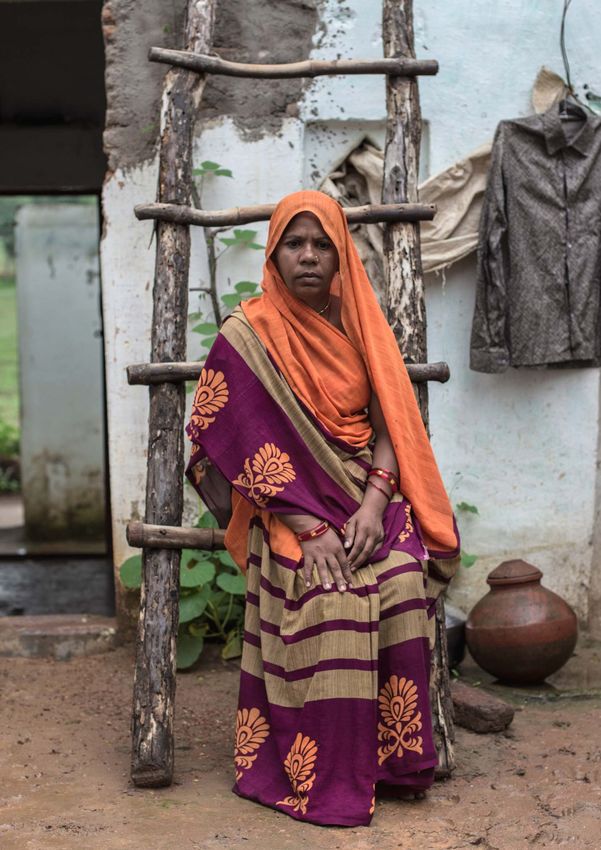
List of Acronyms
COVID-19   : Coronavirus Disease

CWDS       : Centre for Women's Development Studies

DBT        : Direct benefit transfer

FY         : Fiscal year

GoI        : Government of India

MGNREGA    : Mahatma Gandhi National Rural Employment Guarantee Act

NFHS       : National Family Health Survey

NSAP       : National Social Assistance Programme

NSDP       : Net state domestic product

OBC        : Other backward classes

PDS        : Public Distribution System

PMGKY      : Pradhan Mantri Garib Kalyan Yojana

PMJDY      : Pradhan Mantri Jan Dhan Yojana

PW&LM      : Pregnant women and lactating mothers

SC         : Scheduled castes

ST         : Scheduled tribes
Executive summary

                     Survey methodology

     •   Sampling frame: The sample consists of 10,161 women migrant workers aged between 15–59 years. They
         were either away from their home villages during the interview (December 2020) or had returned home during
         the pandemic. All the women migrant workers were employed in February 2020. However, not all of them were
         employed in December 2020 since many had faced job losses due to the pandemic.
     •   12 states covered: Assam, Bihar, Chhattisgarh, Jharkhand, Karnataka, Madhya Pradesh, Maharashtra,
         Nagaland, Odisha, Rajasthan, Tamil Nadu, Uttar Pradesh

                     Demographic indicators

     •   Age: The average age of the women migrant workers in the sample was 31 years.
     •   Household size: The average household size of the respondents was 4.7.
     •   Social category: The survey sample represents all socially disadvantaged groups: Scheduled castes (SC,
         23.83%), scheduled tribes (ST, 28.53%), other backward classes (OBC, 25.71%) and general category (19.52%).
         2.42% of respondents refused to reveal their social category.
     •   Education: Approximately 28.99% of the respondents in the sample had not received any formal education.
     •   Interstate and intrastate migrants: Around 56% of the respondents were interstate migrants, and 44% were
         intrastate migrants.

                     Social indicators

     •   Household responsibilities: Increase in household responsibilities (unpaid care work) during the pandemic
         was reported by 56% of the respondents. Of this 56% reporting a rise in unpaid care work,
         77% also reported increased physical/mental stress.
     •   Male Contribution: The male contribution to household chores has not increased in proportion to the
         increase in responsibilities for women. Of the 56% that reported a rise in unpaid work, 34% reported that male
         contribution has not increased.

                     Economic indicators

     •   Job Loss: Approximately 41% of respondents reported losing their jobs due to COVID-19.
     •   Income: Average individual monthly incomes fell by 53% from February 2020 (INR 6,937) to July 2020 (INR
         3,276). Incomes show a V-shaped recovery, rising to INR 5,279 in November 2020.

02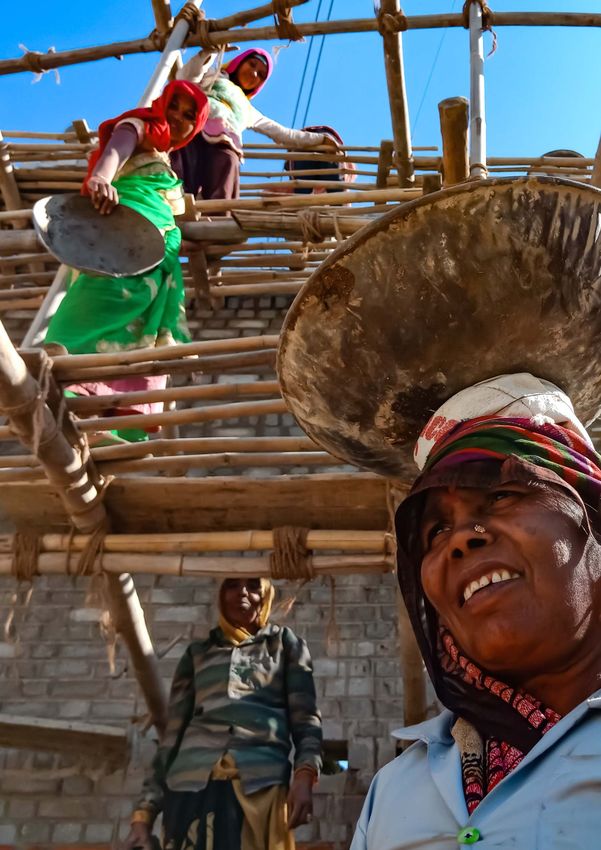
•   Women migrant workers' share in household incomes: The contribution of women migrant workers in the
    household income fell from 52.7% in February 2020 to 46.9% in November 2020.
•   Debt: The survey asked the respondents whether their families were in debt in February 2020. They were also
    asked if their families were in debt in December 2020. 26% of the respondents said yes to both questions. In
    other words, 26% of the families were in debt both before and after the lockdown. Further, 7.7% of the
    families said they were not in debt in February 2020, but they took on new debt in December 2020. Finally,
    30% of the respondents that were in debt either before or after the lockdown reported taking a new loan as one
    of the ways to repay old debts.

                 Social Protection Indicators

•   Food Security: Regarding food security, 72% of respondents owned a ration card, and 92% of the owners
    reported accessing the Public Distribution System (PDS) during the lockdown. Of the 8% of owners who did
    not use their ration cards during the lockdown, 40% reported administrative issues as the reason for not
    accessing the PDS.
•   Employment: In terms of employment, 54% of the respondents did not have a Mahatma Gandhi National
    Rural Employment Guarantee Act (MGNREGA) card.
•   PMJDY: Only 42% of the survey sample had a Pradhan Mantri Jan Dhan Account (PMJDY) account, of
    whom, 22% did not receive the Pradhan Mantri Garib Kalyan Yojana (PMGKY) benefit of INR 1,500 and 3% were
    not aware if they had received the direct benefit transfer (DBT) or not. Thus, 3,218 migrant women in the sample
    received INR 1,500 under the PMGKY scheme.
•   Internet Access: Only 38% of respondents had access to internet facilities.

                 Women-and children-specific
                 indicators
•   Anganwadi services: Only 27% of the respondents had children in the age group 0-5 years. Out of these, 66%
    had registered for Anganwadi services. 76% of all respondents who had registered for Anganwadi services
    availed the services from September to December 2020. Tamil Nadu and Chhattisgarh were the best
    performers in providing Anganwadi services while Karnataka, Jharkhand and Uttar Pradesh are among the
    lowest-ranked states in the provision of these services.
•   Mid-day meals: Around 38.5% of the children of the respondents who were eligible for the mid-day meal
    scheme did not receive any meals from September 2020 to December 2020. Chhattisgarh and Odisha were
    the best performers in providing mid-day meals, while Karnataka, Jharkhand and Uttar Pradesh were the
    lowest-ranked states in this respect.

                 Domestic violence indicators

•   Domestic violence during lockdown: In the survey, 972 respondents reported that they faced domestic
    violence before as well as during the lockdown. From this subset, 89% reported that their condition had
    worsened during the pandemic.
•   Awareness regarding support: Only 37% of all respondents knew where to seek help in case she or an
    acquaintance experienced domestic violence.

                                                                                                                      03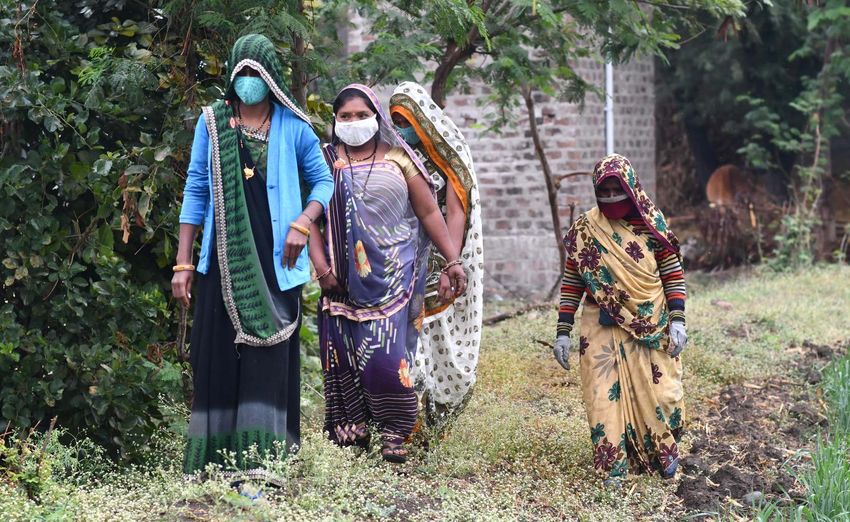
Chapter 1:
                    Introduction

T
       he COVID-19 pandemic has had a deep adverse effect on migrant workers in
       India. Lockdowns and travel bans brought economic activity to a near
       standstill. Sectors in India that are dependent on migrant workers, such as
construction, agriculture, and manufacturing, faced tremendous challenges due to
the pandemic. Further, migrant workers have also faced loss of employment and
wages coupled with the fear of the contagion of COVID-19. The losses incurred by
migrant workers at various destinations points have spilled over to their families at
source. The crisis has caused loss of income for migrant workers, stranded family
members and affected children's welfare in terms of health and education.

The pandemic has affected men and women differently in several respects. It is
known that working women face the double burden of household responsibilities in
addition to earning a livelihood for their family. Studies also suggest that women were
20 percent less likely to be re-employed as compared to men after the lockdown.1 To
make matters worse, restrictions imposed due to COVID-19 also led to an increase in
the number of distress calls to report domestic violence.2 The ability of women
migrant workers to access government welfare schemes has also been weakened.
Evidence3 suggests that social protection design may not often be fully supportive of
internal migrant (domestic migrants) workers. These migrants are at a high risk of
exclusion from social protection programmes due to the non-portability of
entitlements. Compared to other population groups, migrant workers may face
additional challenges and risks of being excluded because of a combination of
factors, including the ways in which social protection design and implementation
practices interact with migrant-specific characteristics. Finally, a decrease in income
coupled with a reduction in contribution to household income will have an adverse
socio-economic impact on migrant women workers.

This study complements findings from UNDP's longitudinal survey to inform policy
and interventions to protect migrant workers in India. The gender differentials
observed in the longitudinal survey indicated a gendered impact of COVID-19 across
several themes and motivated the need for a new study focusing only on women
migrant workers. For instance, in terms of employment, women lost more days of
work compared to men. Women migrants also reported being more food insecure
during the pandemic compared to male migrants. However, it was reassuring to note
that a greater proportion of women migrants reported receiving DBT compared to
males. Against this backdrop, this study focuses on a sample of 10,161 women migrant
workers from 12 states in India to understand the risks and vulnerabilities faced by
women in the current situation.
Chapter 2:

            Survey details

     U
             NDP commissioned 10 agenciesi to conduct a                                 (shown in table 1) for the study were selected keeping
             survey of women migrant workers in                                         states with high out-migration as per the 2011 Census
             12 states. Each agency interviewed                                         in mind. Designed to gauge the socio-economic
     respondents either by phone or in-person depending                                 impact of the pandemic on women migrant workers (in
     on the ease of accessing respondents. The 12 states                                the age group of 15–59 years), the survey was carried
                                                                                        out in December 2020. This study focuses on women
                                                                                        migrant workers that were either away from their

         10,161                                                                         home villages and towns at the time of the interview or
                                                                                        had returned home during the pandemic. ii The

         women                                                                          respondents interviewed in the survey were
                                                                                        employed before the pandemic, and a subset of them

         migrant                                                                        faced job losses due to COVID-19. Further, the states
                                                                                        mentioned in the analysis are not differentiated based

         workers                                                                        on source and destination. As a result, a state in the
                                                                                        analysis can be either a source or a destination for

         from       12 states                                                           women migrant workers. iii The survey collected
                                                                                        information on the following broad themes:

          01                                                                                02
                                 Demographic                                                                         Social indicators
                                 indicators (such as age,                                                            (such as household
                                 household size, etc.)                                                               responsibility, etc.)

     i
      The details of the agencies involved in the survey are provided in table A1 of the appendix.
     ii
       The study did not include women migrant workers who returned home before the pandemic. The study only captures the impact of COVID-19 on working women
     migrants.
     iii
        In this study, we contacted civil society organizations (CSOs) and non-governmental organizations (NGOs) to conduct surveys in 12 states. As a result, some
     migrants interviewed in a state were not native to that state. The data reveals that around 88 percent of the respondents belonged to the state in which the
     interview was conducted (i.e., the state was a source in 88 percent of cases) and 12 percent of the respondents belonged to a different state (i.e., the state was
     a destination).

06
Economic indicators Social protection indicators
03 (such as individual and
household income, job
category, etc.)
04 (such as access to the PDS or
MGNREGA during the
pandemic, etc.)
Women- and children-specific Domestic violence indicators
05 indicators (such as access to
Anganwadi services, mid-day
meals, etc.)
06 (such as experience of domestic
violence, awareness about
support, etc.)
Table 1: States covered by the survey
Which state is the enumerator targeting for this survey? Frequency Percent Cumulative
Assam 909 8.95 8.95
Bihar 1019 10.03 18.97
Chhattisgarh 775 7.63 26.60
Jharkhand 487 4.79 31.39
Karnataka 1027 10.11 41.50
Madhya Pradesh 736 7.24 48.75
Maharashtra 881 8.67 57.42
Nagaland 396 3.90 61.31
Odisha 891 8.77 70.08
Rajasthan 969 9.54 79.62
Tamil Nadu 1075 10.58 90.20
Uttar Pradesh 996 9.80 100.00
Total 10161 100.00
Source: Authors' calculation based on survey data
Conducting the survey during a pandemic posed quarantine centres required special permissions.
various challenges for the enumerators. First, some Finally, some respondents were accompanied by male
respondents would only be available for the interview members of the family during the interview process.
after long hours of work. Therefore, it was difficult to This may have prevented them from answering
elicit responses from such respondents over the sensitive questions, such as those on domestic
phone. As an alternative, some enumerators violence. In the following sections, this study
conducted in-person interviews. In this case, visiting discusses insights from each of the themes
respondents in the field was a challenge due to strict mentioned.
social distancing norms, and interviewing
respondents in places such as construction sites and
07Chapter 3:
Demographic
indicators
T he impact of the pandemic not only has a
gender dimension but is also driven by existing
social structures and deprivations. 4 To
understand the socio-economic impact of the
pandemic on women migrant workers, it is imperative
to understand the demographic characteristics of the
respondents. This section discusses the following
details of the respondents:
Age and
Social Education
size of the
category status
household
Figure 1: Age distribution of the respondents
.08
Age and size
of household
.06
The average age of respondents
in the survey was 31 years. This
Density
survey points to an average
.04
household size of 4.7 people,
which is in line with the National
Family Health Survey-45 (2015-16)
survey.
.02
0
10 20 30 40 50 60
Age
Source: Authors' calculation based on survey data
09Social category
Figure 2 represents the distribution of the conditions of the most vulnerable women migrant
respondents across different social categories. The workers in the country. The evidence6 suggests that
respondents cover all social categories in the country. the social category of migrants affects their ability to
While the “general” social category is the smallest avail employment opportunities in urban areas. The
subgroup, SC, ST and OBC together constitute more significant representation of socially disadvantaged
than 75 percent of the sample. In relation to the 2011 groups in the sample is expected to quantify such
Census, the sample in this study has a larger effects. In addition, the report aims to inform policy to
proportion of SC and ST population compared to ensure the unbiased delivery of welfare schemes to
national averages in 2011 (16.67 percent and 8.6 women migrant workers from marginalized classes.
percent respectively). As a result, the sample in this
study allows us to understand the socio-economic
Figure 2: Distribution of respondents by social category
Refused to answer 2%
General 19% SC 24%
OBC 26%
ST 29%
Source: Authors' calculation based on survey data
Education status
About 50 percent of the respondents had either levels of education falls steadily as they move to
received no education or had completed primary higher grades. The distribution of educational
schooling at most. A majority of this half reported that qualifications is shown in table A3 of the appendix.
they had not received formal schooling at all. The data Although these absolute numbers provide us a brief
reflects the low access to education for working overview of the sample, it is important to delve deeper
migrant women in this sample since the national into the dual impact of social category and education
literacy average is around 70 percent.7 Further, as on livelihoods.
expected, the proportion of women completing higher
10Figure 3: Educational qualifications by social category
100%
80%
60%
% 40%
20%
0%
SC ST OBC General
Social Category
No formal education Primary (Class 1-5) Secondary (Class 6-8)
Higher secondary (Class 9-10) Intermediate (Class 11-12) Graduate or above
Source: Authors' calculation based on survey data
Figure 3 shows the educational qualifications of the regular salaried jobs may provide stable livelihoods. A
respondents in different social categories. Here, it is study by the Centre for Women's Development
evident that more than one-fourth of the respondents Studies (CWDS) conducted in 20 states in India
from socially disadvantaged groups had no formal revealed that 66 percent8 of upper-caste women
education, and this is not very different from the migrant workers were engaged in white collar services
respondents in the general category. However, a large in 2012. The corresponding figures for other groups
divergence is seen as one goes higher up the were 36 percent (OBC), 19 percent (SC) and 18 percent
education ladder. About 33 percent of the (ST). In fact, studies also suggest that socially
respondents from the general category had a disadvantaged groups face worse labour market
graduate (or higher) degree. Education has a direct conditions after migration. A study on migrant workers
bearing on the ability to obtain jobs, and this is even who moved from Rajasthan to Gujarat found that
more important for migrant workers who migrate to Adivasi migrant workers faced inter-generational
urban centres where the demand for skilled and poverty despite employment in growth centres.9
11Figure 4: Job category in December 2020 by educational qualification
100%
80%
60%
%
40%
20%
0%
No formal Primary Secondary Higher Intermediate Graduate or
education (Class 1-5) (Class 6-8) secondary (Class 11-12) above
(Class 9-10)
Education Qualification
Self employed but doesn't employ others Self employed and employs others
Salaried employed Casual worker Unemployed
Source: Authors' calculation based on survey data
Figure 4 shows the job categories of the respondents have more stable jobs compared to seasonal or casual
surveyed for the study. There is a clear transition from workers. Citing the study by CWDS,10 tribal and lower
casual employment to salaried jobs as a person's caste women migrant workers were often
education qualifications increase. This monotonic concentrated in casual employment at constructions
increase is in line with the previous studies and points sites and brick kilns. The crux of this analysis is that
to the need of ensuring social and economic safety persistent intersectional impacts of gender and social
nets for socially disadvantaged casual workers. category on livelihoods need to be addressed
Although this study does not differentiate between through prudent social security programmes by the
skilled and unskilled labour, salaried employees may government.
12Chapter 4:
Social
indicators
I n this section, the following Household
Migrant type
social indicators of the responsibilities
(interstate or
respondents are discussed: during
intrastate)
COVID-19
Interstate and intrastate migrants
The respondents covered in the survey can be evaluating social protection programmes since access
categorized as interstate or intrastate migrants. The to such programmes may be restricted for those who
term interstate migrant refers to a migrant who has leave their home state or district. About 56 percent of
moved to a different state in search of job the women surveyed in the study were interstate
opportunities. An intrastate migrant, on the other migrants whereas the remaining 44 percent were
hand, is someone who has moved within the same intrastate migrants. Figure 5 represents the
state (to a different district or city). Attention to this classification of respondents in these two categories.
dimension of the type of migrants is essential while
Figure 5: Distribution of interstate and intrastate women migrant workers by state
Uttar Pradesh
Madhya Pradesh
Assam
Rajasthan
Maharashtra
States
Jharkhand
Tamil Nadu Interstate
Chhattisgarh
Karnataka Intrastate
Odisha
Bihar
Nagaland
0.00% 20.00% 40.00% 60.00% 80.00% 100.00%
%
Source: Authors' calculation based on survey data
14The distribution of interstate and intrastate combined with low per capita income may explain the
respondents in Figure 5 warrants attention. Studies higher proportion of interstate migrants compared to
suggest that there is a negative correlation between intrastate migrants.
the stock of interstate migrants and per capita net Turning our attention to intrastate migrants, Uttar
state domestic product (NSDP).11 This is not surprising Pradesh and Madhya Pradesh accounted for 30
since residents of richer states are less likely to search percent of the migrants that moved within states in
for jobs elsewhere. Moreover, rural to urban migration 2011. Geographically large states like these may
patterns are also negatively correlated with the NSDP provide better opportunities within the same state
and mirror the interstate patterns of migration.iv and reduce the need to move to a different state.
Combined with state, individual and household Moreover, studies find that intrastate migration is
characteristics, these parameters can partly explain mirrored by rural–rural migration patterns. This
the patterns of interstate migration in these states. In is contrary to the rural–urban migration which
Figure 5, almost all the respondents surveyed in mirrors interstate migration patterns. In essence,
Nagaland in this study were interstate migrants. While economic opportunities, individual and household
this study did not explicitly ask the destination of characteristics are important factors guiding migration
migration, the 2011 Census suggests that around 64 patterns. At a time when incomes have plummeted
percent of out-migrants from Nagaland moved within and the labour market is contracting, protecting
the north-east itself.12 Studies also suggest that livelihoods at source should be at the forefront of
urban–urban migration patterns were the most policies implemented to protect women migrant
prominent patterns seen in the north-eastern states. workers.
On the other hand, Bihar's large population size
Household responsibilities during COVID-19
India's first-ever time use survey, conducted by the an estimated 30 percent.14 According to our study,
Ministry of Statistics, found that women continue to do about 56 percent of the respondents reported an
more than one extra hour of work every day than increase in unpaid care work (such as household
men.13 While Indian men spend 80 percent of their chores) since the lockdown. Moreover, of all the
working hours on paid work, women spend nearly 84 respondents that indicated a rise in unpaid work since
percent of their working hours on unpaid labour. the lockdown, about 77 percent reported feeling
Further, a report by Dalberg also stated that COVID-19 physically or mentally stressed due to the increase in
had added to the burden of unpaid work on women by household responsibilities.
Figure 6: Percentage of women migrant workers reporting an
increase in unpaid care work during the pandemic
No Yes
44% 56%
Source: Authors' calculation based on survey data
iv
Caveat: The 2011 Census reports that the primary reason for women migrants to leave their home towns is marriage. Our sample is different in this
sense as this study focus on working women migrants. This study does not differentiate based on the primary reason of migrating.
15This analysis also examined the possible sources that particular, had increased household responsibilities,
contributed to increased household responsibility. and about 55 percent of the women reported an
The survey asked whether school closures, in increase in childcare burden due to school closures.
Table 2: Increase in childcare burden due to school closures
Has the closure of schools led to more
childcare burden on you? (e.g. cooking more Frequency Percent Cumulative
meals due to absence of mid-day meals)
1. Yes 2056 55.46 55.46
2. No 1494 40.30 95.76
3. Refused to answer 157 4.24 100.00
Total 3707 100.00
Source: Authors' calculation based on survey data
It is evident from the analysis that household responsibilities also reported no corresponding
responsibilities undoubtedly increased for women increase in the contribution of men in household
during the pandemic. Further, about 35 percentv of the chores. These findings indicate that men's sharing of
respondents who reported an increase in household the increased burden on women was inadequate.
Table 3: Contribution of male members in household chores since the pandemic
Has the contribution of male members
in household chores increased since Frequency Percent Cumulative
the lockdown?
1. Yes, male contribution has increased 3490 61.55 61.55
2. No, male contribution has not increased 1976 34.85 96.40
3. No male members in houses 204 3.60 100.00
Total 5670 100.00
Source: Authors' calculation based on survey data
v
This number is about 45 per cent when all respondents are considered.
16Back to the field:
Uncertain livelihoods during
unprecedented times
S
araswati is 56 years old and is originally from Ahmednagar (Maharashtra). She, along with her
family, used to migrate to other parts of Maharashtra such as Kohlapur, Sangli and Pune to
harvest sugarcane for six months of the year. Before the lockdown, Saraswati found a much-
awaited respite from seasonal work as she was employed as a cook at a school in the Beed district.
Although her salary was a mere INR 4,000 per month, she had the opportunity to educate her
grandchildren in the same school. Unfortunately, due to the pandemic, she lost her job and returned
home. While Saraswati's children were following in her footsteps by harvesting sugarcane in other
districts, Saraswati was faced with the task of managing all the household responsibilities. In addition,
Saraswati and her husband also worked in an agricultural field for INR 150–200 per day. Saraswati's
story reveals that regular, salaried jobs, despite having low salaries, may compensate for the
uncertainty associated with seasonal work. Further, proximity to one's family also provides the required
support while managing the household. However, in the absence of her children during the pandemic,
Saraswati was faced with the double burden of caring for her grandchildren alongside a strenuous job
in the fields.
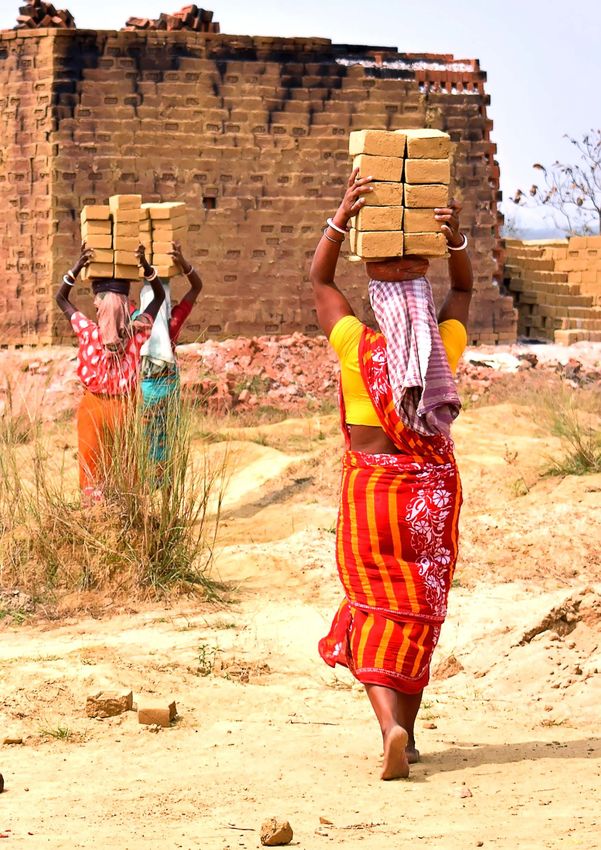
Figure 7: Seasonal work makes migrant workers one of the most vulnerable cohort in society.
Source: Shaishavi Project Consultants Private Limited
17Chapter 5:
Economic
indicators
I n this section, the following economic indicators are discussed
through a gender lens:
Average
Job category Contribution
monthly incomes
of women (household and
Lay-offs due in February 2020
migrant workers individual) in
to COVID-19 and December
to household February, July and
2020
income November 2020
Average
Average Average monthly incomes
monthly incomes monthly incomes (individual) in
(individual) in (individual) in February, July, and Debt
February and February, July, November 2020 obligations
November 2020 and November (interstate and
by job category 2020 by state intrastate
migrants)
Lay-offs due to COVID-19
The survey reveals that about 41 percent (table 4) of their jobs during the pandemic. Out of the 23 percent
the respondents were laid off due to COVID-19. Of who reported leaving their jobs voluntarily, 62.15
these, 58.55 percent were interstate migrants and percent were interstate and 37.85 percent were
41.45 percent were intrastate women migrant workers. intrastate women migrant workers. Both these
Further, about 23 percent of all the respondents findings suggest the increased vulnerabilities of
reported leaving their jobs voluntarily. Interstate migrants who leave their home state for better
migrants were also more likely to have voluntarily left opportunities.
19Table 4: Lay-offs due to COVID for women migrant workers
Frequency Percent Cumulative
1. Yes, I have been laid off 4212 41.45 41.45
2. No, I was not laid off, but wages have decreased 1929 18.98 60.44
3. No, I was not laid off, and wages were the same 1690 16.63 77.07
4. No, but I voluntarily left my job 2330 22.93 100.00
Total 10161 100.00
Source: Authors' calculation based on survey data
Job category in February 2020 and December 2020
Figure 8 represents the transition of employment from per the findings of the survey, about 20 percent of the
February 2020 to December 2020. It is evident that respondents with salaried jobs in February 2020 were
most of the women were either engaged in salaried forced into casual work or unemployment in
jobs or casual work in February as well as in December December 2020. Similarly, around 9.6 percent of
2020. The key insight is that respondents from these casually employed respondents were unemployed as
job categories have been displaced to other jobs. As of December 2020.
Figure 8: Change in job category from February 2020 to December 2020
Job category in February 2020 Job category in December 2020
Source: Authors' calculation based on survey data
20These trends raise concerns for sustaining livelihoods to strengthen the programme are as follows: First,
for women migrant workers who have been displaced expanding MGNREGA work to accommodate this new
to lower-paying jobs or, in extreme cases, to workforce will indeed be crucial. Some departments
unemployment. The mass exodus of casual labourers where employment could be generated include
from urban centres led to falling incomes, increasing sanitation drives and employment in temporary
debt and food insecurity.15 Reverse migration during quarantine centres. Second, more days of work for
the pandemic also led to a glut in rural labour supply,16 women under the MGNREGA scheme will be a step in
which added stress on the MGNREGA programme. the right direction to protect the livelihoods of
This is evident in the rise of new applications for job vulnerable women migrant workers. Finally, support
cards during the lockdown and the increase of nearly during the application procedure for job cards and
20 million additional households availing employment accessing employment through the MGNREGA
in 2020 as compared to 2019. The MGNREGA has scheme is an important avenue for CSOs to assist
been crucial in protecting livelihoods during these vulnerable cohorts.
unprecedented times. Further steps that can be taken
Contribution of women migrant workers to household income
To calculate the average share of women migrant average contribution of respondents to household
workers to household income in table 5, the share in income was approximately 52.7 percent in February
the household income was calculated for each 2020. However, this share dipped to 42.6 percent in
respondent. This share was then averaged across all July 2020 and increased marginally to around 46.9
respondents for each month. It was noted that the percent in November 2020 (table 5).
Table 5: Income share of women migrant workers in household income
Variable Observations Mean Standard deviation Minimum Maximum
Share in February 2020 9626 .527 .278 .021 1
Share in July 2020 6996 .426 .315 0 1
Share in November 2020 8718 .469 .308 0 1
Source: Authors' calculation based on survey data
Average monthly incomes (household and individual) in
February, July and November 2020
Figure 9 represents the average household and have risen only to INR 11,975 in November 2020. In
individual incomes in three periods: February 2020, other words, monthly household incomes in
July 2020 and November 2020. To calculate the November 2020 were still 19 percent lower than their
average individual and household income in Figure 9, pre-lockdown levels. A similar V-shaped recovery is
the average of individual income and household seen in individual incomes for respondents. Individual
income for all respondents was calculated for each incomes fell by about 53 percent from February to July
month.vi Trends indicate that mean household monthly 2020. Despite the recovery, individual incomes were
income fell by about 44 percent from INR 14,822 in still 23 percent lower in November 2020 compared to
February 2020 to INR 8,379 in July 2020. Recovery February 2020.
has been incomplete as monthly household incomes
vi
It is important to note that the average income share in Table 5 cannot be obtained by simply dividing average individual income and average household
income in Figure 9. The average income shares need to be constructed by generating the variable for income share for each respondent and then taking
the average across the share variable.
21Figure 9: Average household and monthly incomes in February, July and November 2020
16,000
14822.73
14,000
Monthly income (in Rs.)
12,000
11975.46
10,000
8,000
8379.76
6,000
6937.33
4,000
5279.89
2,000
3276.98
0
Feb-20 Mar-20 Apr-20 May-20 Jun-20 Jul-20 Aug-20 Sep-20 Oct-20 Nov-20
Month
Average household monthly income Average individual monthly income
Source: Authors' calculation based on survey data
Table 5 and Figure 9 indicate that the respondents' of the family controls the funds or a female. To put this
income saw a sharper decline and a weaker recovery into perspective, a simple example would be
in comparison to household incomes during the same investments in clean cooking fuels. Choudhari et al.18
period. The combined impact was a reduction in the argue that women's access to salaried work and
respondents' share in household income during the control over household expenditure decisions is
pandemic. This has strong implications insofar as a associated with the use of clean fuel. The same holds
larger share in income translates to greater control for expenditure on children-specific goods versus
over funds. Evidence17 suggests that expenditures are adult goods.
likely to differ depending on whether a male member
22Average monthly incomes (individual) in February and
November 2020 (by job category)
This study also analyses the trends in the incomes of workers. Salaried employed respondents saw a
respondents based on their employment category. reduction in income of 45 percent from February
Figure 10 represents the average monthly individual 2020 to July 2020. With partial recovery, incomes in
incomes in February, July and November 2020 based November 2020 were only about 20 percent lower
on job category in February 2020. The figure points to than pre-lockdown levels. The steeper decline in the
important differences regarding the impact of the incomes of casually employed respondents can be
pandemic. Self-employed respondents working alone explained by job losses during the lockdown. In
earned less than salaried employed and casual addition, the mobility to higher-paying salaried jobs
workers in February 2020. However, the gap in was less likely as shown in Figure 8. The relatively
income between self-employed respondents working muted impact (although still large in absolute terms) on
alone and casual workers closed by November 2020. salaried employed workers is partly explained by the
Also, casually employed respondents faced the ability to transition to other jobs, albeit at a lower wage.
largest reduction in incomes. Respondents engaged These trends point to the need to protect the
in casual work saw a reduction in income by 59 livelihoods of the most vulnerable casual workers, for
percent from February 2020 to July 2020. Incomes whom the only means of survival are often
recovered slightly by November 2020. However, government-sponsored schemes. This calls for
incomes of casually employed women migrants were efficient delivery of DBT schemes that minimize
still about 28 percent lower than pre-lockdown levels. exclusion errors at the stage of service delivery.
Further, salaried and self-employed respondents'
incomes were less affected compared to casual
Figure 10: V-shaped recovery in income (by job category in February 2020)
10,000
9,000
8,000
Monthly income (in Rs.)
7,000
6,000
5,000
4,000
3,000
2,000
1,000
0
Feb-20 Mar-20 Apr-20 May-20 Jun-20 Jul-20 Aug-20 Sep-20 Oct-20 Nov-20
Month
Salaried employed Self-employed and employs others
Casual worker Self-employed but doesn't employ others
Source: Authors' calculation based on survey data
23Average monthly incomes (individual) in February, July
and November 2020 (by state)
The state-wise disaggregation of average monthly strong recovery in terms of the incomes of
incomes can provide insights regarding the location of respondents. On the other hand, the livelihoods of
the most severely affected women migrant workers. women migrant workers in Bihar, Chhattisgarh,
Most states covered in the sample show similar trends, Jharkhand and Odisha are still vulnerable. It is
namely, large declines in household and individual important to note that our study does not differentiate
incomes from February 2020 to July 2020 followed by between states on the basis of source and destination.
partial recovery in November 2020. States like Assam, As a result, the state-wise results need to be
Karnataka, Maharashtra and Tamil Nadu have shown interpreted with this caveat in mind.vii
Figure 11: State-wise average of individual monthly income
Monthly income (in Rs.)
12,000
10,000
8,000
6,000
4,000
2,000
Assam
Chhattisgarh
Jharkhand
Karnataka
Madhya Pradesh
Maharashtra
Nagaland
Odisha
Rajasthan
Tamil Nadu
Uttar Pradesh
Bihar
Average Individual Monthly Income February 2020 Average Individual Monthly Income July 2020
Average Individual Monthly Income November 2020
Source: Authors' calculation based on survey data
Average monthly income (individual) in February, July and
November 2020 (interstate and intrastate migrants)
It is interesting to note that interstate respondents lockdown has almost closed this gap in November
earned around INR 1,000 more than their intrastate 2020.
counterparts in February 2020 (table 6). However, the
Table 6: Monthly incomes for interstate and intrastate migrants (in rupees)
Interstate Intrastate
Monthly income in February 2020 7422.1 6335.95
Monthly income in July 2020 3332.6 3209.65
Monthly income in November 2020 5279.32 5280.56
Source: Authors' calculation based on survey data
vii
For this study, we contacted CSO and NGOs to conduct surveys in 12 states. As a result, some migrants interviewed in a state were not native to that state. The
data reveals that around 88 per cent of the respondents belonged to the state in which the interview was conducted (i.e., the state was a source in 88 percent of
the cases) and 12 percent of the respondents belonged from a different state (i.e., the state was a destination).
24Debt obligations
Finally, having noted that incomes fell by more than 50 other words, about 26 percent of households were in
percent from February to July 2020, this section debt in February 2020 as well as in December 2020.
discusses the debt obligations of the households in From this subset, about 72 percent of women reported
the sample. The respondents were asked whether a rise in their debt obligations since the onset of the
their families were in debt in February 2020. They pandemic. Further, about 7.7 percent (788 out of 10,161)
were also asked if their families were in debt in of women reported that their families were not in debt
December 2020. Table 7 presents the responses to in February 2020 but were in debt by December 2020.
these two questions. The survey reveals that 2,639 of
10,161 respondents said yes to both these questions. In
Table 7: Debt in February 2020 and December 2020
Is your family currently in debt (at the time of interview)?
Was your family in debt in February 2020?
1. Yes 2. No 3. Refused to answer Total
1. Yes 2639 244 34 2917
2. No 788 5067 212 6067
3. Refused to answer 62 77 1038 1177
Total 3489 5388 1284 10161
Source: Authors' calculation based on survey data
The survey also collected information on how debt such as selling assets. It is also a matter of concern that
was repaid (either partially or fully). While answering 53 percent of the women reported that their families
this question, the respondents could select more than had not repaid previous debt (either fully or partially).viii
one means of repaying debt. About 30 percent of These findings point to the fact that rising debt
women reported that their families took another loan obligations coupled with declining incomes have
to repay previous debts. Further, 20 percent of the adversely affected the savings of the respondents. In
women reported using previous savings to repay the addition, repaying existing debt using household
debt. Most families used additional loans or personal assets and previous savings has made the women
savings in conjunction with other means of repayment migrant workers more vulnerable to poverty traps.
Figure 12. Proportion of people reported repaying debt using
this as one of the means of repayment
0.6
0.5
0.4
Proportion
0.3
0.2
0.1
0
Did not repay Took another Used own Loss of Mortgaged Loss of
loan savings movable land immovable
Property property
Mode of repayment
Source: Authors' calculation based on survey data
viii
These numbers will not add up to 100 percent. The numbers are to be interpreted as 'one of the means' of repayment and not the 'only means of repayment'
because respondents used a combination of several means of repayment. Responses like “Did not repay” and “Took another Loan” are interpreted as follows:
Families have not repaid the full debt but selected some means of repayment to repay the loan partially.
25Having established the difficulty in repaying debts Although the INR 1,500 received over three months
during the pandemic, Figure 13 indicates whether may not be enough to sustain a household, the effort
unconditional cash transfer for women with a Jan to ease the negative impact of the pandemic is
Dhan account under the PMGKY had any effect in laudable since it reduces the stress on scarce
easing debt obligations for the respondents. The disposable income for basic necessities. Various
figure indicates that 60 percent of respondents who studies19 suggest that the PMGKY package helped
did not receive the benefit reported being in debt in reduce credit constraints for households dependent
December 2020. On the other hand, only around 36 on agriculture by allowing such households to invest in
percent of the respondents who received PMGKY efficient agricultural inputs.
benefits reported being in debt in December 2020.
Figure 13: Debt in December 2020 for the subset that had a PMJDY account
100%
90%
80%
70%
60%
50%
40%
30%
20%
10%
0%
Received Did not receive I don't know
PMGKY benefit PMGKY benefit
Yes' in debt in December 2020 Not in debt in December 2020 Refused to answer
Source: Authors' calculation based on survey data
26Reverse migration:
An expensive endeavour
M anisha is 45 years old and lives with her husband, two children and in-laws. Her family was
engaged in agriculture in Rajpur (Madhya Pradesh). However, as they are small farmers,
agriculture was not enough to sustain them. In search of better opportunities, Manisha found
a job in Rajasthan in November 2019. Like many others, she lost her job during the pandemic and was
stranded in Rajasthan. Manisha reported that she faced enormous difficulty getting transport back
home during the pandemic. In fact, along with 14 others, she paid a total of about INR 32,000 to come
back to Rajpur. In 2021, she plans on working in Rajpur and will return to Rajasthan only after the
monsoon. Manisha's case is reflective of the stories of thousands of other migrants stranded in their
workplaces. Returning home posed a huge challenge due to lack of transport and escalating food
prices among other issues. The combined impact of these factors depleted the hard-earned money of
these women migrant workers.
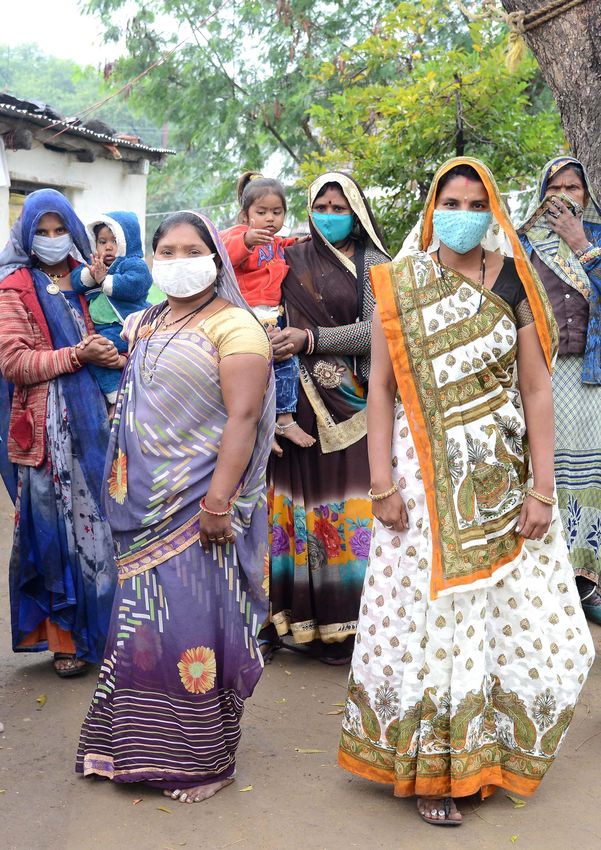
Figure 14: Migrant workers returned to their home towns hoping to return back to work in 2021.
Source: Action for Social Advancement
27Chapter 6:
Social protection
indicators
T he pandemic and its impact on migrant workers led the Government of India (GoI) to expand the
20
ix
existing social protection schemes and introduce new measures. The fiscal package
announced by the central government included $22.8 billion to support the most vulnerable
sections of the society through the PMGKY scheme. Employment and food security were also targeted
by extending provisions under flagship schemes such as MGNREGA and the PDS. International
financial institutions initially provided support of $1 billion21 to expand India's social protection schemes,
and table 8 lists the schemes which were designed with a special focus on women.
Table 8: Social protection schemes for women
Social Protection
Theme Provisions
Scheme
Mahatma Gandhi Provides 100 days of guaranteed
National Rural wage employment to rural
Employment Employment households. More than half the
Guarantee Act participants are women.
Pradhan Mantri Transfers of INR 1,500 in three
Direct benefit Garib Kalyan Yojana instalments between April–June
2020 to women who had a PMJDY
transfer
account
ix
Exchange rate used for conversion: INR 75 = $1
29Pradhan Mantri INR 5,000 is provided directly to the
Maternity Matru Vandana bank or post office account of
Yojana pregnant women and lactating
benefit
mothers (PW&LM) for first birth in
the family, subject to fulfilling
specific conditions.
Indira Gandhi All widows aged 18 or above and
Widow Widow Pension below the poverty line, according to
pension Scheme the criteria prescribed by the GoI,
are eligible to be beneficiaries of
the scheme. It is a part of National
Social Assistance Programme
(NSAP).
Source: Government of India websites for respective schemes.
Although India's social protection policies are wide-ranging, this section discusses access to the following
schemes:
Employment Financial
Food security: guarantee: support: Access
Access to PDS Access to to PMJDY and
MGNREGA other DBTs
Digital Other schemes:
infrastructure: Government health
insurance, widow
Access pension scheme,
to internet government
facilities maternity benefit
Food security
The central government increased the food rations are still inclusionary measures needed to ensure that
during the pandemic under the PMGKY package for people are linked to the PDS for food rations. Further,
the poor. It announced free distribution of five 92 percent of ration card owners reported using the
kilograms of food grains per person and one kilogram card during the lockdown (figure 15). It is also
of pulses per household for over 800 million ration reassuring to see that the access to the PDS was high
cardholders.22 About 72 percent of the respondents in for both intrastate and interstate migrants.
our study owned ration card. This indicates that there
30However, it is important to understand why the Figure 15: Ration card usage
remaining 8 percent of women migrant workers could
not access the PDS during the lockdown. Figure 16
indicates that around 40 percent of the respondents No
who did not use the PDS during the lockdown faced 8%
administrative challenges. One possible reason for
this could be the lack of portability of ration cards
across state borders. There is an urgent need to
expand the One Nation One Ration programme to
every state in the country. Further, awareness
campaigns about the use of ration cards in different Yes
states will be important in minimizing exclusion errors.
92%
This will also help in optimizing usage of the
government's PDS benefits.
Source: Authors' calculation based on survey data
To take a deeper look into this data, this study Figure 16: Reason for not using ration
analysed whether the reason for not using ration cards card during the lockdown
is different for interstate and intrastate migrants. Table
Did not have the
9 shows that interstate migrants faced more
need to use it
administrative hurdles while accessing the PDS Other
compared to intrastate migrants. To reiterate, these 15%
45%
numbers also reflect the need for strengthening the
One Nation One Ration initiative. As of December
2020, nine states have successfully implemented
reforms in the PDS to implement the One Nation One
Ration scheme. The states which have implemented
the reforms are Andhra Pradesh, Goa, Gujarat,
Administrative
Haryana, Karnataka, Kerala, Telangana, Tripura and
reasons
Uttar Pradesh.23
40%
Source: Authors' calculation based on survey data
Table 9: Reasons for not accessing the PDS
Interstate Intrastate
If not, why did you not use the ration card Frequency Percent Frequency Percent
to access the benefit of the PDS?
1. Did not have the need to use it 38 12.14 46 17.23
2. Could not use it due to administrative reasons 133 42.49 100 37.45
(e.g.: ration card not acceptable)
3. Other 142 45.37 121 45.32
Total 313 100.00 267 100.00
Source: Authors' calculation based on survey data
31Although only 8 percent of the respondents said that incentivized states to ramp up reforms in the PDS:
they did not use ration cards, a state-level analysis states are allowed an additional 2 percent of gross
indicates where the One Nation One Ration scheme state domestic product to be borrowed based on the
need to be strengthened. Figure 17 shows that completion of certain reforms. It should be noted that
respondents surveyed in Rajasthan faced the most 0.25 percent of this borrowing was linked to the
administrative hurdles while accessing the PDS. successful completion of the One Nation One Ration
Further, despite implementing the One Nation One scheme. This measure aims to strengthen the states'
Ration modality, the respondents from Karnataka and financial resources to combat COVID-19 as well as
Uttar Pradesh still faced administrative problems while maintain high standards of service delivery for migrant
using their ration cards. The central government has workers.
Figure 17: State-wise reasons for not using PDS.
100%
90%
80%
70%
60%
50%
40%
30%
20%
10%
0%
Rajasthan
Karnataka
Uttar Pradesh
Odisha
Jharkhand
Chhattisgarh
Maharashtra
Assam
Madhya Pradesh
Tamil Nadu
Nagaland
Bihar
Administrative issues Did not have need to use PDS Other reasons
Source: Authors' calculation based on survey data
32Livelihoods and unpaid care work:
The double burden
of the pandemic
T wenty-seven-year-old Krishnaveni is a construction worker in the Erode district of Tamil Nadu.
She has a postgraduate degree and is married to another construction worker. Prior to the
lockdown, along with her husband, she had a total income of INR 16,000 per month. During the
pandemic, she lost her job and returned to her home town in Salem. Unfortunately, she was unable to
find a job in Salem and returned to Erode in search of a job. As of December 2020, Krishnaveni was
working as a daily wage labourer in a government school which is under renovation. The pandemic
shed light on the double burden that working women face. During the pandemic, Krishnaveni along
with her one-and-a-half-year-old child were forced to live in tents near the worksite. She also reported
that she utilized breaks at work to breastfeed her child. This case indicates that the importance of
social protection schemes cannot be stressed enough. Krishnaveni was one of the respondents who
did not have a ration card or a PMJDY account. While the pandemic has affected even the most
educated migrant workers like Krishnaveni, the uptake of social protection schemes could help ease
the burden of unemployment, declining incomes and childcare during these trying times.
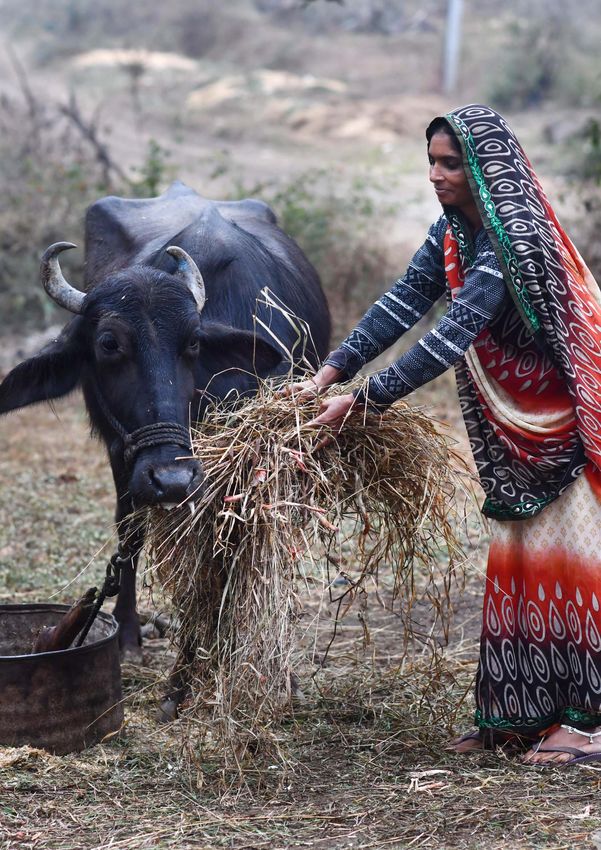
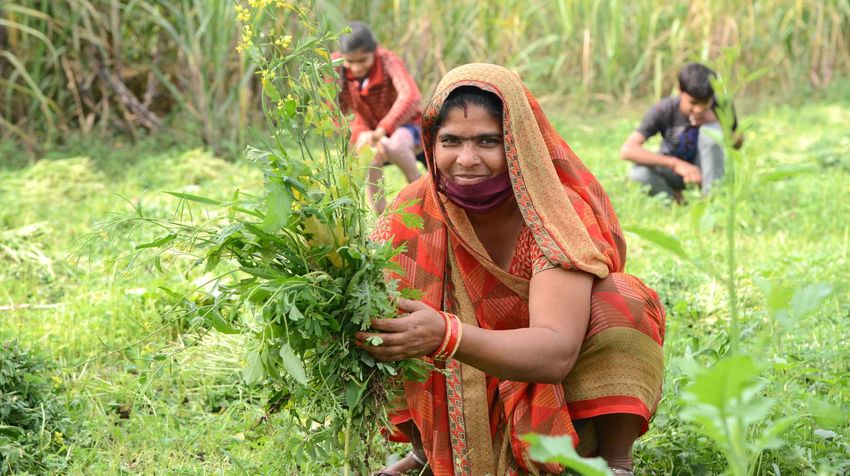
Figure 18: Working migrant women face the double burden of earning a livelihood for their families
and unpaid care work.
Source: ANTS Consulting Services Private Limited
33You can also read