E-COMMERCE PARTICIPATION AND HOUSEHOLD INCOME GROWTH IN TAOBAO VILLAGES
←
→
Page content transcription
If your browser does not render page correctly, please read the page content below

Public Disclosure Authorized
Public Disclosure Authorized

 Poverty & Equity Global Practice Working Paper 198

 E-COMMERCE PARTICIPATION AND HOUSEHOLD
 INCOME GROWTH IN TAOBAO VILLAGES
Public Disclosure Authorized
Public Disclosure Authorized

 Xubei Luo
 Chiyu Niu

 April 2019
Poverty & Equity Global Practice Working Paper 198

 ABSTRACT
 E-commerce has developed rapidly in China, and Taobao Villages, which are villages significantly engaged in e-
 commerce, are prospering in rural areas. E-commerce is fostering entrepreneurship and creating flexible and
 inclusive employment opportunities, including for women and youth. This paper examines the role of e-
 commerce participation in household income growth, drawing from a survey of representative Taobao Villages
 in 2017. The paper presents three main findings. First, e-commerce participation is not random: participation
 is higher among the households with younger household heads, with secondary education, particularly those
 with technical and vocational education, urban work experience, and knowledge of e-commerce. Second, e-
 commerce participation is associated with higher household income, with some indications that participation
 has a strong positive effect on household incomes. Third, e-commerce appears to yield benefits that are broadly
 shared among participants in an equitable way in Taobao Villages.

This paper is a product of the Poverty and Equity Global Practice Group. It is part of a larger effort by the World Bank to
provide open access to its research and contribute to development policy discussions around the world. The authors may be
contacted at xluo@worldbank.org and cniu@worldbank.org.

 The Poverty & Equity Global Practice Working Paper Series disseminates the findings of work in progress to encourage the exchange of
 ideas about development issues. An objective of the series is to get the findings out quickly, even if the presentations are less than fully
 polished. The papers carry the names of the authors and should be cited accordingly. The findings, interpretations, and conclusions
 expressed in this paper are entirely those of the authors. They do not necessarily represent the views of the International Bank for
 Reconstruction and Development/World Bank and its affiliated organizations, or those of the Executive Directors of the World Bank
 or the governments they represent.

 ‒ Poverty & Equity Global Practice Knowledge Management & Learning Team

 This paper is co-published with the World Bank Policy Research Working Papers.

E-Commerce Participation and Household Income Growth in Taobao Villages
 Xubei Luo and Chiyu Niu ∗

JEL codes: L8, O15, P25, L16
Key words: E-commerce, income growth, rural economy, industrial clustering

∗ The authors thank Shaohua Chen, Samuel Freije-Rodriguez, John Giles, Bert Hofman, Deepak Mishra, Ambar
Narayan, Hoon Sahib Soh, Xuejiao Xu, and Salman Zaidi for valuable comments and discussion; Zhengwei Jiang,
Zhenzhong Sheng, Ruidong Zhang from Alibaba Group for suggestions and for sharing the Alibaba online data for the
research; Ramiro Flores Cruz, Hua Ding, Tao Kong, Qiang Li, Juan Munoz, Jinjie Wang, Yunbo Zhou, the entire team
of the Institute of Social Science Survey of Peking University, China, and all survey interviewers for collaboration in
the Taobao Village Survey; and all participants in the Taobao Village Survey for sharing their information and
experience. The views expressed here are those of the authors and do not reflect those of the World Bank, its Executive
Directors, or the countries they represent.

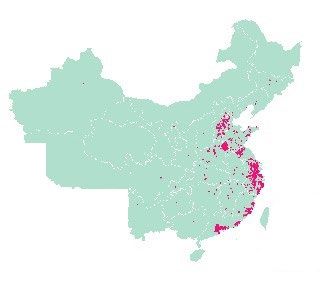
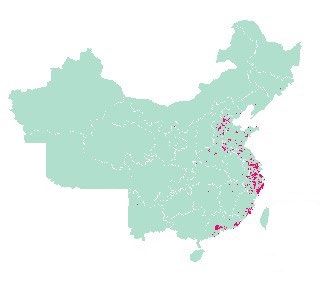
1. Introduction
 E-commerce has developed rapidly in China. From early 2000 to 2016, total e-commerce
sales boomed, rising from zero to US$750 billion, making China the world’s largest e-commerce
market with a global share of over 40 percent (Woetzel et al. 2017). The growth in e-commerce is
expected to continue. According to a recent report by Goldman Sachs (2017), China’s e-commerce
market will be US$1.7 trillion by 2020, more than twice its size in 2016. As a modern model of
conducting business, e-commerce in China has also been revolutionizing the traditional way of
buying and selling in brick-and-mortar stores, bringing convenience to consumers and increasing
competition among producers. For example, the penetration rate of e-commerce – the proportion
of e-commerce sales of total retail sales – surpassed that of the United States in 2013 and is now
15 percent (Zhang and Chen 2019).

 While e-commerce is more developed in urban areas – nearly three-quarters of online stores
and internet users are in urban areas – the development of online sales has grown sharply in rural
areas. Online retail transactions in rural areas have grown much faster than the national average.
Rural online retail transactions increased by 153 percent, from 353 billion yuan in 2015 to 895
billion yuan in 2016, compared to a growth rate of 26 percent for national online retail transactions
(Ministry of Commerce of the People’s Republic of China 2016). The rural share of total online
retail transactions also climbed from 9 percent in 2015 to 17 percent in 2016. 1
 The development of e-commerce in rural areas shows strong signs of clustering. E-tailers
with frequent and large amounts of online transactions have emerged in villages. The number of
Taobao Villages, defined by AliResearch as administrative village with e-tailers clustering and total
annual e-commerce transaction volume of more than RMB 10 million (about US$1.5 million), as
well as at least 10 percent of village households actively engaging in e-commerce or at least 100
active online shops operated by villagers, primarily with the use of Taobao.com and Tmall.com
marketplace – increased from 212 in 2014 to 2,118 in 2017 and to 3,202 in 2018 (Figure 1). Most
Taobao Villages are in coastal areas and show significant trends of clustering (Map 1). By 2018,
most of the 3,202 Taobao Villages were in the eastern region of China, while more than 100 Taobao
Villages were in the central and western regions and 13 were in the northeastern region.
Development of Taobao Villages shows a trend of clustering, and new Taobao Villages tend to
emerge next to existing Taobao Villages. In 2018, 70 percent of Taobao Villages are in Zhejiang,
Guangdong, and Jiangsu provinces; 69 percent of new Taobao Villages are in 76 existing Taobao
Village Clusters. 2 The number of Taobao Towns, defined as town or districts with more than three
Taobao Villages, increased from 17 in 2014 to 242 in 2017, and to 363 in 2018. According to Ali
Research (Nanjing University and AliResearch 2018), the clustering trend results from a developed
industrial base in old Taobao Villages, attractiveness from e-commerce success in existing nearby
Taobao Villages, and the rapid development of an e-commerce service ecosystem. The number of
active online shops in Taobao Villages increased from 70,000 in 2014 to 660,000 in 2018 (Figure

1 Calculated based on data from the Ministry of Commerce of the People’s Republic of China, “E-Commerce in China.”
Total rural online retail transactions refers to the sum of online retail sales transactions from e-commerce enterprises
(including individuals) operated in the administrative regions at the county level or below (excluding city districts)
(http://dzsws.mofcom.gov.cn/article/ztxx/ndbg/201706/20170602591881.shtml).
2 A Taobao Village Cluster is defined as a cluster with more than 10 neighboring Taobao Villages.

 2
2). Clothing, furniture, and shoes were the top three purchased products from Taobao Villages.
Luggage and leather goods, auto accessories, toys, and bedding products are also very popular.
 Figure 1. Number of Taobao Villages Figure 2. Number of active online shops in
 Taobao Villages
 4000 800
 3202
 660
 3000 600

 Thousand
 2118 490
 2000 400
 1311
 300
 779 200
 1000 200
 212
 70
 0 0
 2014 2015 2016 2017 2018 2014 2015 2016 2017 2018

Source: AliResearch Source: AliResearch

Map 1. Taobao Villages 2014–2018

Source: AliResearch

 While e-commerce is a new topic in the literature, several papers discusses its role in
stimulating production. Dai and Zhang (2015) show that e-commerce encourages the entry of new
firms by lowering the entry barriers and dependence on social capital. As for spatial patterns, Zhang
and Zhu (2015) document that e-commerce develops faster in industrial clusters and reinforces the
development of industrial clusters, but the causality and mechanism through which e-commerce
facilitates entrepreneurship and supports industrial clustering are not elaborated. Goldmanis et al.
(2010) study how the diffusion of e-commerce has influenced the number or type of producers that
operate in an industry. Using U.S. county business patterns data from 1994–2003, they find that as
diffusion of e-commerce among consumers increases, the number of small firms decreases, and the
large firms become more dominant. The rationale behind their finding is that e-commerce improves
market efficiency by eliminating firms with high costs. In the developing world context, studies
have also analyzed e-commerce and its interaction with rural agricultural production, especially for
smallholders. Zeng et al. (2017) systematically review the literature of e-commerce in the agri-food

 3
sector and point out that besides establishing farmer organizations (Hazell et al. 2010 and
Markelova et al. 2009) and promoting contract farming between smallholders and agribusiness
firms (Abebe et al. 2013), e-commerce can serve as an efficient alternative to enhance market
access for smallholders.
 A fast-growing body of case studies on e-commerce in rural China focuses on Taobao
Villages. Numerous cases show the prosperity of Taobao Villages and that people gain wealth and
have better lives through participating in e-commerce. Case studies, such as Shaji in Jiangsu
province and Caoxian in Shandong province, show many young and talented people, including
women, have returned to their hometown in rural areas, earning income similar to or higher than
they were as migrant workers in the cities and at the same time enjoying family life with their
elderly and children. Many have become leaders of e-commerce in their home villages and are role
models for their fellow villagers. Case studies in Mengjin in Henan province show people are
enriched by access to new markets through online platforms for traditional cultural products such
as peony painting and Tang tri-color ceramics. Case studies in Xifeng in Guizhou province show
households received higher farmgate price for kiwis and therefore have an incentive to increase the
production through online sales to domestic as well as European markets. Many cases, including
poverty-stricken counties in remote and mountainous areas, show that access to an online market
allows people in rural areas to enjoy the convenience, variety, and similarly low prices that are
enjoyed by people in big cities. 3
 Many case studies aim to understand the formation of Taobao Villages and their spatial
patterns. Zeng et al. (2015) examine two of the first Taobao Villages, Dongfeng village in Jiangsu
province and Junpu village in Guangdong province, and highlight a five-step process for the
formation of Taobao Villages: introduction of Taobao projects, primary diffusion, accelerated
diffusion, collective cooperation, and vertical agglomeration. They emphasize the prerequisites for
the healthy development of Taobao Villages include two factors, one is the identification of a
promising e-commerce project which can naturally trigger diffusion, and the other is decent local
infrastructure, such as internet, transportation, and logistics. Qi et al. (2018) analyze the
determinants of the formation of Taobao Villages using county-level panel data from the statistical
yearbooks of Zhejiang and Jiangsu provinces for the years 2012–2015. They find that from the
array of county-level characteristics, villages with more educated populations are more likely to
become Taobao Villages. The Chinese Taobao Village development report (Nanjing University
and AliResearch 2018) examines the patterns of formation of the Taobao Villages and their
evolution, drawing from extensive fieldwork. The report shows that, while most Taobao Villages
on the coast developed spontaneously, often led by a couple of first-mover return migrants and
followed by fellow villages, government support, often through subsidized service provision by
experienced e-commerce service firms, has become a major force for the incubation of inland
Taobao Villages.

3 See more details in AliResearch (2017), Taobao Villages.

 4
To our knowledge, however, there is little empirical evidence of the impact of e-commerce
on household income in the rural areas and the distribution of the benefits of e-commerce
participation due to data limitation. The most comprehensive study on the welfare implications of
e-commerce in China is by Couture et al. (2017). The authors conducted a randomized control trial
in eight counties in three provinces, Anhui, Henan, and Guizhou, to evaluate the effect of Alibaba’s
Rural Taobao Program. 4 Their results show that e-commerce expansion through the program
reduces the cost of living for certain groups in the rural population, but produces no significant
income gains for the average rural producers one year after the establishment of the program. The
results are consistent with observations in our fieldwork. At the early stage of the Rural Taobao
Program, Alibaba mainly focused on cultivating the online shopping culture by subsidizing the
logistics to increase the variety and convenience of local online purchases, while the increase in
online sales, if any, in particular in places where the industrial base was weak and access to markets
was limited, would take more time to materialize. However, it remains to be seen whether e-
commerce development, particularly in areas such as Taobao Villages with clusters of e-tailers, has
an impact on household income.
 In the literature, if we broaden the scope from e-commerce to the internet in general, several
papers document the effect of the internet on income and the labor market. Hjort and Poulsen (2017)
show that the internet has large positive effects on employment rates and average incomes by
studying how the arrival of submarine fiber optic internet cables in Africa affected labor market
outcomes. Their results show that, through firm entry, productivity, and export, the probability of
being employed in a skilled position increases substantially, but the probability of holding an
unskilled job is unaffected. Houngbonon and Liang (2017) look at the effect on income and
inequality within townships from household broadband internet adoption in France. They find that
between 2009 and 2013, broadband adoption contributed 34 percent of the rise in average income
and 80 percent of the fall in the Gini index of income inequality, and the gain is greater for the
bottom income decile groups.
 Growth, jobs, and services are the most important returns to digital investments (World
Bank 2016). Digital platforms can create instant business opportunities for entrepreneurs, thereby
creating jobs (World Bank 2019). E-commerce development has the potential to increase incomes
and help upgrade the supply chains in rural areas, by lowering the costs of trade and increasing
market access and eventually improving services by using big data to tailor production to consumer
demand and by leveraging the benefit of digital technology to improve product quality. In 2014,
the government launched the rural e-commerce demonstration program to put the poverty relief
and rural vitalization strategy into practice using e-commerce development as an instrument, paying
attention to the central and western regions, especially the poorest and most underdeveloped
counties. In the same year, Alibaba Group initiated its Rural Taobao Program to build an e-

4 In this project, in collaboration with the local governments, Alibaba subsidized transportation costs, hired local

helpers, and installed village service terminals to help villagers with online transactions.

 5
commerce service system reaching 1,000 counties and 100,000 villages to encourage e-commerce
activities in rural areas. 5
 In this paper, we aim to fill the gap in the literature to study the association of e-commerce
participation and household income growth in Taobao Villages, where e-commerce development
is more advanced in rural China and economies of scale can potentially play a role. The paper also
provides policy suggestions to strengthen the role of e-commerce in inclusive growth. This study
will draw on the data from the Taobao Village Survey, with information at the village, household,
and individual levels, to examine the role of e-commerce participation. To our knowledge, this
study will be the first to draw on systematic data in rural China, where engagement in e-commerce
is strong. It has three objectives: 1) examine the factors that determine the participation in e-
commerce; 2) compare with the counterfactual (without e-commerce participation) to estimate the
direct effect of e-commerce on household income, and 3) investigate the distribution of the benefits
of e-commerce participation among households of different characteristics and its inclusiveness.
 The paper is structured as follows: section 2 provides a broad picture of the Taobao
Villages, drawing on the Taobao Village Survey; section 3 presents the research methodology of
propensity score matching; section 4 discusses the empirical results related to the role of e-
commerce participation on household income growth in Taobao Villages and for different groups
of the population; and section 5 concludes.
2. Overview of Taobao Villages
 In recent years, villages with a large share of online sellers and a large share of GDP coming
from e-commerce, or Taobao Villages, emerged and developed rapidly in rural China, particularly
in the coastal region. This rapid growth demonstrates that the transition from physical to digital
commerce, often perceived as a phenomenon of high-income countries in urban areas, can happen
at a lower level of development and in rural areas as well.
2.1. Taobao Village Survey data and summary statistics
 This analysis uses the Taobao Village Survey, a collaboration between the World Bank,
Alibaba Group, and Peking University, to examine the characteristics of the Taobao Villages and
households. The survey, conducted between August and September 2018, is representative of the
universe of 2,118 Taobao Villages in 2017. The survey uses a stratified random sampling design
with villages as the primary sampling units, which are stratified by the gross merchandise value
(GMV) of the villages’ online sales in the Alibaba platforms, including Taobao.com and Tmall.com.
The secondary sampling units are the cell grids over the satellite image of the village maps, where
a specific number of grids are randomly chosen according to the estimated number of households

5 Under the Rural Taobao Program (农村淘宝), Alibaba Group establishes thousands of e-commerce outposts across
China in collaboration with regional governments and recruits local talent to serve the demand of the local
communities. Alibaba Group’s rural strategy is supported by its various initiatives involved in rural e-commerce, such
as the Specialties of China (特色中国) and agricultural resources (淘宝农资) channels on Taobao Marketplace,
Taobao University, Tmall.com’s fresh produce channel (喵鲜生), and the Blue Stars program (满天星计划).

 6
within each grid. The tertiary sampling units are households stratified by e-commerce participation
status (whether the household owns an e-shop or not). The sample covers 1,371 households in 80
villages across eight provinces, 6 of which, 616 households own e-shops (e-households) and 755 do
not (non-e-households). To control for income outliers, the top and bottom 3 percent of the income
distribution is dropped. After dropping the observations with missing data, 453 e-households and
620 non-e-households in 80 villages are used in this analysis. The details of survey sampling design
can be found in Appendix I.
2.2 Characteristics of Taobao Villages
 Rural areas with good infrastructure and good access to markets tend to be most conducive
to e-commerce. All Taobao Villages have access to broadband internet and a mobile
communication network. Over 50 percent of people in Taobao Villages use the internet, mostly
through smartphones (Figure 3). People with higher education are more likely to use internet
(Figure 4). The internet provides people with news, entertainment, online shopping, work, and
education (Figure 5).

 Figure 3. Devices to use the internet Figure 4. Share of people using the internet, by
 education level

 100%
 80%
 Smartphone
 60%
 Desktop 40%
 Laptop 20%
 0%
 PAD Never been to Primary school Vocational
 school or primary education education, college
 0% 50% 100% school not degree, or
 complete university degree
 Percent of people using internet
 Use Internet Do not use Internet

6 These provinces are Beijing, Hebei, Jiangsu, Zhejiang, Fujian, Shandong, Guangdong, and Yunnan.

 7
Figure 5. Purpose to use the internet

 News
 Entertainment
 Online shopping
 Learning
 Work related to e-commerce business
 Information other than news
 Work not related to e-commerce business
 0% 10% 20% 30% 40% 50% 60% 70%

 Percent of people using internet

 More than 90 percent of people in Taobao Villages perceived their social status as equal to
or higher than it was with five years ago, and they believe they will have equal or even higher social
status two years in the future. Compared with other households, e-households are 8 percent more
likely to perceive an improvement in social status in the past five years and expect an improvement
in the coming two years (Figure 6 and Figure 7).
 Figure 6. Self-rated social status compared Figure 7. Self-rated social status 2 years in
 to 5 years ago the future compared to current status

 100% 100%
 80% 32% 80% 38%
 52% 62%
 60% 60%
 40% 61% 40%
 56%
 43%
 20% 20% 36%
 0% 0%
 E-households Non-E-households E-households Non-E-households

 Lower social status Equal social status Lower social status Equal social status
 Higher social status Higher social status

 Taobao Villages have a higher share of migrants 7 than other villages in China (Table 1).
While a typical rural village population is 5.3 percent migrants, 8 the Taobao Villages in our sample
are 29 percent migrants, 19.6 percent come from other provinces. The causal relationship between
the inflow of migrants and formation of Taobao Villages is unclear. It may be that villages with a
large inflow of migrants, typically those with a strong industrial base, are more likely to become
Taobao Villages. It may also be that a village where the business environment is more conducive
for e-commerce (or commerce in general) attracts more migrants, who are more likely to be
entrepreneurial and move there to start their own businesses or to seize employment opportunities.
What is clear is the strong positive association of migrant inflows in Taobao Villages.

7
 Immigrants are defined as individuals who live in this village but have their hukou, which is the population
registration system, registered outside the village.
8 The numbers are derived from the Chinese Population Census in 2010. Total rural population is taken from module 1-

1c, and numbers of migrants by origin are taken from module 1-4c.

 8
Table 1. Share of migration in an average village and a Taobao Village
Percentage of migrants in all rural villages Percentage of migrants in Taobao Villages

 Different
 Different Different Different
 All village Different Different
 county same All migrants village same county same
 migrants same province province
 province county province
 county

 5.3% 1.7% 1.4% 2.2% 29.0% 4.7% 4.7% 19.6%

 Note: Social registration (hukou) information for all rural villages is derived from module 1-1c and 1-4c of
 China Population Census in 2010. Migrants are defined as individuals who live in this village but are registered
 outside of the village.

2.3 Characteristics of e-households and non-e-households in Taobao Villages
 E-commerce participation is not random. E-households and non-e-households differ in
many dimensions. Table 2 shows the descriptive statistics for these two household types in the
Taobao Villages. Comparing the characteristics of household heads, e-households are significantly
younger than non-e-households with an average difference of about 10 years. E-household heads are
better educated than those of the non-e-households. Specifically, non-e-household heads are about 12
percent more likely to have completed primary or junior high school education compared to e-
household heads, but 6 percent, 10 percent, and 3 percent less likely to complete senior high school,
college, and university education, respectively. E-household heads are healthier and less likely to be
unable to work due to sickness. E-households are 16 percent less likely to be locally registered than
non-e-households, but 13 percent more likely to come from another province. This observation
confirms the finding on the village level illustrated in Table 1 that people tend to migrate to Taobao
Villages to engage in e-commerce. E-household heads are 9 percent more likely to have working
experience in urban areas and 31 percent more likely to have self-employed experiences than non-e-
household heads. Among those who have urban experiences, e-household heads are 20 percent more
likely to have learned about e-commerce than non-e-household heads. Measured by a constructed risk
preference index, 9 e-household heads are significantly less risk-averse than non-e-households.
 In terms of household characteristics, e-households have slightly more members than non-
e-households and have younger age composition. Land ownership of the two household types is
not significantly different, potentially because agricultural land is not essential capital for e-
commerce business.

9
 Risk preference of the household head is constructed from the answers to hypothetical survey questions that ask
people to choose between receiving an amount of cash for certainty versus playing a game with uncertainty. The seven
survey questions are formulated as follows: “Would you like to receive X yuan for certainty or receiving 2,000 yuan
with 50% possibility and zero yuan with 50% possibility?” Value X takes values 400, 600, 800, 1000, 1200, 1400, and
1600. We construct a binary variable for each of these seven questions, which takes value one if the answer is to
receive with certainty, and zero if the answer is to play the game. We calculate a proxy of risk premium from each
question. For example, when X is 400, and the person would like to receive 400 yuan with certainty. This means that
the person would like to pay at least 600 yuan to avoid playing the game with uncertainty, which further means that the
risk premium in this case is at least 600 yuan. We then add up all positive and negative “risk premiums” from the seven
questions and normalize it to a range from 0 to 1, with 0 being the most risk-loving and 1 being the most risk-averse.

 9
Table 2. Summary statistics
 Household head characteristics E-households Non-e-households Difference
 Age of HH head 41.020 51.450 -10.291***
 If HH head is male 0.947 0.922 0.024
 If HH head is married 0.905 0.910 -0.003
 HH head’s highest education is...
 less than primary 0.060 0.189 -0.129***
 primary school completed 0.150 0.271 -0.121***
 middle school completed 0.361 0.323 0.038
 high school completed 0.082 0.024 0.058***
 vocational school completed 0.164 0.136 0.028
 college completed 0.133 0.037 0.096***
 university completed 0.051 0.019 0.031***
 Health of HH head is...
 healthy 0.969 0.895 0.074***
 sick but can work 0.015 0.052 -0.036***
 sick and cannot work 0.015 0.053 -0.038***
 Hukou status of HH head is...
 registered in current village 0.591 0.751 -0.160***
 same county different village 0.064 0.055 0.009
 same province different county 0.075 0.057 0.019
 different province 0.270 0.137 0.132***
 If HH head worked in urban areas before 0.469 0.380 0.090***
 If HH head learned about e-commerce while in urban areas 0.265 0.066 0.199***
 If HH head is self-employed 0.485 0.176 0.308***
 Risk preference index (ranges 0-1; 0 means most risk-loving
 0.300 0.390 -0.095***
 and 1 means most risk-averse)
 Household characteristics
 Household size 3.810 3.530 0.280***
 Agricultural land (Mu) 2.690 2.640 0.062
 Share of HH members age 15~35 0.503 0.290 0.212***
 Share of HH members age 36~49 0.161 0.220 -0.059***
 Share of HH members age 50~69 0.139 0.268 -0.130***

 Number of observations 453 620 1073
 Note: Risk preference of the household head is constructed from the answers to hypothetical survey questions that ask
 people to choose between receiving an amount of cash for certainty versus playing a game with uncertainty. The seven
 survey questions are formulated as the following: “Would you like to receive X yuan for certainty or receiving 2000
 yuan with 50% possibility and zero yuan with 50% possibility?” Value X takes values 400, 600, 800, 1000, 1200,
 1400, and 1600. We construct a binary variable for each of these seven questions, which takes value one if the answer
 is to receive with certainty, and zero if the answer is to play the game. We calculate a proxy of risk premium from
 each question. For example, when X is 400, and the person would like to receive 400 yuan with certainty. This means
 that the person would like to pay at least 600 yuan to avoid playing the game with uncertainty, which further means
 that the risk premium in this case is at least 600 yuan. We then add up all positive and negative “risk premiums” from
 the seven questions and normalize it to a range from 0 to 1, with 0 being the most risk-loving and 1 being the most
 risk-averse. * p-value
If e-commerce participation is random across the population, one may use the following
model to assess the causal impact of e-commerce participation on household income:
 = + + (1)
where is household income per capita of household i, is a constant term, takes value one if
household i participates in e-commerce and zero otherwise, gives the difference in average
household income per capita between the e-households and non-e-households, contains both the
observed and unobserved (to an econometrician) characteristics of household i. Under the
assumption that e-commerce participation is random, is independent of . As a result,
captures the average treatment effect on the treated (ATT) of e-commerce participation on
household per capita income.
 However, our survey data are collected in an un-experimental setting, where e-commerce
participation is not random but determined by household i’s choice based on . The dependence
between and introduces selection bias in the estimate of . In other words, the choice of
treatment and control groups simply based on e-commerce participation is far from scientifically
rigorous. In addition, the linearity assumption in equation (1) can be strong and could lead to serious
bias if specified inaccurately (Imbens 2015).
 To remediate the un-experimental setting, we use propensity score matching (PSM).
Rosenbaum and Rubin (1983) developed the use of the propensity score—the probability of
receiving treatment conditional on covariates—to reduce the dimensionality of the matching
problem. Since then, PSM has been widely employed in empirical economic studies (Heckman et
al. 1997, Dehejia and Wahba 1999, and Davies and Kim 2003), and many other fields where there
is a treatment, a group of treated individuals, and a group of untreated individuals. After matching,
PSM does not assume any parametric relationship between outcome variables and participation
decisions to calculate the treatment effects, which is another reason PSM is more reliable than the
model in equation (1).
3.1 Assumptions and caveats
 Identification using the PSM method rests on two assumptions: unconfoundedness and
common support. The application of PSM and its results regarding the size of the causal effects are
subject to several caveats.
Unconfoundedness
 The assumption of unconfoundedness states that:
 (0), (1) ⊥ |
where ⊥ denotes independence, that is, given a set of observable covariates X that are not affected
by treatment, potential outcomes are independent of treatment assignment. 10 This implies that all
variables that influence treatment assignment and potential outcomes simultaneously must be

10
 In plain English, unconfoundedness means participation is a random event among people after controlling for the set
of observed characteristics.

 11
observed by the researcher. Clearly, we cannot fully ensure that our survey has captured all
variables that influence the e-commerce participation decision.
 Therefore, the estimated magnitude of income increase due to direct e-commerce
participation could be upwardly biased for three reasons. First, e-commerce engagement is higher
in Taobao Villages than elsewhere and the contribution of e-commerce participation is therefore
likely to be higher than in average rural areas in China. Second, the counterfactual earnings of e-
households are earnings of other productive activities in the village, which are likely to be lower
than the would-be income of the e-commerce participants who have migrated to other areas. 11 Third,
the counterfactual earnings of e-commerce households will be downward biased due to the missing
information of the unobservables and the contribution of e-commerce participation in household
income will be upward biased: (a) The effects of important individual unobservables (such as rate
of time preference, openness to new experience, entrepreneurial ability or orientation, and personal
drive) cannot be collected in a standard survey and cannot be included in the estimates of
counterfactual earnings; and (b) Most of these unobserved qualities are likely associated with
higher income whether or not an individual is engaged in e-commerce. Meanwhile, e-commerce
development may contribute to income increase indirectly through backward or forward linkages
and create demand for related offline industries in the ecosystem. For example, new industries and
jobs are brought to Taobao Villages to support e-commerce development. People in the villages
might not open online shops but can improve earnings by providing services such as express
delivery, specialized website design, and online-shop modeling. Such jobs would not be available
if not for e-commerce development. Therefore, the results need to be interpreted with caution.
Given the data constraints, we nonetheless consider this the best feasible way to examine the role
of e-commerce participation on income growth in Taobao Villages.
Common support
 The assumption of common support states that
 0 < ( = 1| ) < 1
It ensures that persons with the same X values have a positive probability of being both participants
and nonparticipants (Heckman et al. 1999). In other words, X values will not be perfect predictors
of e-commerce participation. 12 This assumption can be checked by looking at whether the matching
variables are balanced across the treatment and control groups. Specifically, t-tests on household
and village characteristics between the matched treatment and control observations are provided in
the results section.
 Critiques of PSM are usually based on violations of the unconfoundedness assumption in
empirical settings. However, to the extent that observational surveys can capture most of the factors
that influence treatment status, PSM remains one of the workhorses in impact evaluation literature.
Several studies used PSM to analyze development issues in a cross-sectional and non-experimental

11
 We observed a high share of returned migrants in Taobao Villages. In the absence of the opportunity to participate in
e-commerce, some of the individuals/households that currently reside in Taobao Villages would have migrated in
pursuit of better employment opportunities.
12
 In plain English, common support means no attributes should perfectly predict participation. For example, if all
participants are males, then being a male perfectly predicts participation, common support fails. Instead, if we observe
both males and females as participants, common support is satisfied.

 12
setting to estimate the causal impact of intervention programs or collective behaviors. The seminal
paper by Jalan and Ravallion (2003) uses PSM to estimate the effects of piped water on children’s
diarrhea incidence and duration in India. With a cross-sectional data set, the authors match the
households with and without piped water based on propensity scores estimated from observable
household characteristics. They further stratify the cross-section by household income per capita
and the highest education of a female family member, and then estimate the treatment effects with
PSM in each subgroup. Imbens (2015) illustrates the application of PSM using non-experimental
data with examples such as the lottery winnings effects on labor market outcomes and the job
training program impact on subsequent earnings. Chiputwa et al. (2015) use PSM to identify the
impact of food standard certification on poverty among coffee farmers in Uganda. Fischer and
Qaim (2012) employ PSM to match farmers that form and do not form farmers groups to analyze
the impact of farmer collective action on income in Kenya. Also using a cross-sectional household
data set from Uganda, Kassie et al. (2011) use PSM to find that adopting improved groundnut
varieties (technology) significantly increases crop income and reduces poverty. We follow the same
methodology to study the role of e-commerce participation on household income growth in Taobao
Villages.
3.2 Logit model of participation
 We start by estimating a logit model of participation decision on a set of observed
characteristics. At the household level, we include the following variables:
 1. Gender of the household head. This is a dummy variable that equals one if the head is male
 and zero if female. E-commerce allows more flexible working hours and location (many
 people work at their own homes during periods they choose) and is often less manually
 demanding than traditional farming. This might make it especially suitable for female
 participation. We expect the coefficient to be negative.
 2. Age of the household head. As e-commerce is technology-intensive and new to rural areas,
 the younger generation may be more enthusiastic and better equipped to explore
 participation and find doing so easier than the older generation. We expect the coefficient
 to be negative.
 3. Marital status of the household head. This dummy variable equals one if the head is
 married and zero otherwise. Having a spouse gives the household the potential to diversify
 its income sources and lower the risks to participating in any specific activities, including
 e-commerce. We expect the coefficient to be positive.
 4. Level of education of the household head. Education makes adopting e-commerce
 technology easier, but it also raises the opportunity cost of participation, because people
 with higher education also have better alternative labor opportunities. We expect the
 coefficient to be positive with inverse U shape.
 5. Health of the household head. Being healthy is used as reference and being sick with the
 ability to work is differentiated from being sick without the ability to work. We expect the
 coefficient to be negative.
 6. Household head work experience in cities. This is a dummy variable that equals one if the
 head has worked in cities before and zero otherwise. Urban working experience can

 13
positively affect e-commerce participation because people are more likely to be exposed
 to e-commerce in urban areas. We expect the coefficient to be positive.
 7. Household head knowledge about e-commerce while working in cities. This is a dummy
 variable and interactive term with the variable household head work experience in cities.
 It equals one if the household head has worked in cities and has knowledge about e-
 commerce while working in cities and zero otherwise. Exposure to e-commerce can help
 people overcome the difficulties in e-commerce participation. We expect the coefficient to
 be positive.
 8. Household head is self-employed. This dummy variable equals one if the head is self-
 employed and zero otherwise. Self-employment is often associated with entrepreneurship.
 We expect the coefficient to be positive.
 9. Risk preference of the household head. This is constructed from the answers to hypothetical
 survey questions that ask people to choose between receiving an amount of cash for
 certainty versus playing a game with uncertainty. The value of the constructed variable
 ranges from zero to one, with zero being least risk-averse and one being most risk-averse. 13
 We expect the coefficient to be negative.
 10. Household size. Larger households might enjoy economies of scale and benefits from the
 division of labor within the household, both of which can relax time constraints for the
 potential entrepreneur to participate in e-commerce. We expect the coefficient to be
 positive.
 11. Agricultural land ownership (land size measured in mu). Land is the most important
 productive capital in rural areas. However, the effect of land ownership on e-commerce
 participation could be ambiguous: while people with more land tend to be richer and have
 fewer financial constraints to participating in e-commerce, land ownership also raises the
 opportunity costs of participating e-commerce.
 12. Age structure of household members. We include three ratios of individuals of working
 age: the shares of household members aged 15 to 35 years, 36 to 49 years, and 50 to 69
 years, omitting the share of household members age 70 and older and those younger than
 15. We expect the coefficient to be positive for the younger cohorts.
At the village level, we include the following variables as control:
 13. Total population. Population serves as a proxy for local market potential and labor supply.
 We expect the coefficient to be positive.
 14. Implementation of Dibao policy in the village. Dibao is one of the most important social
 security policies for the poor in rural China. It serves as proxy government support for
 poverty reduction. We expect the coefficient to be positive.

13 See footnote 9.

 14
15. Piped water. Piped water is a proxy for local hard infrastructure development. We expect
 the coefficient to be positive.
 16. Distance between the village and nearest hospital in kilometers. Distance to hospitals
 serves as a proxy for local soft infrastructure development. We expect the coefficient to be
 positive.
 17. Distance between the village and the closest logistic center in kilometers. Distance to a
 logistic center is a proxy for e-commerce operational costs. We expect the coefficient to be
 negative.
 18. Distance between the village and the closest train station in kilometers. Distance to a train
 station is a proxy for market access. The farther away to train stations, the higher the
 transaction costs to sell products in traditional markets and the lower the opportunity costs
 of engaging in online sales. We expect the coefficient to be positive.
 19. Whether the village is located in the suburbs of a major city. This is a dummy variable that
 equals one if the village is in the suburbs of a major city and zero otherwise. Being close
 to a big city means lower costs for migrating or commuting to the city for a job, which
 suggests higher opportunity costs to engage in e-commerce in the village. We expect the
 coefficient to be negative.
 After obtaining the propensity scores, which are the predicted probabilities from the above
model, a radius matching algorithm is performed to match the e-households with the non-e-
households based on their propensity scores. The default radius is 0.1, which means non-e-
households and e-households within a difference in propensity score of 0.1 are matched together.
We then discard the unmatched as in Dehejia and Wahba (2002), because the unmatched
observations failed the common support requirement. Finally, we use the matched e-households
and non-e-households to calculate the ATT of e-commerce participation.

4. Empirical results
 In this section, we discuss the factors that condition the e-commerce participation at the
household and village levels, examine the quality of the matching process, and present the results
of the effect of e-commerce participation on household income growth.
4.1 E-commerce participation
 The e-commerce participation equation is estimated with a logit model to obtain the
propensity scores used for matching. The marginal effects results are shown in Table 3. The
education of the household head is positively related to e-commerce participation, but the positive
and statistically significant marginal effects of education peak at technical school education and
then level off. This result indicates that e-commerce participation requires a prerequisite level of
education to get started, and technical school education seems a better fit for this requirement than
general education. However, e-commerce is not attractive to graduates with university degrees,
because these graduates tend to have higher opportunity costs in participating in e-commerce.
Immigration from a different province than the Taobao Village is also positively and significantly

 15
related to e-commerce participation, which corroborates the tabulation results in Table 3. Having
knowledge of e-commerce through urban work experience (not just urban work experience)
increases the probability of e-commerce participation. This finding coincides with the literature of
technology adoption where knowledge is the first step to adopting, and the better a person
understands the technology the more likely he or she is to adopt it (Feder and Slade 1984).
Household heads who are less risk-averse are more likely to participate in e-commerce, as e-
commerce is still relatively new to the rural areas and inherently more risky than traditional farming.
Age, gender, marital status, and health of the household head are not significant predictors of e-
commerce participation.
 Regarding the household characteristics, households with more family members are more
likely to participate in e-commerce, probably because they enjoy economies of scale and division
of labor as well as risk diversification. Agricultural land ownership is not significant in explaining
participation. Household composition in terms of ages matters for e-commerce participation. The
larger the share of members ages 15 to 35, the more likely the participation. This result also
indicates that it is easier for younger people to participate in e-commerce. Land, while it is a most
important asset in rural areas, does not have a significant effect on e-commerce participation. This
might be because land is not a direct capital or necessary condition in e-commerce operation. On
the one hand, households with more land might be in a stronger financial position to participate in
e-commerce; on the other hand, people without land might have lower opportunity costs to
participate in e-commerce.
 On the village level, people living in villages that are farther away from a train station are
more likely to participate in e-commerce. As distance to train stations serves as a proxy for access
to markets, the farther away people are to train stations, the higher their costs of accessing
traditional markets. This result indicates that e-commerce reduces transaction costs by connecting
sellers and buyers online and becomes a substitute for traditional markets. Similarly, people who
live in villages that are in the suburbs of a big city are less likely to participate in e-commerce,
either because they are closer to traditional markets or it is easier for them to engage in urban labor
activities. Both proximity to public transportation and urban hubs are good proxies of market access.
This suggests that e-commerce may substitute for traditional market access for Taobao Villagers.
However, other local characteristics are not significant in determining e-commerce participation.
For example, village population, which usually signifies local market potential, is not associated
with e-commerce participation. This may be because e-commerce helps to connect e-tailers to
consumers online, which attenuates the role of local demand. Social protection policies, such as
Dibao, and medical services indicators, such as proximity to hospital, are not significant
determinants of e-commerce participation, potentially due to relatively high average level of social
protection and services in Taobao Villages. Distance to a logistic center is not statistically
significant, which might be because our samples are limited to Taobao Villages, which all have
high levels of logistic service supply with little difference.

 16
Table 3. Participation equation estimation
 Variable E-commerce participation (logit marginal effects)
 Household head characteristics
 Age of HH head -0.001
 If HH head is male -0.076
 If HH head is married 0.022
 HH head’s highest education (reference is less than primary education)
 Primary school completed 0.073
 Middle school completed 0.128***
 High school completed 0.135**
 Technical school completed 0.297***
 College completed 0.262***
 University completed 0.109
 Health of HH head (reference is healthy)
 Sick but can work -0.083
 Sick and cannot work -0.007
 Hukou status of HH head (reference is registered in current village)
 Same county different village -0.01
 Same province different county 0.024
 Different province 0.090**
 If HH head worked in urban areas before -0.04
 If HH head learned about e-commerce while in urban areas 0.190***
 If HH head is self-employed 0.186***
 Household characteristics
 Household size 0.058***
 Agricultural land (Mu) -0.002
 Share of HH members age 15~35 0.346***
 Share of HH members age 36~49 0.048
 Share of HH members age 50~69 -0.03
 Risk preference index (ranges 0-1; 0 means most risk-loving and -0.203***
 1 means most risk-averse)
 Village characteristics
 Population in the village 0.001
 Whether have Dibao policy 0.009
 Distance to the nearest hospital 0.003
 Distance to the nearest logistic center 0.001
 Distance to the nearest train station 0.219***
 Whether have piped water 0.086
 Whether in the suburbs of a big city -0.078***
 Number of observations 1073
 Note: Risk preference of the household head is constructed from the answers to hypothetical survey questions that ask people to
 choose between receiving an amount of cash for certainty versus playing a game with uncertainty. The seven survey questions are
 formulated as the following: “Would you like to receive X yuan for certainty or receiving 2000 yuan with 50% possibility and zero
 yuan with 50% possibility?” Value X takes values 400, 600, 800, 1000, 1200, 1400, and 1600. We construct a binary variable for
 each of these seven questions, which takes value one if the answer is to receive with certainty, and zero if the answer is to play the
 game. We calculate a proxy of risk premium from each question. For example, when X is 400, and the person would like to receive
 400 yuan with certainty. This means that the person would like to pay at least 600 yuan to avoid playing the game with uncertainty,
 which further means that the risk premium in this case is at least 600 yuan. We then add up all positive and negative “risk
 premiums” from the seven questions and normalize it to a range from 0 to 1, with 0 being the most risk-loving and 1 being the most
 risk-averse. * p-value
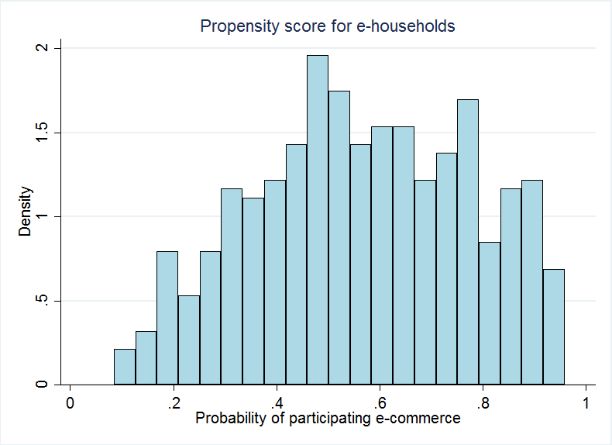
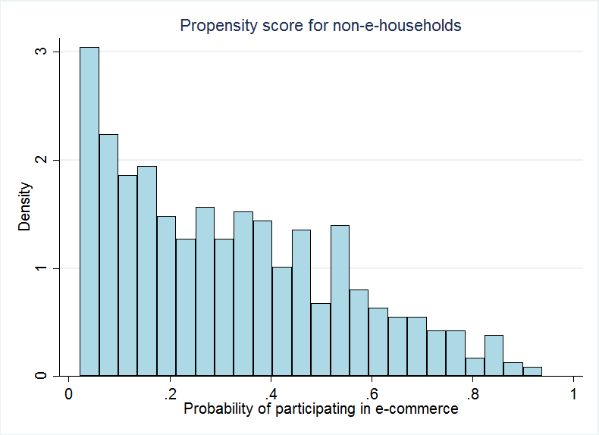
4.2 Quality of the matching process
 Before matching, propensity scores, which are the predicted probability of participation
from the logit model, for the e- and non-e-households, are illustrated in Figure 8. For e-households,
the mean score is 0.566 with a standard error of 0.209; for non-e-households, the mean score is
0.317 with a standard error of 0.221. The difference of propensity scores in the two groups is 0.249,
which is significant at the 0.01 level.

Figure 8. Histogram of propensity scores

 Table 4 presents the matching results in the control group (non-e-households) and
treatment group (e-households). For illustration purposes, we divide the estimated propensity
scores into 7 blocks. In blocks with low mean propensity scores, such as blocks 1, 2, 3, and 4, there
are more non-e-households than e-households to be matched within each block. Similarly, in the
blocks with high propensity scores, there are more e-households than non-e-households to be
matched. This matching pattern is determined by two factors. The first factor is that the estimated
propensity scores are higher for e-households than non-e-households, as shown in Figure 8. The
second factor is the usage of radius matching, which does not require a one-to-one matching. The
matching procedure results in 105 unmatched observations, which are excluded from the analysis
as explained in the methodology section.
 Table 4. Matched observations in control and treatment groups
 Mean propensity score
 Block ID Non-e-households E-households Total
 within each block
 1 0.08 22 1 23
 2 0.10 60 4 64
 3 0.15 48 17 65
 4 0.20 180 78 258
 5 0.40 128 148 276
 6 0.60 61 135 196
 7 0.80 16 70 86
 Total 515 453 968

 To verify the common support assumption, we perform balancing tests to see if household
characteristics that we use to construct propensity scores are indeed similar between the e-
households and non-e-households. Except for block 1, which does not have enough observations

 18
to derive the tests, the differences in the blocks are not significantly different from zero. This means
that the matched households have similar characteristics even if they differ by e-commerce
participation. In other words, the common support assumption is satisfied. Details of the balancing
tests can be found in Appendix II Table A1.
4.3 Role of e-commerce participation on income growth (PSM results)
4.3.1 Full sample
 After the radius matching and balancing procedure, 515 of 620 observations in the control
group are matched with all 453 observations in the treatment group. As shown in Table 5, the
estimated average treatment effect on the treated, which is an estimate of e-commerce direct effect
on income in Taobao Villages, is 35,388 yuan. Compared to the mean income in the control group,
which is 35,019 yuan, this result is equivalent to an income growth of 101 percent for the full
sample.
Table 5. PSM results
 E-commerce Growth
 Control mean T-stat
 effect rate
 Full sample 35018.9 35388.2 10.2 101.1%
 Wealth quartile 1 26642.9 25360.3 2.8 95.2%
 Wealth quartile 2 27427.0 26996.1 3.8 98.4%
 Wealth quartile 3 34957.3 33944.4 4.9 97.1%
 Wealth quartile 4 57801.7 32906.3 3.3 56.9%
 Head education, primary 28259.2 28236.9 3.9 99.9%
 Head education, middle school 33908.9 31735.8 5.0 93.6%
 Head education, high school 39011.6 28946.6 1.9 74.2%
 Head education, technical school 54367.1 45777.1 3.0 84.2%
 Knew e-commerce 48461.3 35820.9 3.1 73.9%
 No urban experience or did not hear about e-
 commerce while in urban 33205.6 29294.6 7.1 88.2%
 Age quartile 1, mean age 29 46054.0 32914.8 3.4 71.5%
 Age quartile 2, mean age 40 38653.5 30434.9 3.9 78.7%
 Age quartile 3, mean age 52 30761.9 29404.0 4.9 95.6%
 Age quartile 4, mean age 66 25608.8 26346.8 2.6 102.9%
Note: The wealth index is constructed from principal component analysis of the household’s ownership of automobiles,
trucks, motorcycles, tractors, personal computers, laptops, air conditioners, televisions, cellphones, and dwellings.

 However, one should use caution when interpreting this result as the estimated direct effect
of e-commerce participation on household income growth represents mainly an upper bound while
the indirect effect of e-commerce development on the local economy in Taobao Villages is likely
to be positive (for the reasons discussed in the previous section). In addition, when defining e-
households, we do not take into account the number of years that households have been in e-
business or have experience in conducting e-commerce. In other words, we do not differentiate
those that have been operating e-shops for a long time from those that just opened recently. Within
the e-households, there are variations in e-commerce experience, as shown in Figure 9. The mean
years of experience, defined as the mean number of years between the year of opening the first e-
shop until 2018 for the e-households is 4.6 years. In other words, the estimated average direct effect

 19
of e-commerce participation is derived from a comparison between a control group with zero years
of e-commerce experience (non-e-households) with a treatment group (e-households) that has 4.6
years of e-commerce experience on average. We cannot use the years of e-commerce experience
variable in the matching procedure because this variable perfectly predicts treatment status and thus
violates the common support assumption. While we cannot estimate the role of the number of years
engaging in e-commerce in household income, the PSM results suggest that if a non-e-household
starts to participate in e-commerce, the increase of income in the first year might not be as high as
35,388 yuan.
Figure 9. Years of e-commerce experience for e-households

Besides this average treatment effect on the treated in the overall Taobao Village population, we
are also interested in whether the treatment effects (participation in e-commerce) differ in
subsamples stratified by household wealth level and by key characteristics of household heads.
4.3.2 Stratification by wealth
 To answer the question of whether people who are wealthier would benefit more from e-
commerce participation, we analyze the e-commerce effects in subsamples with different wealth
status. Figure 10 shows the results by stratifying the full sample into quartiles ranked by the wealth
index, which is constructed from household ownership of various durable assets. 14 The e-commerce
participation effects from the lowest to the highest wealth quartiles are 25,360 yuan, 26,996 yuan,
33,944 yuan, and 32,906 yuan. E-commerce benefits increase with wealth status in absolute terms,
but slightly level off in the 4th quartile. Even though the absolute gains from e-commerce
participation are higher in quartiles 1 and 2 than in quartile 4, in relative terms, the growth rate of
quartiles 1 and 2 at 95 percent and 98 percent, respectively, are higher than that of the wealthiest at
56 percent. The result shows that the growth incidence due to e-commerce participation is pro-poor.
Previous studies have shown that rural e-commerce can reduce the income gap between urban and

14
 The wealth index is constructed from principal component analysis of the household’s ownership of automobiles,
trucks, motorcycles, tractors, personal computers, laptops, air conditioners, televisions, cell phones, and dwellings.

 20
You can also read