Availability, Access and Affordability: Understanding Broadband Challenges in New York State - Office of the New York State ...
←
→
Page content transcription
If your browser does not render page correctly, please read the page content below

Availability, Access
and Affordability:
Understanding Broadband
Challenges in New York State
September 2021
Message from the Comptroller

September 2021

Three decades ago, home internet access was a cutting-edge innovation
for many New York households. Today, reliable high-speed internet is a
necessity to effectively work, learn, communicate and play in our society.
The COVID-19 pandemic highlighted the importance of having broadband
internet connections at home, as stay-at-home orders required millions of
New Yorkers to participate in remote learning and work.

Fortunately, New York State has made great progress building
broadband infrastructure and ranks second in the country for the share of
population with access to basic broadband speeds. However, there are still
over 250,000 New Yorkers for whom broadband service is unavailable in their
neighborhood, and even more for whom broadband is unavailable in their home
or place of business. Deployment to rural areas has lagged in New York and
nationwide; however, nearly half of those in the state without broadband available
live downstate in New York City, Long Island, and in the Mid-Hudson Valley. New
York must do everything it can to advance “last mile” broadband services.

More troubling is that more than 1 million New York households do not have access
or a subscription to home broadband as of 2019. Cost is an impediment for many
New Yorkers. In 2019, one in three low-income households did not have access
to broadband. In addition, large percentages of New Yorkers aged 65 and older and
those with low educational attainment do not have broadband subscriptions. These
disparities disadvantage these New Yorkers in conducting their studies, working,
or applying for employment or government assistance. The disparities also harm
communities. Broadband connections are an imperative not only for economic
development, but also for equality of opportunity.

As we emerge from the disruptions of the COVID-19 pandemic, we should heed
lessons learned over the past 18 months and develop strategies to address these
challenges. New federal funding and programs provide a critical opportunity for the
State to make broadband available, accessible and affordable to all New Yorkers.

Thomas P. DiNapoli
State Comptroller
Contents

Introduction and Executive Summary .  .  .  .  .  .  .  .  .  .  .  .  .  .  .  .  .  .  .  .  . 1

Broadband Availability Across New York State.  .  .  .  .  .  .  .  .  .  .  .  .  .  .  . 3

New Yorkers’ Access to Broadband .  .  .  .  .  .  .  .  .  .  .  .  .  .  .  .  .  .  .  .  .  . 9
  National Benchmarking.  .  .  .  .  .  .  .  .  .  .  .  .  .  .  .  .  .  .  .  .  .  .  .  .  .  .  .  . 9
  Broadband Access by New York State Region .  .  .  .  .  .  .  .  .  .  .  .  .  .  .  .  . 12
  Broadband Access by Demographic Indicators .  .  .  .  .  .  .  .  .  .  .  .  .  .  .  .  14
  Costs of Broadband Access.  .  .  .  .  .  .  .  .  .  .  .  .  .  .  .  .  .  .  .  .  .  .  .  .  .  17

Policies to Support Broadband.  .  .  .  .  .  .  .  .  .  .  .  .  .  .  .  .  .  .  .  .  .  .  .  20
  Pandemic-Related Policies.  .  .  .  .  .  .  .  .  .  .  .  .  .  .  .  .  .  .  .  .  .  .  .  .  .  . 22

Recommendations for New York’s High-Speed Future .  .  .  .  .  .  .  .  .  .  .  26
  Pursue Universal Availability of Highest-Speed Connections.  .  .  .  .  .  .  .  .  26
  Enhance Access for Low-Income Households .  .  .  .  .  .  .  .  .  .  .  .  .  .  .  .  . 27
  Improve Affordability.  .  .  .  .  .  .  .  .  .  .  .  .  .  .  .  .  .  .  .  .  .  .  .  .  .  .  .  .  .  28
  Make New York’s Broadband Strategy Actionable and Accountable .  .  .  .  .  . 28

Appendices
  Appendix A: Broadband Availability and Access by New York State
  County, 2019.  .  .  .  .  .  .  .  .  .  .  .  .  .  .  .  .  .  .  .  .  .  .  .  .  .  .  .  .  .  .  .  .  .  29
  Appendix B: Share of New York City Residents Without Broadband
  Access by Age, Educational Attainment, Race/Ethnicity and Borough, 2019.  31
  Appendix C: New York State Broadband Projects Funded by the
  American Recovery and Reinvestment Act (ARRA) .  .  .  .  .  .  .  .  .  .  .  .  .  . 32

Endnotes .  .  .  .  .  .  .  .  .  .  .  .  .  .  .  .  .  .  .  .  .  .  .  .  .  .  .  .  .  .  .  .  .  .  .  .  33
Introduction and Executive Summary
Since entering American homes in the early 1990s, the internet has fundamentally
changed the way people work, play, learn, transact business and conduct their
lives. In 2021, 85 percent of U.S. adults reported using the internet at least once
per day.1 As commerce, recreation, services and other facets of life have moved
online, reliable high-speed internet connections have grown in importance.
Research finds that access to broadband internet can have positive effects
on individuals and communities.2
The COVID-19 pandemic accelerated trends in home internet use, with large
numbers of households engaging in school and work from home. The monthly
weighted average of internet data consumed at the end of 2020 was up 75
percent from the start of the pandemic in March 2020.3 In New York State, over
70 percent of adults in households with children in school reported to the U.S.
Census Bureau that student classes had shifted to distance learning at least
partially by the end of March 2021. Among working households, 41 percent
had at least one adult shift their work to a teleworking environment.4 It has not
been uncommon for all members of a household to be online simultaneously to
complete work or schooling, and high-speed connections have been necessary
to operate unhindered by delays or disruptions in connectivity.
New York has made great progress in making high-speed connections available
across the state. Using the speed standard for basic broadband service, New
York currently ranks second among states in the percentage of the population
with broadband available at home.5 Importantly, at least one provider offering
broadband of at least 250/25 Mbps speeds is available to more than 98 percent
of New York’s population, according to the Federal Communications Commission
(FCC).6 (See “Broadband Internet 101” for discussion of broadband speed
measures.) Nevertheless, in some predominantly rural counties, deployment
has lagged, and the share of the population without broadband is as high
as 23 percent in these communities.
More revealing is the fact that more than 1 million, or 13.8 percent of, New York
households do not have subscriptions to broadband internet, and many of these
households earn less than $20,000 annually. One in three low-income households
lacks access. While some use smartphones with robust capabilities to address
their needs, cost is commonly cited as a top reason for not having broadband at
home. For low-income households, a home broadband subscription might stretch
budgets too thin and force trade-offs with other household essentials. As a result,
the “digital divide” caused by these access disparities disproportionately impacted
low-income households during the pandemic and may generally present
a disadvantage for these New Yorkers and their communities.
1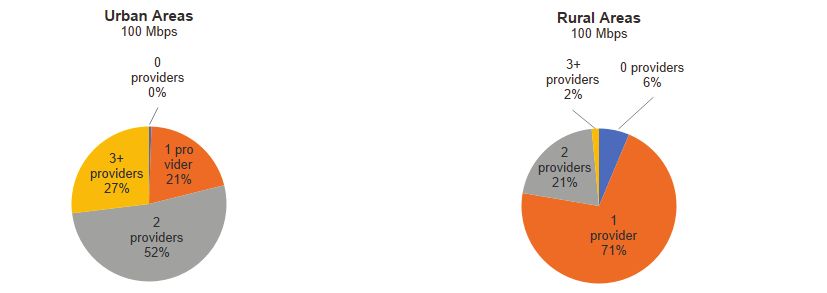
Recent developments in federal policy — particularly the flexible funding provided
under the American Rescue Plan, new federal programs geared at improving
affordability for low-income households, and the potential for additional
infrastructure dollars earmarked for broadband — provide an important
opportunity for New York to craft an ambitious and detailed strategy to:
  l   Accelerate universal availability of the highest-speed connections
      in every part of the state, including in rural areas;
  l   Enhance access for low-income households; and
  l   Improve affordability, particularly for low-income residents.

Developing this strategy should include: setting concrete goals for each objective;
identifying obstacles and barriers; identifying available federal, State, and local
funding sources; and establishing interim metrics and a public reporting schedule
to ensure accountability for progress.

      Broadband Internet 101
      Internet speed is defined by download and upload speeds. Download
      speed is how fast information travels from the internet to the device, such
      as computer or smartphone. Greater download speeds enable the user to
      access information faster and with less interruption. Upload speed is how fast
      information travels from the connected device to the internet. Faster upload
      speeds enable the user to more quickly put information onto the web, email,
      or other applications.

      The Federal Communications Commission (FCC) defines “broadband” internet
      speeds as 25 megabits per second (Mbps) of download speed and 3 Mbps
      of upload speed, often referred to as “25/3.” This speed generally allows for
      email, web browsing, and streaming a video without interruption and is a speed
      achieved by most mobile networks; however, modern multi-user demands
      within a household — say, for multiple simultaneous video-conference calls —
      require significantly greater bandwidth. Unfortunately, less reliable information
      is available on higher-speed broadband, which is common at speeds of
      250/25 Mbps and even 1000 Mbps in some limited areas. Therefore, this
      report follows the FCC benchmark and uses a “25/3” standard for broadband,
      unless otherwise noted.

                                                          2
Broadband Availability Across New York State
While the federal government provides funding for state infrastructure projects like
road and bridge construction and repair, deployment of broadband infrastructure
has largely been the responsibility of states and the private sector.
New York State did not construct a public broadband system, but instead solicited
applications to invest in broadband infrastructure projects from private providers
and organizations on a competitive basis. The regulatory function of overseeing
broadband and service providers is the responsibility of the New York State Public
Service Commission. The Empire State Development Corporation oversees the
State’s Broadband Program Office, which administers the funds allocated for
expanding the infrastructure.
According to the FCC, New York has done well in deploying broadband
infrastructure at the speed of 25/3 Mbps. As shown in Figure 1, in 2019 New
York ranked second in the country with 98.7 percent of the population in areas
“served” with broadband compared to a national average of 95.6 percent. In all
but nine states, broadband is available to more than 90 percent of the population.
The FCC also reports that at least one provider offering high-speed broadband of
at least 250/25 Mbps speeds is available to more than 98 percent of New York’s
population as of June 2020.7
3FIGURE 1
Percentage of Population with Broadband Available, by State, 2019
Note: Based on a 25/3 Mbps standard relied on by the Federal Communications Commission.
Source: Federal Communications Commission, Fourteenth Broadband Deployment Report, January 19, 2021
4The FCC considers an area “served” by broadband if an internet service provider
reports that it has made broadband available to a particular census block,
even if service is not necessarily available to every location or dwelling on that
block. This is a significant limitation. As the FCC notes, this methodology “could
overstate the coverage (availability) experienced by some consumers, especially
in large or irregularly-shaped census blocks. However, these data nonetheless
remain the best and most granular data available.”8
In New York and in other leading states, most broadband deployment occurred
before 2013, as shown in Figure 2. While broadband availability has lagged
in rural areas nationwide, these areas have made significant gains in recent
years. According to the FCC, 61.5 percent of the population in rural areas had
broadband available in 2015 compared to 96.7 percent in urban areas; by 2019,
those figures increased to 82.7 percent for rural areas and 98.8 percent for urban
areas.9 Figure 2 shows that rural states such as Mississippi, Arkansas, and West
Virginia that lagged in deployment have made significant gains since 2013.
FIGURE 2
States with Highest and Lowest Percentages of Population with Broadband
Availability, 2013-2019
Notes: Based on a 25/3 Mbps standard relied on by the Federal Communications Commission. Figures for 2013 for Rhode
Island restated based on 2016 figures.
Sources: Federal Communications Commission, Broadband Deployment and Progress Reports, 2015, 2018, and 2021
5According to the FCC, New York’s successful deployment has reduced the
number of New Yorkers without available broadband from a reported 518,000 to
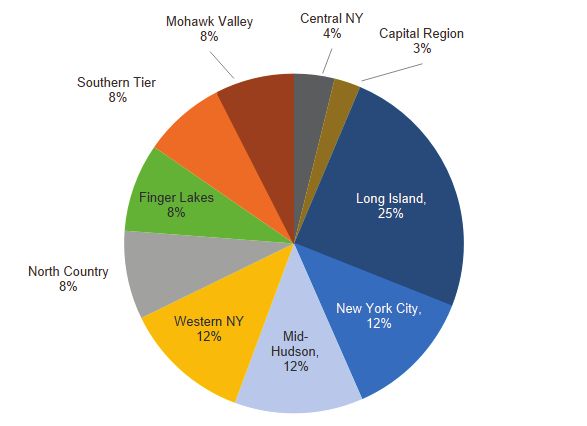
253,000 people between 2013 and 2019.10 As shown in Figure 3, approximately
half of those without broadband available are downstate: 25 percent are from
Long Island, 12 percent from New York City and 12 percent from the Mid-Hudson
Valley. The Capital Region has the lowest number of people in the state without
broadband available at 3 percent, approximately 6,000 people.
FIGURE 3
Distribution of People Without Broadband Available in New York State,
by Region, 2019
Note: Based on a 25/3 Mbps standard relied on by the Federal Communications Commission.
Source: Office of the State Comptroller analysis of Federal Communications Commission, Fourteenth Broadband Deployment
Report, January 19, 2021
According to the FCC, approximately 1.3 percent of New York’s population did
not have broadband available in 2019. Regionally, this varied from a high of 5.0
percent in the North Country to a low of 0.4 percent in New York City. As shown in
Figure 4, availability rates were lowest in regions with greater shares of population
living in areas classified as rural: the North Country, the Southern Tier, and the
Mohawk Valley.
6FIGURE 4
Broadband Availability Rates by New York State Region, 2019
Percentage Percentage of
Population
of Population Population Living in
NYS Region Population Without
Without an Area Classified
Broadband
Broadband as Rural
North Country 415,678 20,914 5.0% 64.2%
Mohawk Valley 483,086 18,569 3.8% 47.2%
Southern Tier 628,855 19,569 3.1% 47.9%
Western NY 1,377,094 30,041 2.2% 20.2%
Long Island 2,833,525 61,231 2.2% 1.5%
Finger Lakes 1,200,799 20,877 1.7% 26.5%
Mid-Hudson 2,323,774 30,349 1.3% 15.5%
Central NY 772,749 9,549 1.2% 31.2%
Capital Region 1,081,179 6,198 0.6% 28.4%
New York City 7,860,674 30,762 0.4% 0.0%
Note: Based on a 25/3 Mbps standard relied on by the Federal Communications Commission.
Source: Office of the State Comptroller analysis of Federal Communications Commission, Fourteenth Broadband Deployment
Report, January 19, 2021
The regional perspective masks considerable variation among counties. Figure
5 highlights the New York counties where more than 5 percent of people do not
have broadband available.11 In all of these counties, more than 50 percent of the
population live in an area classified as rural. Appendix A provides availability rates
for all counties in New York.
7FIGURE 5
New York State Counties with More than Five Percent of Population
Lacking Available Broadband, 2019
Percentage Percentage of
Population
of Population Population Living in
County Population Without
Without an Area Classified
Broadband
Broadband as Rural
Allegany 46,091 10,773 23.4% 82.0%
Cattaraugus 76,117 13,625 17.9% 63.0%
Hamilton 4,416 649 14.7% 100.0%
Wyoming 39,859 5,819 14.6% 67.4%
Lewis 26,296 3,813 14.5% 87.9%
Steuben 95,379 9,538 10.0% 61.8%
Livingston 62,914 5,851 9.3% 55.7%
Otsego 59,493 4,938 8.3% 73.4%
Yates 24,913 1,669 6.7% 72.3%
Clinton 80,485 5,232 6.5% 64.5%
Herkimer 61,319 3,924 6.4% 53.9%
Essex 36,885 2,250 6.1% 76.3%
Madison 70,940 4,115 5.8% 59.7%
Note: Based on a 25/3 Mbps standard relied on by the Federal Communications Commission.
Source: Federal Communications Commission, Fourteenth Broadband Deployment Report, January 19, 2021
8New Yorkers’ Access to Broadband
Broadband availability indicates a geographic area has been wired for that service.
Access to broadband indicates that a household has a subscription for broadband
services. While many New Yorkers access broadband through an employer, library
or school, the data capture only broadband subscriptions that allow for home use,
including cellular service.
Research has consistently demonstrated broadband internet offers benefits
to individuals, communities, and larger economies; however, as researchers
at Penn State University noted in a report for the National Science Foundation:
Broadband is a net positive good, but its effects are neither uniform
nor unqualified…. Individuals, communities, businesses and economic
sectors differ in their ability to benefit from broadband, depending on a
number of factors related to individual/community characteristics and
environmental factors.12
In New York, the gap between availability and access is significant: While only
250,000 people do not have broadband available in their neighborhoods, more
than 1 million households, or 13.8 percent, did not have access or a subscription
to broadband in their homes as of 2019, according to estimates from the U.S.
Census Bureau.13 In New York, those without access tend to have less than high
school education; have income less than $20,000; and/or are age 65 and older.
Furthermore, few households have access to the higher-speed connections
that were proven essential during the pandemic. While 86.2 percent of New York
households have access to broadband at speeds of at least 25/3 Mbps, only
13.5 percent have home broadband subscriptions of at least 250/25 Mbps.
National Benchmarking
The share of New York households lacking access, 13.8 percent, is nearly on par
with the national average of 13.6 percent.14 New York ranks 24th among states
in share of households without access. As shown in Figure 6, Mississippi has the
greatest share of households without access (23.2 percent) while Washington
ranks the best, with only 8.8 percent of households lacking access.
9FIGURE 6
Share of Households Lacking Access to Broadband, Selected States
and Nation, 2019
Source: U.S. Census Bureau, American Community Survey, 2019
Between 2015 and 2019, the U.S. Census Bureau reported modest growth in
New York households with broadband subscriptions. Compared to national growth
of 9.7 percentage points, New York household broadband subscriptions grew by
8.4 percentage points from 77.8 percent to 86.2 percent.
While New York is in the middle of the pack nationwide for access, it ranks well
in terms of higher-speed subscriptions. According to the FCC, among large
states, New York has the greatest share of households with home broadband
subscriptions of at least 250/25 Mbps. The FCC collects data on subscriptions
from internet service providers, and calculates an “adoption rate” by dividing these
subscriptions by the number of households living in an area where broadband has
been deployed at various speeds.15 New York subscription rates at 250/25 Mbps
are 13.5 percent, almost double the median state, North Carolina, at 7.3 percent.
Among neighboring states, subscription rates for high-speed 250/25 Mbps service
are higher only in New Jersey, at 20.2 percent.
10FIGURE 7
New York Compared to Other Large and Nearby States,
Adoption Rates by Broadband Speed, 2019
State 50/5 Mbps 100/10 Mbps 250/25 Mbps
Large States
New York 74.3% 68.2% 13.5%
Texas 62.1% 50.5% 12.5%
California 70.1% 51.3% 6.5%
Florida 75.9% 63.2% 6.0%
Illinois 57.8% 46.1% 3.4%
Median State at 250/25 Mbps
North Carolina 66.1% 60.2% 7.3%
Near New York State
New Jersey 85.6% 64.3% 20.2%
Massachusetts 85.2% 53.0% 10.7%
Pennsylvania 68.8% 43.5% 9.7%
Connecticut 67.1% 48.4% 8.2%
Notes: Adoption rates are the number of residential subscriptions divided by the number of households in the area where
the FCC’s deployment data indicate that fixed terrestrial services of at least the designated speed are deployed. North Carolina
is the median state at speeds of 250/25 Mbps; at speeds of 100/10 Mbps and 50/5 Mbps, median states are Michigan
(49.2 percent) and Georgia (60.1 percent), respectively.
Source: Federal Communications Commission, Fourteenth Broadband Deployment Report, January 19, 2021
As shown in Figure 7, subscription rates decline as internet speeds increase; one
reason is the price of service tends to increase with the speed of service. Another
reason is that not all neighborhoods may have the fastest speeds available.
High-speed broadband has become increasingly important. As noted in the FCC
report, even prior to the pandemic, there has been “increased demand for data-
intensive services such as telework platforms, distance learning, telehealth and
video conferences.”16 The COVID-19 pandemic has crystalized the demand
for home high-speed broadband, as stay-at-home orders have resulted in
multiple family members uploading and downloading large quantities of data
simultaneously within a household. As shown in Figure 8, weighted average
broadband data usage increased sharply in March 2020 to 400 gigabytes
(GB) per month, a 26 percent increase from the same month one year prior.
It remained above an average of 380 GB through the summer of 2020, and
increased sharply again in September 2020 with the start of a new school year.
In December 2020, usage grew to more than 480 GB per month on average —
an increase of 51 percent from the pre-pandemic baseline in February 2020.17
Some households upgraded their subscriptions to accommodate increased
11demands within their homes during this time; however, other New Yorkers may
not have had that option due to a lack of availability of higher-speed connections
or due to affordability concerns.
FIGURE 8
Broadband Data Usage by Month
March 2019 – December 2020
Source: OpenVault, Broadband Insights Report, Q4 2020
Broadband Access by New York State Region
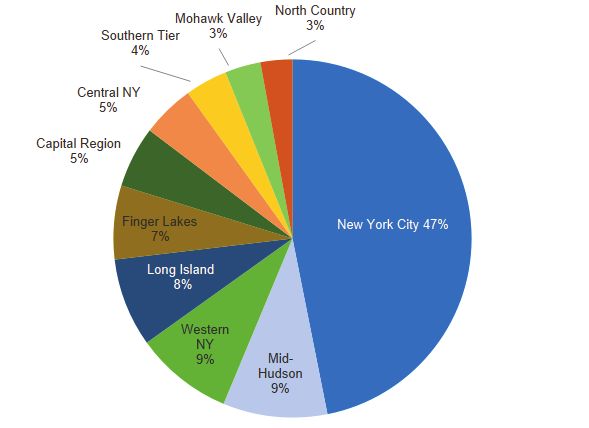
As shown in Figure 9, almost half of all households without broadband access
are in New York City. While the FCC reports only 0.4 percent of New York City
residents, or approximately 31,000 people, do not have broadband available,
more than 513,800 households are without access. In contrast, the availability/
access gap is far narrower in Long Island: about 61,200 Long Island residents
do not have broadband available and 87,700 households do not have access.
12FIGURE 9
Distribution of New York Households Without Broadband Access,
by Region, 2019
Source: Office of the State Comptroller analysis of U.S. Census Bureau, American Community Survey, 2019
In 2019, the share of households without broadband access varied from a high
of 19.3 percent in the North Country to a low of 9.2 percent in Long Island, as
shown in Figure 10. Appendix A shows that more than one in five households did
not have access to broadband in 13 counties. The median share of households
without broadband access across counties is 16.6 percent.
FIGURE 10
Broadband Access Rates by New York State Region, 2019
Share of
Households
Households
Total Without
NYS Region Without
Households Broadband
Broadband
Access
Access
North Country 162,690 31,387 19.3%
Mohawk Valley 194,408 35,317 18.2%
Central NY 305,678 52,369 17.1%
Southern Tier 251,445 41,790 16.6%
Western NY 594,617 96,826 16.3%
New York City 3,211,033 513,812 16.0%
Finger Lakes 491,662 72,893 14.8%
Capital Region 445,346 60,586 13.6%
Mid-Hudson 831,316 103,056 12.4%
Long Island 949,542 87,730 9.2%
Source: Office of the State Comptroller analysis of U.S. Census Bureau, American Community Survey, 2019
13Broadband Access by Demographic Indicators
Access to home broadband differs according to age,
educational attainment, race/ethnicity, and household
income. Access rates improve as income improves,
1 in 3
low-income
leading to a wide disparity between households with
income less than $20,000 and those with income greater
households lacked
than $75,000 — 36.2 percent lacked access compared to access to home
4.5 percent, respectively, in 2019. Access rates improved broadband
across all income levels between 2015 and 2019, but in 2019
gains were greatest for households earning less than
$20,000, as shown in Figure 11.
FIGURE 11
Share of New York Households Without Access to Broadband,
by Household Income, 2015 and 2019
Source: U.S. Census Bureau, American Community Survey, 2019
14A recent Census report notes that low-income households are more likely
to access broadband services using a smartphone rather than a fixed home
subscription that allows for connections to a computer or other device. In 2018,
11 percent of households with annual income less than $25,000 accessed internet
through a smartphone alone — compared to about 1 percent of households
making $150,000 or more.18 Today smartphones offer robust capabilities to
accomplish many common and important tasks, such as banking, shopping,
and videoconferencing, and may be sufficient for some users’ needs; indeed,
the share of internet traffic from mobile devices has increased from 6 percent
10 years ago to 48 percent in 2021, comparable to the share from desktop
computers.19 However, smartphones are not suitable for activities that require
sustained attention and interaction, such as remote instruction or teleworking,
nor for transmittal of large amounts of data.
Smartphones vs. Home Broadband
A 2021 survey by the Pew Research Center estimates that 85 percent of
U.S. adults owned a smartphone compared to 77 percent with broadband
subscriptions and 78 percent with a desktop or laptop computer. The same
survey finds 15 percent of U.S. adults are “smartphone-only” internet users
(with no home broadband), and the most smartphone-dependent tend to be
users under the age of 30 (28 percent of that group) and those with income
less than $30,000 (27 percent). Interestingly, the survey found 71 percent of
non-broadband users say they are not interested in having home broadband.
The three most commonly cited reasons were: access to internet outside
the home (46 percent); robust smartphone capabilities that meet online user
needs (45 percent); and subscription costs (45 percent). More than a quarter
of respondents cited costs (subscription and computer) as the most important
reason for not having broadband at home.
Source: Andrew Perrin, “Mobile Technology and Home Broadband 2021,” Pew Research Center, June 3, 2021
15FIGURE 12
Share of New Yorkers Without Access to Broadband by Age,
Educational Attainment, and Race/Ethnicity, 2015 and 2019
Change in
2015 2019
Share
Age
Under 18 Years 15.8% 8.7% -7.1%
18 to 64 Years 14.7% 8.0% -6.7%
65 Years and Older 34.1% 23.8% -10.3%
Educational Attainment
Less than High School 38.0% 26.7% -11.3%
High School Degree, Some College, or Associate's Degree 21.2% 13.6% -7.6%
Bachelor's Degree or Higher 8.5% 4.9% -3.6%
Race/Ethnicity
White 16.1% 10.4% -5.7%
Black/African American 24.6% 13.9% -10.7%
Asian 10.6% 7.2% -3.4%
Hispanic or Latino (any race) 22.8% 11.7% -11.1%
Source: U.S. Census Bureau, American Community Survey, 2015 and 2019
New Yorkers who lack access also tend to be older or to have lower educational
attainment. As shown in Figure 12, New Yorkers age 65 and over lack access at
almost three times the rate of New Yorkers ages 18 to 64. Nearly one-quarter of
older New Yorkers lacked access in 2019, compared to 8.0 percent of those ages
18 to 64 and 8.7 percent of those under 18. However, access improved more for
older New Yorkers between 2015 and 2019 than for those in other age groups.
Almost 5 percent of highly educated New Yorkers lacked access in 2019
compared to 26.7 percent of New Yorkers with less than a high school education;
however, access rates improved by 11.4 percent for the latter group between
2015 and 2019.
Access rates varied moderately by race and ethnicity in 2019: 7.2 percent of
Asians, 10.4 percent of Whites, 11.7 percent of Hispanics, and 13.9 percent of
Blacks lacked access in 2019. Access rates improved significantly for Blacks and
Hispanics between 2015 and 2019, bringing access rates for these households
closer to those of Asian and White New Yorkers.
16Given the outsized share of New York City residents without access, Appendix B
presents data on access in New York City broken down by demographic indicators
and by borough.
Costs of Broadband Access
Prior research has found broadband availability and access rates are driven by
factors such as geographical disparities, deployment costs, provider competition,
market demand, and socioeconomic factors.20 The experience in New York is
consistent with these general findings: deployment lags in rural regions and
low-income households suffer from low access rates. Demand in less-dense rural
regions may not generate a sufficient revenue stream to support deployment
costs from the private sector, while low incomes may make the price of a home
broadband subscription unattainable.
FIGURE 13
Share of Urban and Rural New York Population with Broadband Available
at 100 Mbps and 250 Mbps by Number of Service Providers, June 2020
Source: Federal Communications Commission, Fixed Broadband Deployment Area Comparison, June 2020 dataset
17While public data on deployment costs are not available, the FCC reports on
providers serving a given area and the broadband speeds they make available.21
Typically, competition is considered robust if there are at least three providers
or competitors for a service; robust competition helps keep prices lower for
consumers. FCC data show that almost the entire state population has a choice
of three providers for minimum broadband service of 25/3 Mbps; however,
for faster speeds, fewer options are available. As of June 2020, 23.8 percent
of New Yorkers had three available providers offering 100/10 Mbps speeds,
and 13.1 percent had three providers offering 250/25 Mbps speeds.22
As shown in Figure 13, competition is more robust in urban areas. At 100 Mbps
download speeds, 79 percent of New Yorkers in urban communities had a choice
of at least two broadband providers; in contrast, only one provider was available
to 71 percent of New Yorkers in rural communities.
No comprehensive standardized dataset is available on broadband costs to
consumers throughout the state or nationally. Similarly, while broadband is
becoming a necessity in modern life, there is no widely acceptable benchmark
for what constitutes affordable broadband service in the way that, for example,
30 percent of household income is considered an acceptable standard for housing
costs and used by the U.S. Department of Housing and Urban Development
to set housing policies.
A 2020 survey of 350,000 internet customers across the country conducted by
a commercial enterprise found average monthly broadband costs in New York
of almost $47, for an annual cost of $563. New York ranked fourth lowest in the
nation. Vermont ranked the highest at $82 per month and Arkansas ranked the
lowest at $35 per month, as shown in Figure 14.23
18FIGURE 14
States with the Highest and Lowest Average Monthly Broadband Prices, 2020
Lowest Cost States Average Monthly Price Highest Cost States Average Monthly Price
Arkansas $35.00 Vermont $82.00
California $45.43 Delaware $76.36
South Carolina $45.47 Maryland $70.76
New York $46.94 New Hampshire $70.71
Kentucky $46.97 Maine $65.62
United States $48.25
Source: Data provided to the Office of the State Comptroller from Highspeedinternet.com
These costs are hard to interpret for several reasons: they are influenced by state
and local policies, the number of providers, speeds offered, take-up rates and
subscriptions according to speed of service, and other factors. In other words,
it is possible states with seemingly high average monthly costs may be providing
higher speeds of service and have robust competition that makes prices for those
services comparatively lower, essentially offering consumers a higher quality of
service for each dollar spent. Similarly, low prices may reflect subscriptions to
predominantly low-speed services.
In December 2020, the U.S. Bureau of Labor Statistics reported that the average
annual expenditures in 2019 for a four-person household earning between $15,000
and $29,999 were about $38,000. The gap between earnings and expenses is filled
by public assistance programs, tax credits, gifts and loans. For these households,
approximately $22,000 annually — almost the entirety of or more than household
earnings — is spent on food and housing, including utility costs.24 At an average
annual cost of $563, broadband services would constitute less than 2 percent of
household expenses; however, households may have to sacrifice other essential
needs to pay for broadband service.
19Policies to Support Broadband
By the late 1990s broadband was becoming available in the residential market
through dedicated subscriber lines (DSL) or cable lines. Decisions on deployment
were largely driven by market conditions and the ability of telephone and cable
providers to recoup large capital investments. A 2007 report by the New York
State Department of Public Service concluded the uneven economics were
resulting in a “digital divide” between urban and rural parts of New York State,
and stated: “Should it be determined that the state has an interest in all New
Yorkers having affordable access to broadband, reliance on markets may
not be enough.”25
State policy goals subsequently focused on improving the strong but unequal
deployment that resulted from the market-driven approach. In 2007, Governor
Eliot Spitzer formed the New York State Council for Universal Broadband, an
advisory group of public, private and academic partners charged with issuing
recommendations to achieve universal broadband access, among other
objectives. The goals were to achieve 1/1 Mbps speeds statewide and 20/20 Mbps
in metropolitan areas by 2010, and 20 Mbps speeds statewide and 100 Mbps
in metro areas by 2015.
The Universal Broadband Program Management Office (PMO) was established to
administer a new $5 million Universal Broadband Access Grant Program to expand
broadband access and be a single point of contact for the state’s broadband
development and deployment efforts.26 Between 2008 and 2011, PMO allocated
funding to nine project sponsors across the state, including local governments,
internet service providers, nonprofit associations and the New York State Library.27
These efforts were further bolstered by investments made by the 2009 federal
American Recovery and Reinvestment Act (ARRA) to expand availability and
adoption of broadband. PMO was renamed the New York State Broadband
Program Office (BPO) and placed under the Empire State Development
Corporation, reflecting in part the importance of broadband to economic
competitiveness. BPO facilitated the submission of 263 statewide grant
applications which resulted in $160 million in ARRA funding being awarded
directly to New York State project sponsors.28 These projects included grants
intended to extend deployment by building out new miles of fiber optic cable,
in addition to purchasing equipment and connecting underserved communities.
The projects are listed in Appendix C.
With greater resources provided by ARRA, Governor David Paterson issued
Executive Order 22 (EO22) in June 2009 establishing the Broadband
Development and Deployment Council (BDDC) to replace the Universal
Broadband Council. This new Council comprised representatives of State
agencies and was intended to improve coordination in order to leverage federal
resources, to better understand weaknesses in broadband deployment, and
to develop strategies to boost both availability and access statewide and in
20distressed communities. EO22 also recognized the importance of broadband
to the State’s economy and competitiveness.29 BDDC subsequently released
a report in May 2011 which highlighted substantial disparities in access for
economically and socially disadvantaged New Yorkers.30
State policies shifted to closing the digital divide and improving available speeds.
Between 2011 and 2013, $19 million was awarded via the Regional Economic
Development Councils to 11 projects, and an additional $25 million was awarded
under a Connect NY grant program to 18 projects.31 In 2015, the New NY
Broadband Program (NNYBP) was launched to allocate $500 million to incentivize
the expansion of broadband access in unserved and underserved areas with the
goal of providing 100 Mbps service in most areas and at least 25 Mbps service in
remote areas.32 Awards of up to 80 percent of the projected capital project costs
were granted to internet service providers offering the lowest bids to upgrade
existing services or provide new services to primarily rural geographic areas.
NNYBP provided funding from 2016 to 2018. In January 2017, $170 million
in federal funds provided under the Connect America Funding program were
distributed through the program, for a total of $670 million authorized. As shown in
Figure 15, almost $500 million in State grants were made with total investment of
nearly $735 million and more than 264,000 locations (commercial and residential)
served. The North Country and the Southern Tier, predominantly rural regions,
received the greatest amounts of State funding. As demonstrated earlier in this
report, both availability and access improved during this period; however, it is
unclear to what extent gains were made in increased speeds.
FIGURE 15
New NY Broadband Program: Grants, Investment, and Locations Served
Region State Grants Total Investment Locations Served
North Country $108,141,512 $155,916,206 53,413
Southern Tier 96,324,000 137,327,605 54,285
Capital Region 96,304,398 136,948,887 62,648
Western NY 79,608,128 116,278,234 36,959
Mohawk Valley 60,418,225 104,805,085 22,596
Central NY 42,239,989 62,888,875 15,115
Finger Lakes 9,953,357 13,970,875 12,138
Mid-Hudson 3,114,729 5,236,657 6,175
Long Island 983,989 1,250,828 1,087
New York City 0 0 0
TOTAL $497,088,327 $734,623,252 264,216
Source: NY Broadband Program Office
21In addition to direct public subsidies, the State also attempted to use its regulatory
powers to achieve broadband goals. In 2016, the Public Service Commission
(PSC) approved the merger of two major telecommunications companies, Charter
Communications and Time Warner Cable, a deal expected to impact 2.6 million
customers across New York State. The merger was approved with several
conditions intended to improve availability, access and affordability, including:
l Expansion of existing network to 145,000 underserved households and
businesses, phased in with 36,250 new premises each year until May 2020;
l Speed increases to 100 Mbps statewide by 2018 and 300 Mbps by 2019; and
l Free internet to 50 community centers statewide and reduced-price services
to 700,000 low-income New Yorkers. After the merger, the PSC mandated
the program provide minimum speeds of 30 Mbps for $15 per month.33
An audit by the Office of the State Comptroller found that Charter did not meet
several of its obligations, including provisions regarding free and affordable
internet and network speed increases.34 After a series of rulings that levied
multi-million-dollar fines, the PSC revoked approval of the merger in 2018, and
ultimately reached settlement terms with the company in 2019 that continued
to require the expansion to 145,000 premises by September 30, 2021.35
State action taken around this time may also have discouraged broadband
expansion. As part of the State Fiscal Year (SFY) 2019-20 Enacted Budget, the
Department of Transportation was authorized to levy fees on telecommunications
companies using State highway rights-of-way for fiber optic cables. Projects
funded by State grants through the New NY Broadband Program were exempted.
The fees were opposed by providers; according to news reports, some
abandoned plans for network expansion.36 Several members of the Legislature
from the North Country expressed concerns: “This fee does nothing more than
disincentivize the expansion of rural broadband and is nothing more than a
roadblock for rural broadband expansion.”37 Given the difficult market dynamics
of wiring rural areas, the fees may have added to the challenge.
Pandemic-Related Policies
Despite gains made in the last 20 years, the COVID-19 pandemic highlighted how
the digital divide continues to impact New Yorkers without access to broadband
at home; the stay-at-home orders meant that points of access to broadband in
common or community settings, such as the library, school, or workplace, were
rendered unavailable. As a recent UCLA study using Census data revealed,
low-income households were disproportionately impacted by the switch to
remote and hybrid schooling. Furthermore, the study found that African American
and Hispanic students were 1.3 to 1.4 times more likely than White students
nationwide to experience limited accessibility during the fall 2020 semester.38
22Federal, State and local governments launched initiatives to address these
inequalities. (See “Recent New York City Broadband Policies” for more detail.)
In March 2020, the FCC established a Rural Digital Opportunity Fund to invest
$20.4 billion over 10 years to bring fixed broadband to rural homes and small
businesses. The Phase I auction in December 2020 awarded over $9 billion
nationally; New York State had 10 winning bids to serve 46,647 locations and
was awarded $10 million.
In December 2020, the federal Consolidated Appropriations Act of 2021,
which included the $900 billion COVID-19 relief package, earmarked $7 billion
for expanding internet access, including $3.2 billion for the Emergency Broadband
Benefit Program.39 The program was created to assist low-income households
and others impacted by the pandemic by providing a $50 per month subsidy
($75 for households on Tribal lands) and a one-time discount on a computing
device. Eligible households must: have income at or below 135 percent of the
federal poverty line; have experienced loss of income due to the pandemic or; be
receiving other government benefits.40 The Program began in May 2021; as of
September 5, 2021, 326,857 New York households had enrolled.41
The legislation also directed $1.6 billion to the National Telecommunications
and Information Administration to launch three new grant programs intended
to expand connectivity, particularly in rural communities; tribal lands, colleges
and universities; and at historically black colleges and universities.42
In March 2021, the federal American Rescue Plan (ARP) allocated over
$12.7 billion in relief to New York State; one permissible use for the aid is
investment in broadband infrastructure. Federal guidance permits use of
funding for: underserved areas; “last-mile” connections that deliver broadband
to households and businesses; projects to increase speeds to at least 100/100
Mbps; and projects to improve access and digital literacy.43 Approximately $350
million was also allocated to New York in capital funding for critical projects,
including broadband and other options to improve connectivity.
On July 28, 2021, the U.S. Senate voted to approve an infrastructure package
that would include an additional $65 billion in broadband investments, including
grants and private activity bonds for deployment, and funding to support rural
areas. The package would also provide additional funding for the Emergency
Broadband Benefit Program; the monthly subsidy would be reduced to $30 per
month and the Program extended for five years.44 The House of Representatives
is scheduled for a final vote on the package no later than September 27, 2021.
23The State has not yet announced a strategy or plan to dedicate any ARP relief
funds to broadband projects; however, in March 2021, the gubernatorial Reimagine
New York Commission released a report that identified four critical objectives
for universal internet connectivity: affordability, digital inclusion, competition,
and equitable digital infrastructure.45 Recommended initiatives included:
l Increase the scale and adoption of affordable access programs;
l Create partnerships providing access to economically disadvantaged
K-12 students;
l Explore solutions that leverage wireless technologies to provide free
or low-cost access to those who need it;
l Enact policies to enhance information available to consumers and foster
competition;
l Enhance data collection on coverage, performance, and infrastructure; and
l Develop and implement a strategy for equitable and universal deployment
of infrastructure.
In furtherance of this agenda, the State launched the ConnectED NY program in
March 2021 to create a $10 million emergency fund to provide broadband access
hotspots to approximately 50,000 students in economically disadvantaged school
districts with private funding. School districts where the share of economically
disadvantaged students exceeds the State average are eligible to receive funds
from the program.46
In an effort to improve affordability of access at home, the Enacted Budget for
SFY 2021-22 included the Affordable Broadband Act requiring internet service
providers to offer $15 per month service, inclusive of taxes and fees, to eligible
low-income households at speeds of at least 25/3 Mbps and $20 per month,
inclusive of taxes and fees, for speeds of at least 200 Mbps. Prices would
increase by the lesser of inflation or 2 percent.47 In April 2021, USTelecom,
CTIA (a national trade association), the New York State Telecommunications
Association and other industry groups filed a lawsuit in U.S. District Court in
Brooklyn seeking to block the law on grounds that it violates federal policy to
not interfere with internet rates. On June 11, 2021, a federal judge issued a
preliminary injunction halting the start of this program.
24As previously noted, the average monthly rate for broadband service in New
York State is approximately $47; therefore, a discounted $15 per month plan
is equivalent to a $32 per month subsidy for eligible households.48 For a
representative low-income four-person household earning between $15,000 and
$29,999 (as described earlier), the plan would reduce the cost of broadband to
less than one-half of 1 percent of household expenses.49 It is unclear what impact
the subsidized program might have on rates for other consumers and on the
potential profitability of providers.
Recent New York City Broadband Policies
The NYC Internet Master Plan (IMP), released in January 2020, aims
to achieve universal broadband access by City residents and to eliminate
the digital divide. It is built on five principles: equity (no barriers because
of identity or place of residence); performance (fast and reliable internet
service); affordability (cost should not be an impediment); privacy (users
should have say in use of their personal information); and choice (there
should be sufficient competition to allow for a variety of options to users).
In March 2021, the City committed $157 million for broadband expansion
and issued a request for proposals (RFP) from interested providers. The RFP,
released jointly by the Mayor’s Office of Information Technology, the Depart-
ment of Small Business Services and the New York City Economic Develop-
ment Corporation, commits to providing successful bidders with access
to more than 100,000 City assets in order to connect 600,000 people.
The City’s response to increased demand for high-speed internet during the
pandemic was consistent with the IMP. In collaboration with nonprofit and
private organizations, broadband was upgraded at community centers at 50
New York City Housing Authority (NYCHA) locations. The City also reached
a settlement with a major service provider to extend fiber optic infrastructure
to 500,000 additional homes across the City.
In addition, the City partnered with providers to issue Wi-Fi enabled tablets
with internet connectivity to students and to elderly citizens (especially from
low-income and less-connected neighborhoods). The collaboration included
free technology and digital literacy training.
25Recommendations for New York’s
High-Speed Future
New York has made great progress in deploying broadband across the State and
reducing gaps in access; nevertheless, there are still significant challenges. Many
predominantly rural areas remain underserved. With only one or two providers
of high-speed broadband in most parts of the State, robust provider competition
is lacking, which in turn tends to make consumer costs higher. One in three
low-income households does not have access to broadband, which magnifies
disparities in access to opportunities. High-speed connections are an imperative
not only for economic development, but also for equality of opportunity.
Recent developments in federal policy—particularly the flexible funding provided
under ARP and the potential for additional infrastructure dollars earmarked for
broadband—provide an important opportunity for New York to craft an ambitious
and detailed broadband strategy. The goals of that strategy should be to:
l Accelerate universal availability of the highest-speed connections,
including in rural areas;
l Enhance access for low-income households; and
l Improve affordability, particularly for low-income residents.
Pursue Universal Availability of Highest-Speed Connections
Future State plans and actions on broadband should not be tethered to an
increasingly obsolete 25/3 Mbps standard; instead, the State should look to the
future and plan for the deployment of gigabit (1000 Mbps) connections. This goal
will require upgrades to current infrastructure systems, as well as deployment
of new technology. Furthermore, it will require developing solutions to improve
sparse deployment in rural areas, where market conditions may be unfavorable
for providers and require significant subsidy of capital costs.
New technology may offer some opportunity for innovation and an adaptive
approach. Fifth generation (5G) cellular technology began to be deployed in
New York in 2019.50 While initially reliant on fiber optic cables, technological
advancements have expanded the wireless capabilities of 5G, and both
telecommunications firms and mobile service providers are investing significant
resources into expanding 5G networks, some of which provide gigabit-speed
connections.
265G wireless technology may be promising as a “last mile” solution in rural areas.
In 2020 the FCC created a $9 billion 5G Fund for Rural America. Using a reverse
auction method similar to the 2016 New NY Broadband Program, the 5G Fund
will target rural areas that lack adequate broadband services to support long-
term infrastructure investments over a period of up to 10 years.51 The first phase
of fund awards will begin after the FCC completes the Digital Opportunity Data
Collection, a program intended to offer more precise mapping of broadband and
mobile data connections.52 New York should assist the FCC in these efforts and
use the data compiled to inform its strategy.
Enhance Access for Low-Income Households
As it has in the past, the State should leverage public dollars and form public-
private partnerships to increase the scale of targeted solutions to enhance access
opportunities in low-income communities. These solutions should be structured to
protect the public interest and to target both residential properties and community
institutions, including schools, libraries, and parks. New York City’s experience
with nonprofit and private organizations upgrading broadband at NYCHA facilities
is one potential model; creating public-private partnerships to provide Wi-Fi
services on transit and in parks is another model worth exploring and expanding
to other public facilities.
As recommended by the Reimagine New York Commission, these solutions
should focus especially on students in underserved communities. In addition to
allowing greater use of school computer labs at the end of the day and upgrading
school broadband speeds, students could be given computers or tablets with
access to high-speed networks for home use. School districts could facilitate such
purchases using some of the $8.2 billion in federal aid that was provided directly
to them under ARP or could apply for funding that remains available under the
Smart Schools Bond Act approved by New York voters in 2014.
27Improve Affordability
According to a large nationwide survey, cost is the most important reason cited
by households who do not have broadband access at home.53 In just over three
months, more than 5.3 million households nationwide and 326,000 households
in New York have benefited from the FCC’s Emergency Broadband Benefit
Program, which provides a $50 per month subscription subsidy and a one-time
discount on a computing device. The program is well-targeted to offer benefits
to low-income households and those who have suffered loss of income during
the pandemic, and the Senate has proposed an extension of the program. New
York leaders should advocate for it to be extended or made permanent during
the ongoing federal infrastructure funding negotiations. It is appropriate for
the federal government to assist low-income households with the costs of this
essential modern resource in the same way it provides assistance to eligible low-
income households for food and housing.
In addition, the PSC should study how best to spur provider competition across
the state. The Commission wields significant regulatory power which can be used
cautiously but effectively in order to keep prices low and speeds high.
Make New York’s Broadband Strategy Actionable
and Accountable
To enable all New Yorkers to realize the potential benefits of broadband technology,
the development of the State’s strategy should include: setting concrete goals for
each objective; identifying obstacles and barriers faced to date; identifying federal,
State, and local funding sources available; and establishing interim metrics and a
public reporting schedule in order to allow accountability for progress.
State leaders must ensure New York does not fall behind in the deployment
of high-speed broadband. Reliable, high-speed service has become necessary
for businesses to conduct their operations online, for government agencies
and nonprofit organizations to serve the public, and for multiple members of a
household to work and learn simultaneously. Making high-speed broadband more
widely available, accessible, and affordable is essential to maintaining the State’s
economic competitiveness and to achieving social justice.
28Appendix A
Broadband Availability and Access by New York State County, 2019
Percentage of Percentage of
County Total Population Population Without Total Households Households Without
Broadband Available Broadband Access
Albany 305,506 0.3% 128,284 14.1%
Allegany 46,091 23.4% 17,265 23.5%
Bronx 1,418,207 1.8% 513,890 20.4%
Broome 190,488 0.9% 79,309 16.5%
Cattaraugus 76,117 17.9% 33,056 26.1%
Cayuga 76,576 3.1% 31,489 16.7%
Chautauqua 126,903 2.2% 55,345 20.9%
Chemung 83,456 1.9% 33,490 17.6%
Chenango 47,207 4.2% 20,865 19.0%
Clinton 80,485 6.5% 31,422 17.6%
Columbia 59,461 0.8% 24,531 15.1%
Cortland 47,581 4.3% 18,345 16.3%
Delaware 44,135 2.4% 18,185 16.8%
Dutchess 294,217 2.2% 110,529 10.1%
Erie 918,702 0.2% 398,326 14.8%
Essex 36,885 6.1% 16,762 20.4%
Franklin 50,022 4.7% 18,927 23.5%
Fulton 53,383 3.4% 23,018 19.3%
Genesee 57,280 4.1% 24,596 14.6%
Greene 47,188 1.7% 16,974 18.2%
Hamilton 4,416 14.7% * *
Herkimer 61,319 6.4% 25,631 17.8%
Jefferson 109,834 1.5% 41,214 15.1%
Kings 2,559,903 0.2% 978,091 17.0%
Lewis 26,296 14.5% 11,533 21.2%
Livingston 62,914 9.3% 23,409 14.4%
Madison 70,940 5.8% 25,986 19.0%
Monroe 741,770 0.0% 305,284 14.3%
Montgomery 49,221 2.1% 20,001 24.2%
Nassau 1,356,924 0.7% 449,798 10.5%
New York 1,628,706 0.0% 768,203 12.4%
Niagara 209,281 0.7% 90,625 15.0%
Oneida 228,671 2.9% 90,273 15.6%
29Percentage of Percentage of
County Total Population Population Without Total Households Households Without
Broadband Available Broadband Access
Onondaga 460,528 0.1% 183,218 17.9%
Ontario 109,777 0.6% 46,025 12.1%
Orange 384,937 1.2% 131,421 13.2%
Orleans 40,352 2.5% 17,298 17.4%
Oswego 117,124 0.5% 46,640 13.8%
Otsego 59,493 8.3% 23,138 20.6%
Putnam 98,320 1.1% 34,470 6.5%
Queens 2,253,858 0.0% 784,552 14.9%
Rensselaer 158,714 0.0% 65,790 13.4%
Richmond 476,143 0.0% 166,297 18.2%
Rockland 325,789 1.3% 101,424 14.7%
St. Lawrence 107,740 4.6% 42,832 21.8%
Saratoga 229,863 0.1% 93,547 8.5%
Schenectady 155,299 0.0% 62,534 17.9%
Schoharie 30,999 0.9% 12,347 21.5%
Schuyler 17,807 2.6% * *
Seneca 34,016 0.4% 13,898 20.3%
Steuben 95,379 10.0% 39,283 16.9%
Suffolk 1,476,601 3.5% 499,744 8.1%
Sullivan 75,432 0.5% 28,960 14.3%
Tioga 48,203 3.6% 19,991 15.2%
Tompkins 102,180 1.4% 40,322 15.1%
Ulster 177,573 0.4% 69,376 13.4%
Warren 63,944 3.8% 29,593 13.9%
Washington 61,204 2.3% 24,093 14.6%
Wayne 89,918 3.7% 36,634 16.7%
Westchester 967,506 1.3% 355,136 12.4%
Wyoming 39,859 14.6% 15,872 16.7%
Yates 24,913 6.7% 8,646 23.9%
* Note: The American Community Survey does not survey geographies with populations less than 20,000. Therefore this sample does not include data for
Hamilton and Schuyler Counties, where the populations according to the 2010 Census were 4,416 and 17,807, respectively.
Sources: U.S. Census, American Community Survey, 2019 Supplemental; Federal Communications Commission, Fourteenth Broadband Deployment Report,
January 19, 2021
30You can also read