Understanding the Impact of Immigration in Greater New Haven - Imagine.

Page created by Ralph Marquez
 
CONTINUE READING
Understanding the Impact of Immigration in Greater New Haven - Imagine.
Imagine.     Inform.                Invest.                Inspire.
             Working together to build a stronger community — now and forever.

           Understanding the
           Impact of Immigration
           in Greater New Haven

                                                   Mary Buchanan and Mark Abraham
                                                   JANUARY 2015
Table of Contents

                                                             04       INTRODUCTION
                                                                      Why is it important to understand immigration?

                                                             06       DATA PROFILE
                                                                      Who are the immigrants living in Greater New Haven and
                                                                      Connecticut?

                                                             10       A CHANGING POPULATION

   “Immigrants are                                                    How does immigration impact local population change
                                                                      and diversity?

giving The American                                          12       COMMUNITY IMPACT
                                                                      In what ways does immigration strengthen our neighbor-
                                                                      hoods and schools?
  Dream life again.”
                                                             16       ECONOMIC IMPACT
                                                                      What role does immigration serve in the local economy?
                                 —Anonymous

                                                             18       REFERENCES
                                                                      AND NOTES

                                                             20       NEXT STEPS
                                                                      How can our region fully take advantage of the opportuni-
                                                                      ties brought by immigrants, and create the conditions that
                                                                      they and their families desire in order to achieve their full
                                                                      potential here?

  About this Report
  Understanding the Impact of Immigration in Greater New Haven explores how immigration impacts the development of both Greater
  New Haven and Connecticut. We use data collected by federal, state, and local government agencies, as well as information gener-
  ated locally by DataHaven and The Community Foundation for Greater New Haven. The report was written by Mary Buchanan and
  Mark Abraham of DataHaven, with assistance from staff at The Community Foundation, and should not be interpreted to represent the
  official views of DataHaven or The Community Foundation for Greater New Haven. We recommend the following citation: Buchanan,
  Mary, and Mark Abraham. Understanding the Impact of Immigration in Greater New Haven. New Haven: The Community Foundation
  for Greater New Haven, 2015.
Executive Summary:

    • 1
       in 8 residents of Greater                                  • I mmigrants make Greater New                                   • F
                                                                                                                                        oreign-born people in Greater
      New Haven is foreign-born,                                      Haven a resilient and diverse                                    New Haven are more likely to
      originating from countries in                                   community. They contribute                                       be employed than native-born
      all world regions. About half of                                millions of dollars in property                                  people. Among immigrants,
      all immigrants are naturalized                                  taxes to municipal governments.                                  there are more than twice as
      US citizens; the other half are                                 Foreign-born people are more                                     many high-skilled workers as
      legal permanent residents, legal                                likely to own a small business                                   low-skilled in the region.
      temporary residents, or undocu-                                 than native-born Americans,
      mented immigrants.                                              and naturalized citizens are
                                                                      more likely to own homes than
                                                                      native-born people. Students
    • W
       hile the native-born popula-                                  of Greater New Haven public                                    • A
                                                                                                                                        lthough immigration is a
      tion in Greater New Haven has                                   schools speak over 100 lan-                                      complex issue, the Greater
      barely increased since 2000,                                    guages at home.                                                  New Haven community widely
      immigrants settling in the area                                                                                                  agrees that foreign-born people
      have caused rapid population                                                                                                     contribute to the economic,
      growth, making New Haven                                                                                                         cultural, and social well-being
      the fastest-growing city in                                                                                                      of the region.
      Connecticut over this period.

Geography of Study

Although this report focuses primarily on immi-
gration to Greater New Haven and the City of                          TOWNS OF    Greater New Haven
New Haven, we compare data from four geo-
graphic areas to demonstrate important trends.
Understanding the Impact of Immigration in                                                                    Cheshire
Greater New Haven analyzes figures for the Unit-
ed States, Connecticut, Greater New Haven,1 and                                                                               Wallingford                                  NEW HAVEN

the City of New Haven. We select the informa-                                                                                                                              INNER RING

tion in each section based on availability and sig-                     Oxford                 Bethany
                                                                                                                                                                           O
                                                                                                                                                                            UTER RING
nificance of indicators. For example, where data                                                                       North
                                                                                 Seymour                               Haven        North
are unavailable specifically for Greater New Ha-                                            Wood-        Hamden
                                                                                                                                                                           VALLEY
                                                                                                                                    Branford
ven, we sometimes use state-level data; in other                                    Ansonia bridge
                                                                                                                             ven

                                                                                    De
cases, we present neighborhood-level statistics.                                      rb                  New Haven                            Guilford
                                                                                                                         t Ha

                                                                                        y
Except where specified differently, all Census                            Shelton                                                  Branford                    Madison
                                                                                                                      Eas

                                                                                            Orange    West
data are taken from the 2008-2012 American                                                            Haven
Community Survey 5-year estimates, which con-
                                                                                         Milford
tain the most recent Census data at a town-level.

1
    In this report, we define Greater New Haven as inclusive of the following 20 towns: New Haven; East Haven, Hamden, and West Haven (the Inner Ring); Bethany, Branford, Cheshire,
    Guilford, Madison, Milford, North Branford, North Haven, Orange, Wallingford, and Woodbridge (the Outer Ring); and Ansonia, Derby, Oxford, Seymour, and Shelton (the Valley).

                                                                                  UNDERSTANDING THE IMPACT OF IMMIGRATION IN GREATER NEW HAVEN                                           3
Introduction
Since Europeans first settled in the area in the early 1600s, foreign-born people have transformed our population, diversified our heritage and
culture, and grown our economy. Presently a wave of immigration brings over a million foreign-born people to the United States every year—
including thousands to Greater New Haven. The Community Foundation for Greater New Haven offers this report to help the general public,
policymakers, and local leaders understand the impact of immigration on the area. Combining public data, local interviews, and field work
related to immigration, this report is intended to inform discussions and community action.

                HISTORICAL IMMIGRATION IN CONNECTICUT

                Throughout our history, and especially around the turn of the twentieth century, great surges of European immigrants
                contributed to rapid population growth in New Haven and other Connecticut cities. However, the Great Depression,
                World War II, and immigration policy that limited incoming immigrants to quotas based on their origin constricted
                immigration during the mid-twentieth century. In 1965, a rewriting of immigration policy reversed two established
                nationwide trends: the dwindling number of foreign-born persons since the 1930s and the overwhelmingly Anglo-
                European ancestry of immigrants. Since the national policy took effect, New Haven and its surrounding suburbs have
                welcomed thousands of immigrants from around the world, closely mirroring the diversifying and expanding foreign-
                born population nationwide.

                FIG. 01          Connecticut Foreign-born Population
                                 1870 through Present*

                SOURCE: DataHaven analysis of 1870 to 2008-2012 Census data available at census.gov.
                * DataHaven estimated County and City foreign-born populations for decades for which Census data were unavailable. The diagonal lines indicate estimate years.

4      DataHaven and The Community Foundation for Greater New Haven
Definitions

                                                                                            • FOREIGN-BORN or IMMIGRANT : Any person living
                                                                                              in the United States who was not an American
                                                                                              citizen at birth. This refers to anyone born outside of
                                                                                              the United States to non-American parents, includ-
                                                                                              ing naturalized citizens, legal non-citizen residents,
97 percent of respon-            PERCEPTIONS OF IMMIGRATION:                                  and undocumented immigrants.
dents said that the              SUMMARY OF FINDINGS
issue of immigration is                                                                     • NATIVE-BORN: Any person living in the United
                                 The Community Foundation for Greater
very or somewhat im-                                                                          States who was either born in the US or born
                                 New Haven explored local public opin-
portant to Connecticut.          ion on immigration by interviewing key                       abroad to at least one American parent. Puerto Rico,
                                 stakeholders and administering an on-                        Guam, and U.S. Island Areas are US territories and
Only 31 percent of               line survey to its constituents. Ques-                       considered to be part of the country. Therefore,
                                 tions were based on previous national                        persons born in these areas are native-born. All
respondents thought
                                 surveys on immigrationi and will help                        native-born people are American citizens.
they understood immi-
                                 inform the design of the 2015 Connecti-
gration policy extreme-          cut Wellbeing Survey. Refer to page 19                     • NATURALIZED CITIZEN: Any foreign-born person
ly or fairly well.               for a discussion of survey methodology
                                                                                              who earns American citizenship through the natural-
                                 and additional results.
                                                                                              ization process, in which he fulfills the requirements
• Respondents were united in the belief that immigration is important; however,               for citizenship established by the US government.
  many admitted that they were not well informed about the issue. We hope
  Understanding the Impact of Immigration in Greater New Haven will narrow                  • NON-CITIZEN: Any foreign-born person living in
  the knowledge gap.
                                                                                              the United States who is not a naturalized citizen.
• Opinion was divided on the local impact of immigration. The majority of re-
  spondents commended immigrants for the diversity, investments, innovations                  This includes those who are authorized to live in
  they add to our society. However, some believed that immigrants, especially                 the US, either permanently or temporarily, as well
  when they arrive without legal authorization, can be disruptive to our economy,             as those who are not legal residents of the country.
  traditional culture, and school system. A few interpreted that immigrants have
  little significant influence on Connecticut, or responded that since they have              In Connecticut less than half of non-citizens are
  relatively few immigrant neighbors, they believed that immigration has little               undocumented immigrants.
  observable impact on their neighborhood.
                                                                                            • UNDOCUMENTED IMMIGRANT or UNAUTHOR-
 “There are lots of different kinds of immigration—different skill
                                                                                              IZED IMMIGRANT: Sometimes referred to as
levels and different backgrounds, different countries of origin, etc. As
far as I can tell, they all help the culture and economy of Connecticut.”                     illegal immigrant. Any non-citizen who is not a legal
—Anonymous                                                                                    resident of the United States.

“Uncontrolled, illegal immigration is a bad thing. This is a source of
                                                                                            • REFUGEE and ASYLEE : A refugee leaves his country
crime… and a drain on State, Municipal, and Social services.”                                 for another because he is persecuted or fears per-
—Anonymous                                                                                    secution due to race, religion, nationality, political
                                                                                              opinion, or membership in a social group. An asylee
                                • Most survey participants agreed that our
86 percent of re-                 region is fairly welcoming to its foreign-born              meets the definition of a refugee but is already in
spondents said that               population. Many respondents noted that local               the US when he applies for asylum status. Refugees
Connecticut is very or            policies, assisting agencies, and the attitudes
                                                                                              and asylees have legal status in the United States.
                                  of residents contribute to a more hospitable
somewhat welcoming
                                  atmosphere in New Haven than in surrounding
to immigrants.                    towns or cities.                                          • ORIGIN: Or place of birth. The world region or
                                                                                              country in which an immigrant was born.

                                                                         UNDERSTANDING THE IMPACT OF IMMIGRATION IN GREATER NEW HAVEN                   5
Data Profile
Compare the demographic and socioeconomic characteristics for the following groups, across four geographic regions.2

TOTAL POPULATION
                                 FIG. 02          General Characteristics
• A
   pproximately 1 in every                       Total Population, 2008-2012
  8 Americans and 1 in 8
  Greater New Haven resi-        DEMOGRAPHICS
  dents is an immigrant.                                                                   UNITED STATES                                  CONNECTICUT                     GREATER NEW HAVEN                   CITY OF NEW HAVEN
• Immigrants are more                                                           Total          Native-born Foreign-born          Total        NB             FB          Total        NB          FB         Total       NB           FB
  racially diverse than the      Total population                           309,138,711 269,354,406              39,784,305     3,572,213 3,090,333        481,880      638,627 563,957 74,670 129,898 108,251 21,647
  native-born population.        Percent of total                                 —                87%               13%             —        87%            14%           —          88%         12%          —          83%         17%
  In Greater New Haven,          Percent change since 2000                       10%               8%                28%             5%        2%            30%           4%          1%         37%          5%         -1%         51%
  more than 1 in 3 people        Non-Hispanic White1                             64%               70%               19%          71%         77%            37%          71%         75%         35%         32%         35%         20%
  who identify as Asian          Black or African American                       13%               13%                8%          10%          9%            15%          12%         12%         12%         35%         38%         18%
  or Hispanic are foreign        Asian                                            5%               2%                25%             4%        1%            21%           4%          1%         26%          5%         1%          22%
  born, versus 1 in 17           Hispanic or Latino                              16%               12%               47%          13%         11%            26%          12%         10%         26%         26%         24%         39%
  people who identify as         Under 18 years                                  24%               26%                7%          23%         25%            7%           22%         24%          7%         23%         26%         6%
  white.                         18 to 44 years                                  37%               35%               50%          35%         33%            48%          36%         34%         51%         48%         45%         66%
• A
   smaller percent of           45 to 64 years                                  26%               26%               30%          28%         28%            31%          28%         28%         28%         20%         20%         19%
  immigrants are under           65 years and over                               13%               13%               13%          14%         14%            14%          15%         15%         14%          9%         9%          8%
  18 years, compared to          With health insurance2                          85%               88%               67%          91%         94%            76%          92%         94%         77%         86%         91%         63%
  native-born people.            Average family size (people)                    3.21              3.09              3.81         3.12        3.07           3.39          —           —           —          3.25        3.22        3.35

• O
   n average, immigrants        INCOME
  have lower annual              Population 15 years and over 248,042,237 210,154,835                            37,887,402     2,911,421 2,454,318        457,103      527,623 456,483 71,140 105,579 84,894                       20,685
  individual incomesii than      Income below $25,000                            41%               41%               43%          36%         35%            38%          36%         36%         37%         48%         49%         45%
  native-born people and         Income at least $75,000                         11%               11%               10%          17%         17%            14%          16%         16%         15%          8%         8%          8%
  are less likely to have
  earned a high school
  degree. But immigrants
                                 EDUCATIONAL ATTAINMENT
  in Greater New Haven
  are also more likely to        Population 25 years and over 204,336,017 170,748,250                            33,587,767     2,431,340 2,023,497        407,843      436,029 373,112 62,917               79,149      61,926      17,223
  have earned a bachelor’s       Less than HS diploma                            14%               11%               32%          11%          9%            21%          10%          9%         19%         20%         18%         25%
  degree, indicating a           Bachelor's degree or higher                     29%               29%               28%          36%         37%            33%          37%         36%         40%         33%         30%         41%
  distinction between
  high-skill and low-skill
  immigrants. See page 16        FAMILY AND POVERTY
  for more information.                                                                                 UNITED             CONNECTICUT       GREATER                 CITY OF
                                                                                                        STATES                              NEW HAVEN              NEW HAVEN
                                 Population under 18 years                                             73,979,859             812,212           132,801               29,493             • A
                                                                                                                                                                                            bout 1 in 4 children nation-
16 percent of                    Living with 2 parents                                                     66%                 69%               68%                   38%                 ally and locally has at least one
respondents cor-                 1 or more foreign-born parents                                            24%                 23%               21%                   24%                 foreign-born parent. Children
                                 1 or more foreign-born parents and                                                                                                                        with at least one foreign-born
rectly answered                  living with 2 parents
                                                                                                           18%                 18%               16%                   15%                 parent are somewhat more likely
that 87 percent of               Under 18 years, poverty status determined                  3
                                                                                                       70,458,032             783,752           132,801               27,699               to be living in poverty, except in
Connecticut resi-                Living under the poverty level                                            20%                 13%               14%                   36%                 the City of New Haven, where
dents in 2012 were               Living under the poverty level and                                                                                                                        native-born children are more
                                                                                                           6%                   3%                3%                    7%
                                 1 or more foreign-born parents                                                                                                                            likely to live in poverty.
native-born. 75
percent of respon-
dents thought that
                                 SOURCE: DataHaven analysis of 2000 and 2008-2012 Census data, available at census.gov.
between 65 to 85
                                 	Percentages do not total 100. Some ACS race categories are not displayed. Further, “Hispanic or Latino” indicates ethnicity, while “Non-Hispanic White,” “Black or African American,” and “Asian”
                                 1

percent of Con-                    indicate race. Repondents who identified as Hispanic or Latino in ethnicity and Black or African American or Asian in race are counted twice. The same applies for race and ethnicity indicators of the
                                   foreign-born population in Figure 3.
necticut’s popula-               	Percent with health insurance of the “uninstitionalized population” for each population group. The “uninstitionalized population” is the civilian population who are not inmates in institutions and who
                                 2

tion in 2012 was                   are not on active duty in the Armed forces. The same applies for the “with health insurance” indicator of the foreign-born population in Figure 3.
                                 	The US Census Bureau determines poverty status for those not residing as inmates in institutions; living in college dormitories; or under age 15 and not related by birth, marriage, or adoption to a
                                 3

native-born.                       Census reference person. The same applies for the “poverty status determined” indicator of the foreign-born population in Figure 3.

        2
            DataHaven analyzed these data for other towns and geographies in Connecticut. Contact us for more information.

6       DataHaven and The Community Foundation for Greater New Haven
Data Profile

FOREIGN-BORN
                                                 FIG. 03          Immigrant Characteristics
POPULATION
                                                                  Foreign-born Population, 2008-2012
• In Greater New Haven,
                                                 GENERAL CHARACTERISTICS
   there are slightly more
   non-citizens (includ-                                                                                   UNITED STATES                                    CONNECTICUT              GREATER NEW HAVEN              CITY OF NEW HAVEN
   ing those who are                                                                       Foreign-born Naturalized              Non-citizen        Total     Nat. Cit.   Non-cit.   Total    Nat. Cit. Non-cit.   Total    Nat. Cit. Non-cit.
   authorized to live in the                                                                   Total      Citizen

   United States as well as                      Total foreign-born population 39,784,305                      17,639,207        22,145,098        481,880    226,263     255,617    74,670   34,869    39,801     21,647    5,594    16,053
   those who are not legal                       Percent of total foreign-born                    —                44%               56%             —         47%         53%        —        47%       53%        —        26%       74%
   residents) than natural-                      Percent change since 2000                       28%               41%               19%            30%        26%         35%       37%       29%       45%       51%       18%       67%
   ized citizens.                                Non-Hispanic White                              19%               25%               14%            37%        46%         29%       35%       47%       25%       20%       29%       16%
                                                 Black or African American                        8%               9%                 7%            15%        16%         14%       12%       12%       11%       18%       28%       15%
• Naturalized citizens
                                                 Asian                                           25%               32%               19%            21%        21%         20%       26%       24%       27%       22%       23%       21%
  demonstrate higher
                                                 Hispanic or Latino                              47%               32%               59%            26%        17%         35%       26%       15%       35%       39%       17%       47%
  socioeconomic character-
                                                 Median age (years)                              41.5              49.6              35.8           42.4        50.2       35.9      42.2      49.3      37.2       33.8     47.2      31.8
  istics than non-citizens.
  They are less likely to                        Living in poverty                               18%               11%               24%            12%         7%         16%       12%        6%       17%       21%       14%       23%
  live in poverty, and they                      With health insurance                           67%               84%               53%            76%        91%         63%       77%       92%       64%       63%       89%       54%
  are much more likely to                        Average family size (people)                    3.81              3.66              3.98           3.39        3.32       3.49       —         —         —         3.35     3.18      3.44
  have health insurance.                         Population 25 years and over 33,587,767                       16,229,218        17,358,549        407,843    205,973     201,870     —         —         —        17,223    4,894    12,329
                                                 Bachelor's degree or higher                     28%               34%               32%            33%        35%         31%        —         —         —        41%       49%       38%

• Only about 1 in 10 natu-                       IMMIGRANT CHARACTERISTICS
  ralized citizens entered
                                                                                                           UNITED STATES                                    CONNECTICUT              GREATER NEW HAVEN              CITY OF NEW HAVEN
  the US after 2000. On                                                                    Foreign-born Naturalized              Non-citizen        Total     Nat. Cit.   Non-cit.   Total    Nat. Cit. Non-cit.   Total    Nat. Cit. Non-cit.
  average, naturalized                                                                         Total      Citizen
  citizens are more than                         Total foreign-born population 39,784,305                      17,639,207        22,145,098        481,880    226,263     255,617    74,670   34,869    39,801     21,647    5,594    16,053
  ten years older than non-                      Entered the US after 2000                       34%               11%               53%            36%        11%         59%       38%        9%       64%       56%       11%       72%
  citizens.                                      Entered the US before 1990                      39%               63%               20%            39%        63%         17%       37%       62%       16%       21%       58%        8%
• Naturalized citizens are                       Origin, Europe                                  12%               17%                8%            28%        37%         20%       28%       39%       19%       14%       25%       11%
  more likely to have been                       Asia                                            29%               37%               22%            23%        24%         22%       29%       28%       30%       24%       27%       23%
  born in Europe or Asia,                        Central America & Caribbean                     46%               32%               57%            26%        21%         31%       22%       14%       29%       41%       31%       45%
  compared to non-citizens                       South America                                    7%               7%                 7%            15%        11%         19%       13%       11%       14%       13%        9%       14%
  who are most likely to                         Canada & other areas                             7%               7%                 7%             8%         7%          8%        8%        8%        8%        8%        9%        7%
  have been born in the
  Caribbean or in Central
                                                 SOURCE: DataHaven analysis of 2000 and 2008-2012 Census data, available at census.gov
  or South America.

                                                                                                                                                               • There is no exact population figure for undocumented im-
FIG. 04          Connecticut Population Estimates                                                                                                                migrants, although the vast majority is counted within Census
                 By Immigrant Status, 2008-2012                                                                                                                  population totals. The American Community Survey under-
                                                                                                                                                                 counts the undocumented immigrant population by roughly 10
                                                FOREIGN-BORN POPULATION                                            TOTAL POPULATION                              to 20 percent. Therefore, population figures for non-citizens
                                                                                                                                               4%                in this report do not reflect the uncounted undocumented im-
                                                                                                                                                                 migrant population.iii
                                                                                                                                                   3%
         Native-born
                                                                                                                                6%                             • In 2013 there were an estimated 11.3 million undocumented
                                                      25%                                                                                                        immigrants living in the United States, or about 3.6 percent of
         Naturalized Citizen
                                                                                                                                                                 the population.iv DataHaven estimates that 14,430 undocu-
         Legal Non-citizen                                                                                                                                       mented immigrants live in Greater New Haven.v
                                                                                 47%
         Undocumented
         Immigrant
                                                                                                                  87%                                          12 percent of respondents correctly answered
                                                        28%
                                                                                                                                                               that about 3.4 percent of Connecticut residents
                                                                                                                                                               are undocumented immigrants.vi The remaining
SOURCE: DataHaven analysis of 2008-2012 Census data available at census.gov and Pew Research Center 2010 estimates available at pewhispanic.org.
                                                                                                                                                               88 percent of participants guessed that un-
Population figure for Connecticut undocumented immigrants based on Pew Research Center 2010 estimate that undocumented immigrants are
                                                                                                                                                               documented immigrants represent from 6 to 35
3.4 percent of total Connecticut population.                                                                                                                   percent of Connecticut’s total population.

                                                                                                                    UNDERSTANDING THE IMPACT OF IMMIGRATION IN GREATER NEW HAVEN                                                              7
FIG. 05       Greater New Haven’s Immigrant Population
              Change from 2000 through 2012, by country and region of birth

Greater New Haven is attracting immigrants from a wide range of countries throughout the world, with the greatest increases in nu-
merical terms attributable to immigration from Mexico, India, China, Jamaica, and Ecuador. Populations from places such as Guyana,
Guatemala, the Dominican Republic, Thailand, and Middle and East Africa appear to be growing most rapidly in proportion to the
size of previously-existing immigrant communities from those areas. Due to the imprecision of Census estimates, specific countries
or regions of origin are only identified in this graphic if the population living in Greater New Haven from that country or region was
estimated to be at least 700 persons.3

              POPULATION
              IN 2000
                                    POPULATION
                                    IN 2012
                                                          POPULATION
                                                          CHANGE                    Canada + Other
                                                                                                                          NUMBER      PERCENT
          Asia                                                                                          2000     2012     CHANGE       CHANGE

                                                    14,010                          k Canada*          2,208    2,308          100           5%
                                                    21,517                          * Includes a small number of persons born in Oceania.
                                                    +7,507        54%

          Europe
                                                    22,060
                                                    21,035                                                                           k

                                                       -1,025      5%

          Central America
                                                       4,707
                                                       9,546
                                                    +4,839       103%

          South America
                                                       5,253
                                                                                                                                            k                  l
                                                       9,405                                                                                           k
                                                                                                                                                   l
                                                    +4,152        79%
                                                                                    Central America
                                                                                                                          NUMBER     PERCENT                           n
          Caribbean                                                                                     2000     2012     CHANGE      CHANGE               l
                                                       4,395                        k Mexico           3,742    6,910        3,168          85%        k

                                                       7,222                        l Guatemala          534    1,456         922           173%           m               p
                                                    +2,827        64%                    Remainder       431    1,180         749           174%

          Africa
                                                       1,872
                                                       3,637                        South America                                                                  o

                                                    +1,765        94%                                                     NUMBER     PERCENT
                                                                                                        2000       2012   CHANGE      CHANGE

                                                                                    k Ecuador          1,767      3,149      1,382          78%
          Canada + Other
                                                                                    l Colombia         1,134      1,468        334          29%
                                                       2,208
                                                                                    m Peru               547      1,208        661          121%
                                                       2,308
                                                                                    n Guyana             345        992        647          188%
                                                        +100       5%
                                                                                    o Argentina          397        876        479          121%
                                                                                    p Brazil             384        843        459          120%
-5        0       5      10      15       20      25
          P O P U L ATI O N (IN THOUSANDS)
                                                                                         Remainder       679        869        190          28%

          3
               DataHaven analysis of 2000 and 2008-2012 Census data available at census.gov.

8         DataHaven and The Community Foundation for Greater New Haven
Data Profile

                                                                                                                                    Europe
                                                                                                                                                                        NUMBER    PERCENT
                                                                                                                                                        2000    2012    CHANGE     CHANGE

                                                                                                                                    k Italy             5,013   3,990    -1,023      -20%
                                                       Caribbean                                                                    l Poland            3,359   3,397       38        1%
                                                                                                   NUMBER           PERCENT         m United Kingdom    2,428   2,460       32        1%
                                                                          2000         2012        CHANGE            CHANGE
                                                                                                                                    n Portugal          1,553   1,648       95        6%
                                                       k Jamaica          2,068       3,600            1,532              74%
                                                                                                                                    o Germany           2,068   1,473      -595      -29%
                                                       l Dominican         641        1,687            1,046            163%
                                                         Republic                                                                   p Russia            1,058   1,317      259       24%

                                                          Remainder       1,686       1,935              249              15%           Remainder       6,581   6,750      169        3%

                                                                                                                    p

                                    m                   l
                                               o

                                                   k
                    n                                                 r
                                                                                                                                k                   m
                                               lf
                            ld
                                                                                                        q
                                         la            lc       lb
        l   g

                                                                                                                 l
                kk
                                    kj         kl               le
c       n                                                                                                                       p              n
    d
        g
                                     b                                                                                              o
                    f                      a
                o
                                h    e q       k
                                               m
                        i

                            k

                            p

                                                                                                                                    Asia
            Africa*                                                                                                                                     2000    2012
                                                                                                                                                                        NUMBER
                                                                                                                                                                        CHANGE
                                                                                                                                                                                  PERCENT
                                                                                                                                                                                   CHANGE
                                                                                                   NUMBER         PERCENT
                                                                          2000       2012          CHANGE          CHANGE           k China             3,394   5,686     2,292      68%

            k West African countries                        †
                                                                          943       1,300                357            38%         l India             2,878   5,607     2,729      95%

            l North African countries‡                                    364          851               487          134%          m Korea             1,454   1,763      309       21%

                            Remainder                                     565       1,486                921          163%          n Philippines        948    1,501      553       58%
            * Although Greater New Haven does not have more than 700 residents from a single country in                             o Vietnam            814     916       102       13%
                    Africa, many African immigrant communities in our region are rapidly growing.
                                                                                                                                    p Thailand           222     812       590      266%
            †
                    West Africa includes Benin a, Burkina Faso b, Cape Verde c, Gambia d, Ghana e, Guinea f, Guinea-
                    Bissau g, Ivory Coast h, Liberiai, Mali j, Mauritania k, Niger l, Nigeria m, Senegal n, Sierra Leone o,
                                                                                                                                    q Pakistan           680     782       102       15%
                    St Helena p, and Togo q.                                                                                        r Turkey             569     735       166       29%
            ‡
                    North Africa includes Algeria a, Egypt b, Libya c, Morocco d, Sudan e, Tunisia f, and Western Sahara g.             Remainder       3,051   3,715      664       22%

                                                                                                                UNDERSTANDING THE IMPACT OF IMMIGRATION IN GREATER NEW HAVEN                 9
A Changing Population
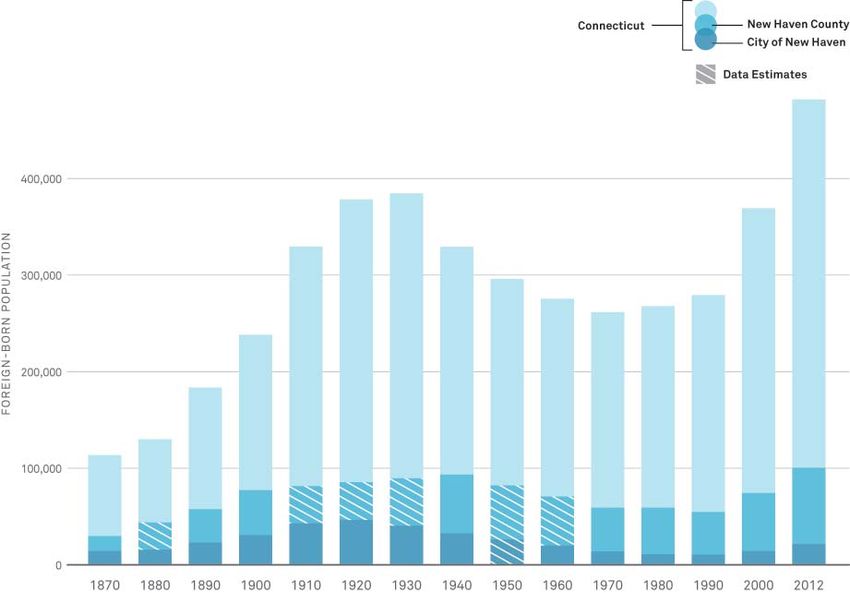
GREATER NEW HAVEN: IMMIGRATION AND
                                                               FIG. 06                                                 Regional Population Change
POPULATION CHANGE                                                                                                                                                                        Population: 2000
                                                                                                                       2000 through 2012
                                                                                                                                                                                         Population Growth, 2000 to 2012
Because of immigration, the places where we live
                                                                                                                                                                                         Population Decline, 2000 to 2012
and work are experiencing a significant net growth                                                                     CITY OF NEW HAVEN
in population. The foreign-born populations in
Greater New Haven and the City of New Haven                                                                150,000              5%
                                                                                                                             +6,272
have steadily risen since 2000, but at the same                                                                                          2012: 129,898        -1%
time, the native-born populations have stagnated.                                                          120,000                       2000: 123,626
                                                                                                                                               123 626      -1,025
                                                                                                                                                             1 025

Learn more about the importance of population                                                                                                                          2012: 108,251

                                                                      P OPUL A TION
                                                                                                                                                                       2000: 109,276
                                                                                                            90,000
growth on page 16.

• From 2000 to 2012, Greater New Haven’s population as                                                      60,000

  a whole increased by more than 27,000 people. Of that                                                                                                                                     51%
  growth, about 75 percent (20,165) were foreign-born                                                       30,000                                                                        +7 297
                                                                                                                                                                                          +7,297
                                                                                                                                                                                                       2012: 21,647
  residents. About half of immigrants in Greater New                                                                                                                                                   2000: 14,350
  Haven are naturalized citizens.                                                                                  0
                                                                                                                              Total                      Native-born                   Foreign-born
• Within the region, 12 percent of residents (18,025
  people) in the Inner Ring suburbs and 9 percent of
  residents (23,967 people) in the Outer Ring suburbs are                                                              GREATER NEW HAVEN
  foreign-born (see page 3 for geographic definitions).
  In the five towns that comprise the Valley region, 11                                                    800,000
                                                                                                                                4%
  percent of residents (11,031 people) are foreign-born.                                                   700,000          +27 288
                                                                                                                            +27,288                          1%
  Of immigrants living in the Valley, about 62 percent are                                                                               2012: 638,627     +7,123
                                                                                                                                                             ,
                                                                                                           600,000                       2000 611,339
                                                                                                                                         2000: 611 339
  naturalized citizens.                                                                                                                                                2012: 563,957
                                                               P O P U LA TI O N

                                                                                                           500,000                                                      000 556,834
                                                                                                                                                                       2000: 556,83
• Over the same time period, the City of New Haven
                                                                                                           400,000
  experienced a net influx of 6,272 people, making it the
  fastest-growing city or town in Connecticut. Over this                                                   300,000
  time, it lost 1,025 native-born residents but gained 7,297                                               200,000                                                                          37%
  foreign-born residents—many concentrated within                                                          100,000                                                                       +20,165
                                                                                                                                                                                            ,
                                                                                                                                                                                                       2012: 74,670
  the neighborhoods highlighted below. Currently, an                                                                                                                                                   2000: 54,505
                                                                                                                   0
  estimated 17 percent of residents (21,647 people) are
  foreign-born—more than double the figures reported                                                                         Total                       Native-born                   Foreign-born
  in the 1990 Census. About 25 percent of immigrants in
                                                               SOURCE: DataHaven analysis of 2008-2012 Census data, available at census.gov.
  New Haven are naturalized citizens.

CITY OF NEW HAVEN: NEIGHBORHOOD
POPULATION GROWTH, 1970-2012
                                                               FIG. 07                                                 New Haven Foreign-born Population, by Neighborhood Group
Over the past several decades, the impact of im-                                                                       1970 through 2012
migration has been particularly felt within the City                                                                                                                                               % FO R E I GN - BO R N
                                                                                                                                                                                               OF TOTAL POPULATION
of New Haven’s rebounding neighborhoods.                                                                   7,000                                                                                                   23%
                                                                FO R E I GN - B O R N P O P U LA T I O N

• From 1970 to 1990, the foreign-born population in most                                                   6,000                                                                                                   19%
  New Haven neighborhoods remained flat or declined,
  and these neighborhoods suffered from overall popula-                                                    5,000

  tion decline—similar to other central city neighborhoods
                                                                                                           4,000             Yale Area
  in post-industrial cities.                                                                                                                                                                                       14%
                                                                                                                             Central
• Since 1990, the foreign-born population in many city                                                     3,000
                                                                                                                                                                                                                   12%
                                                                                                                             West
  neighborhoods has rebounded sharply, particularly in                                                                                                                                                             13%
                                                                                                           2,000             Far East
  areas such as Edgewood, West River, Fair Haven, and
                                                                                                                             Far West
  the Hill. These areas have seen a large influx of popula-                                                1,000
  tion and business overall.
                                                                                                               0
“I live in Fair Haven, which boasts a healthy immi-                                                                                      1970            1980            1990             2000              2012
grant population that lives there, owns real estate,
brings culture, and owns and operates businesses.”             SOURCE: DataHaven analysis of 1970 to 2008-2012 Tract-level Census data provided by Neighborhood Change Database 1970-2000 and census.gov.
                                                               Yale Area includes Downtown/Dwight, East Rock, Wooster Square. Central is Hill and Fair Haven. West is composed of Dixwell, Newhallville, Beaver
—Anonymous
                                                               Hills, Edgewood, and West River. Far East is East Shore, Annex, Fair Haven Heights, and Quinnipiac Meadows. Far West includes Westville, Amity, and
                                                               West Rock.

10      DataHaven and The Community Foundation for Greater New Haven
A Changing Population

CONNECTICUT: SHIFTING DIVERSITY                                                                              UNDOCUMENTED IMMIGRANTS

With each decade, the composition of Connecticut’s immigrant pop-                                            The population of undocumented immigrants in the United States
ulation has dramatically changed, mirroring trends in the US, Greater                                        peaked in 2007 to an estimated 12 million, but has since declined to
New Haven, and the City of New Haven. The Connecticut foreign-                                               approximately 11.3 million in 2013.vii The number of undocumented
born population indicates the increasing diversity of immigration to                                         immigrants living in Greater New Haven is quite small relative to the
our area, when examined by decade of arrival in the US.                                                      total population (see Figure 4 on page 7).

• In size:                                                                                                   Nationally, the majority of undocumented immigrants (62 percent)
    —More than 35 percent entered the US in 2000 or later.                                                   are long-term residents of ten years or longer. Like the foreign born
    —About 39 percent entered the US at any time before 1990.                                                population as a whole, most undocumented immigrant adults are
                                                                                                             employed, comprising a disproportionately large share of the labor
• In diversity:
                                                                                                             force relative to their overall size.viii
    —78 percent of Connecticut’s immigrant population that entered the US be-
     fore 1960 was born in Europe. Among immigrants who arrived at this time,                                Many people ask why undocumented immigrants would not wait in
     less than 4 percent came each from Asia, Africa, Central America, South
                                                                                                             line to immigrate through legal channels. The path to legal perma-
     America, and the Caribbean.
                                                                                                             nent residency is complicated, and most undocumented immigrants
    —Among Connecticut’s immigrant population entering the US since 2000,
                                                                                                             are either excluded from this process altogether or would be on a
     only 15 percent are Europeans. 29 percent were born in Asia, and 19 per-
     cent come from South America.
                                                                                                             waiting list that lasts from ten years to many decades.ix

                                                                                                             In the absence of Federal Immigration reform, the state and region
FIG. 08          Connecticut Foreign-born Population,                                                        have worked locally to integrate undocumented residents. At the
                                                                                                             state level, legislation approved driver’s licenses and in-state tuition
                 by Origin and Period of Arrival
                                                                                                             rates to public colleges and universities for this population. At the
                 2008-2012
                                                                                                             municipal level, New Haven created the Elm City ID card, a system
TOTAL, BY ORIGIN                                                                                             that provides legal identification for undocumented residents and
                                              CANADA
                                                                                                             that has been replicated in at least nine other cities including New
             JAMAI CA
                                        Canada +
                                                                                                             York and San Francisco.
                                        other

                      Caribbean         4%
                                                           Europe
                      15%
                                                           28%
       E C U AD O R                                                             Europe               BY PERIOD OF ARRIVAL

               South America                                          POLAND    Asia
                                                                                                     ENTERED BEFORE         ENTERED FROM         ENTERED FROM          ENTERED FROM
               15%                                                              Africa               1960                   1960 TO 1979         1980 TO 1999          2000 TO 2012
                                                                                Central America
                           Central                       Asia
                           America
                                                         23%                    South America
                           11%        Africa                                    Caribbean
         M E XI CO
                                      4%                                        Canada and
                                              INDIA                             other

                             G H AN A

               Total Foreign-born Population,                                                        Foreign-born           Foreign-born         Foreign-born          Foreign-born
               2012: 481,880                                                                         Population: 29,930     Population: 80,988   Population: 196,035   Population: 171,929

SOURCE: DataHaven analysis of 2008-2012 Census PUMS, available at census.gov.

FIG. 09          Connecticut Foreign-born Population, by Period of Arrival
                 2008-2012

   BEFORE 1950
        1950-1959

                  1960-1969             1970-1979               1980-1989                1990-1999                                 2000-2009                                          2010-2012

       4%         8%                   9%                      16%                       25%                                      33%                                                 3%
2%

SOURCE: DataHaven analysis of 2008-2012 Census PUMS, available at census.gov.

                                                                                               UNDERSTANDING THE IMPACT OF IMMIGRATION IN GREATER NEW HAVEN                           11
Community Impact
The foreign-born population is also rising at the neighborhood level. Immigrants make our communities more resilient by participating in local
real estate, culture, and business.

“I live in an immigrant neighborhood… [Immigrants] are homeowners, renters, small business owners, customers, students, parents, etc. They
give our neighborhood its identity as one of the most diverse neighborhoods in the state.”—Anonymous

REAL ESTATE                                                                                               CULTURE

Owning a home indicates financial and social investment in the com-                                       Immigration brings with it foreign traditions that enrich American cul-
munity. Homeowners pay property taxes, which support the local                                            ture. Foreign-born influence shapes many local cultural elements,
government and school system. They are also more likely than rent-                                        including cuisine, music, art, dance, language, and literature. In ad-
ers to engage in civic life by joining community organizations or vot-                                    dition to owning businesses, immigrants in Greater New Haven es-
ing in local elections.x                                                                                  tablish institutes, found organizations, and sponsor or participate in
                                                                                                          festivals that serve as cultural outlets for the entire community. The
• In general, naturalized US citizens have higher rates of homeownership than
                                                                                                          following are just some of the heritage-focused groups and events in
  native-born people.
                                                                                                          Greater New Haven:
• Although native-born people are more likely to own homes than foreign-born
  people overall, including naturalized and non-citizens, the gap between the
                                                                                                          • Afro-American Cultural Center at         • Greater New Haven
  two groups has narrowed over the past decade.
                                                                                                            Yale                                       St. Patrick’s Day Parade
• Lower rates of homeownership among non-citizens are in part due to their
                                                                                                          • Annual Italian Festival Celebration,     • International Festival of
  shorter length of residency in the US; however, immigrant renters represent
                                                                                                            New Haven                                  Arts & Ideas
  “a large reservoir of potential future homeownership demand.”xi
                                                                                                          • Annual Shoreline Jewish Festival         • Jewish Community Center of
Foreign-born residents often revitalize neighborhoods that are other-                                                                                  Greater New Haven
wise experiencing population loss, occupying housing units as home-                                       • Arte, Inc
                                                                                                          • Connecticut Irish American               • JUNTA for Progressive Action
owners or as renters. In older cities and suburbs, a lower neighbor-
hood vacancy rate can have local benefits, including lower crime                                            Historical Society                       • Knights of Columbus
rates, higher property values, and fewer maintenance costs to local                                       • East Rock Institute                      • Yale-China Association
government.xii                                                                                              (formerly Korea Institute)               • Yale Muslim Student Association
                                                                                                          • Ethnic Heritage Center                   • Yale University Hillel
“[Immigrants] provide economic stimulation to marginalized neigh-
borhoods in New Haven… Hispanic immigrants are ‘saving’ neighbor-
                                                                                                          76 percent of survey respon-                “[Immigrants’] rich cultural
hoods like Fair Haven in New Haven from economic decay and crime.”
                                                                                                          dents said increased diversity              heritage enriches our commu-
—Mr. David Casagrande, New Haven native
                                                                                                          due to immigration helps the                nity with festivals, music, and
                                                                                                          existing culture in Connecticut.            dance.” —Anonymous

FIG. 10                                      Home Ownership and Immigrant Status
                                             2008-2012

                                                                     CITY OF NEW HAVEN                                        CONNECTICUT                                       Total Population

                                                                                                                                                                                Native-born
                                     80%                                                                                                                                        All Foreign-born
                                                                                                                                            83,791
                                                                                                                    812,880
H O M E O WN E R S H I P R A T E *

                                     70%                                                                  929,006                                                               Naturalized
                                     60%                                                                                        117,028                                         Non-citizen
                                     50%   Number of owner
                                           occupied units, per                       1,426
                                     40%   population group:                                                                                          33,145
                                                    15,187       12,715
                                     30%                                   2,461
                                     20%                                                     1,032
                                     10%
                                                    31%          32%      26%       43%      17%          68%        70%         57%        73%       37%
                                     0

SOURCE: DataHaven analysis of 2008-2012 Census data, available at census.gov.
* Percentage of all householders in each group who are homeowners.

12                                         DataHaven and The Community Foundation for Greater New Haven
Community Impact

LOCAL BUSINESS

Local small businesses improve neighborhood vitality and walkability, brightening the streetscape and offering services to residents and visi-
tors. Immigrants sustain the small business sector. Nationwide, they represent 18 percent of all small business owners, despite making up just
13 percent of the total population.xiii Foreign-born owned businesses may offer unique products that are otherwise unavailable, and they are
paramount in establishing a neighborhood’s reputation for cultural diversity. To read about how immigrant businesses impact the economy, go
to page 16.

“Immigrants within my community have opened up businesses which make my neighborhood feel like home.” —Anonymous

       Study Area: Ninth Square
                                                                                                                            A Closer Look:
       From July to August 2014, DataHaven surveyed New Haven                                                               New Haven’s Ninth Square
       businesses located on Chapel Street between Church and
       State and on Orange Street between Court and George.                                                                 Downtown New Haven is the vibrant center of our region.
                                                                                                                            The lively atmosphere is fueled by small businesses, such
                                                                                                                            as those in the Ninth Square. An area that frequently
                                                Businesses owned by immigrants
                               18               or children of immigrants                                                   hosts cultural events and late-night activities, the Ninth
                                                                                                                            Square is home to many foreign-born owned businesses.
       34 Businesses

                                                Countries of birth or ancestry repre-                                       The Ninth Square is just one example of where immigra-
                               14
         surveyed

                                                sented (not including the US)                                               tion brings variety and energy to Greater New Haven
                                                                                                                            through commerce; throughout the region immigrant-
                                  TYPES OF IMMIGRANT BUSINESSES:
                                                                                                                            owned restaurants, shops, and businesses flourish.
                                            • Restaurants, Cafes and Bars •
                                         • Beauty • Fashion and Accessories •
                                          • Convenience and General Retail •

                                    More than one third of immigrant-owned
                                  businesses were started in the past 10 years.                                             Why did you choose to open your business in
                                                                                                                            New Haven?

                                                                                                                                              Mr. Kwadwo Adae, Owner of Adae Fine Art Academy
                                                                                                                                              [ of Ghanaian origin ]
FIG. 11          Origin of Small Business Owners in the
                 Ninth Square                                                                                                                 “There is much kindness and cama-
                 Summer 2014                                                                                                                  raderie between business owners…
                                                                                              Europe                                          We all want each other to do well.
                               15%                                                            Asia
                                                                                                                                              New Haven is a nurturing community
                                                                                              Africa
                                                                                                                                              for the arts—visual, culinary, musi-
                                                              26%                             Caribbean +
                                                                                              Latin America                                   cal—there is culture here to find.”
                                                                                              Other

                                                                                              United States
                                                                                                                                              Mr. Prasad Chirnomula, Owner of Thali Restaurant
                                                                                                                                              [ from India ]
                                                                   6%
                   47%                                                                                                                        “A cosmopolitan city, a dining desti-
                                                                            3%
                                                                           3%                                                                 nation. A university town with differ-
                                                                                                                                              ent ethnicities, students, faculty and
SOURCE: Summer 2014 DataHaven survey of Ninth Square businesses.                                                                              visitors and tourists. A city that helps
Foreign Ancestry totals include the ancestry of children of immigrants who were born in the United States.                                    bring business to local businesses.”

                                                                                                             UNDERSTANDING THE IMPACT OF IMMIGRATION IN GREATER NEW HAVEN                        13
EDUCATION

LOCAL SCHOOLS

The immigrant community influences area schools. In 2012, 24 per-                                    Schools are required to provide English language education to all
cent of children in the City of New Haven and 21 percent in Greater                                  students whose English skills inhibit their general education (English
New Haven had at least one foreign-born parent. In 2013, 25 percent                                  language learners). Bilingual classes, English tutoring, and transi-
of students in New Haven Public Schools and 13 percent of students                                   tory teaching methods facilitate English acquisition, though these
in all Greater New Haven public schools spoke a language besides                                     programs can be costly to provide. But the increase in language di-
English at home.xiv In the region, the non-English student body is ris-                              versity can benefit native English speakers as well. Some Connecticut
ing even as the number of English-speaking students slows, sustain-                                  schools, including John C. Daniels School in New Haven, offer dual
ing public school enrollment.                                                                        language programs, in which all students take half of their classes
                                                                                                     in English and half in another language. Further, students fluent in
Immigrants and children of immigrants modify the ethnic, racial, and                                 other languages help English speakers to acquire language skills
social composition of schools. The variety exposes all students to                                   through foreign language exposure.
different values and experiences, which prepare them to work in di-
verse environments and live with tolerance later in life.xv In a study                               In general, the immigrant community highly values education; for
of a diverse suburban Boston school district, students said that they                                many foreign-born people, education was a central reason for im-
were highly comfortable interacting with members of other racial                                     migration. A nation-wide study showed that 97 percent of children
and ethnic groups and discussing social issues. They also said that                                  of immigrants believed that education was “critical” to their future
school diversity improved their ability to work effectively with others                              in the US. The same report noted that parents of English language
from different backgrounds.xvi                                                                       learners are invested in their children’s education, attending parent-
                                                                                                     teacher conferences, encouraging strong work ethic and good be-
Language education has grown with the immigrant community.                                           havior, and participating in parent organizations.xvii

“[Immigration] teaches our kids that the US way is not the only way to think about the world. Diversity teaches tolerance, enriches classrooms,
and helps reduce fear of things ‘foreign.’” —Anonymous

“A diversity of classmates... prepares [our kids] for work in the globalized world. It can be a challenge… when the parents don’t speak English, but
most immigrants are eager to participate as best they can.”—Anonymous

HIGHER EDUCATION

                          Institutes of higher learning in Greater New Haven4 attracted over 3,800 students from abroad over the 2012-
84 percent of respondents 13 academic year.xviii International affiliates at universities bring important cultural, intellectual, and professional
believed that immigrants  contributions to their schools and the community at large.
in Connecticut contribute
                                           Financial assistance for higher education is available to foreign-born students who are New Haven residents, re-
a lot or contribute some to
                                           gardless of immigration status, through the New Haven Promise scholarship program. Supported by New Haven
innovations in technology,                 Public Schools, The Community Foundation for Greater New Haven, and Yale University, New Haven Promise
businesses, health, sci-                   provides scholarships that pay up to full tuition at public colleges or universities for New Haven Public School
ence, and art.                             graduates who have met minimum academic, attendance, and community service requirements.

“The more brains & viewpoints the more likely Connecticut is to increase innovation and efficiency.”—Anonymous

4
     Greater New Haven institutes included in this study are Albertus Magnus College, Gateway Community College, Quinnipiac University, Southern Connecticut State University, Univer-
     sity of New Haven, and Yale University.

14        DataHaven and The Community Foundation for Greater New Haven
Community Impact

FIG. 12           Public School Students: Primary Language and ELL Enrollment
                  2005 through 2013                                                                 Spanish Speakers         Total Student Body

                                                                                                    Spanish, ELL             English Speakers

                                                                                                    Non-Spanish Speakers     Non-English Speakers

                                                                                                    Non-Spanish, ELL         Total ELL

Connecticut Public School Students
                                                                                                                                                                                                  Number of Languages Spoken

                                                                                                                                                         — Connecticut Language Profile—
NON-ENGLISH SPEAKERS AND ELL ENROLLMENT                                                    ALL PUBLIC SCHOOL STUDENTS                                                                             N ON -E N GL I S H

60,000                                                                                     600,000                                                                                                      • 2005                              158
                                                                                                                                                  -5%                                                   • 2013                              176
50,000                                                                             5%      500,000                                                                                                      • Percent change                   11%
                                                                                                                                                  -7%
40,000                                                                                     400,000                                                                                                Most Spoken Primary Languages
                                                                                                                                                                                                  N ON -E N GL I S H, B Y N UM B E R O F P U B L I C
30,000                                                                                     300,000                                                                                                S C HOOL S T UDE N T S , 2 01 3
                                                                                   17%
                                                                                   10%                                                                                                                  • Spanish                        51,510
20,000                                                                                     200,000
                                                                                                                                                                                                        • Portuguese                      2,994
                                                                                                                                                                                                        • Polish                          2,273
10,000                                                                                     100,000
                                                                                   -3%                                                            9%                                                    • Mandarin                        2,198
                                                                                                                                                  6%
       0                                                                                            0                                                                                                   • Creole-Haitian                  1,800

             2005                                                     2013                              2005                             2013

Greater New Haven Public School Students

                                                                                                                                                          — Greater New Haven Language Profile—
                                                                                                                                                                                                  Number of Languages Spoken
NON-ENGLISH SPEAKERS AND ELL ENROLLMENT                                                    ALL PUBLIC SCHOOL STUDENTS                                                                             N ON -E N GL I S H

10,000                                                                                     100,000                                                                                                      • 2005                              100
                                                                                                                                                                                                        • 2013                              112
                                                                                                                                                  -8%
 8,000                                                                                      80,000                                                                                                      • Percent change                   12%
                                                                                    -3%                                                           -10%
                                                                                                                                                                                                  Most Spoken Primary Languages
 6,000                                                                                      60,000
                                                                                                                                                                                                  N ON -E N GL I S H, B Y N UM B E R O F P U B L I C
                                                                                                                                                                                                  S C HOOL S T UDE N T S , 2 01 3
                                                                                    18%
 4,000                                                                                      40,000                                                                                                      • Spanish                         7,373
                                                                                    30%
                                                                                                                                                                                                        • Mandarin                          453
 2,000                                                                                      20,000                                                                                                      • Arabic                            442
                                                                                    18%                                                           3%                                                    • Urdu                              252
                                                                                                                                                  27%
         0                                                                                      0                                                                                                       • Polish                            227

              2005                                                    2013                              2005                             2013

City of New Haven Public School Students
                                                                                                                                                          — City of New Haven Language Profile—

                                                                                                                                                                                                  Number of Languages Spoken
NON-ENGLISH SPEAKERS AND ELL ENROLLMENT                                                    ALL PUBLIC SCHOOL STUDENTS                                                                             N ON -E N GL I S H

6,000                                                                                      25,000                                                                                                       • 2005                                50
                                                                                                                                                                                                        • 2013                                59
5,000                                                                                                                                             5%
                                                                                           20,000                                                                                                       • Percent change                   18%
                                                                                  -13%

4,000                                                                                                                                             11%                                             Most Spoken Primary Languages
                                                                                           15,000                                                                                                 N ON -E N GL I S H, B Y N UM B E R O F P U B L I C
                                                                                                                                                                                                  S C HOOL S T UDE N T S , 2 01 3
3,000
                                                                                  38%
                                                                                           10,000                                                                                                       • Spanish                         4,795
2,000
                                                                                                                                                                                                        • Arabic                            131
                                                                                            5,000                                                 -10%                                                  • Mandarin                            59
1,000
                                                                                  27%                                                             30%                                                   • French                              57

     0
                                                                                  66%          0                                                                                                        • Swahili                             28

             2005                                                   2013                                2005                             2013

SOURCE: DataHaven analysis of Connecticut State Department of Education data, 2005-2013.

                                                                                                               UNDERSTANDING THE IMPACT OF IMMIGRATION IN GREATER NEW HAVEN                                                                            15
Economic Impact
LABOR FORCE                                                                                                                          ECONOMIC CONTRIBUTIONS

Population growth supplies the labor force5 with workers. Labor force                                                                Foreign-born residents contribute to the economy in a number of ways
expansion helps the economy, causing it to increase productivity and                                                                 in addition to employment. They pay income, property, and sales tax
output.xix Greater New Haven and the City of New Haven have ex-                                                                      to local, state, and federal governments. Immigrants are consumers
perienced net growth in population due to immigration. Further, im-                                                                  whose living expenses and other purchases support small business
migrants are more likely to be in the labor force and to be employed                                                                 and larger corporations. Further, they link the local economy to their
than native-born citizens. In 2012 in the City of New Haven, 72 per-                                                                 home economies, potentially increasing trade and creating new mar-
cent of foreign-born people and 64 percent of native-born people                                                                     kets for domestic businesses.
ages 16 and over were in the labor force; 65 percent of immigrants
and 54 percent of native citizens were employed.                                                                                     Like other immigrants, undocumented immigrants also pay sales
                                                                                                                                     and excise taxes, as well as property taxes either directly on their
                                                                                                                                     homes or indirectly as renters. At least half are paying income taxes
FIG. 13                                      Labor Force Participation                                                               despite lacking legal status. Some estimates show that allowing un-
                                             Connecticut and City of New Haven, 2008-2012                                            documented immigrants to work legally in the United States would
                                                                                                             Native-born             increase state and local tax revenues in Connecticut by 28 million
                                                                                                             Foreign-born            dollars annually.xxii
                                                       CONNECTICUT                           CITY OF NEW HAVEN
                                       70%                                                                                           FIG. 14           Selected Economic Contributions
 P E R C E N T O F P O P U LA TI O N

                                                        71%                                      72%
                                       60%       68%                                                             65%
                                                                        65%               64%                                                          Foreign-born Population, 2012
       A G E 16 A N D O V E R

                                                                 61%
                                       50%                                                                54%
                                                                                                                                                                                                                    GREATER                    CITY OF
                                       40%                                                                                                                                              CONNECTICUT                NEW HAVEN                 NEW HAVEN
                                       30%
                                                                                                                                         Income Tax1
                                       20%                                                                                                   Federal income tax                           $905,630,021                    —                         —
                                       10%                                                                                                   State income tax                             $730,963,353                    —                         —
                                        0                                                                                                Property Tax2
                                               In labor force     Employed              In labor force    Employed                           Property tax                                 $609,010,989                    —                         —

SOURCE: DataHaven analysis of 2008-2012 Census data, available at census.gov.
                                                                                                                                         Educational Expenses
                                                                                                                                             Net educational expenses                     $339,937,000              $141,243,000               $92,157,000
                                                                                                                                             Net Tuition and Fees                              55%                       57%                       59%
The immigrant labor force is multi-skilled, and each skill group is es-                                                                      Net Living expenses3                              45%                       43%                       41%
                                                                                                                                             including dependents
sential to the economy. High-skilled work requires advanced knowl-
                                                                                                                                             Jobs created or supported                         3,875                     1,854                     1,504
edge, often technical or abstract and resulting from higher educa-
tion. High-skilled, foreign-born workers contribute to the technical,                                                                SOURCE: DataHaven Analysis of 2008-2012 Census PUMS, available at Census.gov and 2011-2012 NAFSA data, available at nafsa.org.

biomedical, financial, and academic fields. Low-skilled work is labor-                                                               1
                                                                                                                                         The calculations reported for income taxes assume all married couples filed taxes together. If all married couples
                                                                                                                                         filed taxes separately, the estimate for total taxes collected would be $1,291,639,910 in federal income tax and
intensive and does not generally require advanced education or spe-                                                                      $786,154,630 in state income tax.
cific skills. These jobs—in construction, manufacturing, agriculture,                                                                2
                                                                                                                                         The total estimate of property taxes paid in Connecticut divided by the ACS 2008-2012 estimate of homeowners
                                                                                                                                         who are foreign-born.
and service sectors—are usually low-paying but are vital to keeping                                                                  3
                                                                                                                                         Assumes students and their dependents live in the same geographic area where they attend school.
businesses in operation. High-skilled and low-skilled immigrants ex-
pand the labor force in the industries in which they work, creating job
                                                                                                                                     “Low-skilled does not equate to low-importance. Low-skilled workers
and wage growth for all workers, including and foreign-born laborers.xx
                                                                                                                                     support the economy by helping businesses run. Even if they are send-
                                                                                                                                     ing most of their wages to their families, they are… supporting local
The immigrant population of Greater New Haven is highly-skilled,
                                                                                                                                     businesses in some way just by living.” —Ms. Wendy Garcia, New Haven resident
compared to other areas. Using methodology from a Brookings In-
stitution study,xxi DataHaven determined that in Greater New Hav-
en, there are more than twice as many high-skilled as low-skilled                                                                    IMMIGRANT-OWNED BUSINESS
immigrants. In the City of New Haven, there are more than three
                              high-skilled for every two low-skilled                                                                 According to the Survey of Business Owners, there were 23,409
67 percent of respon-         foreign workers. In the United States                                                                  immigrant-owned businesses,6 or 7 percent of all businesses, in
dents said immigration        as a whole, there is slightly less than                                                                Connecticut in 2007. These businesses collectively employed nearly
helps Connecticut’s           one high-skilled for every low-skilled                                                                 47,000 full and part-time workers, paid $1.7 billion in salaries, and
economy.                      immigrant worker.                                                                                      earned nearly $17 billion in annual receipts.

                                        5
                                             The Census definition of the labor force is all people ages 16 and over who were employed, or who are able to work and actively looked for work during the last 4 weeks.
                                        6
                                             The Census Bureau defines Immigrant-owned businesses as those with majority foreign-born ownership, where 51 percent or more of the business is owned by a foreign-born person
                                             or persons.

16                                      DataHaven and The Community Foundation for Greater New Haven
Economic Impact

FIG. 15          Immigrant-owned Business Contributions, Share of all Connecticut Businesses
                 2007
                                                BUSINESSES                           EMPLOYMENT           PAYROLL               SMALL                  NEW                EMPLOYING
                                                                                                                              BUSINESSES            BUSINESSES            BUSINESSES

                                                     7%                                    7%              6%                   10%                   13%                   10%

     Majority Native-born
     Owned as Percent of
     All Businesses
     Majority Foreign-born
     Owned as Percent of
     All Businesses                                   93%                                   93%            94%                   90%                   87%                   90%

FOREIGN-BORN
OWNED BUSINESSES:                                   23,409                                46,995       $1,707,336,460           22,051                12,352                6,319

SOURCE: DataHaven analysis of Census 2007 Survey of Business Owners PUMS, available at census.gov.

Many immigrant businesses have characteristics that support eco-                                                 including a lack of health insurance or affordable care, literacy-relat-
nomic vitality. Nationwide, small businesses employ about half of the                                            ed barriers, or gaps in access to physical activity, nutritious food, and
private workforce and earn about half of the nonfarm private GDP.                                                healthy home and work environments.
Further, they provide the local market with diversity of goods and
services. Immigrant business owners in Connecticut are more likely
                                                                                                                 WORKING IN THE US AS AN IMMIGRANT
to operate independent small businesses7 than native-born owners:
in 2007, 94 percent of immigrant-owned firms were independent                                                    To work legally in the United States, immigrants must get permis-
small businesses, compared to 68 percent of all native born-owned                                                sion from the federal government. Long-term residents may obtain
businesses. New businesses propel job growth and innovationxxiii, and                                            legal permanent residency (also known as a green card) or natu-
immigrants are more likely to start a business than native citizens.                                             ralized citizenship, both of which allow immigrants to live and work
Fifty-three percent of foreign-born owned businesses were new (es-                                               permanently in the US. Those who desire short-term or temporary
                               tablished between 2000 and 2007),                                                 employment must apply for work visas according to their skill level
81 percent of respon-                                                                                            and desired type of work. Work visas are limited in each category,
                               compared to 28 percent of native-born
dents said immigrant-          owned businesses. Immigrant-owned                                                 and not all who apply are granted visas. The demand for work visas,
owned businesses were businesses were also more likely to be                                                     especially for low-skilled work, is significantly greater than the supply.
very or somewhat im-           employers: 27 percent of foreign-born                                             International students at American schools can work part-time or full-
portant to the economy compared to 20 percent of native born-                                                    time for a limited period under the conditions of their student visas.
of their town or city.         owned businesses provided jobs.xxiv
                                                                                                                 Immigrants may be limited in their work opportunities compared to
                                                                                                                 native-born people, even taking into account legal status, skill level,
HEALTH CARE                                                                                                      and origin. Some positions, such as most government work, require
                                                                                                                                              US citizenship. Sometimes, foreign-
Through their contributions in the form of payroll taxes, immigrants                                             68 percent thought           born people may not be eligible for
contribute tens of billions of dollars more to the U.S. health care                                              economic opportunities positions that they could hold in their
system than they take out in the form of benefits. This is in part be-                                           available to immigrants home countries, because their educa-
cause they are less likely to, or in some cases unable to, collect on                                            in their town or city were tion or credentials do not transfer to the
available health benefits when compared to native-born residents.                                                “fair” or “poor.”            United States job market. Low-skilled
For example, in 2009, immigrants made 15 percent of all contribu-                                                                             immigrants may take physically de-
tions to the national Medicare Trust Fund, which supports Medicare                                               84 percent thought ob- manding jobs that are largely unfilled
payments to hospitals and institutions, but were responsible for only                                            taining the correct visa     by native-born workers.xxvii Due to their
8 percent of its expenditures.xxv                                                                                for employment in the        status, undocumented immigrants are
                                                                                                                 US was “very difficult” or highly at risk for labor law abuse, such
At a national level, researchers have found that immigrants live lon-
                                                                                                                 “somewhat difficult.”        as wage theft.xxviii
ger, have healthier babies, and have far fewer mental health issues
than native-born residents of the United States.xxvi Depending on                                                “The economic opportunities vary widely depending on the back-
their socioeconomic status and other factors, many immigrants liv-                                               ground of the immigrants… For people with little or no formal educa-
ing in Greater New Haven face the same barriers to achieving their                                               tion in the US, the economic opportunities are much more limited.”
full health potential that impact our communities more broadly—                                                  —Anonymous

7
       In this study, an independent small business is defined as a firm employing less than 500 workers and not operating as a franchise.

                                                                                                     UNDERSTANDING THE IMPACT OF IMMIGRATION IN GREATER NEW HAVEN                      17
References and
                                                                                            xi
                                                                                              	Mengistu, Azanaw. (2014). “Homeownership Rate Gap Between Immigrants
                                                                                               and the Native-Born Population Narrowed Faster During the Last Decade.” Fan-
                                                                                               nie Mae. Accessed September 2, 2014 at http://www.fanniemae.com/resources/

Notes                                                                                       xii
                                                                                               file/research/datanotes/pdf/housing-insights-082514.pdf.

                                                                                                 	US Department of Housing and Urban Development. (2014). “Vacant and
                                                                                                  Abandoned Properties: Turning Liabilities Into Assets.” Accessed September 18,
                                                                                                  2014 at http://www.huduser.org/portal/periodicals/em/winter14/highlight1.html
i
        Kinder Institute for Urban Research. (2014). Houston Area Survey. Ac-
        cessed July 7, 2014 at http://has.rice.edu/, and Public Religion Research           xiii
                                                                                                    Kallick, David. (2012). “Immigrant Small Business Owners: A Significant and
        Institute. (2013). Religion, Values, and Immigration Reform Survey. Ac-
                                                                                                    Growing Park of the Economy.” New York, NY: Fiscal Policy Institute. Accessed
        cessed July 7, 2014 at http://www.brookings.edu/~/media/research/files/
                                                                                                    July 8, 2014 at http://www.fiscalpolicy.org/immigrant-small-business-owners-
        reports/2013/03/21%20immigration%20survey%20jones%20dionne%20
                                                                                                    FPI-20120614.pdf
        galston/2013_immigration_report_layout_for_web.pdf
                                                                                            xiv
                                                                                                  	DataHaven analysis of 2014 Connecticut State Department of Education data
ii
        Total individual income is defined by the US Census Bureau as the sum of the
                                                                                                   on Connecticut Public Schools by dominant language of students. Shared with
        amounts reported separately for wage or salary; net self-employment; interest,
                                                                                                   DataHaven for the purposes of this report. Accessed August 1, 2014.
        dividends, or net rental or royalty income, or income from estates and trusts;
        Social Security or railroad retirement income; Supplemental Security Income         xv
                                                                                                    Kurlaender, Michal. (2006). “The Benefits of Racial/Ethnic Diversity in
        (SSI); public assistance or welfare payments; retirement, survivor, or disability
                                                                                                    Elementary and Secondary Education.” Washington, DC: U.S. Commis-
        pensions; and all other income. See Social Explorer. “Data Dictionary.” Accessed
                                                                                                    sion on Civil Rights. Accessed August 26, 2014 at http://www.usccr.gov/
        September 15, 2014 at http://www.socialexplorer.com/data/ACS2009/metadata/?
                                                                                                    pubs/112806diversity.pdf.
        ds=American+Community+Survey+2009&table=B06010
                                                                                            xvi
                                                                                                    The Civil Rights Project of Harvard University analyzed Diversity Assessment
iii
        Hoefer, Michael et al. (2007). “Estimates of the Unauthorized Immigrant
                                                                                                    Questionnaires from 634 junior year students from Lynn Public School District.
        Population Residing in the United States: January 2006.” Washington, DC:
                                                                                                    Lynn, MA is a suburb of Boston of comparable size and demographics to New
        Department of Homeland Security. Accessed July 8, 2014 at http://www.dhs.
                                                                                                    Haven. See The Civil Rights Project. (2002). “The Impact of Racial and Ethnic
        gov/xlibrary/assets/statistics/publications/ill_pe_2006.pdf
                                                                                                    Diversity on Educational Outcomes: Lynn, MA School District.” Cambridge, MA:
                                                                                                    Harvard University. Accessed August 26, 2014 at http://civilrightsproject.ucla.
iv
     	Passel, Jeffrey et al. (2014). “As Growth Stalls, Unauthorized Immigrant Popula-
                                                                                                    edu/legal-developments/court-decisions/voluntary-desegregation-plan-using-
      tion Becomes More Settled.” Washington, DC: Pew Research Center. Accessed
                                                                                                    race-as-a-factor-1/crp-lynn-report-2002.pdf
      September 10, 2014 at http://www.pewhispanic.org/2014/09/03/as-growth-
      stalls-unauthorized-immigrant-population-becomes-more-settled/                        xvii
                                                                                                    Waterman, R. and Harry, B. (2008). “Building Collaboration Between Schools
                                                                                                    and Parents of English Language Learners: Transcending Barriers, Creating Op-
v
    	DataHaven analysis of 2013 Center for Applied Research in the Apostolate data.
                                                                                                    portunities.” Coral Gables, FL: University of Miami. Accessed August 26, 2014
     See Gray, Mark and Gautier, Mary. (2013). “Estimates of the Size and Demog-
                                                                                                    at http://www.nccrest.org/Briefs/PractitionerBrief_BuildingCollaboration.pdf.
     raphy of the Undocumented Non-Citizen Population in US Catholic Dioceses,
     2013.” Washington, DC: Georgetown University. Accessed October 14, 2014 at             xviii
                                                                                                   	DataHaven analysis of 2013 NAFSA data on spending by international students
     https://cliniclegal.org/sites/default/files/cara-clinic_final_report_2013_with_good_
                                                                                                    in Connecticut. See NAFSA: Association of International Educators. (2014).
     first_page.pdf
                                                                                                    “Economic Benefits of International Students to the U.S. Economy, Academic
                                                                                                    Year 2012-2013.” Accessed October 6, 2014 at http://www.nafsa.org/_/File/_/
vi
     	Passel, Jeffrey and Cohn, D’Vera (2011). “Unauthorized Immigrant Population:
                                                                                                    eis2013/Connecticut.pdf
      National and State Trends, 2010.” Washington, DC: Pew Research Center. Ac-
      cessed September 10, 2014 at http://www.pewhispanic.org/files/reports/133.pdf.        xix
                                                                                                    Clemons, Scott. (2014). “The Unsung Economics of Immigration.” Forbes. Ac-
                                                                                                    cessed September 4, 2014 at http://www.forbes.com/sites/realspin/2014/09/04/
vii
      	Passel, Jeffrey et al. (2014). “As Growth Stalls, Unauthorized Immigrant Popula-
                                                                                                    the-unsung-economics-of-immigration/.
       tion Becomes More Settled.” Washington, DC: Pew Research Center. Accessed
       September 10, 2014 at http://www.pewhispanic.org/2014/09/03/as-growth-stalls-        xx
                                                                                                    Greenstone, Michael and Looney, Adam. (2012). “What Immigration Means for
       unauthorized-immigrant-population-becomes-more-settled/
                                                                                                    U.S. Employment and Wages.” Washington, DC: Brookings Institute. Accessed
                                                                                                    September 16, 2014 at http://www.brookings.edu/blogs/jobs/posts/2012/05/04-
viii
      	For example, a 2014 report stated that the median length of residence for
                                                                                                    jobs-greenstone-looney.
       unauthorized immigrants in the US was 13 years and 62 percent have lived in
       the US for ten or more years. Undocumented immigrants represent 5.2 percent          xxi
                                                                                                    Institute on Taxation and Economic Policy (ITEP). 2013. “Undocumented Im-
       of the US labor force but only 3.7 percent of the US population. See CAP Im-
                                                                                                    migrants’ State and Local Tax Contributions.” Washington, DC: ITEP. Accessed
       migration Team. (2014). “The Facts on Immigration Today.” Washington, DC:
                                                                                                    November 13, 2014 at http://www.itep.org/pdf/undocumentedtaxes.pdf
       Center for American Progress. Accessed November 13, 2014 at https://www.
       americanprogress.org/issues/immigration/report/2014/10/23/59040/the-facts-on-
       immigration-today-3/
                                                                                            xxii
                                                                                                    Institute on Taxation and Economic Policy (ITEP). 2013. “Undocumented Im-
                                                                                                    migrants’ State and Local Tax Contributions.” Washington, DC: ITEP. Accessed
                                                                                                    November 13, 2014 at http://www.itep.org/pdf/undocumentedtaxes.pdf
ix
        Immigration Policy Center. (2014). “Basics of the United States Immigration
        System.” Washington, DC: American Immigration Council. Accessed November
        14, 2014 at http://www.immigrationpolicy.org/sites/default/files/docs/how_us_im-
                                                                                            xxiii
                                                                                                   	A 2010 study found that new businesses (businesses in their first year) in the
        mig_system_works.pdf                                                                        US create 3 million jobs annually. See Kane, Tim. (2010). “The Importance of
                                                                                                    Startups in Job Creation and Job Destruction.” Kansas City, MO: The Kauffman
                                                                                                    Foundation. Accessed September 18, 2014 at http://www.kauffman.org/~/me-
x
    	Manturuk, Kim et al. (2012). “Homeownership and Civic Engagement in
                                                                                                    dia/kauffman_org/research%20reports%20and%20covers/2010/07/firm_forma-
     Low-Income Urban Neighborhoods: A Longitudinal Analysis.” Chapel Hill, NC:
                                                                                                    tion_importance_of_startups.pdf
     University of North Carolina at Chapel Hill. Accessed September 17, 2014 at
     http://ccc.unc.edu/contentitems/homeownership-and-civic-engagement-in-low-
     income-urban-neighborhoods-a-longitudinal-analysis-3/
                                                                                            xxiv
                                                                                                   	DataHaven Analysis of 2007 Survey of Business Owners PUMS. See US Census
                                                                                                    Bureau. (2012). Survey of Business Owners. Washington, DC: US Census Bu-
                                                                                                    reau. Accessed July 15, 2014 at https://www.census.gov/econ/sbo/pums.html

18           DataHaven and The Community Foundation for Greater New Haven
You can also read