WP/20/59 - International Monetary Fund
←
→
Page content transcription
If your browser does not render page correctly, please read the page content below
WP/20/59

 A European Minimum Wage: Implications for Poverty and
 Macroeconomic Imbalances

by Enrica Detragiache, Christian Ebeke, La-Bhus Fah Jirasavetakul, Koralai Kirabaeva,
 Davide Malacrino, Florian Misch, Hyun Woo Park, and Yu Shi

IMF Working Papers describe research in progress by the author(s) and are published
to elicit comments and to encourage debate. The views expressed in IMF Working Papers
are those of the author(s) and do not necessarily represent the views of the IMF, its
Executive Board, or IMF management.
Disclaimer:
This document was prepared before COVID-19 became a global pandemic and resulted in
unprecedented economic strains. It, therefore, does not reflect the implications of these
developments and related policy priorities. We direct you to the IMF Covid-19 page that includes
staff recommendations with regard to the COVID-19 global outbreak.
© 2020 International Monetary Fund WP/20/59

 IMF Working Paper

 European Department

 A European Minimum Wage: Implications for Poverty and Macroeconomic
 Imbalances

Prepared by Enrica Detragiache, Christian Ebeke, La-Bhus Fah Jirasavetakul, Koralai
 Kirabaeva, Davide Malacrino, Florian Misch, Hyun Woo Park, and Yu Shi

 Authorized for distribution by Enrica Detragiache

 May 2020

 IMF Working Papers describe research in progress by the author(s) and are published to
 elicit comments and to encourage debate. The views expressed in IMF Working Papers are
 those of the author(s) and do not necessarily represent the views of the IMF, its Executive Board,
 or IMF management.

 Abstract

A hypothetical European Minimum Wage (MW) set at 60 percent of each country’s
median wage would reduce in-work poverty but have limited effects on overall poverty, as
many poor households do not earn a wage near MW and higher unemployment, higher
prices, and a loss of social insurance benefits may erode direct benefits. Turning to
competitiveness, since the MW increase to reach the European standard would be larger in
euro area countries with excessive external surpluses, the associated real appreciation
should help curb existing imbalances. However, a few countries with already weak
external positions would experience an undesirable real appreciation.

JEL Classification Numbers: J3, E64, F45, I38

Keywords: Minimum Wage, European Union, Poverty Alleviation, Current Account
Rebalancing, Monetary Unions

Author’s E-Mail Address: edetragiache@IMF.org, cebeke@IMF.org,
ljirasavetakul@IMF.org, kkirabaeva@IMF.org, dmalacrino@IMF.org, fmisch@IMF.org,
hpark2@IMF.org, yshi2@IMF.org
CONTENTS Page

ABSTRACT ..............................................................................................................................3

I. INTRODUCTION ................................................................................................................5

II. AN EU MINIMUM WAGE: WHAT MIGHT IT LOOK LIKE? .................................7

III. EFFECTS ON POVERTY .............................................................................................10
 A. A micro-simulation of direct effects on poverty .....................................................11
 B. Indirect effects .........................................................................................................14

IV. EFFECTS ON REBALANCING WITHIN THE EURO AREA ................................16
 A. External imbalances within the euro area have been long-lasting ..........................17
 B. Notes of caution ......................................................................................................21

V. CONCLUSIONS ...............................................................................................................24

REFERENCES.......................................................................................................................26

APPENDICES

A: EFFECTS OF HARMONIZING MINIMUM WAGES RATIOS ON POVERTY ...30

B: EFFECTS OF HARMONIZING MINIMUM WAGES RATIOS ON
REBALANCING WITHIN THE EURO AREA ................................................................33
 A. The Impact of a Change in the Minimum Wage on ULCs: Regression Analysis ..33
 B. Transmission channels: The main channel is the average compensation of
 employees ....................................................................................................................36
 C. Rebalancing in the Euro Area: Simulation Exercises .............................................40

APPENDIX FIGURE
B1: Country-specific Rebalancing Results under Alternative Regression ..............................44

APPENDIX TABLES
B1: Cumulative log deviations in ULCs, relative to year -1 (before the MW shock) .............35
B2: Cumulative log deviations in the medium term, relative to year-1 (before the MW
shock). Instrumental variable estimates. ..................................................................................37
B3: Cumulative log deviations in the medium term, relative to year -1 (before the MW
shock). Instrumental variable estimates. ..................................................................................38
B4: Cumulative log deviations in ULCs, relative to year -1 (before the MW shock) OLS with
specific effects. ........................................................................................................................39
B6: Cumulative log deviations in ULCs, relative to year -1 (before the MW shock). ............45
B7: Kaitz Index Data and Sources ...........................................................................................46
I. INTRODUCTION

1. Calls to introduce or raise the minimum wage (MW) have become increasingly
popular in Europe and beyond. Weak wage growth in advanced countries has been widely
debated and attributed to a variety of causes, including technological change, higher market
power by companies, declining unionization, and globalization (see, for instance, IMF,
2017a). In the EU, the global financial crisis and sovereign crisis that followed resulted in
higher unemployment, slow wage growth, and greater poverty in the affected countries.
Looking forward, further progress in automation may worsen this trend, potentially fueling
income inequality, concerns about social injustice, and skepticism about the benefits of
technological progress and globalization. Against this background, advocates of the MW
claim that a high MW helps shore up the incomes of low-skilled workers, reduce in-work
poverty, and improve income distribution at the cost of small adverse employment effect. 1
Among large countries, Germany introduced a MW in 2015 and Spain, the U.K. and some
U.S. states have raised their MW more aggressively in recent years, while a new statutory
MW in Italy is being debated. In Central and Eastern Europe, several countries (most
recently Lithuania, Bulgaria and Czech Republic) have raised their MW sharply amid strong
labor demand growth (IMF, 2016).

2. Differentials in wage levels and dynamics have also attracted attention in the
context of persistent macroeconomic imbalances in the euro area (EA). Large
misalignments in external competitiveness within the EA have been slow to adjust in the
absence of nominal exchange rate flexibility and a common fiscal policy, and as wage and
prices have become less responsive to output gaps (IMF, 2012, 2019a). The IMF has called
for wage restraint in countries with a weaker external position and sluggish productivity
growth and faster wage growth in countries with a stronger external position to help the
rebalancing process, while recognizing that governments do not directly control wages.
Blanchard (2018) suggested wage negotiations at the national level to ensure that wage
settlements reflect the need for rebalancing, thereby reducing reliance on the output gap-
wage pressure mechanism. Against this background, changes in the MW within the EA could
have implications for macroeconomic rebalancing.

3. In the EU, the idea of a harmonized European Minimum Wage (EMW) to
provide an adequate standard of living to all workers has been actively debated for
some time. At present, most EU countries have a national MW, but its level varies across
countries, reflecting differences in cost of living and median salaries but also different social
preferences or labor market conditions. 2 In 2017, the umbrella organization of the European

1
 For an overview of the large economic literature on the MW, see for instance Card and Taylor, (1995) and
Neumark and Wascher (2010).

2
 The UK is not included in the analysis as it exited the EU on January 31, 2020.

 (continued…)
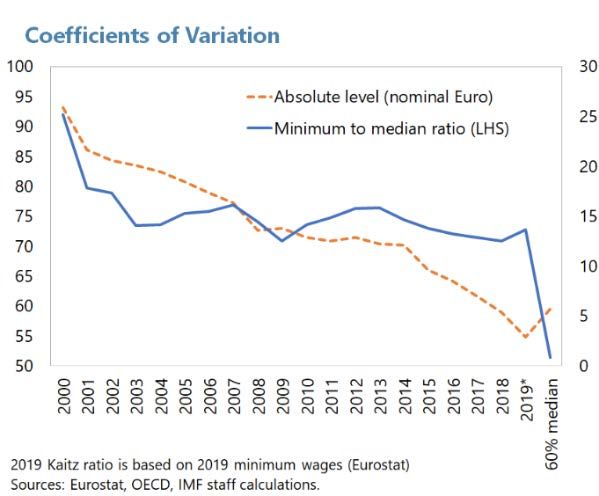
6

trade unions agreed to advocate for a harmonized EU MW set at 60 percent of the national
median or 50 percent of the national average wage (WSI, 2019). More recently, calls for a
European MW have multiplied in the political debate 3 Though social and wage policies are
generally the competency of individual member countries and not the EU (subsidiarity
principle), the European Pillars of Social Rights call for “the right to fair wages that provide
for a decent standard of living.” In January 2020 the European Commission (EC) launched a
consultation with social partners on actions to undertake within its mandate to ensure fair
MWs in all EU countries. This broad initiative is not limited to statutory MWs and will not
propose harmonization of MW policies and levels. 4

4. This paper discusses how an EMW could be designed and examines its effects on
poverty and macroeconomic imbalances in the EA. If EU countries decide to harmonize
their MWs, the most desirable approach would be to set the MW to take into account
differences in labor productivity and standards of living. Because these differences are large,
harmonizing the level of the nominal MW across countries (absolute harmonization) would
not be realistic nor desirable, as it would severely disrupt labor markets in lower wage, less
advanced countries while not lifting low wages within more advanced countries. Relative
harmonization, on the other hand, would anchor the MW to the overall wage level within
each country, ensuring that the EMW reflects differences in economic and labor market
conditions. In this note, we examine the effect of such a harmonization on poverty in the EU
and external rebalancing in the EA.

5. MW harmonization to the highest level currently observed (60 percent of each
country’s the median wage) would benefit the working poor but the effect on the overall
poverty rate would likely be small. This policy would result in sizable MW increases in
some countries and no change in others. To explore its potential effects on poverty, we draw
on EU micro-level survey data (EU-SILC) for 2016. First, in each country we compute the
direct effect of the new MW on the earnings of poor households and the overall poverty rate
ignoring behavioral responses and other macroeconomic effects. This direct effect turns out
to be relatively small compared to changes in poverty rates observed in our sample in recent
years: while the in-work poor gain, many poor households have only members who are not
working or are self-employed, so they do not benefit directly from the higher MW. In
addition, behavioral responses (such as a reduction in labor demand by employers,
withdrawal of social insurance benefits, or higher avoidance) and macroeconomic effects
(such as higher cost of living as MW increases are passed on to prices) would likely further

3
 In March 2019, French President Macron called for “a European MW adjusted to each country and
collectively negotiated every year.” In June 2019, German Chancellor Angela Merkel has advocated
‘comparable minimum wages in the EU that reflect the different living standards and ensure similar working
conditions.’ European Commission President Ursula von der Leyen has committed to proposing ‘a legal
instrument to ensure that every worker in the EU has a fair minimum wage’.

4
 https://ec.europa.eu/commission/presscorner/detail/en/fs_20_51. Legal and administrative obstacles to MW
harmonization are not discussed in this paper.
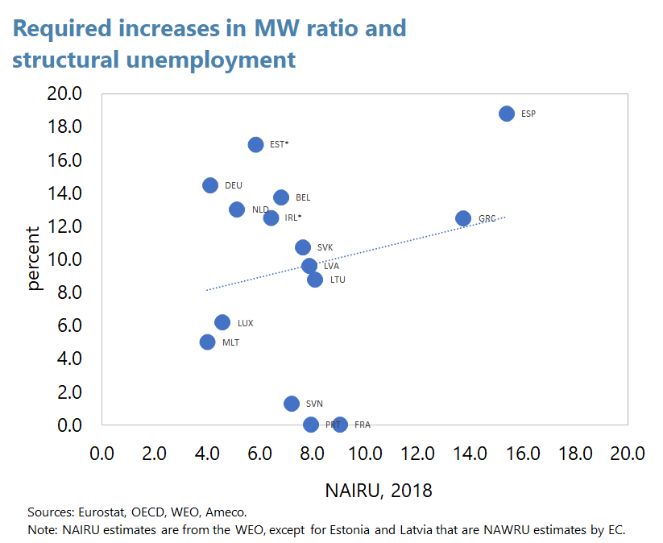
7

reduce and may even reverse the overall beneficial effect on poverty. On the other hand, the
higher MW would have a more pronounced direct effect on in-work poverty (i.e., the relative
poverty rate of people in work).

6. Harmonizing toward a higher MW could allow for some overall external
rebalancing within the EA but may worsen imbalances in a few countries. Using a macro
econometric approach for a panel of EU countries, we show that increases in the MW are
robustly associated with subsequent increases in unit labor costs after controlling for other
factors, suggesting that changes in the MW can affect overall cost competitiveness. Using
this finding, we show that countries with an external position that is too strong (e.g.,
Germany, the Netherlands) would see their position weaken, helping the rebalancing process,
while some countries with weak external position would experience an improvement.
However, a few other countries with an external position that is already too weak (e.g.,
Spain, Greece, Belgium) would see their situation worsen further.

 II. AN EU MINIMUM WAGE: WHAT MIGHT IT LOOK LIKE?

7. Many EU countries have a MW but levels vary considerably. MWs range from
€260 per month in Bulgaria to around €2,000 in Luxembourg in 2018. 5 In Austria, Cyprus,
Denmark, Finland, Italy, and Sweden there is no statutory MW, but sectoral minimum wages
are set through collective bargaining. Adjusting for differences in purchasing power, MWs
remain quite heterogenous, with MWs in high-income countries such as Luxembourg, the
Netherlands, Belgium, and Germany well above those in lower income countries such as
Bulgaria, Romania, and Latvia. 6 These large differences reflect differences in income per
capita and labor productivity, as well as different country preferences and labor market
institutions.

8. Harmonizing the MW to a common level (absolute harmonization) is not
realistic nor desirable. While bringing MWs toward a common level across the EU is
perhaps the most intuitive concept of a more harmonized MW, the large differences in
existing MWs documented above as well as the heterogeneity in average wages, labor
productivity, and level of development within the union suggest that such a nominal
harmonization would not be desirable. For instance, harmonizing the MW to the EU mean
would imply that the MW would not bind in higher-income countries while almost all
workers would be affected by it in lower-income countries. Such a harmonization would also
mean very large increases in minimum wages in some countries beyond their current national

5
 We report 2018 data rather than 2019 data because median wage data are not available for 2019. For Spain we
report the estimated Kaitz ratio for 2019, given the substantial MW increase for that year. Table B7 in the
Appendix summarizes the information about data used and the sources.
6
 Differences in social security contributions and taxation further complicate cross-country comparisons, as the
MWs are typically set on a gross basis. We are ignoring such differences here because of lack of data.
8

medians (Bulgaria, Latvia, Lithuania or Romania). This would obviously result in
undesirable disruptions in the labor markets of those countries.

9. A more promising approach is relative harmonization, i.e. setting the MW as the
same percentage of a reference wage in each country. This approach ensures that the MW
remains anchored to overall wage levels within each country and therefore takes into account
the large differences in wages and labor
 Nominal Minimum Wage and Minimum Wage Ratio
productivity that exist across the region, 2,500 90
 Nominal minimum wage, monthly (Euro)
while still ensuring that lower wages do MW to P50 (Percent, RHS)
 80
 2,000 70
not fall too far behind the median or 60
 1,500
average within each country. 7 The 50
 40
 1,000
European Trade Union confederation has 30
 500 20
proposed to set the MW to either 60 10
percent of the median or 50 of the average 0 0

 BEL

 AUT
 GRC
 EST

 FRA
 CZE
 LVA
 LTU

 HUN

 DNK
 ROU

 SVK

 SVN

 ITA-2015
 BGR

 HRV

 PRT

 DEU

 LUX
 POL

 ESP-2019

 IRL

 SWE
 MLT

 NLD

 FIN-2010
 CYP
wage in each EU country. This approach
would therefore harmonize the so called With statutory min. wage No statutory min.
 wage
Kaitz index across the EU. As average
 8
 Sources: Eurostat; OECD; Garnero et al (2014); Garnero (2015); and IMF staff calculations.
 Note: Both nominal minimum wage and the minimum wage ratio are for 2018, otherwise indicated.
wages are affected by extreme values, Estimated minimum wage ratio for countries without statutory minimum wage was taken from the literature in
 the sources.

median wages provide a better point of
reference especially in countries that have high wage inequality, so in what follows we will
focus on Kaitz indexes using the median rather than average wage.

10. Bringing the MW to the median wage of 60 percent would lead to an increase in
the MW most EU countries. Because there is no source of standardized data for the
distribution of wages, cross-country comparisons of Kaitz indexes may yield a somewhat
different picture depending on the data source. With this caveat, OECD data for 2018
suggests that setting the MW at 60 percent of the median wage would harmonize the index to
its top level in countries with a statutory MW. 9This threshold is also close to the usual
definition of “low pay” as 2/3 of the median wage. This policy change would imply no MW
change in countries such as France and Portugal and a significant – though not unprecedented
– increase in countries such as Czech Republic, Estonia, Germany, Belgium, the Netherlands,
Ireland, Greece, Slovakia, and Spain. Thus, harmonization may need to proceed gradually to
avoid disrupting labor markets in countries that are far away from the benchmark. A less

7
 Median wage is preferable measure of centrality since it less affected by top earning outliers.

8
 The Kaitz index is defined as a ratio of the minimum to the median or to the average wage.

9
 Estimates of average MWs in countries that only have collectively negotiated sectoral minima indicate that
MWs are close to the 60 percent threshold in Austria, Cyprus, and Finland, and well above in Italy. No
information is available for Denmark and Sweden.
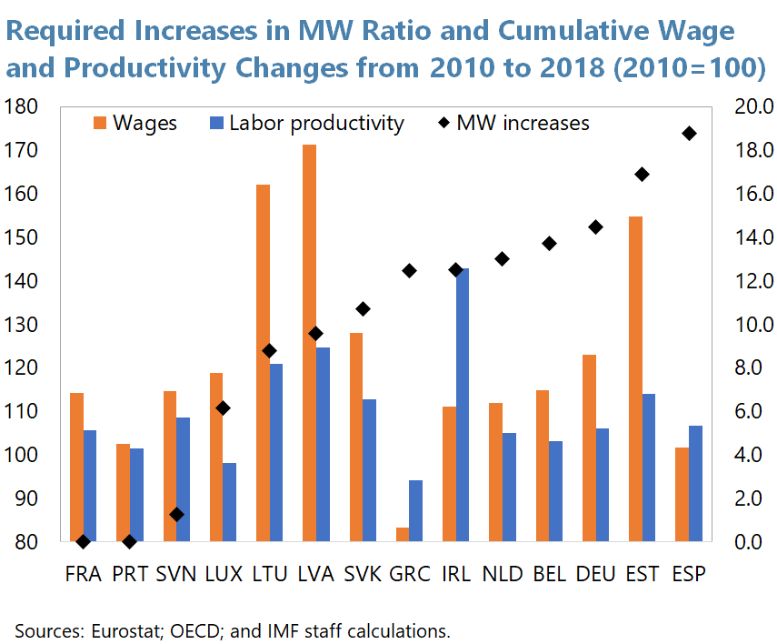
9

ambitious target, for instance 50 of the median wage, would limit the increase to a maximum
of 8 percent but it would leave some countries well above the threshold.

Changes in Minimum Wage to Reach 60 Percent of Median Maximum Annual Change in Kaitz Index, 1999–2019
Wages, Selected EU Countries (Kaitz index refers to the ratio of minimum wage to median wage; Percentage points)
(Percent) 25

 2019

 2003
 20

 2010

 2013
 2500 15
 2000

 2011
 1500
 1000 10

 2016

 2000

 2006

 2003
 500

 2010
 0

 2006

 2006
 1234567

 2009
 5

 2004
 0
 ESP LVA SVN LTU GRC IRL SVK NLD EST PRT MLT LUX BEL FRA

Sources: Eurostat; OECD; and IMF Staff Calculations. Sources: OECD statistics; IMF staff calculations.

11. Relative MW harmonization would make nominal MW levels more unequal
across countries. It would effectively widen the distance between the nominal MW in
relatively lower income countries (Baltics, Romania, Hungary, Czech R., Slovakia, Slovenia,
Poland, Greece, Portugal) and higher income countries (Germany, Belgium, Ireland,
Netherlands, Luxemburg). Thus, it may exacerbate the perception of wage inequality among
EU countries. It may also reinforce incentives for low skill workers to migrate from lower to
higher income EU countries. Large increases in the MW may also increase incentives to
circumvent MW regulation, as countries where the MW is more binding tend to have higher
rates of non-compliance, though complementary initiatives to improve monitoring and
enforcement, possibly coordinated at the EU level, would help in this regard. In addition,
where there are large within-country regional disparities in labor productivity, a more
binding MW that is uniform within each country may weaken the labor market performance
and competitiveness of the less productive regions. 10 These effects would offset part of the
intended benefits of harmonization. In addition, relative MW harmonization may not reduce
differences in poverty rates across the EU, as countries with low Kaitz ratios are not
necessarily those with the largest share of vulnerable households. The next section examines
the impact on within country relative poverty from MW harmonization.

10
 On wage setting and regional disparities, see for instance Ichino et al. (2019).
10

 Kaitz Index and Poverty
 65

 FRA * PRT
 60
 SVN ROM

 Kaitz index, 2018
 55
 LUX *
 POL
 HUN LTU
 50 LVA
 SVK *
 NLD IRL * GRC
 BEL
 45 DEU
 EST
 CZE ESP
 40
 10 15 20 25 30 35
 At-risk of Poverty, 2018 (Percent)
 * 2017 data
 Sources: Eurostat; OECD; IMF Staff Calculations.

 III. EFFECTS ON POVERTY

MW policies aim at ensuring that wages at the low end of the scale do not fall too far behind
average income growth, thereby protecting lower income groups. But to what extent does
MW policy affect poverty? Many poor households do not have members who work in
dependent employment or at all, and many MW earners may not be in poor households. In
this section, we explore how a hypothetical EMW might affect overall poverty and in-work
poverty in the EU using household survey data.

12. Household poverty is heterogenous across EU member states. Poverty is usually
defined at the level of the household using relative income thresholds. In this paper, we
define a household as poor if its equivalized disposable income from all sources is below 60
percent of the median equivalized disposable household income in the same country in a
given year. 11 Based on this definition, the average poverty rate in the data used for the
microsimulation exercise (see below) is around 16 percent, ranging from 7 percent in Czech
Republic to 22 percent in Spain. As the poverty rate is defined in relative terms, a reduction
in the poverty rate makes the distribution of income more equal within each country, holding
everything else equal. 12

13. The effect of an increase in the MW on poverty is the combination of direct and
indirect effects. Direct effects refer to the impact of the change in the MW on household
wage earnings leaving other factors constant. Indirect effects occur because the change in the
MW changes behavior (for instance, labor demand by employers) or has general equilibrium
effects (for instance, changes in goods prices). In this section, we construct a microsimulation
to assess the direct effects of relative MW harmonization in the EU and will briefly discuss

11
 This is in line with the recommendation by the European Council (2001). Eurostat also provides longitudinal
measures of household poverty, the “at-risk-of-poverty rates.” According to this measure, a household is poor if
its equivalized income falls below the 60-percent threshold in 3 out of 4 consecutive years.
12
 In the simulations, we ignore the fact that poverty (which is defined in relative terms) might increase
mechanically if the median wage changes as a result of changes in the MW. We always compute the poverty
rate using the current (i.e., pre-EMW) median wage.
11

indirect effects, which include loss of employment, loss of purchasing power through higher
prices, loss of means-tested social insurance benefits, and potential higher non-compliance
with the MW regulation. As indirect effects tend to reduce the overall impact of the MW on
poverty, the direct impact considered in the baseline scenario can be viewed as an upper
bound. Further details about the microsimulation are in Technical Appendix A.

 A. A micro-simulation of direct effects on poverty

14. The micro-simulation is based on the latest wave of the EU-SILC database, a
household survey carried out by Eurostat. After data cleaning, excluding six countries that
do not have a MW (so that we cannot simulate the effects of introducing the EMW as
explained below) and excluding five countries that have a MW above the EMW (so that there
would be no increase in the MW), the resulting dataset has around 106,814 observations from
16 EU member states. The sample size ranges from less than 4,000 observations in Malta to
around 10,000 observations for Germany. The data provide rich and nationally representative
household- and worker-level information on earnings and type of employment. Because the
latest available round of the survey is for 2016, the data do not reflect more recent changes in
MWs, which are sizable in a few countries (e.g., Spain). Using these data, we describe the
status quo in each country in 2016 and simulate the effects of relative harmonization of the
MW to 60 percent of the median (EMW).

15. Based on 2016 data, the EMW
would require the largest MW increases Minimum Wage and Possible Scenario
in the Czech Republic (in percent) and 600 60
 Difference in current and new minimum wage
the Netherlands (in nominal terms). In 500 Percent Change 50
the Czech Republic the increase would 400 40
have been almost 50 percent and in the

 Percent Change
 300 30
Netherlands some 30 percent (almost 500
 Euro

 200 20
euro per month). In other countries 100 10
including France, Hungary, Portugal, 0 0
Poland, and Romania, there would have -100 -10
been no increases as the current MW was -200 -20
already at or slightly above the EMW
 POL
 HUN

 CZE
 SVK
 SVN

 IRL
 PRT

 LUX
 GRC
 LTU

 MLT
 BEL
 ESP

 EST
 DEU
 FRA

 BGR

 LVA

 NLD
 HRV
 ROU

threshold in 2016. In the simulation we Sources: Eurostat; EUSILC; and IMF Staff Calculations.
omit these countries as we assume that the
national MW would not decrease as a result of the introduction of the EMW.

16. The direct effects of the EMW on poverty depend crucially on household
composition. Not all poor households have members working at or close to the MW, as their
adult members may be pensioners (as is often the case in Greece), unemployed, or out of the
labor force (as is common in Romania and Hungary). Some workers in poor households may
earn a relatively high hourly wage but work only part-time or intermittently. Indeed, in our
data the share of poor households without any low-wage workers ranges from a low of 56
percent in Luxembourg to a high of almost 91 percent in Croatia. Conversely, individuals
12

 working at or close to the MW may not be in poverty, as they may be students or secondary
 earners in non-poor households. The share of non-poor households that would benefit from
 the EMW ranges from a low of about 5 percent in Greece to as high as 18 percent in Estonia.

Poor Household Not Affected by Minimum Wage Change Not Poor Household Affected by Minimum Wage Change
(Percent) (Percent)
100 20
 Poor household not affected by MW Change Not poor household affected by MW change
 90 18
 80 16
 70 14
 60 12
 50 10
 40 8
 30 6
 20 4
 10 2
 0 0

 CZE
 SVK

 SVN
 CZE

 IRL
 LUX
 SVN

 SVK

 GRC

 MLT
 IRL

 BEL

 LTU

 ESP

 EST
 LUX

 DEU
 EST

 ESP

 LTU

 MLT

 GRC
 BEL
 DEU

 BGR

 LVA
 NLD
 BGR

 LVA

 NLD

 HRV
 HRV
 Sources: Eurostat; EUSILC; and IMF Staff Calculations. Sources: Eurostat; EUSILC; and IMF Staff Calculations.

 17. A key assumption in the simulation is the effect of the EMW on wages below the
 current MW. The data show that there are many workers earning less than the MW. This
 may reflect measurement error in the data, but also exemptions to the applicability of the
 MW or lack of compliance. How will these workers be affected by the hypothetical EMW?
 Will their earnings be bid up and, if so, by how much? The introduction of an EMW may
 also be accompanied by broader eligibility rules or tighter enforcement, resulting in more
 low-wage workers being brought under MW regulation. In the simulation, we assume that
 the MW perimeter remains constant and workers earning less than the MW experience the
 same proportional wage increase as workers earning the MW. In other words, if EU
 harmonization results in a 10 percent increase in the MW, all workers earning the MW or
 less will be assumed to receive a wage increase of 10 percent. 13 This may appear somewhat
 optimistic but is in line with the intention of building a baseline simulation that is an upper
 bound of any poverty-reducing effects of the EMW. 14

 18. Another key assumption is how the EMW affects wages higher up in the wage
 distribution. As the MW is increased, workers earning above but close to the EMW are

 13
 This assumption implies that we cannot calculate the effect of the EMW on poverty in countries that do not
 currently have a MW. These countries are excluded from the simulation.

 14
 If the wages of all workers earning below the MW were brought up to the new EMW level, the effect on
 poverty would be much stronger. However, this would necessitate additional policy changes, such as improving
 enforcement or closing legal loopholes. More broadly, policy changes that broaden the perimeter of
 applicability of the MW could have important effects on poverty. We do not examine these policies in this
 paper.

 (continued…)
13

likely to demand higher wages to maintain some of the wage differentiation that existed
before. To the extent that these workers are in poor households, these wage spillovers may
strengthen the beneficial impact of the EMW on poverty. In the baseline scenario, we assume
– somewhat arbitrarily – that the wage of workers earning up to 75 percent of the median
wage is affected by the introduction of the hypothetical EMW, and that the size of this effect
decreases linearly and eventually reaches zero. 15

19. According to the baseline simulation, the direct effect of the EMW would be to
lift the average income of poor households but the effect on the poverty rate would be
relatively modest. The EMW would result in increases of average nominal incomes of poor
households that varies across
 MW Increase and Poor Household Income
countries, reflecting differences in (Percent change)
the increase in the MW and in 7

 Change in Average Income of Poor HHs
 EST
household composition. The largest 6
increase would be in Estonia, where
 5
a MW increase of 34 percent would LUX CZE
 4
translate into an average increase in ESP
 3 LVA MLT
the income of poor households of 6 DEU NLD
percent implying an elasticity of 2 GRC BEL
 IRL
0.18. The increase in incomes may
 16 SVN
 1 BGR
 SVK HRV
not be sufficient to lift households LTU
 0
above the poverty income 0 10 20 30 40 50
 Change in Minimum Wage
thresholds. Indeed, the poverty rate
would fall by 1.3 percentage point Sources: Eurostat; EUSILC; and IMF Staff Calculations.

in Estonia and less in the remaining countries, with an average reduction of 0.5 percentage
points. To put these numbers in perspective, in the chart below we compare them with the
range of the changes in poverty rates observed in the years around the Global Financial Crisis
(GFC). Relative to this range, the decrease in poverty would be the largest in Estonia,
whereas it would be relatively low in Greece. The decline in poverty in each country is not
strongly correlated with the size of the increase in the minimum wage but it positively
correlated with the share of primary earners who earn the MW.

15
 In the next section we examine how changes in the MW affect average wages.

16
 The average elasticity of poor households’ income to the increase in the minimum wage across all countries is
smaller at 0.12. The results suggest that Belgium has the smallest elasticity (0.07), whereas Luxembourg has the
largest elasticity (0.27).
14

 Changes in Poverty Rate EMW Effects and 2007–13 Changes in Poverty Rate
 (Percentage points) (Percentage points)

 0.3 10 100
 Increase in poverty between 2007 and 2013
 Constant Perimeter (Baseline Scenario) Average
 0.1 9 90
 Change in poverty rate under baseline scenario / Change in poverty rate
 -0.1 8 (2007-2013) 80
 -0.3 7 70
 -0.5 6 60
 -0.7 5 50
 -0.9 4 40
 -1.1 3 30
 -1.3 2 20
 -1.5 1 10
 CZE

 SVN

 SVK
 IRL
 LUX

 MLT

 GRC
 EST

 ESP

 BEL

 LTU
 DEU

 LVA
 NLD

 BGR
 HRV
 0 0
Sources: Eurostat; EUSILC; and IMF Staff Calculations. GRC IRL SVN MLT ESP LUX EST
Note: Both scenarios included wage spillovers up to 75% of median wage. Sources: Eurostat; EUSILC; and IMF Staff Calculations.

 20. The EMW would reduce in-work poverty more sharply than overall poverty.
 While the MW may not be the ideal instrument to address poverty in general, it may be more
 effective in limiting poverty among individuals who work. In-work poverty is defined as the
 fraction of individuals working full time in dependent employment living in poor households.
 The level of in-work poverty varies across European countries, from merely 4 percent in
 Czech Republic to 15 percent in Luxembourg. Not surprisingly, the EMW would lower
 household poverty more in countries with high levels of in-work poverty. For instance, in
 Spain the decline in in-work poverty in the baseline microsimulation is twice as large as the
 decline in overall poverty.

 B. Indirect effects

 21. The dis-employment effects of a higher MW would curb the positive direct effect
 on poverty. While several studies argue that MW increases do not have major adverse
 employment effects, the question remains open in the academic literature, especially in the
 case of large MW changes. The magnitude of the elasticity of employment with respect to
 changes in the MW is crucial in assessing the ultimate effect on poverty: if workers lose their
 Minimum Wage and Reduction in Poverty Household and In-work Poverty Reduction
 (Percent) (Percent of total number of workers)
 0.5 25
 In-work Household Household Poverty Reduction in Household Poverty
 0 In-work Poverty Reduction in In-work Poverty
 20
 -0.5

 15
 -1

 -1.5 10

 -2
 5
 -2.5
 CZE

 SVN

 SVK
 IRL
 LUX

 MLT

 GRC
 EST

 ESP

 BEL

 LTU
 DEU

 LVA
 NLD

 BGR

 HRV

 0
 CZE

 SVK

 SVN

 IRL

 LUX
 MLT

 GRC
 BEL

 EST

 LTU

 ESP
 DEU

 LVA
 NLD

 BGR

 HRV

 Sources: Eurostat; EUSILC; and IMF Staff Calculations.
 Note: Minimum wage increased to 60 percent of median wage.
 Counterfactual poverty rates are computed based on the constant perimeter scenario. Sources: Eurostat; EUSILC; IMF Staff Calculations.
15

jobs or experience a reduction in hours worked because of the higher MW, then they may
become poor or not exit poverty, possibly undermining the improvement in the poverty rate
from the direct effect of the EMW.

22. Accounting for dis-employment effects in our simulations is fraught with
uncertainty. The employment elasticity may differ between the short and long term, across
workers of different age and across countries. In addition, the elasticity itself may be a
function of the magnitude of the increase in the MW (CBO, 2019) and vary based on the
structure of the labor market. Studies using data from individual EU countries may therefore
not necessarily be representative of other EU countries. 17 As an illustration of the potential
impact of loss of employment on poverty, we conduct a simulation using 0.25 as the
employment elasticity (i.e., a 10 percent increase in the minimum wage leads to a 2.5 percent
higher probability of becoming unemployed for workers whose wage increases when the
EMW is introduced) which is the median value short-term elasticity in the U.S. literature as
reported by CBO (2019). 18 In our sample, using this employment elasticity, the average
decline in poverty shrinks substantially, from 0.5 in our baseline scenario to 0.1 percentage
points. In addition, the simulation suggests that the higher MW would actually increase the
poverty rate in some countries (the Czech Republic, Malta, Lithuania, and the Netherlands).
However, other employment elasticities could substantially change these results, and
unemployment benefits or other social insurance benefits targeted to those workers who
might lose their jobs could partially mitigate the effects on their household income.

23. A higher MW may increase prices, thus reducing the gains in real income and
purchasing power of the higher nominal MW. To “pay” for the MW, firms must accept
lower profits, find ways to increase productivity, economize on other costs, or raise prices,
thus passing on the cost to consumers. In the latter case, if poor households
disproportionately purchase the goods and services produced by sectors that make more
intensive use of MW workers (e.g., fast food meals in the U.S.), then the beneficial effects of
the higher MW on poverty may be eroded (MaCurdy, 2015). Quantifying this effect is
extremely difficult and requires very detailed data on both households and firms, and we do
not attempt it in this paper. A recent study on Hungary (Harasztosi and Lindner, 2019) finds
that some 75 percent of the cost of the MW was passed on to consumers while 25 percent

17
 Examples of studies examining the employment effects of minimum wages include Ahlfeldt et al. (2018)
(Germany), Heemskerk et al. (2018) (Romania), and Harasztosi and Lindner (2019) (Hungary). The estimated
elasticities vary across countries (between 0 and 0.5), possibly reflecting heterogenous characteristics ranging
from labor market institutions to the level of corporate profitability.

18
 CBO (2019) surveys 11 recent U.S.-focused papers that estimate employment elasticities for all directly
affected workers. Insofar as adverse employment effects could depend on the MW level, the US estimates could
be on the lower end of equivalent elasticities in European countries, Harasztosi and Lindner (2019) find an
employment elasticity for Hungary that is similar in order of magnitude to the short-term median value that
CBO (2019) reports. The CBO median estimated elasticity for the longer term is 1.5, substantially above the
short-term elasticity, and one order of magnitude above the 0.15 estimate for Hungary by Harasztosi and
Lindner (2019).
16

was absorbed by lower profits, with the pass-through to prices stronger in sectors more
sheltered from competition, such as nontraded services (see also Draca, Machin, and Van
Reenen, 2011). More generally, IMF (2019c) documents that the general pass-through from
wages to prices has slowed down in Europe in recent years, particularly in sectors more
exposed to international competition, suggesting that wage increases (including possibly
those from higher MWs) may be absorbed through other cost reduction or declines in profits,
thus preserving real income gains for workers.

24. A higher MW may cause some poor households to lose means-tested social
insurance benefits, further eroding the direct effect on poverty. As for price effects, a
quantification of this indirect effect, which depends on the complex details of social
insurance programs in each country, is beyond the scope of this paper, but its impact could be
substantial as many EU countries have comprehensive means-tested social insurance
systems. On the other hand, reducing reliance on social insurance benefits by raising the
earnings of low-income workers may be a desirable policy goals in and of itself and would
help the fiscal accounts.

25. Finally, a higher MW may increase non-compliance or the use of legal loopholes,
resulting in a reduced MW perimeter. Empirical evidence suggests that as the MW
becomes more binding employers increasingly find ways to avoid the regulation (Carpio and
Pabon, 2017). This may be done by overreporting wage payments or underreporting hours
worked, or simply employing workers informally. An increase in informality or contract
work would hurt workers as they would lose the broad benefits and protections of a regular
work contract in addition to receiving a lower wage. As the MW becomes more binding,
countries need to strengthen monitoring and enforcement to avoid a rise in circumvention.

26. Given that increasing the MW has relatively limited effects on poverty, the
merits of alternative instruments could be explored. These include measures that increase
access to better-paid jobs and expand human capital such as job training and life-long
learning programs, as well as well-targeted social benefits for the most vulnerable
households. Providing in-work tax credits is another fiscal policy tool that supports the
incomes of the working-poor while simultaneously incentivizing employment. However, like
the MW, such a scheme does not support incomes of poor households that are outside of the
labor force, and employers may capture some of the benefits associated with tax credits (see
IMF, 2017b, for details).

 IV. EFFECTS ON REBALANCING WITHIN THE EURO AREA

While the primary purpose of an EMW would not be to address long-standing intra euro
area macroeconomic imbalances, the policy, by affecting labor costs differentially, would
likely have an effect on those imbalances. In this section we explore how a hypothetical EMW
may change relative unit labor costs, real exchange rates, and current account balances
within the euro area.
17

 A. External imbalances within the euro area have been long-lasting

27. The persistence of sizable external sector imbalances within the euro area has
been widely acknowledged and is often attributed to a lack of policy instruments within
the monetary union.19 Within the monetary union, real exchange rate adjustment cannot
occur through changes in the nominal exchange rate but must rely on differential price
movements, which may be slow to take place, especially in a low-inflation environment. In
addition, the absence of a common or coordinated fiscal policy makes it difficult to swiftly
restore external sector balances through that instrument. Since the introduction of the euro,
two groups of countries have emerged: those with persistently-elevated net positive
international investment positions (creditors) and those with net negative positions (debtors).
After the global financial crisis, debtor countries turned their current account deficits into
surpluses, often through a painful process of deleveraging by households, corporations, and
the public sector, accompanied with high structural unemployment and low wage growth. In
contrast, creditor countries saw their external position strengthen further, reflecting limited
wage and unit labor cost pressures and relatively weak domestic demand. Thus, the
rebalancing process has been asymmetric and has relied more on demand compression than
relative price adjustment. All in all, while intra-euro area imbalances have declined, they
remain large and the bloc posts a sizeable surplus vis-à-vis the rest of the world (IMF,
2019a).

 Euro Area Current Account Balance and ULC-Based Real Effective Exchange Rate
 4 130
 Current Account Balance ULC-Based REER
 Index, 2000=100 (+=appreciation)

 3
Percent of Euro area GDP

 120
 2

 1
 110
 0

 -1 100

U -2
 All Creditors Debtors Others Creditors Debtors Debtors excl. Italy
 -3 90
 2000 2003 2006 2009 2012 2015 2018 2000 2003 2006 2009 2012 2015 2018
Source: Box 1.3, IMF 2019 External Sector Report.
Note: Creditor countries include Austria, Belgium, Finland, Germany, and the Netherlands. Debtors include Greece, France, Ireland, Italy, Portugal, and Spain.

28. Stronger wage growth could speed up external adjustment in surplus countries
while reducing the burden on deficit countries. In large creditor countries, wages and ULC
started to accelerate in the last couple of years as output and unemployment gaps closed and
became positive, but the pace of adjustment has been modest and the effect on CA surpluses
limited so far. Against this backdrop, the IMF has repeatedly called for a healthy rebalancing
in the euro area as a two-way street: countries with large external surpluses should allow

19
 For example, see ECB (2012), Pierluigi and Sondermann (2018), IMF (2012, 2019).
18

wage competitiveness to adjust and domestic demand to strengthen including via higher
wage growth while deficit countries should pursue reforms that help contain labor cost while
boosting labor productivity. 20 How might an EMW affect this process? In a nutshell, if larger
MW increases translate in downward adjustments in external competitiveness in countries
with an external position that is too strong and vice versa, then the EMW might help reduce
imbalances within the EA. The next section explores this question (additional details are in
Technical Appendix B).

29. Countries with the largest gap to a minimum wage of 60 percent of the median
wage tend to have large CA gaps and an undervalued REER. Current account and REER
gaps are taken from IMF’s External Sector Report (ESR), which assesses gaps from “levels
consistent with long-term fundamentals and desirable policy settings.” 21 For the current
account, a positive (negative) gap corresponds to an external position that is too strong
(weak). For the REER, a positive (negative) gap indicates that the REER is overvalued
(undervalued). The minimum wage gaps to the hypothetical EMW are computed based on
the latest available data, so they differ somewhat from those used in the micro-simulation,
which referred to 2016. 22 Based on these data and on the latest ESR assessment, Germany,
for example, would need to increase its Kaitz

20
 For example, see IMF 2019 AIV reports for Germany, Netherlands, Portugal and Greece.

21
 The methodology to assess gaps combines model outputs and staff country team judgement. For more details
on the External Balance Assessment (EBA) model, see Cubeddu et al (2019).

22
 Throughout this section, the main data source for the Kaitz ratio is the OECD, which publishes the ratio until
2018, with a few exceptions. Given the large minimum wage increase in Spain in 2019, we estimate its latest
Kaitz ratio using information from the country team. For Malta, we compute the comparable minimum wage
ratio series using information from Eurostat. For a few countries where there is no statutory minimum wage, we
compute an equivalent ratio from sectoral minima combining information by country teams and from Garnero
(2015) for Italy, and Garnero et al. (2014) for Austria, Finland, and Cyprus.
19

ratio by 14½ percentage points, while its CA gap is assessed at 4½ percent. On the other
hand, some countries that are already at or above the 60 percent threshold (France and
Portugal) and hence would see no MW change are among the countries that need to
strengthen their external position.

Interactions between minimum wages, competitiveness, and rebalancing: a simple
framework

30. To explore the effects of minimum wages on intra-euro area imbalances we
proceed in three steps. First, using panel data and a reduced-form local-projections
empirical model we seek to establish how past changes in the minimum wage in EA
countries affected average wages, unit labor costs, and real exchange rates (REERs) in the
short and medium run. Second, using the coefficients estimated in the first step, we compute
the hypothetical changes in competitiveness (ULC-based REERs and CPI-based REERs)
within the EA in a scenario in which all countries raise their current minimum wage to 60

percent of the median wage. Movements in competitiveness reflect both changes in the
country’s own labor costs and changes in the labor costs of EA trading partners. In the third
step, we map changes in competitiveness into changes in current account balances.

An EU minimum wage may help reduce large external surpluses, but may create new
imbalances or worsen existing ones in a few countries

31. Regression results show that higher minimum wages lead to significantly higher
labor costs in the short and medium term. The local projection estimates show that higher
minimum wages tend to be associated with rising ULCs and the impact mainly comes from
higher average wages (rather than lower productivity) in the short run. The rise in the
minimum wage is also associated with a commensurate appreciation of various REER
measures of external competitiveness (ULC-based REER, CPI-based REER).
20

32. The coordinated minimum wage increases would help adjust competitiveness in
countries with an excessively strong external position, while for countries that need to
gain competitiveness the picture is mixed. 23 For the former group, the REER appreciation
is the result of relatively larger MW gaps to the 60 percent threshold (i.e. own countries’
contributions), despite somewhat low shares of trade within the EA (41 percent of their total
trade). The implied medium-term Estimated Medium-term Impacts of Coordinated
cumulative REER appreciations in surplus Minimum Wages on ULC-based Real Effective Exchange Rates
 20
countries is around 5 percent on average Surplus Deficit

 Changes in ULC-based REERs (Percent)
 EST
 15

 REER Appreciation
(or between 1-2 standard deviations of the DEU
 10 BEL
observed medium-term historical changes IRL
 NLD GRC
 5 MLT ESP
in the REER). Among countries that need SVK
 0 LTU LVA LUX
to depreciate the REER, some would CYP
 AUT ITA
 -5 SVN
benefit from higher minimum wages in FIN
 -10 FRA PRT
their EA trading partners (France, Italy, Undervalued REER y = -0.5596x + 2.5561
 -15
Portugal) whereas others would -15 -10 -5 0 5 10 15
experience a further deterioration in Staff-assessed REER gap, 2018 or latest (Percent)
 Sources: IMF Staff Calculations.
external competitiveness because their Note: Changes in ULC-based REERs are cumulative impacts over five years. Bubble size indicates own
 country's contribution to REER adjustment. Staff-assessed REER gap is based on country team's estimate.
own MW would need to rise (Spain,
Greece and Belgium). The loss in competitiveness appears particularly sizeable for Belgium,
at around 2 standard deviations of its past REER changes.

33. The EMW would result in some rebalancing of external positions within the EA,
primarily driven by adjustments in key surplus countries, but with a worsening position
in several deficit countries. 24 In line with Estimated Medium-term Impacts of Coordinated Minimum
the changes in REERs outlined above, for Wages on Current Account
 8
most surplus countries CA gaps would be Impact of coordinated EMW on CA balance (% of GDP)
 Current account gap (Percent of GDP)

 6
 Staff-assessed CA gap
substantially lowered, particularly in 4 Resulting CA gap
Germany, the Netherlands, and Estonia. 2
The magnitude of these medium-term 0

cumulative CA adjustments, of around 2 -2
 -4
percentage points of GDP on average, is
 -6
in line with past experience (or between 1 -8
 SVK

 SVN
 IRL
 PRT

 LUX
 GRC
 BEL

 ESP

 LTU
 MLT

 EST
 ITA
 AUT

 DEU
 CYP

 FIN

 FRA

 LVA

 NLD

and 2 standard deviations of medium-term
changes in the current account). Deficit Surplus
 Sources: IMF Staff Calculations.
Meanwhile, the coordinated minimum Note: Changes in ULC-based REERs are cumulative impacts over five years. Staff-assessed CA gap is based on
 country team's estimate.

23
 These results are robust to various alterations of the framework, including allowing for the heterogeneity in
wage CPI inflation passthrough, or using global value chain (GVC) trade weights in REER decompositions (see
Technical Appendix B).

24
 CA-REER elasticities are country-specific and taken from staff’s External Sector Assessment in IMF country
reports and/or the IMF External Sector Report (IMF, 2019a). This choice is crucial as the degree of
responsiveness of the current account to fluctuations in the REER clearly depends on several country-specific
factors.
21

wage policy could help reduce the Coordinated Minimum Wages and External Imbalances
negative current account gap for only a 2

few deficit countries (Cyprus, 1.5

 (Percent of Euro area GDP)
 Current account gap
Portugal, France, and Italy), some of 1
which are already above the 60 percent 0.5
threshold. However, among the deficit
 0
countries, Spain, Belgium, and Greece
 -0.5
have relatively large negative current Staff-assessed CA gap Estimated resulting CA gap
 -1
account gaps, while their minimum Deficit Surplus Debtors Creditors
wages are currently nearly 50 percent Current account assessment NIIP
of the median wage. Therefore, the Sources: IMF Staff Calculations.
 Note: Estimated resulting CA gaps are cumulative impacts over five years. Staff-assessed CA gap is based on
EMW would worsen their external country team's estimate.

position further, according to the
simulation. Also, both Slovakia and Ireland (two countries with minor imbalances) would
experience a deterioration of their external position. All in all, about 85 percent of the
rebalancing would come from adjustments by the surplus countries or net creditor countries.

 B. Notes of caution

34. This empirical framework has several limitations, which suggest that the results
should be taken with caution. The impact of a change in the minimum wage on average
labor costs is estimated with a reduced-form regression, which always gives rise to questions
about omitted variables, potential endogeneity bias, and robustness. 25 While we address these
concerns in various ways, we acknowledge that they cannot be fully dispelled. In addition,
the link between changes in relative ULCs and CA imbalances relies on elasticities also
derived from reduced-form estimates. As such, they may fail to capture important general
equilibrium effects that only a full model simulation can deal with. In addition, we ignore
changes in wages and ULCs in non-EA EU trading partners, even though in some of these
countries wages would change as a result of MW harmonization. The impact of these
changes on EA-trading partner REERs depends on changes in the nominal exchange rate and

25
 In the regression specifications we control for cyclical conditions (with the output gap, labor force
participation rate, inflation, and growth expectations) and for structural characteristics of countries which
should determine the degree of cost-competitiveness of a country (the degree of trade openness, the share of the
industrial sector, or the timing of euro adoption). To address the endogeneity bias, we use instrumental variables
and choose as instruments political variables that should be strongly correlated with the likelihood of an
increase in minimum wages but not with ULCs dynamics. These variables are: the largest government party
orientation (left, center, or right), the number of years left in current executive term, and the vote share of
largest government party. Our identification strategy assumes that there is no a priori reason for these political
variables to directly determine ULCs, but they have an important effect on the likelihood of an increase in the
MW ratio. We have tested the robustness of our findings to alternative specifications and methods. For
example, to address the bias arising from the denominator in the Kaitz index, we have replaced the Kaitz index
in the regressions with the nominal wage variable in euros. In another robustness check, we include the size of
the low-pay sector as an interaction term. The results are robust to these changes in the main specification, see
Technical Appendix B for details.
22

would therefore require a more sophisticated analytical framework. Despite these limitations,
we believe that the exercise provides useful insights.

35. The simulations may not fully account for the risk of reduced MW compliance
ex post and other factors. The estimated empirical relationship between MW changes and
ULC changes should in principle take into account changes in MW compliance. However,
possible non-linearities may mean that the
large minimum wage increases required to
reach the EMW threshold in a few
countries might affect compliance more
strongly than past MW changes would
suggest, implying a smaller effect of the
MW on ULCs, competitiveness, and
rebalancing. Where structural
unemployment is high (Greece and Spain),
compliance with a higher MW may be
difficult as many workers might accept
sub-minimum wages to find a job. In
addition, the simulation may underestimate
the impact of introducing a statutory MW in countries without one but where sectoral minima
are relatively high. In these countries, the statutory MW may not raise the wage of workers
under the sectoral minima but may raise wages for workers outside these sectors. This effect
is not reflected in the simulations. The simulations also do not reflect the effect on
competitiveness of MW increases in non-euro area EU trading partners.

36. The simulations may overestimate the wage-inflation pass-through and hence
the effect of relative wage movement on the real exchange rate. On the one hand, a
generalized MW increase across the EU might be expected to generate a positive inflation
shock. On the other hand, as discussed in the first section, wage and price inflation in Europe
have been diverging in recent years, which has translated into diverging price- vs. ULC-
based REER movements. The pass-through is likely to be lower for surplus countries which
tend to have a higher corporate profit share (Boranova et al, 2019, and IMF, 2019c). The
coefficients used in the simulations to convert ULC-based REER changes into CPI-based
REER changes are based on historical data and thus may overestimate the pass-through in the
current environment. If this is the case, then changes in relative ULCs would not translate in
the changes in relative prices needed to bring about the “expenditure switching” necessary to
adjust the CA. On the other hand, the simulations do not take into account effects on
aggregate savings and investment that do not occur through the real exchange rate. For
instance, a higher MW that is not passed through to prices would likely redistributes income
toward lower income households, which would reduce aggregate savings and the CA. At the
same time, lower corporate profits may result in lower investment, which would tend to
increase the CA surplus.
You can also read