Summary Progress Update 2021: SDG 6 - water and sanitation for all - UN-Water

Page created by Shawn Martin
 
CONTINUE READING
Summary Progress Update 2021: SDG 6 - water and sanitation for all - UN-Water
Summary
          Progress
     Update 2021:
SDG 6 — water and
  sanitation for all
            J U LY 2 0 21
Summary Progress Update 2021: SDG 6 - water and sanitation for all - UN-Water
This document is published by UN-Water. The user is encouraged
to cite UN-Water as the source when referring to the document.

The production of this document was coordinated by the
UN-Water Integrated Monitoring Initiative for SDG 6 (IMI-
SDG6), including United Nations Environment Programme
(UNEP), United Nations Human Settlements Programme
(UN-Habitat), United Nations Children’s Fund (UNICEF),
Food and Agriculture Organization of the United Nations
(FAO), United Nations Economic Commission for Europe
(UNECE) and United Nations Educational, Scientific and
Cultural Organization (UNESCO), World Health Organization
(WHO) and World Meteorological Organization (WMO).

Date of publication: July 2021.

Suggested citation: UN-Water, 2021: Summary
Progress Update 2021 – SDG 6 – water and sanitation
for all. Version: July 2021. Geneva, Switzerland.

Map disclaimer: The designations employed and the
presentation of material on these maps do not imply the
expression of any opinion whatsoever on the part of the United
Nations concerning the legal status of any country, territory, city
or area or of its authorities, or concerning the delimitation of its
frontiers or boundaries. Dotted line represents approximately the
Line of Control in Jammu and Kashmir agreed upon by India and
Pakistan. The final status of Jammu and Kashmir has not been
agreed upon by the parties. Final boundary between the Republic
of Sudan and the Republic of South Sudan has not yet been
determined. Final status of the Abyei area is not yet determined.
A dispute exists between the Governments of Argentina and
the United Kingdom of Great Britain and Northern Ireland
concerning the sovereignty over the Falkland Islands (Malvinas).

We gratefully acknowledge the contributions to the UN-Water
Inter-Agency Trust Fund from the following entities:
Summary Progress Update 2021: SDG 6 - water and sanitation for all - UN-Water
SDG 6 is to ensure availability and sustainable management of water and sanitation for all by 2030. Photo credit: UN Photo/Marie
Frechon.
Summary Progress Update 2021: SDG 6 - water and sanitation for all - UN-Water
Foreword

    Even before COVID-19 struck, the world was         For national action to be effective, it needs
    off track to meet Sustainable Development          to include all parts of society. Everyone has
    Goal 6 (SDG 6) – the goal of ensuring water        a role to play. Dramatic gains in water and
    and sanitation for all by 2030. As you will        sanitation are possible when governments,
    see in this summary progress report, billions      civil society, business, academia and
    of people worldwide still live without safely      development aid agencies pull together.
    managed drinking water and sanitation,             And it will be essential to scale up this
    even though both services have long been           cooperation across countries and regions.
    defined as human rights. Many water sources
    are drying up, becoming more polluted, or          Last year (2020), we launched the SDG 6
    both. Water-intensive industry, agriculture        Global Acceleration Framework, with the
    and energy generation are growing to meet          full backing of the United Nations family,
    the needs of an expanding population.              to mobilize action across governments,
                                                       civil society, the private sector and the UN
    Land is under greater pressure and ecosystems      to better align efforts, optimize financing
    that provide water are disappearing. On top        and enhance capacity and governance.
    of this, climate change is making water more
                                                       Making sure that there is water and sanitation
    scarce and unpredictable, wreaking havoc and
                                                       for all people, for all purposes, by 2030 will help
    displacing millions of people. This report shows
                                                       future-proof global society against the many
    that we need to do more, much more quickly.
                                                       and varied threats coming down the line. Our
    Achieving SDG 6 is a national responsibility.      immediate, shared task is to establish safe
    More than anything, politicians and                water and sanitation services in homes, schools,
    policymakers at the national level need to         workplaces and health care facilities. We must
    set bolder priorities. We must make sure           increase investment in water-use efficiency,
    that decision makers are clear about the           wastewater treatment, and reuse, while financing
    economic case: when we invest in water it          the protection of water-related ecosystems.
    has a catalytic effect on other areas such as      And we must integrate our approaches,
    health, education, agriculture and job creation.   with improved governance and coordination
                                                       across sectors and geographical borders.

1   SUMMARY PROGRESS UPDATE 2021 – SDG 6 – WATER AND SANITATION FOR ALL
Summary Progress Update 2021: SDG 6 - water and sanitation for all - UN-Water
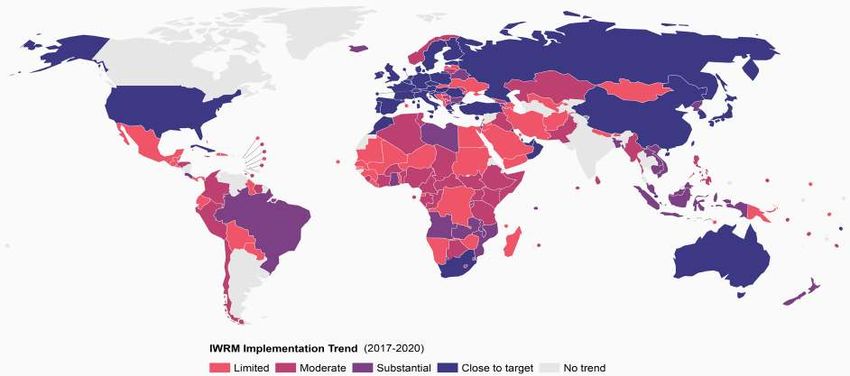
This summary progress report makes an
important contribution to one of the five
accelerators in the SDG 6 Global Acceleration
Framework: improving data and information.
Based on the latest available data for many
indicators compiled during last year’s 2020 Data
Drive, this document will help base decision-
making on reliable and up-to-date evidence
to ensure the greatest possible gains.

The economic case for achieving SDG 6 is well
known and beyond question. Ours is a battle
for human health, dignity and opportunity.

Thank you for reading this document and
for joining this critical effort. The COVID-19
pandemic reminds us of our shared vulnerability
and common destiny. Let us “build back better”
by ensuring water and sanitation for all by 2030.

Gilbert F. Houngbo
UN-Water Chair and President of the International
Fund for Agricultural Development

                                 SUMMARY PROGRESS UPDATE 2021 – SDG 6 – WATER AND SANITATION FOR ALL   2
Summary Progress Update 2021: SDG 6 - water and sanitation for all - UN-Water
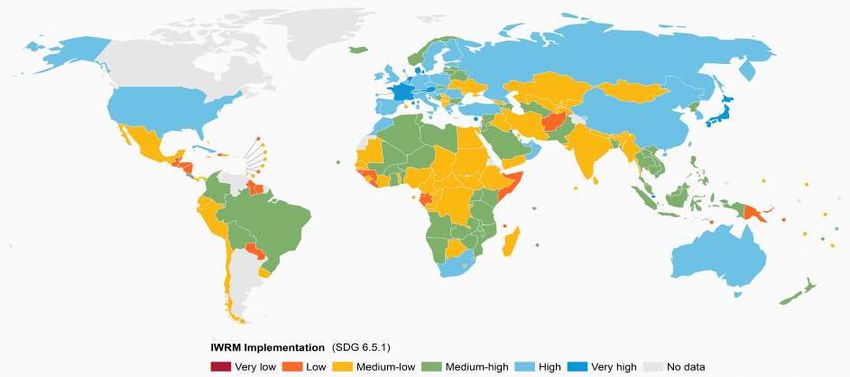
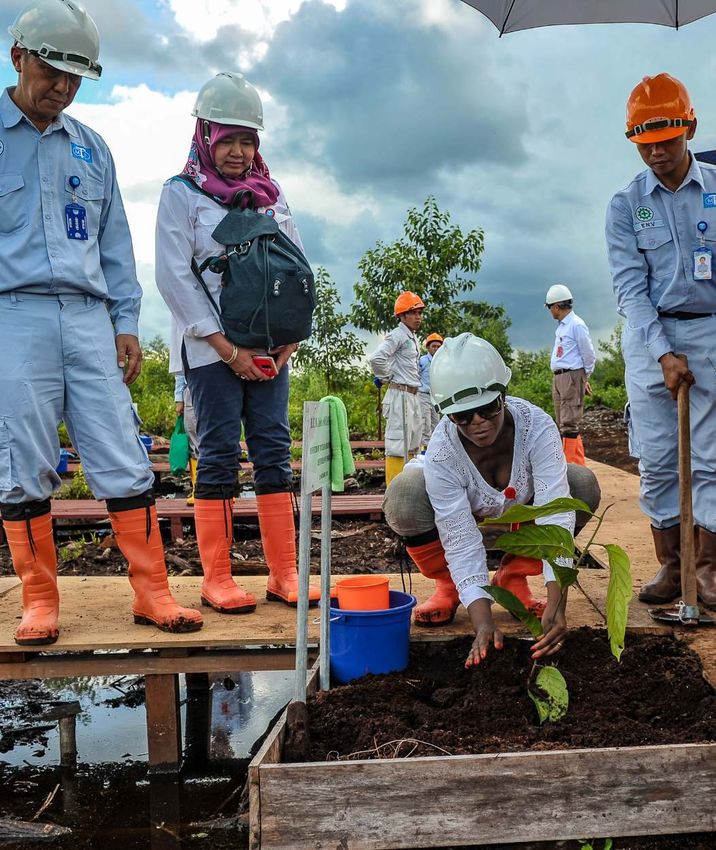
Everyone has a role to play in ensuring sustainable water and sanitation for all. Photo credit: Ricky Martin/CIFOR, Creative
Commons Attribution.

   3   SUMMARY PROGRESS UPDATE 2021 – SDG 6 – WATER AND SANITATION FOR ALL
Introduction

   SDG 6 is to ensure                                  The effects of climate change are often
                                                       seen in changes in water availability, such
   availability and sustainable
                                                       as increasing water scarcity in some regions
   management of water and
                                                       and flooding in others. Consequently, water
   sanitation for all by 2030                          is a key factor in managing risks related
                                                       to famine, disease epidemics, migration,
SDG 6 is critical to sustainable development.
                                                       inequalities within and between countries,
Safe drinking water and sanitation are human
                                                       political instability and natural disasters. With
rights. Access to these services, including water
                                                       limited water resources, it is important to fairly
and soap for handwashing, is fundamental to
                                                       balance the water requirements of society,
human health and well-being. They are essential
                                                       the economy and the environment. Also, most
to improving nutrition, preventing disease and
                                                       of the world’s water resources are shared
enabling health care, as well as to ensuring the
                                                       between two or more countries. As such,
functioning of schools, workplaces and political
                                                       the development and management of water
institutions and the full participation in society
                                                       resources has an impact across transboundary
of women, girls and marginalized groups.
                                                       basins, making cooperation essential.
SDG 6, however, goes far beyond water and
                                                       All SDGs are interlinked. As a goal concerning
sanitation services to cover the entire water
                                                       the lifeblood of society and the planet, progress
cycle. Aside from domestic purposes, water
                                                       towards the eight SDG 6 targets has catalytic
is needed across all sectors of society, to
                                                       effects across the entire 2030 Agenda.1
produce food, energy, goods and services.
These uses also generate wastewater
which, if not properly managed, can spread
                                                          We only manage what
diseases, and introduce excess nutrients and
hazardous substances into rivers, lakes and
                                                          we measure
oceans. Ultimately, as ecosystems provide              The monitoring of progress towards SDG 6 is a
water to society, a significant share of the           means to successfully achieving all eight SDG 6
water needs to stay within the ecosystems for          targets. Credible and timely water and sanitation
them to remain healthy. Healthy ecosystems             data provide numerous social, economic, and
in turn safeguard the quantity and quality of          environmental benefits in both public and private
freshwater, as well as overall resilience to           sectors, such as stronger political accountability
human- and environmentally-induced changes.

                                SUMMARY PROGRESS UPDATE 2021 – SDG 6 – WATER AND SANITATION FOR ALL         4
and commitment, as well as public and private      environment) often do not consider the impacts
    investments. It also enables evidence-based        on water availability and water quality in other
    policymaking, regulations, planning and            sectors, and that issues do not receive the
    investments at all levels, to ensure the most      necessary political attention. Funding gaps
    effective deployment of resources. The main        and fragmentation impede progress across
    beneficiaries of better data are countries.        levels, while data and information often are not
                                                       available or not shared between sectors and
    The 2030 Agenda specifies that global              across borders to effectively inform decision-
    follow-up and review “will be primarily based      making. Meanwhile, gaps in institutional and
    on national official data sources”. This report    human capacity, especially at the level of local
    is based on country data, compiled and             governments and water and sanitation providers,
    verified by the responsible United Nations         slows implementation of SDG 6 along with
    organizations, and sometimes complemented          outdated infrastructure and governance models.
    by information from other sources.
                                                       The SDG 6 Global Acceleration Framework,
                                                       launched in 2020, aims to deliver fast results
       Large data gaps still exist                     at an increased scale. The United Nations
                                                       system and its multi-stakeholder partners,
    The average UN Member State has data for
                                                       driven by country demand and coordinating
    about two thirds of the global indicators for
                                                       through UN-Water, will unify the international
    SDG 6; 24 UN Member States have data on less
                                                       community’s support to countries for SDG 6.
    than half of the indicators. While these global
                                                       Action will be driven by five accelerators:
    indicators are effective for communicating
    overall progress, more detailed data are needed
                                                       1.   OPTIMIZED FINANCING – Improved
    for policy- and decision-making and planning
                                                            targeting, better utilization of existing
    at the national and subnational levels. Country
                                                            resources and mobilization of
    focal points say data gaps result from too
                                                            additional domestic and international
    little technical capacity and too few human
                                                            funding will lead to efficient service
    and financial resources. Examples include
                                                            delivery and implementation. Success
    lack of monitoring infrastructure, lack of data
                                                            looks like: Costed plans related to
    management systems, low staff numbers
                                                            delivery of SDG 6 are fully funded.
    and low expertise. Efforts to further increase
    national-level capacity for SDG 6 monitoring by
    developing technical and institutional capacity
                                                       2.   IMPROVED DATA AND INFORMATION – Data
    and infrastructure are urgently needed.
                                                            generation, validation, standardization
                                                            and information exchange will build trust
                                                            so leaders can make informed decisions
       How do we accelerate action?
                                                            and increase accountability. Success
    As identified in the SDG 6 Synthesis Report             looks like: High-quality information on
    2018 on Water and Sanitation, there are several         SDG 6 indicators is shared and easily
    bottlenecks impeding greater progress. Policy           accessible by any decision maker.
    and institutional fragmentation between levels,
    actors and sectors means that decisions taken
    in one sector (e.g. agriculture, energy, health,

5   SUMMARY PROGRESS UPDATE 2021 – SDG 6 – WATER AND SANITATION FOR ALL
1.   CAPACITY DEVELOPMENT – Inclusive
                                                                          LEARN MORE
     human and institutional capacities at all
     levels will enable improved service levels,
                                                       SDG 6 monitoring and reporting: This report
     operating and maintenance technology,
                                                       has been produced by the UN-Water Integrated
     increased job creation in the water sector
                                                       Monitoring Initiative for SDG 6 (IMI-SDG6), which
     and the retaining of a skilled workforce.
                                                       brings together the United Nations organizations
     Success looks like: Skilled staff enhance
                                                       that are formally mandated to compile country
     sustainable implementation of SDG 6.
                                                       data on the SDG 6 global indicators. Through
                                                       IMI-SDG6, the United Nations seeks to support
                                                       countries in monitoring water- and sanitation-
2.   INNOVATION – Innovative practices and
                                                       related issues within the framework of the 2030
     technologies will be leveraged and scaled
                                                       Agenda for Sustainable Development, and in
     up and ultimately lead to improved water
                                                       compiling country data to report on global
     resources and sanitation development and
                                                       progress towards SDG 6. An important part of this
     management. Success looks like: Innovative
                                                       work is to provide standardized methodologies for
     practices and technologies for water and
                                                       monitoring the different indicators, to ensure that
     sanitation are leveraged at the country level.
                                                       data are comparable across countries and over
                                                       time. Learn more about SDG 6 monitoring and
3.   GOVERNANCE – Cross-sector and                     reporting here: www.sdg6monitoring.org
     transboundary collaboration, clear roles,
     stakeholder involvement and effective
                                                       Indicator reports: This report provides an
     and inclusive institutions will make
                                                       executive summary of the 2021 status of
     SDG 6 everyone’s business. Success
                                                       SDG 6, assessed through official country data
     looks like: Efficient mandates for SDG
                                                       on the global indicators for SDG 6. Each indicator
     6 delivery in all sectors are established,
                                                       covers a specific aspect of SDG 6, and to learn
     institutions are strengthened to
                                                       more about the status and progress on each
     deliver and intersectoral coordination
                                                       of these aspects, we invite you to read the full
     mechanisms operate effectively.
                                                       indicator-specific reports. Progress updates on
                                                       most of the indicators will be published in August
                                                       2021, based on country data compiled in 2020.
                                                       Read all reports here: https://www.unwater.org/
                                                       publication_categories/sdg6-progress-reports/

                                                       Latest data: The SDG 6 Data Portal brings
                                                       together data on all the SDG 6 global indicators
                                                       and offers tailored options for visualization and
                                                       analysis. Track overall progress towards SDG 6 at
                                                       the global, regional and national levels here: www.
                                                       sdg6data.org

                                 SUMMARY PROGRESS UPDATE 2021 – SDG 6 – WATER AND SANITATION FOR ALL         6
SUMMARY PROGRESS 2021:
SDG 6 INDICATORS                                                                                                                                              July 2021

6.1.1 DRINKING WATER

           H1_one column:
                 2
                        billion
                      26% of the world’s
                        people                                                          lacked safely managed drinking
                      population                                                        water services in 2020

           max 6 text lines 6.2.1b HYGIENE
           if H1 flows into
6.2.1a SANITATION

         3.6
                                                                                                             billion
                  46%
           text column,
         billion people
                                                                   29%
                                                of the world’s population      2.3                           people
                                                                                                                              of the world’s
                                                                                                                              population

           used when                     lacked a basic handwashing facility
         lacked safely managed sanitation services, and
         494 million people practised open defecation, in 2020
                                         with soap and water at home in 2020

           space is limited
6.3.1 WASTEWATER
                  Globally        44%              of household wastewater is not safely treated

6.3.2 WATER QUALITY
                                                           billion          means that they are at significant risk

                                                     3
                                                  over

The lack of water quality data for                         people           because the health of their rivers, lakes
                                                                            and groundwater is unknown

6.4.1 WATER-USE EFFICIENCY                                                     6.4.2 WATER STRESS

                                                                                                                               billion people
 Since 2015 water-use efficiency has increased by
                                                                                                               2.3                              live in water-stressed
                                                                                                                                                countries

                   9%                             globally                                                      of which 733 million live in high and
                                                                                                                 critically water-stressed countries

6.5.1 INTEGRATED WATER MANAGEMENT                                              6.5.2 TRANSBOUNDARY COOPERATION

                                               are not on track to              Only
                                   countries

               107                             have sustainably
                                                                                                 countries

                                               managed water
                                               resources by 2030

              Globally, the current rate of progress
                                                                                24
                                                                                reported that all the rivers, lakes and aquifers that
                                                                                they share with their neighbours are covered by
              needs to be doubled                                               operational arrangements for cooperation
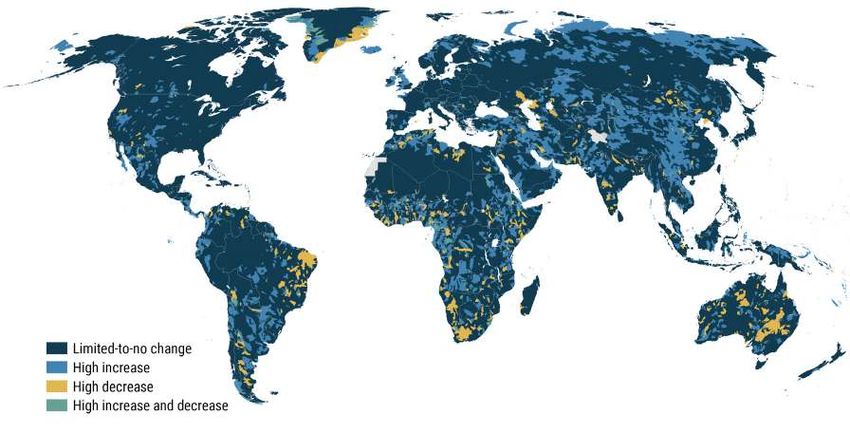
6.6.1 ECOSYSTEMS

                     1/5          of the world’s
                                  river basins
                                                                  are experiencing rapid changes in
                                                                  the area covered by surface waters

6.a.1 INTERNATIONAL COOPERATION                                                6.b.1 PARTICIPATION
             Official development assistance (ODA)
             commitments to the water sector increased                                                                 report having high
                                                                               Only                                    levels of participation
                                                                                                         out of
                                                                                             countries

                9%
                                  from 2015 to 2019,
                                  but disbursements
                                  showed little change                         14 109                                  by communities
                                                                                                                       in water and sanitation
                                                                                                                       decision-making
SDG 6 progress at a glance

The world is not on track to achieve SDG 6.             decades, and many countries withdraw all their
                                                        renewable water resources or even rely on non-
Billions of people worldwide still live without         renewable resources that will eventually run dry.
safely managed drinking water, safely
managed sanitation and basic hygiene                    When it comes to integrated water resources
services, especially in rural areas and least           management (IWRM), the current rate
developed countries; the current rates of               of progress needs to double to meet the
progress need to quadruple in order to reach            global targets, and only two SDG regions
the global target of universal access by 2030.          are on track to have all their transboundary
                                                        water bodies covered by operational
Globally, 44 per cent of all wastewater flows           cooperation agreements by 2030.
generated by households is not safely treated,
i.e. treated by secondary or higher processes           One fifth of the world’s river basins are
or with effluent discharges meeting relevant            experiencing rapid changes in the area
standards. Comparable data on total and                 covered by surface waters, indicative of
industrial wastewater flows are lacking for             flooding and drought events, which are
large parts of the world. Although 60 per               associated with climate change.
cent of the world’s monitored water bodies
has good ambient water quality, it is difficult         Although official development assistance (ODA)
to assess global status and trends due to               commitments to the water sector have increased
data gaps at the national and water-basin               slightly in recent years, actual disbursements
levels, leaving billions of people at risk.             have remained stable, despite increased funding
                                                        needs to meet targets under the SDGs.
Water use has remained relatively stable at
the global level during the last 10 years, and          Participatory procedures are increasingly
with 18 per cent of available water resources           recognized in national policies and laws whereas
being withdrawn, the world as a whole is not            their implementation have been moderate.
considered water-stressed. However, this
number hides stark regional differences: in
some regions the level of water stress has
increased by 14–15 per cent during the last two

                                  SUMMARY PROGRESS UPDATE 2021 – SDG 6 – WATER AND SANITATION FOR ALL       8
Global target1              Global        Number of     Baseline        Latest                  Status summary and priority
                              indicator 2     countries      status4        status5                    areas for acceleration6
                                              with data3

6.1 By 2030, achieve       6.1.1 Proportion                                              Achieving the SDG global target 6.1 by 2030 will
universal and equitable    of population                                                 require a fourfold increase in the current rate of
access to safe and         using safely                                                  progress. No SDG region is on track. 771 million
affordable drinking        managed                                                       people still lack even basic drinking water services.
water for all (100%).      drinking water        138       70% (2015)     74% (2020)     Among these, 8 out of 10 live in rural areas and
                           services                                                      nearly half live in least developed countries.
                                                                                         Since 2015, the number of people without
                                                                                         safely managed drinking water in sub-Saharan
                                                                                         Africa has increased from 703 to 766 million.

6.2 By 2030, achieve                                                                     Achieving the SDG global target 6.2 by 2030
access to adequate and     6.2.1a                                                        will require a fourfold increase in the current
equitable sanitation       Proportion                                                    rate of progress. No SDG region is currently
and hygiene for all        of population                                                 on track. 1.7 billion people still lack even basic
(100%) and end open        using safely          120       47% (2015)     45% (2017)     sanitation services. Among these, 7 out of
defecation (0%), paying    managed                                                       10 live in rural areas and 3 out of 10 in least
special attention to       sanitation                                                    developed countries. 494 million people still
the needs of women         services                                                      practise open defecation and 55 countries
and girls and those in                                                                   still have open defecation rates above 5%.
vulnerable situations.
                           6.2.1b                                                        Achieving the SDG global target 6.2 by 2030 will
                           Proportion of                                                 require a fourfold increase in the current rate of
                           population with                                               progress. 2 out of 5 people in rural areas and nearly
                           a handwashing                                                 two thirds of the population of least developed
                                                 79        54% (2020)     71% (2020) .
                           facility with                                                 countries lack handwashing facilities with soap
                           soap and                                                      and water at home. In sub-Saharan Africa 1 out
                           water available                                               of 3 people have no handwashing facility at all.
                           at home

6.3 By 2030, improve                                                                     While over half of all household wastewater
water quality by                                                                         is safely treated, regional disparities are
reducing pollution,        6.3.1 Proportion                                              broad. Some data gaps remain and a lack of
eliminating dumping        of household                                                  country data prior to 2020 prohibits a trend
and minimizing release     wastewater            128       56% (2020)     56% (2020)     analysis. Increasing the proportion of the
of hazardous chemicals     flow safely                                                   population connected to sewers and septic
and materials, halving     treated                                                       tanks while reducing direct sewer discharges
the proportion of                                                                        to the environment will best serve to accelerate
untreated wastewater                                                                     safe treatment of household wastewater.
(-50%) and substantially
increasing recycling       6.3.1 Proportion                                              There are currently insufficient data to estimate
and safe reuse globally.   of industrial                                                 global status or trends. Data coverage is
                           wastewater             2        ---% (2017)    ---% (2017)    very poor. Improving data coverage is an
                           flow safely                                                   essential first step to accelerating efforts
                           treated                                                       in wastewater collection and treatment.

                           6.3.2 Proportion                                              Although 60% of the world’s monitored water
                           of bodies of                                                  bodies has good ambient water quality, it is
                           water with                                                    difficult to assess global status and trends. The
                           good ambient                                                  estimate is based on data from less than half of
                           water quality                                                 all countries, of which many rely on relatively few
                                                                                         measurements. Out of 49 countries reporting
                                                 96         60% (2020)    60% (2020)     both in 2017 and 2020, 19 are on track to improve
                                                                                         water quality. Urgent action is necessary to
                                                                                         improve monitoring systems for both surface
                                                                                         and groundwater and to define water quality
                                                                                         standards. Ambient water quality needs improving
                                                                                         regardless of national socioeconomic status,
                                                                                         including through transboundary cooperation.

6.4 By 2030,                                                                             Most reporting countries have improved their
substantially increase                                                                   water-use efficiency between 2015 and 2018.
                           6.4.1 Change
water-use efficiency                                                                     The global value increased by 9% between 2015
                           in water-use                     17.3 USD/      18.9 USD/
across all sectors and                           166                                     and 2018. Improved data coverage is needed to
                           efficiency                       m3 (2015)      m3 (2018)
ensure sustainable                                                                       fully assess water-use efficiency. Accelerated
                           over time
withdrawals and                                                                          efforts are especially needed in agriculture, the
supply of freshwater to                                                                  most water-demanding economic sector.
address water scarcity
and substantially          6.4.2 Level of                                                Globally and in 4 SDG regions, less than 25% of
reduce the number          water stress:                                                 available water resources are being withdrawn,
of people suffering        freshwater                                                    and they are not considered water-stressed.
from water scarcity.       withdrawal as                                                 Within the Northern Africa and Western Asia
                           a proportion          180       18.2% (2015)   18.4% (2018)   region, many countries withdraw all their
                           of available                                                  renewable water resources (100%) or even
                           freshwater                                                    more (up to 1,000%), relying on non-renewable
                           resources                                                     resources that eventually will run dry.

9   SUMMARY PROGRESS UPDATE 2021 – SDG 6 – WATER AND SANITATION FOR ALL
Global target1              Global          Number of         Baseline            Latest                    Status summary and priority
                                indicator 2       countries          status4            status5                      areas for acceleration6
                                                  with data3

6.5 By 2030, implement                                                                                 Despite some progress, approximately 60% of
integrated water             6.5.1 Degree                                                              countries and 5 SDG regions are not on track
resources management         of integrated                                                             to meet the global target. The current rate of
at all levels (100%),        water                                                                     progress needs to be doubled. Priority needs
including through            resources               186           49% (2017)         54% (2020)       to be given to the 47% of countries with low
transboundary                management                                                                and medium-low implementation of IWRM.
cooperation as               implementation                                                            Implementation levels are lowest in Latin
appropriate.                 (0–100%)                                                                  America and the Caribbean, Oceania, Central
                                                                                                       and Southern Asia, and sub-Saharan Africa.

                             6.5.2                                                                     Only Europe, North America and sub-Saharan
                             Proportion of                                                             Africa are on track to meet the global target
                             transboundary        101 (out of                                          and only 24 countries have met the target as
                             basin area with       153 shar-                                           of 2020. Many rivers, lakes and aquifers are
                             an operational        ing trans-      59% (2017)         58% (2020)       lacking operational arrangements for water
                             arrangement           boundary                                            cooperation, especially in Latin America, North
                             for water              waters)                                            Africa and Western Asia, Central and Southern
                             cooperation                                                               Asia, and Eastern and South-Eastern Asia.

6.6 By 2020, protect                                                                                   All SDG regions contain some river basins
and restore water-                                                                                     experiencing high change in the extent of their
related ecosystems,                                                                                    surface water. High increases and/or declines in
including mountains,         6.6.1 Proportion                                                          surface water area are most notable in Eastern
forests, wetlands, rivers,   of river basins                                                           Asia and South-Eastern Asia, Central Asia and
aquifers and lakes.          showing high            185           12% (2015)         21% (2020)       Southern Asia, Latin America and the Caribbean
                             surface water                                                             and sub-Saharan Africa. Since 2000, mangroves
                             extent changes                                                            have declined globally by 4.2%. Lake water
                                                                                                       with significant turbidity conditions is found in
                                                                                                       Western Asia and Northern Africa, sub-Saharan
                                                                                                       Africa and Latin America and the Caribbean.

6.a By 2030, expand          6.a.1 Amount                                                              Commitments (+9%) of ODA to the water sector
international                of water- and                                                             have increased in real terms between 2015 and
cooperation and              sanitation-                                                               2019, including an additional US$ 644 million
capacity-building            related official                                                          to sub-Saharan Africa. Disbursements for
support to developing        development                                                               the water sector have remained stable from
countries in water-          assistance                                                                2015 to 2019, with disbursements for water,
and sanitation-              (ODA) received                                                            sanitation and hygiene (WASH) increasing by
                                                                    8.8 billion        8.8 billion
related activities and                               144                                               13% from 2015 to 2019, while disbursements
                                                                   USD (2015)         USD (2019)
programmes, including                                                                                  for other water sector areas such as agricultural
water harvesting,                                                                                      water resources and hydroelectric power have
desalination, water                                                                                    decreased by 10%. The increase in water sector
efficiency, wastewater                                                                                 ODA for least developed countries is mainly due
treatment, recycling and                                                                               to increases in concessional lending, e.g. by
reuse technologies.                                                                                    52% from 2015 to 2019, while ODA grants have
                                                                                                       increased by only 7% during the same time period.

6.b Support and              6.b.1 Number                                                              Participatory procedures are increasingly
strengthen the               of counties (or                                                           recognized in national policies and laws while
participation of             areas) with a                                                             the levels of participation have seen moderate
local communities            high level of                                                             improvement. Approximately 6 out of 10 countries
in improving water                                   109            1 (2016)           14 (2019)
                             participation                                                             reported that human and financial resources
and sanitation               by users/                                                                 were less than 50% of that needed to support
management.                  communities,                                                              community participation, indicating that increased
                             across sectors                                                            resources are essential to accelerating progress.

  1     Refers to the eight targets under SDG 6 of the 2030 Agenda for Sustainable Development.
  2     To ensure progress towards the 2030 Agenda and strengthen accountability, UN Member States have agreed to regularly report data on a
        set of global indicators, including 12 indicators for SDG 6.
  3     Number of countries, areas and territories with data available in the SDG global database that are no older than 2016. For indicators 6.3.2,
        6.5.1 and 6.6.1, the number only includes UN Member States (193 in total).
  4     The baseline year is the point in time from which progress is measured; in principle, the first year of the 2030 Agenda (2015) represents its
        baseline, but in practice, the specific baseline for each indicator will be established once enough country data are available to be globally
        representative (e.g. data from countries representing at least 50% of the global or regional population).
  5     The latest year for which data exist varies, since the different indicators follow different data collection cycles – for some indicators it
        makes sense to report every to every second year, for others it is sufficient every three to four years.
  6     See the individual indicator pages for more details on the current status and priority areas for acceleration. The eight SDG regions are
        sub-Saharan Africa, Northern Africa and Western Asia, Central and Southern Asia, Eastern and South-Eastern Asia, Latin America and the
        Caribbean, Oceania, Australia and New Zealand, and Europe and Northern America.

                                                SUMMARY PROGRESS UPDATE 2021 – SDG 6 – WATER AND SANITATION FOR ALL                                      10
6.1.1 Proportion of population
     using safely managed drinking
     water services

     Target 6.1 is: “By 2030, achieve universal                      Access to safe drinking water in homes,
     and equitable access to safe and                                health-care facilities, schools and workplaces
     affordable drinking water for all .”                            effectively reduces waterborne disease and
                                                                     malnutrition, which are leading causes of death
     Indicator 6.1.1 monitors the proportion of                      among children under five.
     population using safely managed drinking
     water services. A safely managed service is                     Millions have gained access. Since 2015,
     defined as an improved drinking water source                    over 600 million people have gained access
     that is accessible on the premises, available                   to safely managed drinking water services.
     when needed, and free of faecal and priority                    Globally, three out of four people used safely
     chemical contamination. Improved water                          managed drinking water services in 2020.
     sources include piped water, boreholes or
     tubewells, protected dug wells, protected
     springs and packaged or delivered water.

                                                                                             0-25
                                                                                             25-50
                                                                                             50-75
                                                                                             75-99
                                                                                             >99
                                                                                             Insufficient data
                                                                                             Not applicable

     Figure 1: Proportion of population using safely managed drinking water services in 2020 (%). Only 138 countries2
     had sufficient data – on accessibility, availability and quality of drinking water – to produce a national estimate for
     this indicator in 2020.

11    SUMMARY PROGRESS UPDATE 2021 – SDG 6 – WATER AND SANITATION FOR ALL
Leaving too many behind. 2 billion people                                                                                              will require a fourfold increase in current
– 26 per cent of the world’s population                                                                                                rates of progress, including a substantial
– still lacked drinking water services on                                                                                              increase in current levels of investment.
premises, available when needed and
free from contamination in 2020.                                                                                                                                   100
                                                                                                                                                                                                   2x
                                                                                                                                                                                                           98

Most regions are off track. None of the SDG
                                                                                                                                                                                    91            4x
                                                                                                                                                                         88

regions are currently on track to achieve                                                                                                                          80                                      81

                                                                                                                                                                                    74

universal coverage by 2030. In sub-Saharan                                                                                                                               70

Africa, the number of people lacking safely                                                                                                                        60

                                                                                                                                                  Population (%)
managed drinking water has increased                                                                                                                                                                                       Basic
                                                                                                                                                                                                                           Safely managed
by more than 40 per cent since 2000.
                                                                                                                                                                   40

Rural and poor impacted most. 771 million
people still lacked even basic drinking                                                                                                                            20

water services in 2020. Among these,
eight out of 10 lived in rural areas. Nearly
                                                                                                                                                                    0
half lived in least developed countries.                                                                                                                                2015       2020           2025    2030

The consequences of urban growth. The                                                                                                  Figure 3: Progress required to reach SDG target 6.1
number of city inhabitants lacking safely                                                                                              by 2030. Achieving universal access to basic drinking
managed drinking water has nearly doubled                                                                                              water by 2030 will require a doubling of current rates
since 2000.                                                                                                                            of progress, and achieving universal access to safely
                                                                                                                                       managed drinking water by 2030 will require a quad-
                                                                                                                                       rupling of current rates of progress.
Next steps: Achieving universal access to
safely managed drinking water by 2030

                                                                          0       0
                                           1         1     1       1      1       0
100                    1               1                                  0       0                   1         1                                                                                         2           2
                       6               4   2         1     3       1                                            4                                   4                              5        5                                    Surface water
       10          7                                 0                    4       4                   6                                   7                         8         6                           6           5
                       4               4   1               5       6                                            1                                                                           9                         4
                                                                                       26 23          1                                          13                                9                      3                      Unimproved
                16                         21 22                  13                                                                      16                                  14   3        3
                                                           13                                                                                                       17                                                16         Limited
 80    18                                                                                                                                                                                                 18
                                    29                                                                                                                                                                                           Basic
                13     31                                                                                                                        15                           13
                                                                                              18                                          13                        12                                                           Safely managed
       12                                                                              17
 60                                                                                               2
                                                                          95 96        2              92 94
                35                                                                                                    100100              31 32                     29
                                                                                                                                                                              30
                                                           77 79                                                                                                                   83 83
 40    33                                                                                                                                                                                                             74
                                           75 75                                                                                                                                                          70
                                    62
                       58
                                                                                       55 57
 20
                                                                                                                                          33 35                     33 37
       27 30

 0
      2015 2020 2015 2020 2015 2020 2015 2020 2015 2020 2015 2020 2015 2020 2015 2020                                                    2015 2020 2015 2020 2015 2020                                   2015 2020
        Sub-Saharan
              Africa

                             Central and
                           Southern Asia

                                           Latin America
                                                 and the
                                               Caribbean

                                                              Northern
                                                             Africa and
                                                           Western Asia

                                                                          Europe and
                                                                            Northern
                                                                             America

                                                                                        Oceania

                                                                                                        Eastern and
                                                                                                      South-Eastern
                                                                                                               Asia

                                                                                                                       Australia and
                                                                                                                       New Zealand

                                                                                                                                          Landlocked
                                                                                                                                          Developing
                                                                                                                                            Countries

                                                                                                                                                                         Least
                                                                                                                                                                    Developed
                                                                                                                                                                     Countries

                                                                                                                                                                                   Small Island
                                                                                                                                                                                   Developing
                                                                                                                                                                                         States

                                                                                                                                                                                                              World

Figure 2: Progress on drinking water coverage 2000–2020 (%) in the world and by SDG region and country category.
Globally, three out of four people used safely managed drinking water services in 2020. Five SDG regions had suffi-
cient country data – on accessibility, availability and quality of drinking water – to produce a national estimate for
safely managed drinking water.3

Data provider: World Health Organization (WHO) and United Nations Children’s Fund (UNICEF).

                                                                          SUMMARY PROGRESS UPDATE 2021 – SDG 6 – WATER AND SANITATION FOR ALL                                                                                                     12
6.2.1a Proportion of population
     using safely managed sanitation
     services

     Target 6.2 is: “By 2030, achieve access to           More than half still lack access. Since 2000,
     adequate and equitable sanitation and hygiene        2.4 billion people have gained access to safely
     for all and end open defecation, paying              managed sanitation, but 46 per cent of the
     special attention to the needs of women and          global population still lacked access in 2020.
     girls and those in vulnerable situations.”
                                                          Progress must increase four fold. Achieving
     Indicator 6.2.1a tracks the population               universal access to safely managed
     using an improved sanitation facility, that          sanitation by 2030 will require a fourfold
     is not shared with other households, and             increase in current rates of progress.
     where the excreta produced are either:
                                                          Rural and poor impacted most. 1.7 billion
     •     treated and disposed of in situ,               people still lack even basic sanitation
                                                          services in 2020. Among these, seven out
     •     emptied and treated off-site,                  of 10 lived in rural areas and four out of
                                                          10 lived in least developed countries.
     •     or transported through a sewer with
           wastewater and treated off-site.               Open defecation still a big problem. 494
                                                          million people still practised open defecation
     Improved sanitation facilities include flush/
                                                          and in 55 countries more than 5 per cent of the
     pour flush to piped sewer system, septic
                                                          population practised open defecation in 2020.
     tanks or pit latrines; ventilated improved pit
     latrines, composting toilets or pit latrines with    Next steps: The world is on track to eliminate
     slabs. If the excreta from improved sanitation       open defecation by 2028, but achieving
     facilities are not safely managed then people        universal access to basic sanitation by 2030
     using those facilities will be classed as            will require a doubling of current rates of
     having a basic sanitation service, or limited        progress, and achieving universal access to
     service if shared with other households.             safely managed sanitation by 2030 will require
                                                          a quadrupling of current rates of progress.
     Adequate sanitation and hygiene services at
                                                          This calls for a substantial increase in current
     home, in education settings and workplaces
                                                          levels of investment in sanitation services.
     are essential to make sure that women can
     participate in society on equal terms.

13       SUMMARY PROGRESS UPDATE 2021 – SDG 6 – WATER AND SANITATION FOR ALL
0-25
                                                                                                                                                                                                                   25-50
                                                                                                                                                                                                                   50-75
                                                                                                                                                                                                                   75-99
                                                                                                                                                                                                                   >99
                                                                                                                                                                                                                   Insufficient data
                                                                                                                                                                                                                   Not applicable

Figure 1: Proportion of population using safely managed sanitation services in 2020 (%). Only 120 countries had
sufficient data – on treatment and disposal of faecal sludge and sewage – to produce a national estimate for this
indicator in 2020.

                                                                                                                                       0       0
      100                                3         2       4         3                                 3         2     0           0   2       2
                                                   5                 6                                           4                     1       1                                                    8        8               10 6           Surface water
                                         6                 6                         23 12             9                                            14 15
                      22 18                        4       4         3                                           3                                                       20 16        21
                                                                                                                                                                                             16                                             Unimproved
                                         4
                                                                                         5
                                                                                                       4               29 24           21 20                                                        15 15                    10 8
           80                                                                                                                                                                                                                   7           Limited
                                                                                     7 12                                                                                                                                    7
                                                                                                               31                                                                                   9        9
                                                                                                                                                                                                                                            Basic
                                                                                     11                35                                                                      31            30                                             Safely managed
                                 31                                47                                                                                                                 28                                               24
                      31                         55        49                                                                                       47 46                32                                                  26
           60                            58                                                   25
                                                                                     21                                                                                                      11
                                                                                                                                                                               16     10
           40                    19                                                                                                                                      15
                      18                                                                                                               76 78
                                                                                                                       71 76                        4             5                   12 12         68 68
                                                                                                               60                                                              11                                                      54
                                                                                                                                                                         10
                      11 12                                                                   47       49                                                                                                                    47
           20
                                                 34        37 42                     38                                                             35 35
                                         28                                                                                                                                           29 31
                      19 21                                                                                                                                              24 26

                0
                    2015 2020 2015 2020 2015 2020 2015 2020 2015 2020 2015 2020 2015 2020 2015 2020                                                                     2015 2020 2015 2020 2015 2020                      2015 2020

                                                                                                                                                                                                                               World
                                                                                                                                       Europe and
                         Sub-Saharan
                               Africa

                                         Latin America
                                               and the
                                             Caribbean

                                                              Northern
                                                             Africa and
                                                           Western Asia

                                                                                       Central and
                                                                                     Southern Asia

                                                                                                         Eastern and
                                                                                                       South-Eastern
                                                                                                                Asia

                                                                                                                       Australia and
                                                                                                                       New Zealand

                                                                                                                                         Northern
                                                                                                                                          America

                                                                                                                                                        Oceania

                                                                                                                                                                              Least
                                                                                                                                                                         Developed
                                                                                                                                                                          Countries

                                                                                                                                                                                      Landlocked
                                                                                                                                                                                      Developing
                                                                                                                                                                                        Countries

                                                                                                                                                                                                    Small Island
                                                                                                                                                                                                    Developing
                                                                                                                                                                                                          States

Figure 2: Progress on sanitation coverage 2000–2020 (%) in the world and by SDG region and country category. At
the global level, just over half the population used safely managed sanitation services in 2020. Seven SDG regions
had sufficient country data – on treatment and disposal of faecal sludge and sewage – to produce an estimate for
safely managed services.4

                    100                                   1x              >99

                                         94               2x
                          90                                                    90

                                                                                                                                                                      Figure 3: Progress required to reach
                    80                                    4x
                                         78

                          73
                                                                                                                                                                      SDG target 6.2 by 2030. Achieving
                                                                                67
                                                                                                                                                                      universal access to basic sanita-
   Population (%)

                    60

                                         54
                                                                                                        No open defecation                                            tion by 2030 will require a doubling
                          47
                                                                                                        Basic                                                         of current rates of progress, and
                                                                                                        Safely managed
                    40                                                                                                                                                achieving universal access to
                                                                                                                                                                      safely managed drinking water by
                                                                                                                                                                      2030 will require a quadrupling of
                    20
                                                                                                                                                                      current rates of progress.

                     0
                      2015              2020             2025              2030

Data provider: World Health Organization (WHO) and United Nations Children’s Fund (UNICEF).

                                                                                                     SUMMARY PROGRESS UPDATE 2021 – SDG 6 – WATER AND SANITATION FOR ALL                                                                                     14
6.2.1b Proportion of population
     with a handwashing facility with
     soap and water available at home

     Target 6.2 is: “By 2030, achieve access to                    3 out of 5 people have access. 5.5 billion
     adequate and equitable sanitation and hygiene                 people had basic handwashing facilities
     for all and end open defecation, paying                       with soap and water at home in 2020.
     special attention to the needs of women and
     girls and those in vulnerable situations.”                    Leaving too many people behind. 2.3 billion
                                                                   people – 29 per cent of the world’s population
     Indicator 6.2.1b tracks the proportion of                     – still lacked a basic handwashing facility
     population with a handwashing facility with                   with soap and water at home in 2020.
     soap and water on premises. Handwashing
     facilities may be fixed or mobile and include                 Rural and poorest impacted most. Four out of
     a sink with tap water, buckets with taps,                     10 people in rural areas and two thirds of the
     tippy-taps, and jugs or basins designated for                 population of least developed countries lacked
     handwashing. Soap includes bar soap, liquid                   handwashing facilities with soap and water in
     soap, powder detergent and soapy water.                       2020. In sub-Saharan Africa, two out of five
                                                                   people had no handwashing facility at all.
     Handwashing is a cost-effective intervention
     to improve public health by drastically
     reducing the spread of infectious diseases.

                                                                                        0-25
                                                                                        25-50
                                                                                        50-75
                                                                                        75-99
                                                                                        >99
                                                                                        Insufficient data
                                                                                        Not applicable

     Figure 1: Proportion of population with basic handwashing facilities at home in 2020 (%). Seventy-nine countries
     had sufficient data to produce national estimates for this indicator in 2020.

15   SUMMARY PROGRESS UPDATE 2021 – SDG 6 – WATER AND SANITATION FOR ALL
Next steps: The COVID-19 pandemic                                                                                      ‘build back better’ and improve resilience,
has highlighted the importance of hand                                                                                 governments must accelerate their
hygiene for preventing and controlling the                                                                             efforts to ensure hand hygiene for all.
spread of infectious diseases. In order to

100                                                      4           3                    3
                                                                                6                                                                   9            9
                                                                                          7
                                                                                10                                                  23 20
                                                                                                       29 27        28 28
        35 34                            35 36           31 28
 80                                                                                                                                                 23 21

                                                                                                                                    24 28
 60
                                                                                                             36     37 37
                                                                                                                                                                     No facility
                                         29 28                                                         39
        40 40                                                                          91                                                                            Limited
 40                                                                             84
                                                         65 69
                                                                                                                                                                71   Basic
                                                                                                                                                    67
                                                                                                                                   53 52
 20                                   36 36                                                            32 37        35 35
        25 26

  0
      2015 2020 2015 2020 2015 2020 2015 2020                                                     2015 2020 2015 2020 2015 2020                   2015 2020
         Sub-Saharan
               Africa

                                          Oceania

                                                           Central and
                                                         Southern Asia

                                                                                   Northern
                                                                                  Africa and
                                                                                Western Asia

                                                                                                            Least
                                                                                                       Developed
                                                                                                        Countries

                                                                                                                    Landlocked
                                                                                                                    Developing
                                                                                                                      Countries

                                                                                                                                   Small Island
                                                                                                                                   Developing
                                                                                                                                         States

                                                                                                                                                        World
Figure 2: Handwashing coverage in 2020 (%) in the world and by SDG region and country category. Globally, seven
out of 10 people had basic handwashing facilities, and four SDG regions had sufficient country data to produce
national estimates for this indicator in 2020.

                                    100                                                                                           Figure 3: Progress
                                                                                                                                  required to reach SDG
                                                                          4x                                                      target 6.2 by 2030.
                                    80                                                                                            Achieving universal
                                                                                       78
                                                                                                                                  access to basic
                                                    71
                                          67                                                                                      hygiene services by
                                    60                                                                                            2030 will require a
                   Population (%)

                                                                                                                                  quadrupling of current
                                                                                               Basic                              rates of progress.
                                    40

                                    20

                                     0
                                         2015       2020                 2025        2030

Data provider: World Health Organization (WHO) and United Nations Children’s Fund (UNICEF).

                                                                         SUMMARY PROGRESS UPDATE 2021 – SDG 6 – WATER AND SANITATION FOR ALL                                       16
6.3.1 Proportion of domestic and
     industrial wastewater flow safely
     treated

     Target 6.3 is: “By 2030, improve water quality      Too much uncollected household wastewater.
     by reducing pollution, eliminating dumping and      Supported by data from SDG indicator 6.2.1 on
     minimizing release of hazardous chemicals           sanitation facilities, estimates for safely treated
     and materials, halving the proportion of            household wastewater were produced for 128
     untreated wastewater and substantially              countries, areas and territories, representing
     increasing recycling and safe reuse globally”.      80 per cent of the global population. Globally
                                                         in 2020, 81 per cent of the wastewater flows
     Indicator 6.3.1 tracks the proportion of            were generated by households connected to
     total, industrial and household wastewater          sewers or septic tanks (57 per cent and 24
     flows safely treated in compliance with             per cent, respectively). Only two thirds (66
     national or local standards. The household          per cent) of all household wastewater flows
     component includes both sewage and faecal           were collected at treatment facilities. A total
     sludge, treated on-site or off-site, with           of 16 per cent of all sewer flows and 46 per
     linkages to indicator 6.2.1a on sanitation.         cent of all septic tank flows were not collected
                                                         (primarily due to the direct discharge of sewer
     Wastewater collection and treatment help
                                                         flows and poor sanitary containment of septic
     protect freshwater systems, the oceans and
                                                         tank flows). The 19 per cent of wastewater
     also human health, as detrimental pathogens,
                                                         flows generated by households with all
     nutrients and other types of pollution are
                                                         other types of sanitation were considered
     prevented from entering the environment.
                                                         as not being collected in their entirety.6
     Insufficient data to assess global progress on
                                                         Most household wastewater flows that
     total flows. Over the last 20 years, 90 countries
                                                         were collected at treatment facilities were
     have reported statistics on the total volume
                                                         subsequently safely treated. Globally, 56 per
     of wastewater flows,5 but fewer have reported
                                                         cent of all wastewater flows generated by
     on both generation and treatment. Among the
                                                         households in 2020 were collected at treatment
     42 countries reporting on both generation and
                                                         facilities and safely treated, meaning that these
     treatment of total wastewater flows in 2015, 32
                                                         flows were treated by secondary or higher
     per cent of all wastewater flows generated from
                                                         processes or that effluent discharges met
     point sources received at least some treatment.
                                                         relevant standards. The 44 per cent of household
     However, as these 42 countries represent
                                                         wastewater flows not safely treated are mostly
     only 18 per cent of the global population, it is
                                                         the result of a lack of collection at centralized
     not possible to assess the global situation.
                                                         treatment plants or septic tanks.

17    SUMMARY PROGRESS UPDATE 2021 – SDG 6 – WATER AND SANITATION FOR ALL
Among sewer flows already collected at                        Next steps: Advocating for improved and more
centralized wastewater plants, 79 per cent went               complete monitoring, particularly for total and
on to be safely treated. Among collected septic               industrial wastewater flows. Increasing the
tank flows (including faecal sludge collected                 proportion of household wastewater flows that
on-site or delivered and collected off-site),                 are transported through sewer networks to
85 per cent went on to be safely treated.                     effective wastewater treatment plants, or are
                                                              effectively treated on-site, e.g. septic tanks with
Insufficient data to assess global progress                   leachfields and faecal sludge management.
on industrial wastewater. Data on industrial
discharges are poorly monitored and seldom
aggregated at the national level; currently,

                                                               Proportion of industrial wastewater treated (%)
only two countries in the world report on the                                                                    100
                                                                                                                  90
proportion of industrial wastewater safely                                                                        80
                                                                                                                  70
treated. Data are available from additional                                                                       60
                                                                                                                  50
countries, but here information about the                                                                         40

treatment level is missing, so it is not possible to                                                              30
                                                                                                                  20
assess if the treatment is safe. In 2015, among                                                                   10
                                                                                                                   0
14 reporting countries representing 4 per cent of                                                                      Bulgaria Czechia Croatia   Latvia Lithuania Poland Romania Slovakia Turkey

                                                                                                                                         2014      2015    2016     2017     2018
the global population, 30 per cent of industrial
wastewater flows received at least some
                                                              Figure 2: Proportion of industrial wastewater treated
treatment. In addition, time series are available
                                                              2014–2018 (%).7 Data are only available for nine
from nine European countries, showing that the
                                                              European countries, and it is not possible to assess if
proportion of treated wastewater are relatively               the treatment is safe.
stable over the period of 2014 to 2018.

     Propor�on of household
     wastewater safely treated
         >90-100%
         >75-90%
         >50-75%
         >25-50%
         0-25%
         Data not available
         Not applicable

Figure 1: Percentage of safely treated wastewater flows from households in 2020 (%). In 62 of the 128 countries with
estimates, less than half of all wastewater generated by households was safely treated.

Data provider: World Health Organization (WHO), United Nations Human Settlements Programme
(UN-Habitat) and United Nations Statistics Division (UNSD).

                                 SUMMARY PROGRESS UPDATE 2021 – SDG 6 – WATER AND SANITATION FOR ALL                                                                                                18
6.3.2 Proportion of bodies of water
     with good ambient water quality

     Target 6.3 is: “By 2030, improve water quality    system in place, which supports the
     by reducing pollution, eliminating dumping and    concept that monitoring is a prerequisite
     minimizing release of hazardous chemicals         for positive management action.
     and materials, halving the proportion of
     untreated wastewater and substantially            Water quality threats. Although low, middle
     increasing recycling and safe reuse globally.”    and high income countries alike also reported
                                                       on bad water quality (see Figures 1 and 2),
     Indicator 6.3.2 monitors the proportion of        the underlying drivers are likely to be different
     bodies of water with good ambient water           and therefore will require specific actions.
     quality, as per national and/or subnational       Agriculture and untreated wastewater pose
     water quality standards and based on              two of the greatest threats to environmental
     measurements of five water quality parameters     water quality globally and release excess
     that inform on the most common pressures          nutrients into rivers, lakes and aquifers which
     on water quality at the global level.             damage ecosystem function. Measurements
                                                       of nitrogen and phosphorus failed to meet
     Investments in measures to protect, restore       their targets more often than the other
     and monitor water quality have positive           water quality parameters of the indicator.
     effects on both terrestrial and marine
     ecosystem health more broadly, and lower          Building monitoring capacity. Water quality
     the costs for drinking water treatment.           data are not collected routinely in a majority
                                                       of countries. This means that the health of
     Good water quality. In all world regions, and     freshwater ecosystems is unknown and over
     in low, medium and high income countries          3 billion people are at risk. Furthermore, the
     alike, many water bodies are still in good        poorest 20 countries reported on only 1,000
     condition (see Figures 1 and 2). Sixty per        water bodies in total, compared with the
     cent of water bodies – 45,966 out of 76,151       richest 24 that reported on nearly 60,000
     – assessed in 89 countries have good              (see Figure 3). Lastly, data on water quality
     ambient water quality. Protection is easier       from developing countries lacked detail,
     than restoration, so efforts to protect these     with the indicator calculated using relatively
     water bodies must be initiated now.               few measurements and without suitable
                                                       environmental water quality standards, thus
     Positive trends for countries with robust
                                                       lowering the reliability of the reporting.
     monitoring systems. Nineteen of the 49
     countries reporting in both 2017 and 2020         Lack of groundwater data. Of the 89 countries
     are on track to improve water quality. These      with data, only 52 have information about
     are countries that have a robust monitoring       groundwater, which is problematic because

19    SUMMARY PROGRESS UPDATE 2021 – SDG 6 – WATER AND SANITATION FOR ALL
groundwater often represents the largest share                                                                                                           farming management practices and increase
of freshwater in a country. Understanding of                                                                                                             wastewater treatment, especially in regions with
the hydrogeological environment, the pressures                                                                                                           high population growth such as Africa. As a first
on these resources, and how to monitor them                                                                                                              step towards accelerated policy action, capacity-
effectively is lacking in many countries.                                                                                                                building and investment are needed in all regions
                                                                                                                                                         to expand country monitoring networks and
Next steps: To protect water bodies and improve                                                                                                          establish national water quality standards.
water quality, it is essential to urgently enhance

                                                                       Propor�on of bodies of water
                                                                       with good ambient water quality
                                                                           >80-100%
                                                                           >60-80%
                                                                           >40-60%
                                                                           >20-40%
                                                                           0-20%
                                                                           Data not available
                                                                           Not applicable

Figure 1: Proportion of bodies of water with good ambient water quality, 2017–2020 (%). In 63 out of 89 reporting
countries, 60 per cent or more of water bodies have good quality.
   Proportion of bodies of water with good ambient water quality (%)

                                                                                                                                                                                                         80
                                                                                                                                                          Number of monitored water bodies (thousands)

                                                                         100
                                                                                                                                                                                                         70   10.6%
                                                                          90
                                                                                                                                                                                                                                                                    59.8%
                                                                          80                                                                                                                             60
                                                                          70
                                                                                                                                                                                                         50
                                                                          60
                                                                          50                                                                                                                             40   53.8%

                                                                          40
                                                                                                                                                                                                         30
                                                                          30
                                                                                                                                                                                                         20
                                                                          20                                                                                                                                                                          12.8%
                                                                          10                                                                                                                             10
                                                                                                                                                                                                              12.8%                     3.2%
                                                                          0                                                                                                                                              1.2%
                                                                              100                1000                 10000                100000                                                        0
                                                                                                                                                                                                              World    100-2,000     2,000-6,200   6,200-20,200 20,200-200,000
                                                                                                        GDP per capita (USD)
                                                                                Australia and New Zealand             Latin America and the Caribbean                                                          Lakes   Rivers      Groundwater     Monitored water bodies
                                                                                Central and Southern Asia             Northern Africa and Western Asia
                                                                                Eastern and South-Eastern Asia        Oceania
                                                                                Europe and Northern America           Sub-Saharan Africa                                                                                 GDP per capita in 2017 (USD)

Figure 2: Proportion of bodies of water with good                                                                                                        Figure 3: Total number of water bodies reported on
ambient water quality in countries, compared to their                                                                                                    by water body type (left) and by GDP quartiles (right).
gross domestic product per capita, 2017–2020. Each                                                                                                       The richest 24 countries reported on almost 60,000
dot represents a country. The reported water quality                                                                                                     water bodies, whereas the poorest 20 countries
situation is not related to gross domestic product (GDP).                                                                                                reported on just over 1,000.

Data provider: United Nations Environment Programme (UNEP).

                                                                                                                      SUMMARY PROGRESS UPDATE 2021 – SDG 6 – WATER AND SANITATION FOR ALL                                                                                        20
6.4.1 Change in water-use
     efficiency over time
     Target 6.4 is: “By 2030, substantially increase     development, water-use efficiency decreased
     water-use efficiency across all sectors and         between 2015 and 2018, calling for a more
     ensure sustainable withdrawals and supply           detailed analysis of the underlying factors.
     of freshwater to address water scarcity
     and substantially reduce the number of              Increases in all economic sectors. Between
     people suffering from water scarcity.”              2015 and 2018, water-use efficiency in the
                                                         industrial sector increased by 15 per cent to
     Indicator 6.4.1 tracks the change in water-         32 USD/m3, in the services sector by 8 per cent
     use efficiency over time, measured as the           to 112 USD/m3 and in the agriculture sector
     ratio of dollar value added to the volume           by 8 per cent to 0.6 USD/m3. Agriculture is by
     of water used. It considers water use by            far the largest water user, especially in low-
     all economic activities, with a focus on            and middle-income countries, while at the
     agriculture, industry and the service sector.       same time being the sector with the lowest
                                                         global value added aggregate. Food security
     Increasing water-use efficiency over time           is a key consideration when analysing the
     means decoupling a country’s economic growth        relative value of water use in the different
     from its water use. This could be achieved by,      sectors. With increasing urbanization, it is
     for example, repairing leaking water distribution   expected that withdrawals in the services
     systems, using less thirsty crops and investing     sector will increase in the short term.
     in new technology, results in more sustainable
     food and industrial production systems.             Economic growth still dependent on water use,
     Water savings are also often associated with        albeit positive trends in industry. Long time
     energy savings, as less water needs to be           data series are necessary to assess the
     extracted, treated, transported and heated.         economic dynamics in relation to water use.
                                                         They are currently available only for 86 countries
     Global improvement. Between 2015 and 2018,          that are primarily high income with industry as
     water-use efficiency increased by about 9 per       the dominant water user. Between 2006 and
     cent globally, to 18.9 USD/m3. Whereas regions      2018, water-use efficiency grew more slowly than
     with a high level of economic development           gross value added, indicating that economic
     such as Europe, Northern America and Oceania        growth across sectors remains dependent on
     have high water-use efficiency in absolute          water use. The exception is industry, where water
     numbers (over 60 USD/m3), the highest               withdrawals decreased by 18 per cent whereas
     growth rates are seen in Central and Southern       the gross value added increased by over 30 per
     Asia (20 per cent). When looking at specific        cent, representing a growth in industrial water-
     countries, the largest water-use efficiency         use efficiency of 68 per cent.
     gains have taken place in countries with highly
     developed industrial and services sector. In 26
     countries representing all levels of economic

21    SUMMARY PROGRESS UPDATE 2021 – SDG 6 – WATER AND SANITATION FOR ALL
This could be interpreted as a first sign of                                                                       It is therefore crucial that countries update data
decoupling and could be partly explained by                                                                        on a regular basis.
more stringent water quality regulations that
encourage industries to reuse and recycle water.                                                                   Next steps: Innovation, both technical and non-
                                                                                                                   technical, is the key to reducing the pressure of a
Data scarcity. The estimations above are based                                                                     growing economy on available water resources.
on data from 166 countries, representing 99 per                                                                    This is particularly important in agriculture, the
cent of the global population, and for the long                                                                    most water-demanding economic sector, where
time series only from 86 countries that are not                                                                    new crop varieties, efficient irrigation systems
globally representative. The lack of updated data                                                                  and improved rain-fed cultivation could increase
remains one of the main constraints to                                                                             water-use efficiency.
assessing water-use efficiency.

                    Change in water-use efficiency
                    2015-2018
                        Increase
                                        No change
                                        Decrease
                                        Data not available
                                        Not applicable

Figure 1: Change in water-use efficiency between 2015 and 2018. Data are available for 166 countries.

                                        1.25
                                                                                                                                                        1.5
    Change compared to base year 2015

                                        1.20
                                                                                                                    Change compared to base year 2006

                                                                                                                                                        1.4
                                        1.15

                                                                                                                                                        1.3
                                        1.10

                                        1.05                                                                                                            1.2

                                        1.00                                                                                                            1.1

                                        0.95
                                                                                                                                                        1.0
                                                     2000          2010              2020            2030
                                               Central Asia and Southern Asia               Northern Africa and
                                                                                            Western Asia                                                0.9
                                               Eastern Asia and South-Eastern Asia          Oceania
                                                                                                                                                              2006 2007 2008 2009 2010 2011 2012 2013 2014 2015 2016 2017 2018
                                               Europe and Northern America                  Sub-Saharan Africa
                                               Latin America and the Caribbean
                                                                                                                                                        Water withdrawals         Gross value added         Water-use efficiency
                                                                                            World

Figure 2: Global trend in water-use efficiency (index                                                              Figure 3: Trend in gross value added and water-
year 2015 = 1). Between 2015 and 2018, global water-                                                               use efficiency between 2006 and 2018 for the 86
use efficiency increased by 9 per cent. The global                                                                 countries with long time data series (index year 2006
trend is based on data for 166 countries, representing                                                             = 1). Water-use efficiency grew slower than gross
99 per cent of the global population.                                                                              value added, indicating that economic growth can be
                                                                                                                   jeopardized by its dependency on water resources.

Data provider: Food and Agriculture Organization of the United Nations (FAO).

                                                                                 SUMMARY PROGRESS UPDATE 2021 – SDG 6 – WATER AND SANITATION FOR ALL                                                                               22
                                                                                            Water-use efficiency
6.4.2 Level of water stress:
     freshwater withdrawal as a
     proportion of available
     freshwater resources
     Target 6.4 is: “By 2030, substantially increase   variations. Three SDG regions have water
     water-use efficiency across all sectors and       stress values above 25 per cent, with Western
     ensure sustainable withdrawals and supply         Asia and Northern Africa and Central and
     of freshwater to address water scarcity           Southern Asia withdrawing more than 70
     and substantially reduce the number of            per cent of available water resources.
     people suffering from water scarcity.”
                                                       Water basins data reveal stress within
     Indicator 6.4.2 tracks how much freshwater        countries. Disaggregation of data by river
     is being withdrawn by all economic                basin shows that severe water stress exists
     activities, compared to the total renewable       not only in Northern Africa and Western Asia,
     freshwater resources available. When a            but also in river basins in Northern America,
     territory withdraws 25 per cent or more of        Central and Southern Asia and on the west
     its renewable freshwater resources it is said     coast of Latin America. This is not evident when
     to be ‘water-stressed’. The monitoring of         looking at water stress by country or region,
     environmental water requirements encourages       illustrating why water basins are the most
     consideration for ecosystem health when           appropriate scale for water management.
     available water resources are being allocated.
                                                       Slight improvements, considerable
     Improving farming systems will help reduce        deteriorations. Between 2008 and 2018, only
     the demand for water and alleviate the            Europe and Northern America and Central Asia
     pressure on ecosystems. Healthy ecosystems        and Southern Asia reduced their water stress.
     are in turn essential to stabilize the water      In all other regions, water stress worsened;
     cycle, allowing more recharge for aquifers        considerably so in Latin America and the
     and a steadier run-off in surface streams.        Caribbean and sub-Saharan Africa, which
                                                       both saw increases of about 15 per cent.
     Unsustainable usage. Within the Northern
     Africa and Western Asia regions, many             Three quarters of water withdrawals for
     countries withdraw all their renewable water      agriculture. Worldwide, 72 per cent of all
     resources (100 per cent) every year, or even      water withdrawals are used by agriculture,
     more (up to 1,000 per cent), and rely on non-     16 per cent by municipalities for households
     renewable resources to meet their water needs,    and services, and 12 per cent by industries.
     some of which will eventually run dry, such as
     groundwater extracted from confined aquifers.     Lack of reporting. Globally, over the past
                                                       10 years, 67 countries have not consistently
     Large regional variations. At the global level,   reported water stress data, most of them
     18.4 per cent of total renewable freshwater       small island developing states. Further, to
     resources available are being withdrawn.          determine where the stress is located and
     However, this value hides large regional          design mitigation strategies, there is

23    SUMMARY PROGRESS UPDATE 2021 – SDG 6 – WATER AND SANITATION FOR ALL
You can also read