Using Twitter for Public Health Surveillance from Monitoring and Prediction to Public Response
←
→
Page content transcription
If your browser does not render page correctly, please read the page content below
data
Review
Using Twitter for Public Health Surveillance from
Monitoring and Prediction to Public Response
Sophie E. Jordan 1 , Sierra E. Hovet 2 , Isaac Chun-Hai Fung 3 , Hai Liang 4 , King-Wa Fu 5 and
Zion Tsz Ho Tse 2, *
 1   School of Chemical, Materials, and Biomedical Engineering, College of Engineering, University of Georgia,
     Athens, GA 30602, USA; sophie.jordan25@uga.edu
 2   School of Electrical and Computer Engineering, College of Engineering, University of Georgia, Athens,
     GA 30602, USA; hovetsia@uga.edu
 3   Jiann-Ping Hsu College of Public Health, Georgia Southern University, Statesboro, GA 30460, USA;
     cfung@georgiasouthern.edu
 4   School of Journalism and Communication, Chinese University of Hong Kong, Hong Kong, China;
     hailiang@cuhk.edu.hk
 5   Journalism and Media Studies Centre, The University of Hong Kong, Hong Kong, China; kwfu@hku.hk
 *   Correspondence: ziontse@uga.edu; Tel.: +1-706-542-4189

 Received: 14 December 2018; Accepted: 22 December 2018; Published: 29 December 2018

 Abstract: Twitter is a social media platform where over 500 million people worldwide publish their
 ideas and discuss diverse topics, including their health conditions and public health events. Twitter
 has proved to be an important source of health-related information on the Internet, given the amount
 of information that is shared by both citizens and official sources. Twitter provides researchers with a
 real-time source of public health information on a global scale, and can be very important in public
 health research. Classifying Twitter data into topics or categories is helpful to better understand how
 users react and communicate. A literature review is presented on the use of mining Twitter data or
 similar short-text datasets for public health applications. Each method is analyzed for ways to use
 Twitter data in public health surveillance. Papers in which Twitter content was classified according
 to users or tweets for better surveillance of public health were selected for review. Only papers
 published between 2010–2017 were considered. The reviewed publications are distinguished by the
 methods that were used to categorize the Twitter content in different ways. While comparing studies
 is difficult due to the number of different methods that have been used for applying Twitter and
 interpreting data, this state-of-the-art review demonstrates the vast potential of utilizing Twitter for
 public health surveillance purposes.

 Keywords: public health; Twitter; classification; data mining; Zika; Ebola

1. Introduction
      Promoting and protecting the health of communities is the goal of public health. Public health
professionals strive to prevent illness and injury. They track outbreaks and shed light on why poor
health affects some more than others. Epidemiology is concerned with the dynamics of health
conditions in populations. Research in epidemiology aims to identify the distribution, incidence,
and etiology of diseases in order to facilitate their prevention, control, and treatment [1]. Public health
surveillance is the practice of public health agencies that collect, manage, analyze, and interpret data
in a systematic and ongoing manner, and disseminate such data to programs that will facilitate actions
in public health [2]. Disease outbreaks are increasingly becoming more frequent and diverse around
the world due to a combination of ecological, environmental, and socio-economic factors. New tools

Data 2019, 4, 6; doi:10.3390/data4010006                                           www.mdpi.com/journal/data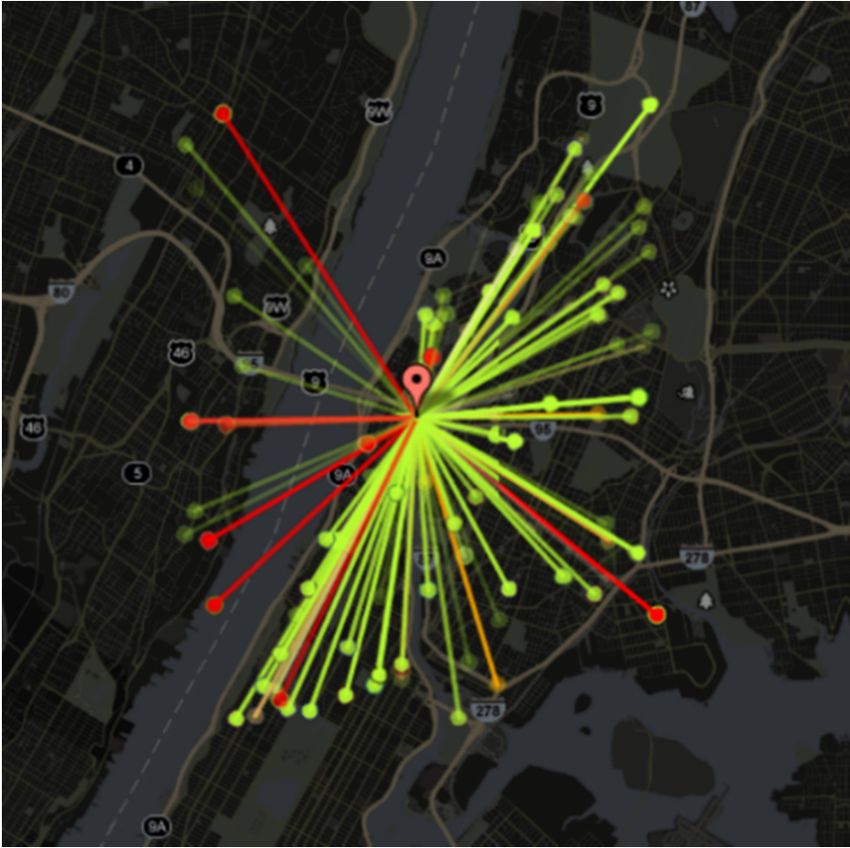
Data 2019, 4, 6 2 of 20
for detecting outbreaks are being developed, including those that analyze digital data (“digital disease
Data 2018, 3,[3].
detection”) x FORRapid
PEER REVIEW
response through improved surveillance is important to combat emerging 2 of 22
infectious diseases such as Ebola and Zika [4]. Technological innovation and its applications in routine
combat emerging infectious diseases such as Ebola and Zika [4]. Technological innovation and its
surveillance for other diseases, such as influenza, may enable nowcasts and the prediction of disease
applications in routine surveillance for other diseases, such as influenza, may enable nowcasts and
trends [5,6].
the prediction of disease trends [5,6].
Twitter
Twitter is ais social
a socialmedia
mediaplatform
platform for
for sharing short-textupdates
sharing short-text updates that
that maymay contain
contain public
public health
health
information.
information. Since platforms such as Twitter are in real-time and can be mined as such, they are are
Since platforms such as Twitter are in real-time and can be mined as such, they
promising
promising forforwidespread
widespreadimplementation
implementation in in public healthapplications
public health applications[7–9].
[7–9].
Twenty-eight
Twenty-eight research
researchpapers
papersdiscussing
discussingthe theuses
usesofofTwitter
Twitterdata
data for
for the
the field
field of public health
health are
summarized
are summarized in this inreview (Section(Section
this review 3). A focus
3). Ais focus
placedisonplaced
emerging studies that
on emerging use data-mining
studies that use
data-mining
techniques suchtechniques such as tweet classification,
as tweet classification, sentiment
sentiment analysis, andanalysis, and user classification
user classification for public forhealth
public health
surveillance. Thesurveillance.
goals of thisThe goals
work areoftothis workresearchers
present are to present
withresearchers with theaccomplishments
the most current most current
accomplishments
in this field, and provide in this field,
them and
with anprovide them with
understanding an challenges
of the understanding and of the challenges
potential of usingandTwitter
potential of using Twitter for public health. Currently, filtering and categorizing
for public health. Currently, filtering and categorizing tweets into useful data is accomplished via tweets into useful
data is different
numerous accomplished via numerous
methods, many of whichdifferent
rely methods,
heavily onmany
human of intelligence
which rely to heavily
verifyon human
results. There
intelligence to verify results. There is also a lack of a standard method of comparison for the results
is also a lack of a standard method of comparison for the results of tweet classifications. Before Twitter
of tweet classifications. Before Twitter can be accepted as a reliable source of data for health
can be accepted as a reliable source of data for health surveillance, these areas must be improved.
surveillance, these areas must be improved. Sections 4 and 5 summarize the existing challenges and
Sections 4 and 5 summarize the existing challenges and the future directions in the field.
the future directions in the field.
2. Methods
2. Methods
Twitter data
Twitter hashas
data beenbeen
found to betouseful
found for several
be useful different
for several public public
different health health
applications, including:
applications,
(1) including:
monitoring diseases, (2) public reaction, (3) outbreak/emergency situations,
(1) monitoring diseases, (2) public reaction, (3) outbreak/emergency situations, (4) (4) prediction,
(5) prediction,
lifestyle, (6)(5)geolocation,
lifestyle, (6) and (7) general
geolocation, and applications. The articles
(7) general applications. Thecited in this
articles paper
cited were
in this found
paper
using keyword searches on the bibliographic databases Google Scholar [10], IEEE
were found using keyword searches on the bibliographic databases Google Scholar [10], IEEE XploreXplore [11], and Science
Direct
[11],[12]
andfrom 1 January
Science 2010from
Direct [12] to 31 1December
January 20102017.toAll
31 online library
December access,
2017. conference
All online libraryproceedings,
access,
andconference proceedings,
other literature and other
repositories for eachliterature
authorrepositories for each
or expert were author or expert
also researched were also
for relevant articles.
Theresearched for relevant
initial search yielded articles. The initial
864 research search
papers. All yielded 864 research
of the papers papers.
that were All were
found of thethen
papers that
processed,
andwere
theirfound werewere
abstracts thenreviewed
processed,forand their abstracts
relevance were reviewed
and filtered as per thefor relevance
specific and filtered
selection asArticles
criteria. per
the specific selection criteria. Articles that were not pertinent to public health
that were not pertinent to public health and Twitter were identified through a manual analysis of eachand Twitter were
identified
abstract, andthrough a manualAanalysis
were excluded. of each
rating scale of abstract,
0 (clearlyand were excluded.
irrelevant) A ratingrelevant)
to 10 (clearly scale of 0was
(clearly
applied
irrelevant) to 10 (clearly relevant) was applied to the remaining articles. The authors performed a
to the remaining articles. The authors performed a manual scan of each article to assess the scale.
manual scan of each article to assess the scale. To eliminate duplicate or similar research papers
To eliminate duplicate or similar research papers published by the same authors, the article that was
published by the same authors, the article that was published in a journal was selected, and the
published in a journal was selected, and the others were eliminated. The articles were then organized
others were eliminated. The articles were then organized into a prioritized list and reviewed in
intodepth
a prioritized
in order to listwrite
and the
reviewed in depthsections.
corresponding in orderAfter
to write the corresponding
the elimination sections.
process was After
complete, a the
elimination process was complete, a total of 28 research
total of 28 research articles remained for review (see Figure 1). articles remained for review (see Figure 1).
Figure 1. Diagram of research elimination process.
Figure 1. Diagram of research elimination process.
Data 2019, 4, 6                                                                                      3 of 20

3. Public Health Applications

3.1. Monitoring Diseases
      Paul and Dredze proposed a new associative topic model for identifying tweets regarding ailments
(Table 1) [13]. This model, called the Ailment Topic Aspect Model (ATAM), identifies relevant tweets
by using a combination of keywords and associated topics. ATAM learns the symptoms and treatments
that are associated with specific ailments, and organizes the health terms into ailment groups. It then
separates the coherent ailment groups from the more general topics. ATAM identifies latent topic
information from a large dataset and enables browsing frequently co-occurring words [14]. In testing,
both ATAM and latent Dirichlet allocation (LDA) methods were applied to the same dataset. Human
intelligence was used to review the ATAM and LDA labels for ailment-related tweets. For the LDA
method, 45% agreed with the labels; for the ATAM method, 70% agreed with the labels. The ATAM
method produces more detailed ailment information through the inclusion of symptoms and treatments
as well. The data from this method was compared to influenza-like illness (ILI) data from the Centers
for Disease Control and Prevention (CDC). The Pearson’s correlation coefficient between the ATAM
frequencies and the CDC data was 0.934 (Google Flu Trends yielded a correlation of 0.932 with the
CDC). These results show that the ATAM method is capable of monitoring disease and providing
detailed information on occurring ailments.
      Gesualdo et al. designed and tested a minimally-trained algorithm for identifying ILI on
Twitter [15]. Using the definition of an ILI case from the European Centre for Disease Prevention
and Control, the authors created a Boolean search query for Twitter data. This query identifies all
of the tweets reporting a combination of symptoms that satisfies the query. The algorithm learns
technical and naïve terms to identify all of the jargon expressions that are related to a specific technical
term. It was trained based on pattern generalization using term pairs (one technical and one naïve;
e.g., emesis–vomiting). After training, the algorithm was able to extract basic health-related term
patterns from the web. The performance of this algorithm was manually evaluated by experts. One
hundred tweets satisfying the query were selected along with 500 random symptom-containing tweets.
These were evaluated by three of the authors independently, and the overall rate of precision was 0.97.
When compared to influenza trends reported by the United States (U.S.) Outpatient ILI Surveillance
Network (ILINet), the trends that the query found yielded a correlation coefficient of 0.981. The tweets
were also selected for geolocation purposes by identifying those with GPS, time zone, place code, etc.
The geolocated tweets were compared to the ILINet data to return a correlation coefficient of 0.980.
      Coppersmith, Dredze, and Harman analyzed mental health phenomena on Twitter through
simple natural language processing methods [16]. The focus of their study was on four mental health
conditions: (1) post-traumatic stress disorder (PTSD), (2) depression, (3) bipolar disorder, and (4)
seasonal affective disorder (SAD). Self-expressions of mental illness diagnosis were used to identify
the sample of users for this study. Diagnosis tweets were manually assessed and labeled as genuine or
not. Three methods of analysis were conducted. The first was pattern-of-life. This method looked at
social engagement and exercise as positive influences and insomnia as a sign of negative outcomes.
Sentiment analysis was also used to determine positive or negative outlooks. Pattern-of-life analysis
performs especially poorly in detecting depression, but surprisingly, it performs especially well in
detecting SAD. Another analysis method utilized was linguistic inquiry word count (LIWC), which
is a tool for the psychometric analysis of language data. LIWC is able to provide quantitative data
regarding the state of a patient from the patient’s writing. LIWC generally performed on par with
pattern-of-life analysis. A third means of analysis was language models (LMs). LMs were used to
estimate the likelihood of a given sequence of words. The LMs had superior performance compared to
the other analysis methods. The purpose of this study was to generate proof-of-concept results for the
quantification of mental health signals through Twitter.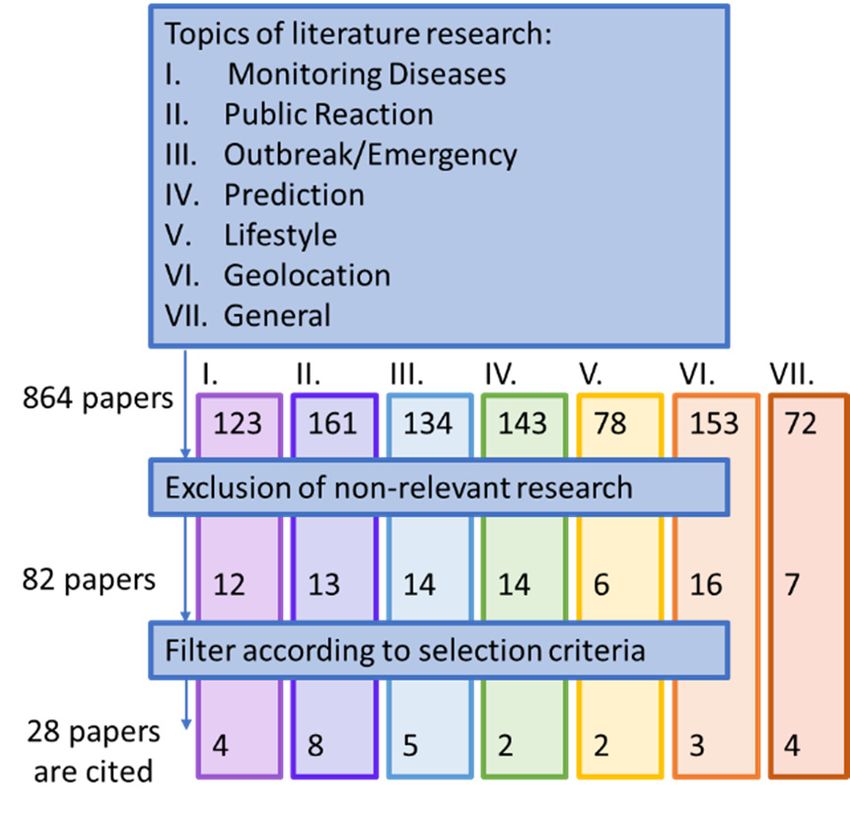
Data 2019, 4, 6                                                                                                                                                                                4 of 20

      Table 1. Summary of social media mining for disease-monitoring applications in Section 3.1. CDC: Centers for Disease Control and Prevention, ILI: influenza-like
      illness, ILINet: ILI Surveillance Network, LDA: latent Dirichlet allocation.

                                              Mining
          Author              Data                                Sample Size        Location/Language      Software                    Merits                           Limitations
                                             Technique
                            Google Flu    High recall word                                                                   Discovers larger number of
      Paul and Dredze                                                                                                                                           Lacks geolocation and temporal
                           Trends, CDC    filter with list of   1.6 million tweets       (English)            N/A           ailments than LDA with more
            [13]                                                                                                                                               information for tracking diseases.
                               data      20,000 key phrases                                                                      detailed information.
                                                                                                                            Tweets satisfying query have          Twitter not representative of
                                         APIs (application                                                                  correlation coefficient of 0.981   population; U.S. definition of ILI
       Gesualdo et al.                                                                 United States
                             ILINet       programming                 N/A                                     N/A              with ILINet. Geolocation         differs from the one used in this
           [15]                                                                         (English)
                                            interfaces)                                                                     yielded correlation coefficient    study; only one influenza season
                                                                                                                                        of 0.980.                           studied.
                                                                 3200 tweets per                                                Indications of different           Only identifies users who
     Coppersmith et al.
                              N/A           Twitter API          diagnosed user;         (English)            N/A             language patterns between        identify themselves as diagnosed
           [16]
                                                                   ~10 k users                                                  control and diagnosed.           with a mental health disorder.
                                                                                                           M-Eco, Tree
                                           Web crawling,                               (English and                                                              Only 5–20% of signals were
     Denecke et al. [17]      N/A                                  continuous                            Tagger, Stanford   Reduction of monitoring effort.
                                              APIs                                       German)                                                                   found to be relevant.
                                                                                                             Parser
Data 2019, 4, 6 5 of 20
Denecke et al. presented a prototype implementation of a disease surveillance system called
M-Eco that processes social media data for relevant disease outbreak information [17]. The M-Eco
system uses a pool of data from Twitter, blogs, forums, television, and radio programs. The data is
continuously filtered for keywords. Texts containing keywords are further analyzed to determine
their relevance to disease outbreaks, and signals are automatically generated by unexpected behaviors.
Signals are only generated when the threshold for the number of texts with the same word or phrase
has been exceeded. These signals, which are mainly generated from news agencies’ tweets, are again
analyzed for false alarms and visualized through geolocation, tag clouds, and time series. The M-Eco
system allows for searching and filtering the signals by various criteria.
3.2. Public Reaction
Adrover et al. [18] attempted to identify Twitter users who have HIV and determine if drug
treatments and their associated sentiments could be detected through Twitter (Table 2). Beginning with
a dataset of approximately 40 million tweets, they used a combination of human and computational
approaches, including keyword filtering, crowdsourcing, computational algorithms, and machine
learning, to filter the noise from the original data. The narrowed sample consisted of only 5443 tweets.
The small sample size and extensive manual hours dedicated to filtering, tagging, and processing the
data limited this method. However, the analysis of this data led to the identification of 512 individual
users who self-reported HIV and the effects of HIV treatment drugs, as well as a community of 2300
followers with strong, friendly ties. Around 93% of tweets provided information on adverse drug
effects. It was found that 238 of the 357 tweets were associated with negative sentiment, with only
78 positive and 37 neutral tweets.
Ginn et al. presented a corpus of 10,822 tweets mentioning adverse drug reactions (ADRs) for
training Twitter mining tools [19]. These tweets were mined from the Twitter application programming
interface (API) and manually annotated by experts with medical and biological science backgrounds.
The annotation was a two-step process. First, the original corpus of tweets was processed through a
binary annotation system to identify mentions of ADRs. ADRs, which are defined as “injuries resulting
from medical drug use”, were carefully distinguished from the disease, symptom, or condition that
caused the patient to use the drug initially. The Kappa value for binary classification was 0.69. Once the
ADR-mentioning tweets were identified, the second step, full annotation, began. The tweets were
annotated for identification of the span of expressions regarding ADRs and labeled with the Unified
Medical Language System for IDs. The final annotated corpus of tweets was then used to train two
different machine learning algorithms: Naïve Bayes and support vector machines (SVMs). Analysis
was conducted by observing the frequency and distribution of ADR mentions, the agreement between
the two annotators, and the performance of the text-mining classifiers. The performance was modest,
setting a baseline for future development.
Sarker and Gonzalez proposed a method of classifying ADRs for public health data by using
advanced natural language processing (NLP) techniques [20]. Three datasets were developed for the
task of identifying ADRs from user-posted internet data: one consisted of annotated sentences from
medical reports, and the remaining two were built in-house on annotated posts from Twitter and the
DailyStrength online health community, respectively. The data from each of the three corpora were
combined into a single training set to utilize in machine learning algorithms. The ADR classification
performance of the combined dataset was significantly better than the existing benchmarks with an
F-score of 0.812 (compared to the previous 0.77). Semantic features such as topics, concepts, sentiments,
and polarities were annotated in the dataset as well, providing a basis for the high performance levels
of the classifiers.
Behera and Eluri proposed a method of sentiment analysis to monitor the spread of diseases
according to location and time [21]. The goal of their research was to measure the degree of concern
in tweets regarding three diseases: malaria, swine flu, and cancer. The tweets were subjected to
a two-step sentiment classification process to identify negative personal tweets. The first step ofData 2019, 4, 6 6 of 20
classification consisted of a subjectivity clue-based algorithm to determine which tweets were personal
and which were non-personal (e.g., advertisements and news sources) The second step involved
applying lexicon-based and Naïve Bayes classifiers to the dataset. These classifiers distinguished
Data 2018, 3, x FOR PEER REVIEW 6 of 22
negative sentiment from non-negative (positive or neutral) sentiment. To improve the performance
of these classifiers,
involved negation
applying handlingand
lexicon-based andNaïve
Laplacian
BayesSmoothing
classifiers techniques were
to the dataset. combined
These with the
classifiers
algorithms. The best
distinguished performance
negative sentiment came
fromfrom the combination
non-negative (positive orofneutral)
Naïve sentiment.
Bayes andTonegation
improve handling
the
for a precision
performance of 92.56%
of these and an accuracy
classifiers, negationof handling
95.67%. and
After isolatingSmoothing
Laplacian the negative personal
techniques weretweets,
combined
the degree with the
of concern algorithms.
was measured. The best performance came from the combination of Naïve Bayes
and negation handling for
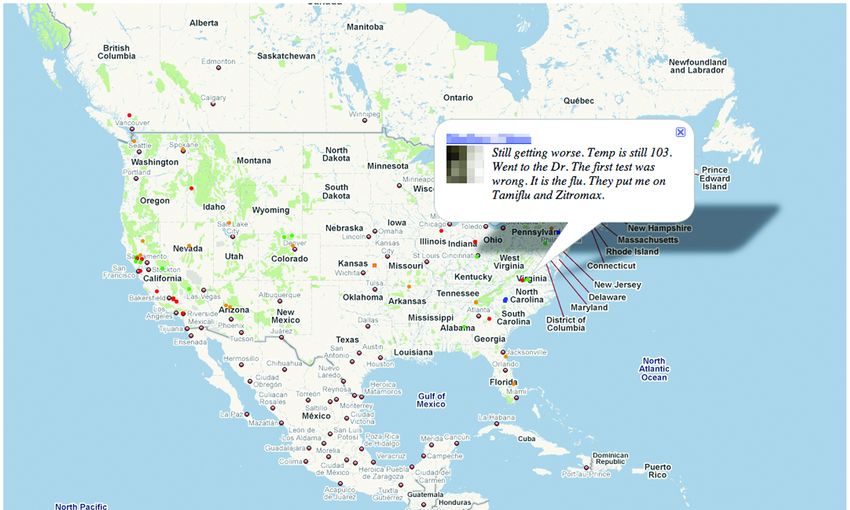
Signorini, Segre, and Polgreen studieda precision of 92.56%theand an accuracyofofTwitter
usefulness 95.67%. After
data isolating
in trackingthe the
negative personal tweets, the degree of concern was measured.
rapidly evolving public sentiment regarding H1N1 influenza and the actual disease activity [22].
Signorini, Segre, and Polgreen studied the usefulness of Twitter data in tracking the rapidly
Using keywords to filter the Twitter API and obtain a dataset of over 950,000 tweets, they time-stamped
evolving public sentiment regarding H1N1 influenza and the actual disease activity [22]. Using
and geolocated
keywords to each tweet
filter using API
the Twitter the author’s
and obtainself-declared home
a dataset of over location.
950,000 A they
tweets, JavaScript application
time-stamped
was developed
and geolocated each tweet using the author’s self-declared home location. A JavaScript applicationtweets
to display a continuously updating Google map of influenza and H1N1-related
according
was to their geographical
developed to display acontext. The tweets
continuously andGoogle
updating sentiments
map are depicted and
of influenza as color-coded
H1N1-related dots on
tweets
the map, according
as shown to their
in Figure geographical
2. Users context.
can scroll The dots
over the tweets and the
to read sentiments
related are depicted
tweets as
(see Figure 2).
color-coded dots on the map, as shown in Figure 2. Users can scroll over the dots
Estimates of ILI occurrence rates performed with an average error of 0.28%. When the geolocations of to read the related
tweets
the tweets (seefactored
were Figure 2).in,Estimates of ILI
the dataset occurrence
was reduced rates performed
due to the raritywith an average tweets.
of geotagged error of The
0.28%.average
When the geolocations of the tweets were factored in, the dataset was reduced due to the rarity of
error for regional ILI estimates was slightly higher at 0.37%. This study demonstrated the concept that
geotagged tweets. The average error for regional ILI estimates was slightly higher at 0.37%. This
Twitterstudy
traffic can be used to track public sentiment and concern, and potentially estimate the real-time
demonstrated the concept that Twitter traffic can be used to track public sentiment and
diseaseconcern,
activity and of potentially
H1N1 andestimate
ILIs. the real-time disease activity of H1N1 and ILIs.
2. Influenza
FigureFigure Google
2. Influenza Map
Google with
Map withhighlighted
highlighted tweet. Dotsonon
tweet. Dots thethe map
map depict
depict different
different flu-related
flu-related
tweetstweets that have
that have beenbeen geolocated
geolocated [22].
[22].
MyslínMyslín
et al.etstudied
al. studied
thethe public
public sentiment toward
sentiment toward tobacco
tobaccoandandtobacco-related
tobacco-relatedproducts through
products through
Twitter data [23]. Tweets were manually classified by two annotators to
Twitter data [23]. Tweets were manually classified by two annotators to identify genre,identify genre, theme, andtheme,
sentiment. From a cohort of 7362 tweets mined through the Twitter API, 57.3% (4215) were classified
and sentiment. From a cohort of 7362 tweets mined through the Twitter API, 57.3% (4215) were
as tobacco-related. The tweets were then used to train machine learning classifiers to distinguish
classified as tobacco-related.
between tobacco-related andThe tweetstweets
irrelevant wereasthen
well used to train
as positive, machine
negative, learning
or neutral classifiers
sentiment in to
distinguish between tobacco-related and irrelevant tweets as well as positive,
tweets. Three machine learning algorithms were tested in this study: SVM, Naïve Bayes, and negative, or neutral
sentiment in tweets.
K-Nearest Three(KNN).
Neighbors machineThelearning algorithms
F-score for werebetween
discriminating tested tobacco-related
in this study: SVM, Naïve Bayes,
and irrelevant
and K-Nearest
tweets was Neighbors
0.85. The SVMs (KNN).
yieldedThe F-score
the highest for discriminating
performance. between
Overall, sentiment tobacco-related
toward tobacco was and
found
irrelevant to be more
tweets was positive (1939/4215,
0.85. The 46%) than
SVMs yielded thenegative
highest(1349/4215, 32%) or
performance. neutral (see
Overall, Figure 3).
sentiment toward
These values were found even after the advertising tweets (9%) were excluded.
tobacco was found to be more positive (1939/4215, 46%) than negative (1349/4215, 32%) or neutralWords relating toData 2019, 4, 6 7 of 20
(see Figure 3). These values were found even after the advertising tweets (9%) were excluded. Words
Data 2018, 3, x FOR PEER REVIEW 7 of 22
relating to hookah or e-cigarettes were highly predictive of positive sentiment, while more general
terms related
hookah to tobacco were predictive
or e-cigarettes were highlyofpredictive
negative ofsentiment. This suggests
positive sentiment, whilegaps
moreingeneral
public terms
knowledge
regarding newer
related tobaccowere
to tobacco products. This
predictive study was
of negative limited
sentiment. bysuggests
This the number
gaps inofpublic
keywords that were
knowledge
regarding
used to find newer tobacco
tobacco-related products.
tweets. This study
While was limited
the novelty by the
effects number of
of hookah keywords
and that were
e-cigarettes were not
used to find tobacco-related tweets. While the novelty effects of hookah and e-cigarettes were not
considered in the analysis, this work demonstrated the capabilities of machine learning classifiers
considered in the analysis, this work demonstrated the capabilities of machine learning classifiers
trained on Twitter data to determine public sentiment and identify areas to direct public health
trained on Twitter data to determine public sentiment and identify areas to direct public health
information dissemination.
information dissemination.
3. Public
FigureFigure sentiment
3. Public ofoftweets
sentiment tweets by searchkeyword
by search keyword [23].
[23].
Ji et al. used
Ji et Twitter
al. used to trackto
Twitter thetrack
spread of public
the spread of concern regarding
public concern epidemics
regarding [24].[24].
epidemics Their methods
Their
included separating tweets into personal and news (non-personal) categories to focus on public
methods included separating tweets into personal and news (non-personal) categories to focus on
concern. public concern. tweets
The personal The personal tweets were
were further further
classified classified
into personal intonegative
personal and
negative and personal
personal non-negative,
non-negative, depending on the sentiment detected. Training data auto-generated from an
depending on the sentiment detected. Training data auto-generated from an emotion-oriented,
emotion-oriented, clue-based method was used to train and test three different machine learning
clue-based method was used to train and test three different machine learning models. The tweets
models. The tweets that were classified as personal negative were used to generate a Measure of
that wereConcern
classified(MOC) as personal
and formatnegative
the MOC were used toThe
to a timeline. generate a Measure
MOC timeline of Concern
was compared to a(MOC)
news and
format thetimeline. The peaks were compared to find a Jaccard correlation coefficient with a range of 0.2–0.3. were
MOC to a timeline. The MOC timeline was compared to a news timeline. The peaks
compared These results
to find are insufficient
a Jaccard for predictions.
correlation coefficientHowever, some MOC
with a range peaks These
of 0.2–0.3. alignedresults
with newsare peaks
insufficient
on the timeline, suggesting that the general public expresses negative
for predictions. However, some MOC peaks aligned with news peaks on the timeline, suggesting emotions when news activity that
increases.
the general public expresses negative emotions when news activity increases.
Colleta et al. studied the public sentiment classification of tweets using a combination of SVM
Colleta
and et al. studied
cluster ensemble thetechniques
public sentiment
[25]. This classification
algorithm, named of tweets usingisacapable
the C3E-SL, combination of SVM and
of combining
cluster ensemble techniques [25]. This algorithm, named the C 3 E-SL, is capable of combining classifiers
classifiers with cluster ensembles to refine tweet classifications from additional information
with cluster ensembles
provided to refine
by the clusters. tweet
Four classifications
different categories offrom
tweetsadditional
were used to information
train and testprovided
the C3E-SLby the
clusters. algorithm. The first
Four different set consisted
categories of 621 training
of tweets tweets
were used to (215
trainpositive andthe
and test 3
406Cnegative) related to the
E-SL algorithm. The first
topic of
set consisted of health care reform.
621 training The (215
tweets second set, the Obama–McCain
positive and 406 negative) debate, was made
related to theup topic
of 3238oftweets.
health care
Neutral tweets were removed, leaving only 1906 (710 positive and 1196 negative) to be used for
reform. The second set, the Obama–McCain debate, was made up of 3238 tweets. Neutral tweets were
training. The third set contained 1224 tweets (570 positive and 654 negative) related to Apple,
removed,Google,
leaving only 1906
Microsoft, and(710 positive
Twitter. and set
The final 1196 negative)
consisted to manually
of 359 be used for training.
annotated The(182
tweets third set
contained 1224 tweets (570 positive and 654 negative) related to Apple, Google, Microsoft, and Twitter.
The final set consisted of 359 manually annotated tweets (182 positive and 177 negative) from a study
completed at Stanford [26]. The results demonstrated that the C3 E-SL algorithm performed better than
the SVM classifier alone and was competitive with the highest performances found in the literature.Data 2019, 4, 6 8 of 20
Table 2. Summary of social media mining for public reaction applications as in Section 3.2. ADR: adverse drug reactions, API: application programming interface,
NLP: natural language processing, SVM: Support Vector Machines.
Mining Location/
Author Data Sample Size Software Merits Limitations
Technique Language
Few users tweet about HIV and
Adrover et al. [18] N/A Gnip Inc. ~40 million tweets (English) N/A Accurate reporting of toxicities
adverse treatment effects.
Able to train Naïve Bayes and Modest performance. Many
Ginn et al. [19] N/A Twitter API 187,450 tweets (English) N/A
SVMs algorithms manual annotations for accuracy.
10,822 tweets, 10,617
daily-strength Use of advanced NLP
Sarker and ADE (medical Ongoing ADR Subject to error through
comments, 6821 (English) N/A techniques significantly
Gonzalez [20] case reports) research misinterpretation.
mentions in medical improves F-scores
reports
Classifies tweets as positive,
Behera and Eluri, No comparison of results to
N/A Twitter API ~4500 tweets unknown N/A negative, or neutral with high
[21] known disease epidemic data.
precision and accuracy
Few tweets are geotagged,
Average error for ILI estimates
United States making regional estimates harder
Signorini et al. [22] CDC data Twitter API 951,697 tweets JavaScript is 0.28%, and for regional ILI
(English) to obtain. No comparable data;
estimates is 0.37%
results cannot be verified
Identified overall positive Small annotated dataset, limited
sentiment toward tobacco, keywords in identifying
Myslin et al. [23] N/A Twitter API 7362 tweets (English) N/A
specifically hookah, and tobacco-related tweets, novelty
e-cigarettes effects not considered.
Irony, sarcasm, and profanity
Some measure of concern
make machine learning difficult.
Ji et al. [24] News data Twitter API unknown (English) N/A timeline peaks correlated with
All correlation results
news timeline peaks
inconclusive.
High accuracy ratings in all
Other combinations of classifiers
Literature Dataset (1) 621, (2) United States four datasets (1. 79.62%,
Coletta et al. [25] Twitter API N/A and cluster ensembles not
results 3238, (3) 1224, (4) 359 (English) 2. 75.18%, 3. 82.15%,
considered.
4. 77.69–81.84%)Data 2019, 4, 6 9 of 20
3.3. Outbreak and Emergency
France and Christopher Cheong used Twitter to conduct a social network analysis case study for
the floods of Queensland, New South Wales, and Victoria, Australia, from March 2010 to February
2011 (Table 3) [27]. The research goal was to identify the main active users during these events,
and determine their effectiveness in disseminating critical information regarding the crisis. Two types
of networks were generated for each of the three flood-affected sites: a “user” network based on
the responses of users to certain tweets, and a “user-resources” network connecting user tweets
to the included resource links. The most active users were found to be local authorities, political
personalities, social media volunteers, traditional media reporters, and nonprofit, humanitarian,
and community organizations.
Odlum and Yoon collected over 42,000 tweets related to Ebola during the outbreak in summer
2014 [28]. This Twitter data was analyzed to monitor the trends of information spread, examine early
epidemic detection, and determine public knowledge and attitudes regarding Ebola. Throughout
the summer, a gradual increase was detected in the rate of information dissemination. An increase
in Ebola-related Twitter activity occurred in the days prior to the official news alert. This increase is
indicative of Twitter’s potential in supporting early warning systems in the outbreak surveillance effort.
The four main topics found in Ebola-related tweets during the epidemic were risk factors, prevention
education, disease trends, and compassion toward affected countries and citizens. The public concern
regarding Ebola nearly doubled on the day after the CDC’s health advisory.
Missier et al. studied the performance of two different approaches to detecting Twitter data
relevant to dengue and other Aedes-borne disease outbreaks in Brazil [29]; both supervised classification
and unsupervised clustering using topic modeling performed well. The supervised classifier identified
four different classes of topics: (1) mosquito focus was the most directly actionable class; (2) sickness
was the most informative class; (3) news consisted of indirectly actionable information; and (4) jokes
made up approximately 20% of the tweets studied, and were regarded as noise. It was difficult to
distinguish jokes from relevant tweets due to the prevalence of common words and topics. A training
set of 1000 tweets was manually annotated and used to train the classifier. Another set of 1600 tweets
was used to test the classifier, and resulted in an accuracy range of 74–86% depending on the class.
Over 100,000 tweets were harvested for the LDA-based clustering. A range of two to eight clusters were
formed, and interclustering and intraclustering were calculated to determine the level of distinction
between clusters. The intraclustering was found to be over double that of interclustering, indicating
that the clusters were well separated. Overall, clustering using topic modeling was found to offer less
control over the content of the topics than a traditional classifier. However, the classifier required a lot
of manual annotations, and was thus costlier than the clustering method.
Schulz et al. presented an analysis of a multi-label learning method for classification of
incident-related Twitter data [30]. Tweets were processed using three different methods (binary
relevance, classifier chains, and label powerset) to identify four labels: (S) Shooting, (F) Fire,
(C) Crash, and (I) Injury. Each approach was analyzed for precision, recall, exact match, and h-loss.
Keyword-based filtering yielded poor results in each evaluation category, indicating that it is
inadequate for multi-label classification. It was found that the correlation between labels needs
to be taken into account for classification. The classifier chains method is able to outperform the other
methods if a cross-validation is performed on the training data. Overall, it was found that multiple
labels were able to be detected with an exact match of 84.35%.Data 2019, 4, 6 10 of 20
Table 3. Summary of social media mining for outbreak and emergency applications as in Section 3.3. NSW: New South Wales, QLD: Queensland, SNA:
social network analysis.
Mining
Author Data Sample Size Location/ Language Software Merits Limitations
Technique
In-house script 6014 QLD tweets, SNA capable of identifying Queensland flood data was only
Cheong and
N/A with list of 384 NSW tweets, Australia (English) N/A most active users, patterns, and collected post-flood. Nature and
Cheong [27]
hashtags (#) and 1122 Vic tweets tweet frequencies quality of tweets undetermined.
Global, mainly Single language. Used
Odlum andYoon Google Chrome Collected useful data during
N/A 42,236 tweets Africa, Europe, and NCapture self-reported location
[28] NCapture Ebola outbreak of 2014
America (English) information.
Manual annotations limit the
Classifier accuracy of 84.4%.
Manual 1000, 1600, and classifier. Clear segregation
Missier et al. [29] N/A Brazil (Portuguese) N/A Clear distinction between
annotations 100,000 tweets difficult to achieve in the
clusters
clustering method.
Keyword-based filtering
Exact match of 84.35% for inadequate. Injury difficult to
Schulz et al. [30] N/A unknown unknown (English) Mulan
identification of multiple labels identify. Misclassifications due to
assignment to “no incident” label.
Brazilian
Number of tweets and official No discussion or analysis of
Gomide et al. [31] Health Twitter API 465,444 tweets Brazil (Portuguese) N/A
data correlated to R2 = 0.9578 results presented.
MinistryData 2019, 4, 6 11 of 20
Gomide et al. proposed a four-dimensional active surveillance methodology for tracking dengue
epidemics in Brazil using Twitter [31]. The four dimensions were volume (the number of tweets
mentioning “dengue”), time (when these tweets were posted), location (the geographic information
of the tweets), and public perception (overall sentiment toward dengue epidemics). The number of
dengue-related tweets was compared to official statistics from the same time period obtained from the
Brazilian Health Ministry, and an R2 value of 0.9578 was obtained. The time and location information
were combined to predict areas of outbreak. A clustering approach was used to find cities in close
proximity to each other with similar dengue incidence rates at the same time. The Rand index value
was found to be 0.8914.
3.4. Prediction
Santos and Matos investigated the use of tweets and search engine queries to estimate the
incidence rate of influenza (Table 4) [32]. In this study, tweets regarding ILI were manually classified
as positive or negative according to whether the message indicated that the author had the flu.
These tweets were then used to train machine learning models to make the positive or negative
classification for the entire set of 14 million tweets. After classification, the Twitter-generated influenza
incidence rate was compared to epidemiological results from Influenzanet, which is a European-wide
network for flu surveillance. In addition to the Twitter data, 15 million search queries from the SAPO
((Online Portuguese Links Server)) search platform were included in the analysis. A linear regression
model was applied to the predicted influenza trend and the Influenzanet data to result in a correlation
value of approximately 0.85.
To test the accuracy of the models in predicting influenza incidence from one flu season to the
next, more linear regression models were implemented. The data generated was then compared to the
weekly incidence rate reported by the European Influenza Surveillance Network (EISN). The predicted
trend appeared to be a week ahead of the EISN report. Interestingly, in this comparison, the flu
trend was overestimated by the model in week nine. The EINS did not show the exaggerated rate of
influenza; however, media reports and the National Institute of Health demonstrate a high incidence
rate in Portugal at the time. This study demonstrated the ability of the models to correlate as well as
0.89 to Influenzanet and across seasons, with a Pearson correlation coefficient (r) value of 0.72.
Kautz and Sadilek proposed a model to predict the future health status (“sick” or “healthy”) of
an individual with accuracy up to 91% [33]. This study was conducted using 16 million tweets from
one month of collection in New York City. Users who posted more than 100 GPS-tagged tweets in the
collection month (totaling 6237 individual users) were investigated by data mining regarding their
online communication, open accounts, and geolocated activities to describe the individual’s behavior.
Specifically, the locations, environment, and social interactions of the users were identified. Locations
were determined through GPS monitoring, and used to count visits to different ‘venues’ (bars, gyms,
public transportation, etc.), physical encounters with sick individuals (defined as co-located within
100 m), and the ZIP code of the individual (found by analyzing the mean location of a user between
the hours of 01:00–06:00). The environment of the user was also determined through GPS, as well
as the relative distance of the user to pollution sources (factories, power plants, transportation hubs,
etc.). The social interactions of a user were determined through their online communication (Figure 4).
Social status was analyzed using the number of reciprocated ‘follows’ on Twitter, mentions of the
individual’s name, number of ‘likes’ and retweets, and through the PageRank calculation. Applying
machine learning techniques to mined data, researchers were able to find the feature that was most
strongly correlated with poor health: the proximity to pollution sources. Higher social status was
strongly correlated with better health, while visits to public parks was also positively correlated with
improved health. Overall, the model explained more than 54% of the variance in people’s health.Data 2019, 4, 6 12 of 20
Data 2018, 3, x FOR PEER REVIEW 14 of 22
Figure 4. Social network
network ofof user
useruu(center)
(center)overlaid
overlaidon
onaamap
mapofofNew
NewYork
York City.
City. Each
Each line
line is aisfriend
a friend
of
of user
user u; red
u; red lines
lines areare sick
sick friends;
friends; green
green lines
lines areare healthy
healthy [33].
[33].
The methods
3.5. Public Lifestyle used in this study infer “sick” versus “healthy” from brief messages, leaving room
for misinterpretation. The visits to certain venues and interactions with sick individuals may be
Pennacchiotti and Popescu proposed a system for user classification in social media (Table 5)
false positives. In addition, some illness may be overreported or underreported via social media.
[34]. This team focused on classifying users according to three criteria: political affiliation (Democrat
Thus, controlling for misrepresentations of the occurrence of illnesses must be improved through
or Republican), race (African American or other, in this case), and potential as a customer for a
cross-referencing social media reports with other sources of data.
particular business (Starbucks). Their machine learning framework relied on data from user profile
accounts,
3.5. Publicuser tweeting behavior (i.e., number of tweets per day, number of replies, etc.), linguistic
Lifestyle
content (main topics and lexical usage), and the social network of the user. The combination of all the
Pennacchiotti and Popescu proposed a system for user classification in social media (Table 5) [34].
features is more successful in classifying users than any individual feature. This framework was
This team focused on classifying users according to three criteria: political affiliation (Democrat or
most successful in identifying the political affiliation of users. The features that were most accurate
Republican), race (African American or other, in this case), and potential as a customer for a particular
for this task were the social network and followers of the user, followed by the linguistic and profile
business (Starbucks). Their machine learning framework relied on data from user profile accounts,
features. The most difficult category was race, with values near 0.6–0.7. Linguistic features were
user tweeting behavior (i.e., number of tweets per day, number of replies, etc.), linguistic content (main
most accurate for this task.
topics and lexical usage), and the social network of the user. The combination of all the features is
Prier et al. proposed the use of LDA for topic modeling Twitter data [14]. LDA was used to
more successful in classifying users than any individual feature. This framework was most successful
analyze terms and topics from a dataset of over two million tweets. The topic model identified a
in identifying the political affiliation of users. The features that were most accurate for this task
series of conversational topics related to public health, including physical activity, obesity, substance
were the social network and followers of the user, followed by the linguistic and profile features.
abuse, and healthcare. Unfortunately, the LDA method of analysis was unable to detect less
The most difficult category was race, with values near 0.6–0.7. Linguistic features were most accurate
common topics, such as the targeted topic of tobacco use. Instead, the researchers built their own
for thislist
query task.
by which to find tweets. The query list included terms such as “tobacco”, “smoking”,
“cigarette”,et“cigar”,
Prier al. proposed the use ofBy
and “hookah”. LDA formodeling
topic topic modeling Twitter
this tobacco data
data [14]. LDA
subset, was used
they were able to
to
analyze terms and topics from a dataset of over two million
gain understanding of how Twitter users are discussing tobacco usage. tweets. The topic model identified a
series of conversational topics related to public health, including physical activity, obesity, substance
abuse, and healthcare. Unfortunately, the LDA method of analysis was unable to detect less common
topics, such as the targeted topic of tobacco use. Instead, the researchers built their own query list by
which to find tweets. The query list included terms such as “tobacco”, “smoking”, “cigarette”, “cigar”,
and “hookah”. By topic modeling this tobacco data subset, they were able to gain understanding of
how Twitter users are discussing tobacco usage.Data 2019, 4, 6 13 of 20
Table 4. Summary of social media mining for prediction applications as in Section 3.4.
Mining Location/
Author Data Sample Size Software Merits Limitations
Technique Language
NLP Toolkit, Trained regression models The narrow scope of the
Santos and Matos SVM, Scikit-learn ~14 million tweets, Portugal
Influenzanet Scikit-learn applied from one season to the Portuguese language. Correlation
[32] toolkit ~15 million queries (Portuguese)
Toolkit next. ratios could be improved.
SVM, regression
New York City, Subject to false positives from
Sadilek and Kautz decision trees, Predicted future health of
Census data ~16 million tweets New York, U.S. PageRank both interpretation of messages
[33] least-squares individuals with 91% accuracy.
(English) as well as GPS data.
regression
Table 5. Summary of social media mining for public lifestyle applications as in Section 3.5.
Mining Location/
Author Data Sample Size Software Merits Limitations
Technique Language
Linguistic features used to
Pennacchiotti and United States Opinion >0.8 accuracy in identifying
N/A Twitter API 15,000 users identify ethnicity adopted by
Popescu [34] (English) Finder 1.5 political affiliation.
other ethnicities.
United States: GA,
2,231,712 tweets for
ID, IN, KS, LA, Extracts valuable topics from Twitter demographics may not be
Prier et al. [14] N/A Twitter API comprehensive, 1963 N/A
MA, MS, OR, and large datasets. representative.
tweets for tobacco subset
PA. (English)Data 2019, 4, 6 14 of 20
3.6. Geolocation
Dredze et al. introduced a system to determine the geographic location of tweets through the
analysis of “Place” tags, GPS positions, and user profile data (Table 6) [35]. The purpose of the proposed
system, called Carmen, was to assign a location to each tweet from a database of structured location
information. “Place” tags on tweets associate a location with the message. These tags may include
information such as the country, city, geographical coordinates, business name, or street address. Other
tweets are GPS-tagged, and include the latitude and longitude coordinates of the location. The user
profile contains a field where the user can announce their primary location. However, the profiles are
subject to false information or nonsensical entries (i.e., “Candy Land”). User profiles are insufficient in
accounting for travel as well. Carmen uses a combination of factors to infer the origin of the tweet.
This system analyzes the language of the tweet, the “Place” and GPS tags, and the profile of the user.
This information can provide the country, state, county, and city from which the tweet originated.
Health officials may utilize Carmen’s geolocation to track the occurrence of disease rates and prevent
and manage outbreaks. Traditional systems rely on patient clinical visits, which take up to two weeks
to publish. However, with this system, officials can use Twitter to find the possible areas of outbreaks
in real time, improving reaction time.
Yepes et al. proposed a method for analyzing Twitter data for health-related surveillance [36].
To conduct their analysis, this group obtained 12 billion raw tweets from 2014. These tweets
were filtered to include tweets only in the English language and excluded all retweets. Prior to
filtering, heuristics were applied to the dataset. An in-domain medical named entity recognizer,
called Micromed, was used to identify all of the relevant tweets. Micromed uses supervised learning,
having been trained on 1300 manually annotated tweets. This system was able to recognize three
medical entities: diseases, symptoms, and pharmacological substances. After filtering the tweets,
MALLET (machine learning for language toolkit) was used to group the tweets by topic. An adapted
geotagging system (LIW-meta) was used to determine geographic information from the posts.
LIW-meta uses a combination of explicit location terms, implicit location-indicative words (LIW),
and user profile data to infer geolocations from the tweets that lack GPS labels. The results of their
work yielded geotagging with 0.938 precision. Yepes also observed that tweets mentioning terms such
as “heart attack” are frequently used in the figurative sense more than in the medical sense when
posting on social media. Other figurative usage of terms includes the use of “tired” to mean bored
or impatient rather than drowsiness as a symptom. However, the usage of some pharmacological
substance words, such as “marijuana” and “caffeine” are more likely to be indicative of the frequency
of people using these substances.
Prieto et al. proposed an automated method for measuring the incidence of certain health
conditions by obtaining Twitter data that was relevant to the presence of the conditions [37]. A two-step
process was used to obtain the tweets. First, the data was defined and filtered according to specially
crafted regular expressions. Secondly, the tweets were manually labeled as positive or negative for
training classifiers to recognize the four health states. The health conditions that were studied were
influenza, depression, pregnancy, and eating disorders. To begin the filtering, tweets originating in
Portugal and Spain were selected using Twitter search API and geocoding information from the Twitter
metadata. A language detection library was used to filter tweets that were not in Portuguese or Spanish.
Once the tweets of the correct origin and language were identified, machine learning was applied to
the data in order to filter out tweets that were not indicative of the person having the health condition.
Finally, feature selection was applied to the data. Classification results of 0.7–0.9 in the area under the
receiver operating characteristic (ROC) curve (AUC) and F-measure were obtained. The number of
features was reduced by 90% by feature selection algorithms such as correlation-based feature selection
(CFS), Pearson correlation, Gain Ration, and Relief. Classification results were improved with the
feature selection algorithms by 18% in AUC and 7% in F-measure.Data 2019, 4, 6 15 of 20
3.7. General
Tuarob et al. proposed a combination of five heterogeneous base classifiers to address the
limitations of the traditional bag-of-words approach to discover health-related information in social
media (Table 7) [38]. The five classifiers that were used were random forest, SVM, repeated incremental
pruning to produce error reduction, Bernoulli Naïve Bayes, and multinomial Naïve Bayes. Over 5000
hand-labeled tweets were used to train the classifiers and cross-validate the models. A small-scale and
a large-scale evaluation were performed to investigate the proposed model’s abilities. The small-scale
evaluation used a 10-fold cross-validation to tune the parameters of the proposed model and compare
it with the state-of-the-art method. The proposed model outperformed the traditional method by
18.61%. The large-scale evaluation tested the trained classifiers on real-world data to verify the ability
of the proposed model. This evaluation demonstrated a performance improvement of 46.62%.
Sriram developed a new method of classifying Twitter messages using a small set of authorship
features that were included to improve the accuracy [39]. Tweets were classified into one of five
categories focused on user intentions: news, events, opinions, deals, and private messages. The features
extracted from the author’s profile and the text were used to classify the tweets through three
different classifiers. The fourth classifier, bag-of-words (BOW), was used to process tweets without
the authorship features. It was considered a baseline because of its popularity in text classification.
Compared to the BOW approach, each classifier that used the authorship features had significantly
improved accuracy and processing time. The greatest number of misclassified tweets was found
between News and Opinions categories.
Lee et al. proposed a method of classification of tweets based on Twitter Trending Topics [40].
Tweets were analyzed using text-based classification and network-based classification to fit into one of
18 categories such as sports, politics, technology, etc. For text-based classification, the BOW approach
was implemented. In network-based classification, the top five similar topics for a given topic were
identified through the number of common influential users. Each tweet could only be designated as
falling into one category, which led to increased errors.
Parker et al. proposed a framework for tracking public health conditions and concerns via
Twitter [41]. This framework uses frequent term sets from health-related tweets, which were filtered
according to over 20,000 keywords or phrases, as search queries for open-source resources such as
Wikipedia, Mahout, and Lucene. The retrieval of medical-related articles was considered an indicator
of a health-related condition. The fluctuating frequent term sets were monitored over time to detect
shifts in public health conditions and concern. This method was found to identify seasonal afflictions.
However, no quantitative data was reported.You can also read


