Google Analytics for Government - Second Edition By Sarah Kaczmarek, May 2014
←
→
Page content transcription
If your browser does not render page correctly, please read the page content below
Google Analytics for Government
Second Edition
By Sarah Kaczmarek, May 2014
GOOGLE ANALYTICS FOR GOVERNMENT
                                                           Second Edition

Table of Contents
PART 1: INTRODUCTION ...................................................................................................... 2
  WELCOME TO THE SECOND EDITION OF GOOGLE ANALYTICS FOR GOVERNMENT ............................. 2
  GOOGLE ANALYTICS 101 .................................................................................................. 3
  YOU HAVE THE DATA, MAKE THE MOST OF IT ........................................................................ 4
PART 2: GETTING STARTED ................................................................................................... 6
  LESSON 1: HOW TO START USING GOOGLE ANALYTICS AT YOUR AGENCY ....................................... 6
  LESSON 2: WEB PROPERTIES, VIEWS, ADDING NEW USERS ......................................................... 9
  LESSON 3: STRUCTURAL OVERVIEW .................................................................................... 11
  LESSON 4: WORKING WITH DATA AND USING TABLES .............................................................. 13
PART 3: INTERPRETING CORE REPORTS ................................................................................... 19
  LESSON 5: AUDIENCE REPORTS .......................................................................................... 19
     OVERVIEW: PAGEVIEWS, VISITS, AND VISITORS ................................................................... 19
     TIME METRICS ........................................................................................................... 22
     VISITOR INFORMATION ................................................................................................ 24
  LESSON 6: ACQUISITION REPORTS ...................................................................................... 30
     CAMPAIGNS .............................................................................................................. 31
     KEYWORDS .............................................................................................................. 33
  LESSON 7: BEHAVIOR REPORTS .......................................................................................... 34
     SITE CONTENT .......................................................................................................... 34
     SITE SEARCH REPORTS ................................................................................................. 35
     IN-PAGE ANALYTICS .................................................................................................... 37
  LESSON 8: CONVERSION REPORTS ...................................................................................... 38
     SETTING UP GOALS ..................................................................................................... 39
PART 4: CUSTOMIZATION .................................................................................................... 42
  LESSON 9: DASHBOARDS .................................................................................................. 42
  LESSON 10: INTELLIGENCE EVENTS ...................................................................................... 45
  LESSON 11: REAL-TIME REPORTS ....................................................................................... 46
  LESSON 12: CREATING AND E-MAILING CUSTOM REPORTS ......................................................... 48
PART 5: IN-DEPTH ANALYSIS ................................................................................................ 50
  LESSON 13: ADVANCED SEGMENTATION ............................................................................... 50
  LESSON 14: FILTERS ........................................................................................................ 52
     CUSTOM FILTERS........................................................................................................ 53
  LESSON 15: REGULAR EXPRESSIONS (REGEX) ......................................................................... 56
  LESSON 16: EVENT TRACKING AND VIRTUAL PAGEVIEWS........................................................... 58
  LESSON 17: CONTENT EXPERIMENTS ................................................................................... 60
PART 6: GLOSSARY OF TERMS ............................................................................................... 61

                                                                                                                                   1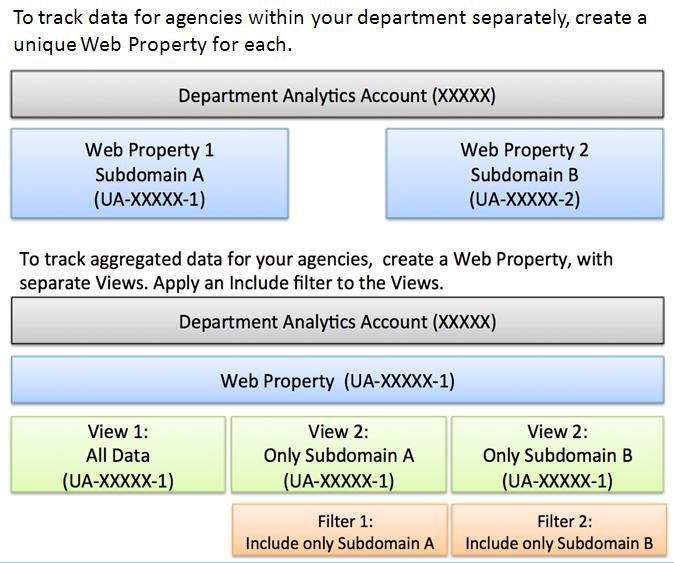
Part 1: Introduction
Welcome to the Second Edition of Google Analytics for Government
Two years ago when I set out to write a manual on using Google Analytics to improve government websites, I never
imagined how far this manual would travel. I’ve been impressed by the reception to the manual and I’ve greatly
appreciated hearing from its users. I wrote the first edition with other federal government workers in the United
States in mind as the primary audience. I wasn’t thinking about a more global applicability of these lessons. Since its
release, I’ve heard from people working in local, state, and federal offices throughout the country, as well as from
public sector workers in the Canada, the United Kingdom, and even from the World Bank and United Nations. I have
also hosted a series of webinars with the General Services Administration’s (GSA) Digital Government University,
presented with GovLoop and LunaMetrics, and started teaching for Georgetown University. I’m glad to report that
the goal of making government websites more useful to the digital citizen resonates with such a wide audience.

The second edition of the manual has gone through a fairly extensive rewrite. I’ve had the opportunity to listen and
learn from people who have shared their stories with me, so I have drawn from those experiences and included new
actionable insights. I’ve made additions to the manual as well. Some of the new sections include demographics and
interests reports, using real-time data, and campaign tracking. I also mirror updates in terminology for setting up
accounts, managing users, and standard reporting.

In addition to updating this manual, I have made resources available on my website www.SarahKaczmarek.com.
There you can find a series of reporting templates (weekly, quarterly, and annual) that you can use to help tell the
story of your data. You can also watch training videos, find information on upcoming presentations, and register for
my classes at Georgetown.

I hope this manual provides you with the tools you need to identify meaningful metrics to improve your website.
Regardless of whether you work in communications or information technology, you can use this manual to
understand how to tailor Google Analytics for your agency’s needs. While you might not be the person who creates
new custom segments or configures the internal site search, understanding these concepts will help you communicate
effectively about these topics and ensure your agency gets the most out of Google Analytics. When I first started
working with Google Analytics for my agency, I had no background on using analytic tools to evaluate websites. As I
learned more, I found it provides invaluable information to make informed decisions on website enhancements.

Thank you for your interest in Google Analytics for Government. I hope that you too will be successful in
implementing these strategies to make your government website as useful as possible to the digital citizen. Thanks
also to the U.S. Government Accountability Office for allowing me to share the best practices that I’ve learned since
starting to use Google Analytics for gao.gov.

All views and opinions expressed are my own.

Sarah Kaczmarek
Digital Communications Manager, U.S. Government Accountability Office
Adjunct Faculty Member, Georgetown University School of Continuing Studies

www.SarahKaczmarek.com, Twitter.com/studiosarah, kaczmareks@gao.gov

2
Google Analytics 101
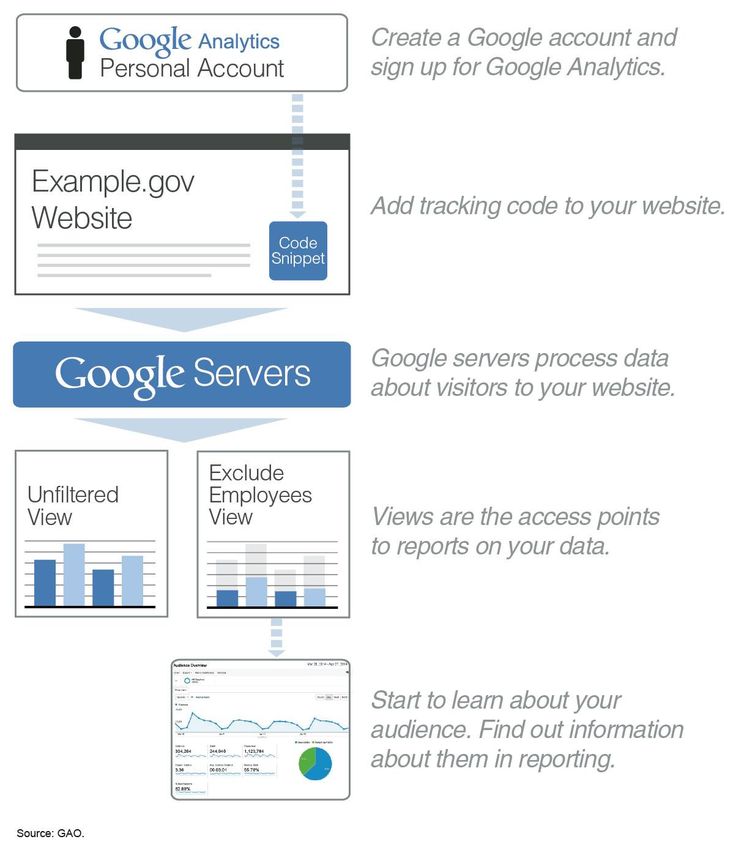
Google Analytics Standard is a free service that tracks statistics about your users to give you insight into how visitors
get to your site, how they use your site, and how you might be able to provide a better user experience to keep them
coming back.1 To get started you will create a Google account and sign up for Google Analytics. It will generate a
small piece of code that you need to add to any page on your site that you want to track. The code use cookies to
collect data for your web property (all the pages where a set of tracking code is installed). Then, Google Analytics
will help you view the collected data in reports. Here’s an overview of the process.
Overview of how Google Analytics works
1
There are some data collection limits to a Google Analytics Standard account. If your website gets more than 10 million hits a
month there is no assurance that the excess hits will be processed. Also, data sampling occurs automatically when more than
500,000 visits are collected for a given report, meaning a subset of data from your traffic is used to report on trends detected in
that sample set. Google Analytics offers a paid premium option with higher data processing power for $150,000 a year.
3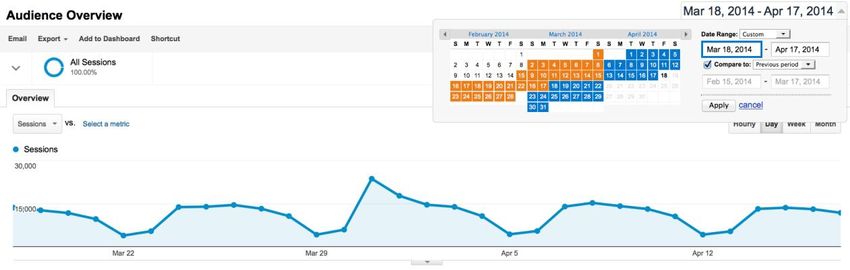
You Have the Data, Make the Most of It

You have the data to see what citizens really want on your website and how well you are delivering. You have an
opportunity to make informed decisions on improvements to your site to reflect the voice of the customer and get
constituents what they need.

Step 1: Measure

Google Analytics provides a lot of data, and it can be a bit daunting when you first start. Trust that you know what is
important to communicate on your site, and go from there. Consider key questions you have about how your website
performs and look to the data to provide you detailed and concrete answers. In my analysis I focus on a core set of
questions:

         How many people are connecting with our online content?
         Who are our visitors?
         How engaged are they?
         What content were visitors searching for?
         How do visitors navigate through our website?
         What’s popular and what’s not?

Step 2: Analyze

Keep in mind that throughout your analysis, it’s important to interpret your metrics in context.

         Consider the purpose of your site. Take your bounce rate for example (the percentage of visitors that
         only looked at one page and immediately left your site). If your site primarily serves to refer visitors to other
         websites, then you would expect to see a higher bounce rate, perhaps 70% or above. On the other hand, if
         the purpose of your website is to provide content, you might hope to see a bounce rate closer to 30% or
         40%.
         Look at how your metrics relate to one another. When looking at your bounce rate, for example,
         consider how it compares to your other engagement metrics like time on site. This helps tell a fuller story
         about the experience your users are having.
         Listen to what your users have to say. Customer satisfaction information and usability testing can
         provide valuable context for interpreting your metrics. If you aren’t sure whether your bounce rate suggests
         users are quickly finding what they want and leaving, or that they simply left unsatisfied, there’s nothing like
         hearing feedback directly from your users themselves.

         Consider what surprised you in the data. You know your site well; if something surprised you, it’s
         worth exploring.

Step 3: Act

         Focus on key areas where changes could improve users’ experience.
         Make changes that will align with your agency’s strategic objectives.

4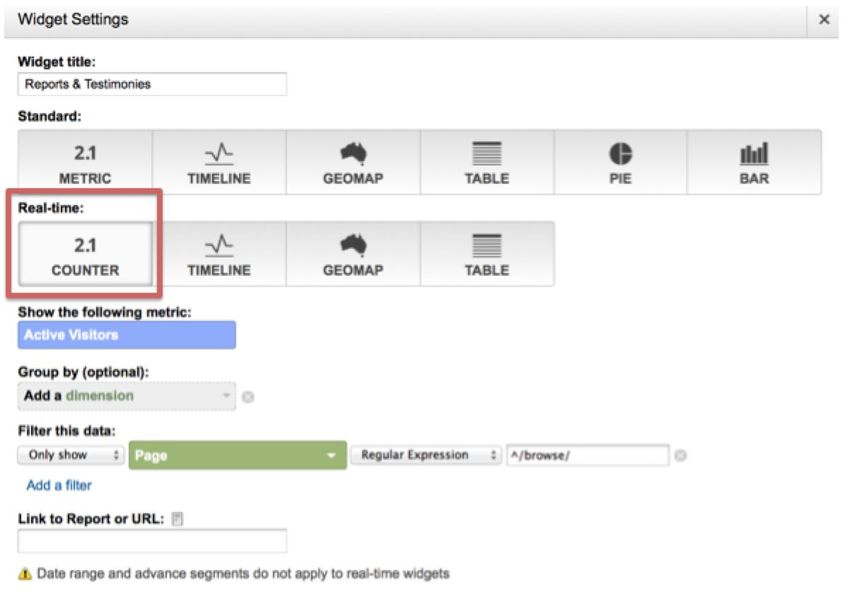
In thinking about where to start when it comes to making site improvements, keep your strategic objectives in mind.
Consider what steps you can take to best support your goals based on the data.

How to Tell a Story with Your Metrics

        Think about where you see room for improvement. Your ideas for site enhancements can help bring
        meaning to your metrics in your writing.
        Present your data in style. If you would be bored reading your report, chances are so will others,
        and they may just miss the message (the same rule applies to presentations). Don’t be afraid to try something
        new, and make sure to use meaningful graphics to break up text.

                                                                                                                   5
Part 2: Getting Started
Lesson 1: How to start using Google Analytics at Your Agency

There are two ways that your agency can get Google Analytics on its website, depending on whether you are a U.S.
federal executive branch agency. For U.S. federal executive branch agencies, you may choose to participate in the
Digital Analytics Program from GSA’s Office of Citizen Services and Innovative Technologies. 2 The program sets out
to provide a common version of Google Analytics to U.S. executive branch federal agencies. Here's how it works:
         You agency identifies a point-of-contact (POC) who will manage the analytics account.
         GSA will send the agency POC a short sign-up form to register their agency and work with them to
         implement the common page tag code.
         GSA will provide implementation support, access to training, and other resources to agency POCs.
         If you don't have an identified POC e-mail DAP@gsa.gov.

The rest of lesson 1 discusses implementation steps that you may need to refer back to, but the Digital Analytics
Program will walk you through them. If your agency is participating in the program, you may continue to lesson 2.

For all other government agencies, before you create an account, seek the advice of your agency Terms of Service
POC or General Counsel. You need to be sure your agency has signed a compatible Terms of Service—meaning the
product supports your broader agency mission and goals—and that the Terms of Service is legally appropriate for use
by your agency. GSA has negotiated a U.S. federal government Terms of Service for Google Analytics.3 Once you
have a Terms of Service, you can register for an account with your government e-mail.4

When you add a new web property to your Analytics account, Analytics generates the tracking code snippet that you
need to add to the pages whose data you want to collect. The tracking code snippet contains a unique ID for the Web
property that lets you identify that property's data in your reports. You can use only the snippet that Analytics
generates for you, or you can customize the tracking code to collect additional data like visitor behavior across
primary and subdomains (cross-domain tracking).

You’ll get a tracking code to paste onto your pages so Google knows when your site is visited. Find the tracking code
snippet for your property by clicking on “Admin” in the main navigation. Next select the property you want to track.
Check that the URL at the top matches the one for your website. Click the “Tracking Info” option.

2
  https://www.digitalgov.gov/services/dap/.
3
  https://www.digitalgov.gov/resources/negotiated-terms-of-service-agreements.
4
  https://accounts.google.com/NewAccount.
6
Accessing your tracking information
You'll see something similar to the code snippet below, where XXXXX-Y indicates the property ID.
var _gaq = _gaq || [];
_gaq.push(['_setAccount', 'UA-XXXXX-Y']);
_gaq.push(['_trackPageview']);
(function() {
var ga = document.createElement('script'); ga.type = 'text/javascript'; ga.async = true;
ga.src = ('https:' == document.location.protocol ? 'https://ssl' : 'http://www') + '.google-
analytics.com/ga.js';
var s = document.getElementsByTagName('script')[0]; s.parentNode.insertBefore(ga, s);
})();
Next, turn on the tracking options you want, then click “Save.” Copy and place the code snippet into your web page,
just before the closing tag. If your website uses templates to generate pages, enter it just before the closing
tag in the file that contains the section. (Most websites re-use one file for common content, so it's
likely that you won't have to place the code snippet on every single page of your website.)
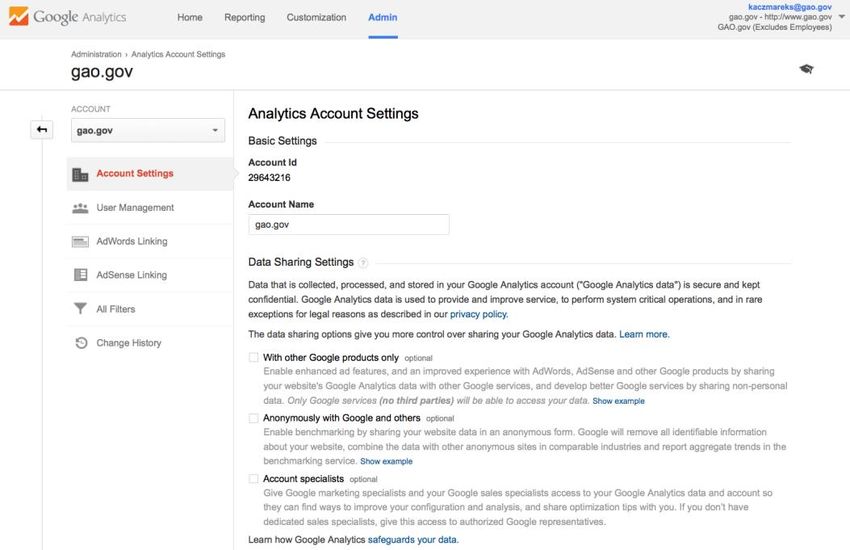
You can disable data sharing options to better protect the data privacy of your users. You can access your data sharing
settings by clicking on the Admin in the main navigation. Next select your account and then choose “Account
Settings,” then uncheck all the sharing options.
7
Accessing your data sharing settings

8
Lesson 2: Web Properties, Views, Adding New Users

Google Analytics provides two tools for partitioning traffic results: views and web properties. A web property is a
distinct website you are measuring, identified by an ID. A web property can be thought of as all the pages where a
particular set of tracking code is installed, including the web property ID or UA number (e. g . U A-XXXXX-Y).

Your agency may have different web properties for each unique entity you want to track in a Google Analytics
account. For example, if you work for a larger department with several sub-agencies, each agency website may be
tracked as a different web property. Within your account, each of these web properties would have a unique UA
number that is installed only on the web pages of the corresponding agency’s site. By contrast, your department may
use the same web property for all sub-agency websites. In this case, you could analyze data department wide, and
create views to grant access to users who only need to view a subset of data, such as the data for the agency for which
they work.

A view is a separate “bucket” of data within an account, and views are the access points to reports on your data. Each
web property has at least one view, and you may add views with different sets of data filtered in various ways. Using
views, you can see reports on specific domains, subdomains, or on filtered data. I recommend using at least these
three views:

         Unfiltered: A view that includes all the data for all the traffic that comes to your site.
         Excludes Employees: A view that excludes your agency’s employees based on IP address or domain.
         Test Filters: A view to test out different filters before applying them to another view.

If you have Manage User permissions, you might want to give certain users access only to one or two views. This has
the effect of only allowing these users to see specified subsets of traffic to your web property.

A schematic showing an analytics account with one web property and three views

If you are an Editor on the account, you’ll see a set of options to customize within each view, including View
Settings, Goals, Content Grouping Filters, and Channel Groupings. Under Filters, Editors can control what data
appears in a view. Under View Settings, Editors can enable site search and set the preferred time zone. Using the
drop down menu, Editors also have an option to create a new view. They can also delete a view under View Settings.
Editors must be careful they are deleting the correct view because the historical data for a view cannot be recovered
once it’s been deleted.

                                                                                                                      9
Options for an Editor and User Manager
Add a New User
To grant someone else access to your Google Analytics data you will need to add a new user. To add a user, navigate
to the User Management under the desired view. Enter the e-mail address for the user’s Google Account. (You can
have the person create a Google Account with their government e-mail address.5) When assigning permissions,
granting someone ‘Edit’ access should be carefully considered. With this level of access, a person could accidentally
take your site’s analytics down by changing a core filter.
Add a new user and assign permissions
You can assign the following permissions:
Manage Users: Can manage account users (add/delete users, assign permissions). Does not include Edit
or Collaborate.
Edit: Can perform administrative and report-related functions (e.g., add/edit/delete accounts, properties,
views, filters, goals, etc., but not manage users), and see report data. Includes Collaborate.
Collaborate: Can create personal assets, and share them. Can collaborate on shared assets like editing a
dashboard or annotation. Includes Read & Analyze.
Read & Analyze: Can see report and configuration data; can manipulate data within reports (e.g., filter a
table, add a secondary dimension, create a segment); can create personal assets, and share them, and see
shared assets. Cannot collaborate on shared assets.
5
https://accounts.google.com/NewAccount.
10Lesson 3: Structural Overview
Google Analytics has four top-level navigation options: Home, Reporting, Customization, and Admin. Under Home,
you have access to your web properties and views. In Reporting, you have access to a menu of options:
Dashboards: Summaries of different reports.
Shortcuts: Your most commonly viewed reports. Shortcuts remember your settings so you don't have to
reconfigure a report each time you open it. Any setting you apply to a report, like adding an advanced
segment, stays applied until you manually change it.
Intelligence Events: Monitor significant changes in your traffic.
Real Time: Traffic on your website in real time.
Audience: Information about your visitors.
Acquisition: Where your visitors came from.
Behavior: Pageviews of different sections of your website and individual pages.
Conversions: The success of your custom-defined goals.
Google Analytics reporting menu
In Customization, you can access and create custom metrics reports, which you can set to automatically e-mail. In
Admin, if you have Edit permissions, you can edit the settings on your account, web property, and views. If you have
Manage User permissions, you can add new users here as well.
You can use the drop-down option next to your e-mail address to quickly switch between the different Google
Accounts that you are currently logged into, without having to leave the interface.
11Drop-down menu option to switch Google Accounts in top right corner of the screen 12
Lesson 4: Working with Data and Using Tables

Google Analytics provides important data on metrics, or measurements. Examples of metrics include the number of
visits, the pages viewed per visit, and the user’s average time on site.

Sample metrics

You can compare two metrics on the same graph to see how they are correlated. To do so, click “Select a Metric”
above the graph in any report and choose from the drop-down menu. When selecting metrics in drop-down menus
they will always appear in blue.

Selecting a comparison metric from the “Select a Metric” drop-down menu

Use the calendar to set your active date range – the time period for which you want to look at data. Select date ranges
by clicking on the day and month within the calendar or typing dates in the date range boxes. Once you set a date
range, it stays active until you change it or log out.

                                                                                                                    13
Selecting a custom date range from the calendar You can use a comparison date range to see how your site is performing month over month, year over year, or from one day to another. The date range and comparison date ranges you select will apply to all your reports and graphs. Selecting a comparison date range from the calendar Most reports include a graph of metrics over time at the top. You can make this graph display data by day, week, or month by clicking on one of those options. 14
Select day, week, or month graph

You can attach short notes or annotations to specific dates. Annotations are useful when you’re looking at historical
data and wondering whether outside events had an effect on your traffic. To add an annotation, click the drop-down
arrow under the graph and select “+Create new annotation.” You can allow anyone with access to the view to see the
annotation, or make it private so that only you see it.

Attaching notes to specific dates

Working with Data in Tables

Many standard reports contain tables. These tables usually break out your data by a single dimension. A dimension
describes attributes, such as city or region, browser or operating system, or mobile device information or service
provider. Each row in the table shows the data for a different value of the dimension. The example figure shows a
table that lets you change the dimension from Browser to Operating System, Screen Resolution, Screen Colors, Flash
Version, or Other dimension. If you click the dimension Operating System, the table shows data for each kind of
operating system, such as how many visits came from Internet Explorer versus Chrome.

                                                                                                                  15
Dimensions and report tables You can also see data for combinations of two dimensions by adding a secondary dimension. The example table shows data for the visitors’ operating systems. Use the drop-down menu to select a secondary dimension. In this example, the secondary dimension is for the visitors’ web browsers. Now you will be able to see data for each combination of operating system and browser data attributes (i.e., Windows/IE7; Mac/Chrome). In drop-down menus dimensions always appear in green. Selecting a comparison metric from the “Select a Dimension” drop-down menu 16
You can also filter the data that appears in a table. To do so, click the “Advanced” option above the table. For
example, you may be interested in only seeing data for users that visited more than one page when they viewed your
site.

Filtering data in tables

Columns within tables can be sorted in both ascending and descending order by clicking on the column heading. The
arrows next to the heading title indicate the order in which the results are listed. A down arrow indicates descending
order and an up arrow indicates ascending order.

By default, all reports with tables display ten rows. To display more than ten rows, go to the bottom of your report
and click the drop-down menu arrow next to “Show rows.” You can display up to 500 rows per page.

Google Analytics will sample the data in instances where there is a large amount of data to process. Data sampling occurs
automatically with Google Analytics Standard when more than 500,000 visits are collected for a given report, meaning a
subset of data from your traffic is used to report on trends detected in that sample set. The sampling rate appears on the top
right side of reports.

You can visualize data in different ways, using the options at the top right corner of your
tables.                                                                                     Percentage view

          The Data view organizes your report data into a table. This is the
          default view for many reports.
          The Percentage view creates a pie chart based on any one of the metrics
          in the report.
          The Performance view shows a bar graph based on any metric you
          select.
          The Comparison view allows you to quickly see whether each entry in
          the table is performing above or below average.
          The Pivot view allows you to create a pivot table in which both rows
          and columns can break out dimension values.

The comparison view is especially helpful to quickly assess higher and lower performing pages. Comparison view
takes the site average for a metric and compares the individual performance of every row to that average, and it
visualizes the data for you. For example, you can look at your top websites that refer traffic and see the sources that
                                                                                                                      17
send traffic that tend to see more than one page, and contextualize their performance. To do so navigate to Acquisition, then All Referrals, choose Comparison, then Bounce Rate. Comparing referral traffic visits and bounce rate 18
Part 3: Interpreting Core Reports
Lesson 5: Audience Reports
Overview: Pageviews, Visits, and Visitors
                                                                                                        Audience reports menu
Audience reports provide information about your visitors’ characteristics, in a set of nine
reporting options. The overview covers pageviews, visits, and visitor metrics.

Pageviews

A pageview is counted every time a page on your website loads. For example, if someone
comes to your site and views page A, then page B, then Page A again, and then leaves your
site—the total pageviews for the visit is 3. A unique pageview represents the number of
visits made to a page. If a visitor views page A three times during one visit, Google Analytics
will count this as three pageviews and one unique pageview. Average pages per visit tells
you the average number of pages viewed on your website by all visitors over a set amount of
time. If the goal of your website is to provide users with your content, this average can be an
indication of the level of interest that visitors have in your site. By contrast, if the goal of your
website is to refer users to other websites, you would expect to see users viewing fewer
pages.

Counting pageviews

If a person only views one page before leaving your site, Google Analytics reports this as a bounced visit. The
bounce rate is the percentage of single-page visits. As a general rule for content provider sites, a bounce rate in the
40% or below is good, 50% and up is bad. Google also provides these benchmark averages for bounce rates:

         40-60% Content websites
         30-50% Lead generation sites
         70-98% Blogs
         20-40% Retail sites
         10-30% Service sites

A high bounce rate on a navigation page could reveal a problem as it indicates users are not engaging with the page. If
your goal is to have users navigate from that page to another, you may need to make changes.

A high bounce rate on a content page is not necessarily bad as users could have gotten what they needed and had no
need to continue. For example, if you are searching for the next federal holiday and find that information on the first

                                                                                                                        19
webpage you visit, you would have no need to continue on the website. In this case, the website successfully served its purpose even though you only viewed one page. Some sites make extensive use of Flash or other interactive technologies. Often, these kinds of sites don’t load new pages frequently and all the user interaction takes place on a single page. As a result, it’s common for sites like this to have high bounce rates—meaning a high percentage of visits ended after viewing only one page—and low average times on site. Visits A visit is the number of distinct sessions during which someone viewed one or more pages on your site. Closing the browser or staying inactive for more than 30 minutes ends the visit. For example, if you have a visitor on your site who gets a phone call and talks for 31 minutes (during which she does not click anywhere on the site), and continues browsing after the call, Google Analytics will count this as a second visit, or a new session. Total visits is the number of times people came to your site over a given time period. This metric is a universal and accurate way to measure the volume of traffic to your website. Counting visits Visitors A unique visitor is a person (set of cookies) who visited your site. Visitors are uniquely identified by a Google Analytics visitor cookie, which assigns a random visitor ID to the user, and combines it with the timestamp of the visitor’s first visit. The combination of the random visitor ID and the timestamp establish a unique ID for that visitor. The number of visitors to your site is only as accurate as the cookies. If a person visits your site from home and from work, the same person will be assigned two sets of cookies and be counted as two visitors. Counting visitors 20
Generally, the Visitors metric will be smaller than the Visits metric, which in turn will be smaller than the Pageviews
metric. For example, 1 visitor could visit a site 2 times and generate a total of 5 pageviews.

Total unique visitors measures the number of unique visitors over a selected date range. If visitor A comes to your
site 5 times during the selected date range and visitor B comes to your site once, you will have 2 visitors. This is a
powerful metric for accurately calculating how many people (or physical computers) came to your website.

                                                                                                                    21
Time Metrics Time on Page Time on page is the amount of time a visitor spends on a single page. To calculate time on page, Google Analytics compares the timestamps of the visited pages. In the example figure, the visitor saw page A, then page B, and then left the site. The time on page for page A is calculated by subtracting the page A timestamp from the page B timestamp. The time on page for page A is 1 minute and 15 seconds. Time on page is important for measuring the effectiveness of specific pages. For example, if your website launches a new hiring campaign on your careers page, you will need to know how much time people spent on that page to measure its effectiveness. Calculating time on page by comparing the timestamps of the pages visited Time on Site Now, suppose the visitor continued on to a third page before exiting, as shown in the example figure. The second page now has a time on page of 1 minute 10 seconds. The time on site is now calculated as 2 minutes and 25 seconds. The time on site is the length of time a visit lasted, from the first pageview to the last pageview. Calculating time on site by comparing the timestames of all pages visited Average Time on Page vs. Average Time on Site Average time on page tells you the average amount of time spent on a single page by all visitors, such as the average time spent on your home page. To give you a better sense of engagement with a single page, Google 22
Analytics excludes bounces from this calculation. In other words, any time on page of 0 is excluded from the
calculation.

Average time on site tells you the average amount of time spent on your website by all visitors. To calculate
average time on site, Google Analytics divides the total time for all visits by the number of visits. For average time
on site, bounces remain a part of the calculation. Average time on site can be an indication of the level of interest or
involvement that a visitor has with the website. Increasing the average pages per visit and average time on site can be
evidence that your readers are increasingly satisfied with your content and are then more likely to recommend your
site to others. Your visitors may also be finding what they’re looking for on your site instead of elsewhere on the
Web, which means they’ll likely return in the future. If you have a customer support site, however, your objective
may be for visitors to get the information they need in as short a time as possible, with as few pageviews as possible.
In this instance, your goal may be to decrease average time on site. It’s important to keep your objectives in mind
when interpreting site engagement metrics.

                                                                                                                      23
Visitor Information
Demographics & Interests Reports
Data on your visitors’ demographics and interests are not automatically captured in Google Analytics. Before you
begin accessing this data, you may need to update your privacy statement.6 To turn on this feature you need to update
your analytics tracking code to support “Display Advertising” by replacing a single line of code. This modification
does not impact any customizations you have previously made to your code. It’s important to note that this
information applies to the Classic Analytics JavaScript (ga.js) only. Find out if you’re using Classic or Universal
Analytics.7
To implement this change, replace the bold text in this example Google Analytics tracking code:
var _gaq = _gaq || [];
_gaq.push(['_setAccount', 'UA-xxxxx-y']);
_gaq.push(['_trackPageview']);
(function() {
var ga = document.createElement('script'); ga.type = 'text/javascript'; ga.async = true;
ga.src = ('https:' == document.location.protocol ? 'https://ssl' : 'http://www') + '.google-
analytics.com/ga.js';
var s = document.getElementsByTagName('script')[0]; s.parentNode.insertBefore(ga, s);
})();
with the bold text in the example below:
var _gaq = _gaq || [];
_gaq.push(['_setAccount', 'UA-xxxxx-y']);
_gaq.push(['_trackPageview']);
(function() {
var ga = document.createElement('script'); ga.type = 'text/javascript'; ga.async = true;
ga.src = ('https:' == document.location.protocol ? 'https://' : 'http://') +
'stats.g.doubleclick.net/dc.js';
var s = document.getElementsByTagName('script')[0]; s.parentNode.insertBefore(ga, s);
})();
6
https://support.google.com/analytics/answer/2700409?hl=en&utm_id=ad.
7
https://support.google.com/analytics/answer/4457764.
24You can also generate an updated basic code snippet that includes the change by clicking on Admin in the main
navigation, then selecting the Property, Tracking Info. Next turn on the Display Advertiser Support option.
Accessing demographics and interests data allows you to better understand who your visitors are and how their
behavior varies by attribute (e.g., male vs. female). Demographics and interests reports provide information on age,
gender, and interests.
Sample age ranges and gender ratios
Sample interests
You can also use this data as the basis for segmentation—where you look at a subset of your data that meets a specific
set of criteria—to evaluate how your users' behavior varies by demographics and interests. Doing so can help you
understand how visitors who achieve your defined website goals differ from other visitors. You can also use these
insights about your visitors to refine your communication strategies.
Information for these new reports is derived from the DoubleClick third-party cookie. When a person visits a website
that has partnered with the Google Display Network, Google stores a number in their browsers (using the
DoubleClick third-party cookie) to remember their visits. This number uniquely identifies a web browser on a
specific computer, not a specific person. Browsers may be associated with a demographic category, such as gender or
age range, based on the sites that were visited, and with interest categories based on how often people visit sites of
those categories. In addition, some sites might provide Google with demographic and interest information that people
share on certain websites, such as social networking sites. Google also uses demographics derived from Google
profiles. Not all of your visitors may have demographics associated with them, so these reports may only represent a
subset of your visitors and may not be representative of your overall site composition.
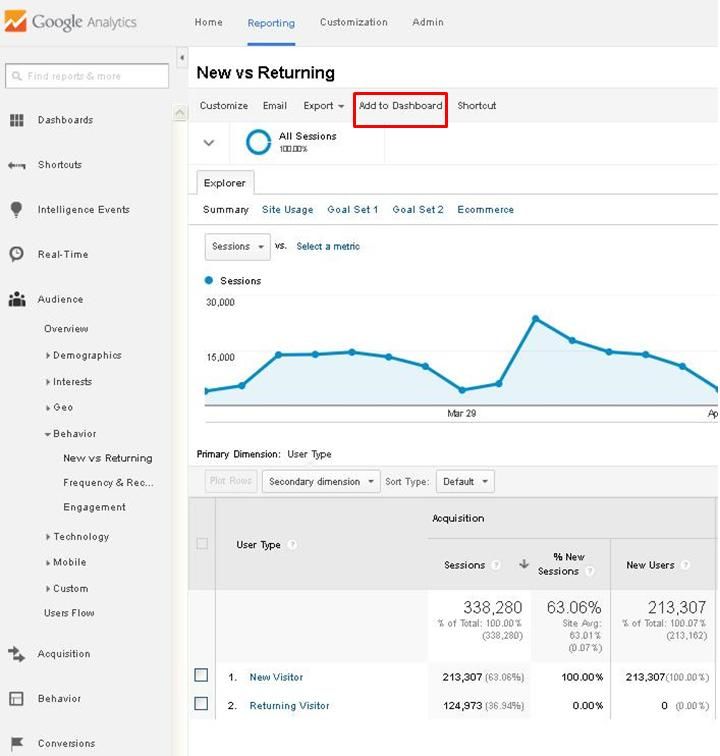
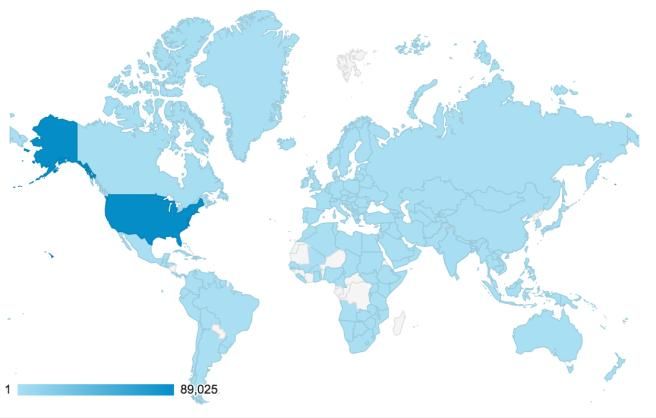
25GEO reports GEO reports provide information on visitor language and location. For example, you can see whether most of your visits are from the United States, and even which cities have the highest levels of traffic. This information is especially important if you are providing services like disaster assistance to a specific region. You’ll be able to see if people accessing information about these services on your website come from the regions you are targeting. Sample visitor location map Audience Behavior Reports Audience behavior reports provide detailed information on New vs. Returning visitors, Frequency & Recency, and Engagement. The New vs. Returning report classifies each visit as coming from either a new visitor or a returning visitor. When someone visits your site for the first time, the visit is categorized as visit from a new visitor. If the person has browsed your website before, the visit is categorized as visit from a returning visitor. A high number of new visits suggest that you are successful at driving traffic to your site, while a high number of return visits suggest that the site content is engaging enough for visitors to come back. This information is especially useful when you are trying to expand the reach of your site to different types of audiences with varied interests from various locations. New visitors and returning visitors 26
You can look at Frequency and Recency reports to see how recently visitors have visited. You can also look at the
same report to see how frequently they return, called the number of visits per visitor. This metric is important for
determining how “sticky” your website is and if your content is compelling. Regardless of the kind of website you
have (content, referral, lead generating) you want visitors to come back more than once. Visits per visitor helps you
track and trend the average number of times people come to your site in a given time frame. You can also see if there
are times when your visitors come back more or less often. This is helpful to track if you release new content or have
a new campaign.

The Engagement report provides key information on visit duration and page depth. Visit duration is the total
duration of all visits divided by the number of visits. To calculate average visit duration, Google Analytics sums the
duration of each visit during the date range you specify and divides that sum by the total number of visits. Google
Analytics reports this metric by intervals of time, 0-10 seconds, 11-30 seconds, 21-60 seconds, and so on. With this
information, you can see whether a few visits are skewing your average time on site upward or downward. While
your site could have an average time on site of 3 minutes, 60% of visits may have a duration of 0-10 seconds. It’s
important to look at your website’s distribution of visit duration to see how long visitors engage with your content. If
most of your visits lasted a short time, it could indicate that your content isn’t appealing.

Average visit duration distribution

In addition to average visit duration, page depth is a useful Engagement report. Page depth tells you how many
visitors viewed 1 page, 2 pages, 3 pages, and so on up to 20+ pages. For example, your report might show that 2000
visits accounted for views to one page only, 200 visits accounted for views to 2 pages, 50 accounted for views to 3
pages, and so on. While your site may have 3.5 pages per visit, 60% of visitors may view only 1 page. It’s important
to look at your website’s distribution of page depth to see how engaging your content is.

Technology Reports

Technology reports provide details on data dimensions related to visitors’ computer software, such as web browser
and operating system, as well as service provider network (such as an agency’s network, or Comcast for home users).
This information is useful when you are updating your site and need to know the parameters to design and test.

          Browser reports can show you which browsers your visitors use, as well as the browser versions. For
          example, you can see the number of visitors that use Internet Explorer 7.0, 8.0, 9.0, etc.
          Operating System reports show which operating system your visitors use, as well as the versions of those
          operating systems. For example, you can see how many visitors use Windows 7 or Windows XP.

                                                                                                                     27
Network reports show visits by service provider, and can be especially helpful in seeing how many visits
come from other government agencies. This helps you identify agencies that visit your website the most.
Mobile Reports
Mobile reports tell you how many visitors came from mobile devices. Mobile reports also compare behavior of
mobile and non-mobile visitors by pages per visit, average visit duration, percent new visits, and bounce rate. Mobile
reports also provide details on mobile devices and operating systems. This allows you to see the proportion of visits
from iPhone, Blackberry, and Android devices.
Custom Reports
Custom reports show visitor activity by segments you create by modifying your Analytics tracking code. For
example, you might have a form on your site where visitors can provide information on their occupation such as
researcher, federal manager, or attorney. In this case, you can use custom variables to capture their selections. Their
selections would then become dimensions for the custom variables report and future visits remain classified under the
selected segment. Check out Google Analytic’s developer guides for more on creating custom variables.8
Visitor Flow Reports
Visitor flow can help you understand how people move through your site. Visitor flow is a graphical representation
of the paths visitors took through your site, from the source, through the various pages, and where along their paths
they exited your site (your home page will likely appear as “/” in the graphic). You can break out visitor flow by
different dimensions, such as Country/Territory, Acquisitions, Social Networks, or custom variables. You can also
apply an advanced or default segment to dissect the flow by types of traffic, such as mobile, direct, or new visitors.
8
https://developers.google.com/analytics/devguides/collection/gajs/gaTrackingCustomVariables.
28Sample visitor flow based on Country/Territory
For a more in-depth analysis you can hover over a connection or click on it for more options. If you hover over a
connection, you will see the total number of visits and the percent that exited your site from that page. Click a
connection to view only traffic from that segment, show all the connections through here, or display the individual
pages that are grouped together. For example, if all of your reports are grouped under ‘products’ you can choose to
view the group details to see traffic through the most viewed reports.
29Lesson 6: Acquisition Reports
The reports in the Acquisition section show you where your traffic is coming from on the Acquisition reports menu
Internet. Acquisition reports are broken out into a set of ten reporting options. You can
compare your traffic sources against each other to find out which channels send you the
highest quality traffic.
Channels
Search Traffic: Visitors who click on a search results link in Google, Yahoo,
or any other search engine.
Direct Traffic: Visitors who clicked on a bookmark to arrive at your site, or
who typed the URL directly into their browser.
Referral Traffic: Visitors who came from links on other websites or blogs.
Social Traffic: Visitors who came from social media sites.
E-mail Traffic: Visitors who came from a link in e-mail.
Looking at the highest traffic drivers is helpful, but it’s important to consider other factors as well. Another important
metric is bounce rate—the percentage of visits in which the person left without viewing any other pages. Say
blog.com sent the most traffic, but it has a 90% bounce rate. A bounce rate this high suggests that the site isn’t
relevant to what the visitor is looking for.
By clicking the “compare to site average” icon and selecting a comparison metric, you can see which sources
outperform and underperform the site average. For example, if you select bounce rate as your comparison metric,
you can see how sources of traffic compare to the site average.
Comparing the bounce rate of your channels
All Traffic
The All Traffic report lists all of the sources sending traffic to your site. This report is particularly helpful because it
can help you identify your top-performing sources. You may sometimes see referrals from google.com. These can
come from Google Groups posts or static pages on other Google sites.
30Campaigns
Campaign tracking is a method of identifying how users discover your site. You can use campaign tracking to
accurately track online campaigns to your website, both from AdWords-generated campaigns as well as from other
sources like e-mail and social media messaging. I highly recommend campaign tracking to see how well your e-mail
and social media messaging works to drive traffic back to your website.
Campaign tracking works like this:
You control the link to your website in your e-mail and social media messages.
You tack some labels onto the end of the link.
When a visitor clicks the link and arrives at your site, Google Analytics records those labels.
There is nothing to configure in Google Analytics—you just make the link.
In web addresses, the parts after a question mark are called query parameters. Sometimes your webserver does
something special with them, like www.example.gov/page?id=1234. If your webserver doesn’t recognize the query
parameter, it ignores it. That means these addresses both go to the same page:
www.example.gov/page
www.example.gov/page?myname=sarahkaczmarek
You can use labels that Google Analytics recognizes for medium, source, and campaign:
www.example.com/page?utm_medium=email&utm_source=newsletter&utm_campaign=independence_day
You can use the Google Analytics URL builder so you don’t even have to build these URLs by hand.9 You can shorten
your links with go.usa.gov, or by using a URL redirect for print campaigns. If you shorten your link, the redirect
needs to have the query parameters.
Be sure to use a consistent naming convention that is standard for your organization: capitalization matters. Also, only
use campaign URL tagging for external messaging links coming from elsewhere (twitter, blog) to your site. For
example, if you have five different URLs you are promoting for an Independence Day e-mail and social media
campaign, the table below shows you how to build your query parameters. Add the parameters that match your
medium and source to your URLs for Google Analytics to track and report how many people ended up clicking on
these links to your website.
9
https://support.google.com/analytics/answer/1033867?hl=en.
31Table 1: Sample Independence Day campaign structure
Campaign Medium (how Source (where Query Parameter (what to add to your
they came) they came from) URLs)
independence_day email newsletter ?utm_medium=email&utm_source=newslett
er&utm_campaign=independence_day
independence_day social twitter ?utm_medium=social&utm_source=twitter&
utm_campaign=independence_day
independence_day social facebook ?utm_medium=social&utm_source=faceboo
k&utm_campaign=independence_day
independence_day social linkedin ?utm_medium=social&utm_source=linkedin
&utm_campaign=independence_day
Compare campaign reports to identify those with lower bounce rate, longer time on site, and more goal conversions.
Sample comparison of a campaign’s metrics for each landing page
32Keywords
Keywords are the words that visitors use to find your website when using a search engine. Website owners can pay
to have their website come up when users put in certain keywords (“paid keywords”), but it is more likely that your
keywords will be based on the content of your site (“organic keywords”). Looking at organic keywords is very useful
for understanding what visitors were expecting to find on your site. Keywords with a high bounce rate tell you where
you failed to meet that expectation.
If you have a keyword with a high bounce rate, you can look at the page(s) where your visitors entered your site (the
landing page) after searching for that keyword. To find out which landing page is being used for a keyword, select
the keyword, and from the next screen type in the secondary dimension “Landing Page.” This report can be
particularly helpful if multiple landing pages are being used. You can find out which landing pages are responsible for
the lower performance and send the keyword traffic to the most effective landing page. This information can offer
insights into how to best focus your search engine optimization efforts. If you see keyword information for something
called “(not provided)” this is meant to protect user privacy. It only applies to organic keywords from Google for
users who are signed in to a Google Account. As (not provided) keywords continue to grow, it’s important to look at
the associated landing pages to assess trends.
Finding keyword landing page reports
33Lesson 7: Behavior Reports
Site Content
Behavior reports are broken out into a set of nine reporting options. The Site Content section of Behavior reports menu
Behavior provides reports looking at pages visited by All Pages reports, Content Drilldown
reports, Landing Page reports, and Exit Page reports.
All Pages Report
The All Page report lists each page that received traffic. The Page Title viewing option on the All
Pages report groups your pages according to Title tag; this view can be useful when you have
more than one name for a page, like your home page.
By default, Google Analytics orders the pages with the highest visited pages appearing at the top
of the list. Clicking on the down arrow at the top of the column will show the reverse order, i.e.
the least visited pages. This can help you assess the most and least popular content on your site.
Be aware that Google Analytics will only show urls that were visited in the time period, so pages
will not appear if they weren’t visited at all.
Content Drilldown Report
Sample directory
The Content Drilldown report groups pages according to folder directory. You can click on a
directory to see the pages in the directory. For example, the Careers section of a website will
likely be a folder directory, with multiple pages inside the directory. This helps you assess the
most and least popular pages within a directory. You can use this information to consider
revising less popular pages and possibly moving key information to more popular pages.
Landing Pages Report
The landing pages report lists all of the pages through which people entered your site. You may expect your home
page to be the page where most of your visits begin, but this is often not the case. Pay as much attention to top entry
pages as you do your home page. By identifying the landing page where most of your visits start, you can see the page
where visitors get their first impression of your site. You can also use this report to monitor the bounce rate for each
landing page. Bounce rate is good indicator of landing page relevance and effectiveness. The more relevant the page,
the less likely a visitor will be to bounce. Consider testing multiple versions of top landing pages to see where you can
reduce your bounce rate.
Exit Pages Report
The exit pages report provides a breakdown of the number of exits from each page, and the percent of exits from
each page. Google Analytics takes the last page viewed in each user’s session and shows the pages that appear most
frequently as the last one in visitor sessions. Exit rates differ from bounce rates because the visitor could have seen
multiple pages before exiting, which would only be captured under exit rates because bounced visits indicate the
visitor only viewed one page before leaving your site. This report is often considered less helpful than looking at
bounce rates because there are many reasons why a visitor will exit your site that could have nothing to do with the
site content itself.
34Site Search Reports
Google Analytics provides internal site search reports that allow you to see how people search once they’ve arrived at
your site. By looking at what people search for, you can identify missing or hidden content on your site and improve
search results for key phrases. You can also see the vocabulary your visitors use, and identify when they have trouble
finding content. The total number of on site searches is a good indicator of the ease your visitors have finding
content. A high site search rate could mean visitors are unable to quickly find desired. Or, it could mean visitors
would rather skip to search box to find specific information than read through your content. In contrast, a low
number of search queries could mean content is readily available and complete.
Sample percent of visits with and without site search
Google Analytics reports use search term when referring to internal site searches and keyword when referring to
external searches. The site search usage report compares visitors who used site search to those who did not. The
search terms report only includes visits during which a search was performed. The search terms are listed in a table.
You can see how each term compares in terms of number of searches, percentage of search refinements, and other
metrics. Search terms that result in unsuccessful searches may indicate that there’s content missing from your site.
Visitors are looking for information you aren’t providing. Alternatively, visitors could be using different words to
describe content than you. Let your content speak in the language of your audience.
Pages reports provide information on start pages and destination pages:
Start Pages lists all of the pages from which visitors searched. Your home page and other popular pages will
likely be at the top of the list. Consider what surprises you on this list, look for lower-traffic pages that have
a lot of searches. It could mean information on these pages is confusing, or a navigation element could be
poorly worded or organized. You can click on a page in the table for a list of all of the search terms used
from that page.
Destination Pages tells you which pages are most commonly found through search on your site. Click on a
page in the table to see the search terms that led to the page.
Set up Site Search for a View
In order to set up site search tracking for your website, you’ll need to configure your view settings. Note that you
need to be an administrator to complete these steps. Click “admin” in the main navigation. Navigate to the Account,
Web property, and View for which you want to enable site search reports. Then select View Settings.
35You can also read


