Virtual weather data for apple scab monitoring and management - Philip Zandelin
←
→
Page content transcription
If your browser does not render page correctly, please read the page content below
Virtual weather data for apple
scab monitoring and management

Philip Zandelin

 Degree project • 30 hec
 Swedish University of Agricultural Sciences, SLU
 Hortonomprogrammet/Horticultural Science
 Alnarp 2021
Virtual weather data for apple scab monitoring and
management
Virtuell väderdata för bevakning och behandling av äppleskorv
Philip Zandelin
Supervisor: Peter Witzgall, SLU, Department of Plant Protection Biology
Examiner: Marie Bengtsson, SLU, Department of Plant Protection Biology
Credits: 30 hec
Level: Second cycle, A2E
Course title: Independent project in Horticultural Science, A2E
Course code: EX0857
Programme/education: Horticultural Science Programme
Place of publication: Alnarp
Year of publication: 2021
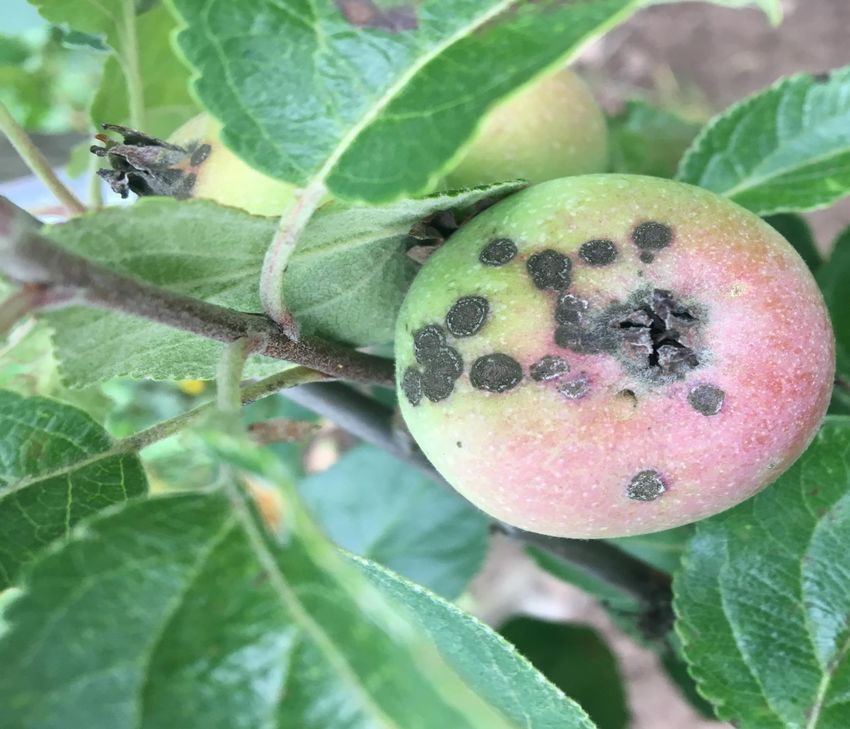
Cover picture: Philip Zandelin
Keywords: Apple scab, virtual weather stations, grid-data, decision support system, RIMpro,
integrated pest management, leaf wetness
Swedish University of Agricultural Sciences
Faculty of Landscape Architecture, Horticulture and Crop Production Science
Department of Plant Protection Biology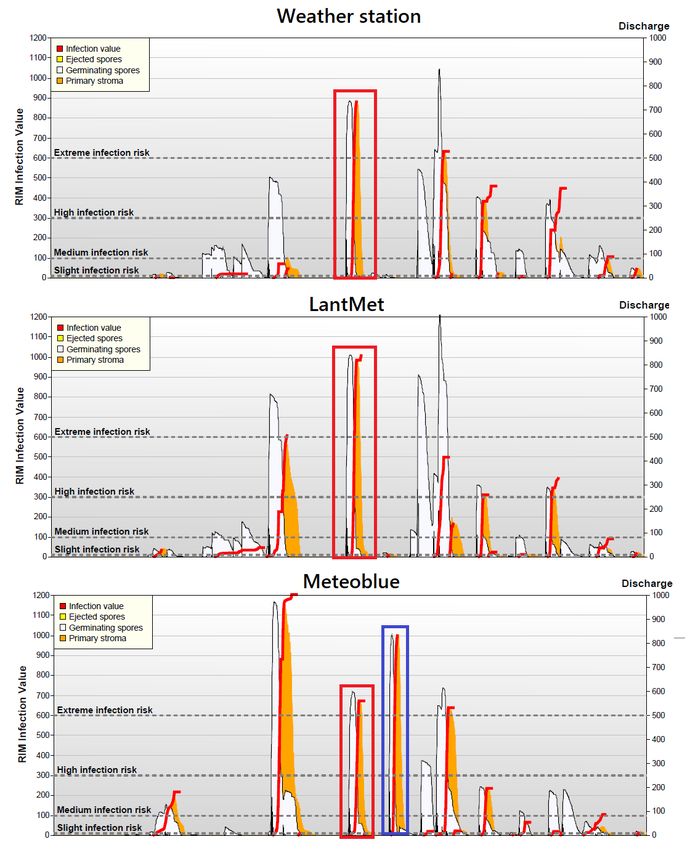
Publishing and archiving
Approved students’ theses at SLU are published electronically. As a student, you
have the copyright to your own work and need to approve the electronic publishing.
If you check the box for YES, the full text (pdf file) and metadata will be visible
and searchable online. If you check the box for NO, only the metadata and the
abstract will be visible and searchable online. Nevertheless, when the document is
uploaded it will still be archived as a digital file.
   If you are more than one author you all need to agree on a decision. Read about
SLU’s publishing agreement here: https://www.slu.se/en/subweb/library/publish-
and-analyse/register-and-publish/agreement-for-publishing/.

☒ YES, I/we hereby give permission to publish the present thesis in accordance
with the SLU agreement regarding the transfer of the right to publish a work.

☐ NO, I/we do not give permission to publish the present work. The work will still
be archived and its metadata and abstract will be visible and searchable.
Acknowledgements

   This master thesis would not have been possible without the generosity of Marc
Trapman, programming an interface in decision support system RIMpro which
allowed me to evaluate virtual weather data for apple scab monitoring.
   I would also like to the Swedish board of agriculture and especially Sanja
Manduric, for presenting the idea and letting me do it with the help of their
resources. Sanja also acted as a valuable sounding board throughout the project.
   Thanks to Jan-Eric Englund at the Swedish university of agricultural sciences
for helping me with the statistics, constantly thinking of possible ways to look at
the data.
   Last, but not least, thanks to my supervisor Peter Witzgall. A voice of reason,
helping me keep things structured and staying within the boundaries of the project.
I mainly wanted support in the writing process, which was exactly what I got.

Abstract
Decision support systems can be used to monitor disease development of apple
scab. Decision support systems require weather data to function, which in Sweden
is currently provided by conventional weather stations. Conventional weather
stations supply reliable weather data if correctly installed and maintained but are
costly and require continuous error-checking. Virtual weather data is becoming an
increasingly popular option, where the data is calculated based on a combination of
observations from local weather stations and weather radar and satellites. In this
study, virtual weather data was compared with physical weather stations for apple
scab monitoring, to evaluate the suitability of virtual data as a replacement for
conventional weather stations. This was done by evaluating differences in predicted
apple scab infections using the apple scab model in the decision support system
RIMpro for the 2019 and 2020 seasons. Virtual weather data lacks the leaf wetness
parameter, which had to be calculated based on other weather parameters. Thus, the
use of leaf wetness calculations as an alternative to leaf wetness sensors was
investigated.
   The study showed that virtual weather data correctly predicted the number and
severity of infections, similar to conventional weather stations, with some margin
of error especially for low category infections. This indicates that virtual weather
data could be a suitable replacement for physical weather stations. With respect to
the discrepancies seen in infection severity, few were due to a difference in leaf
wetness, demonstrating that leaf wetness calculations may indeed be a suitable
option for replacing leaf wetness sensors. This study was carried out after the 2020
apple scab season ended; thus, some crucial aspects were not accounted for, such
as checking for errors from the weather stations during the seasons studied. Before
implementation of virtual data can take place in Sweden, the virtual data should be
evaluated during the growing season.

Keywords: Apple scab, virtual weather stations, grid-data, decision support system, RIMpro,
                         integrated pest management, leaf wetness
Popular scientific summary
Consumers and retailers want undamaged apples. Therefore, apples found in stores
are free of apple scab. The reason for this is that apple growers direct a lot of
attention at preventing this fungal disease from growing on the apples.
The development of the disease is impacted by multiple factors, where the main
ones are rain, temperature, and leaf wetness. To monitor the development of
disease, decision support systems have been developed. Data from meteorological
weather services and local weather stations are sent to the decision support systems
which model the disease development. For apple scab in Sweden, the decision
support system RIMpro is used. RIMpro helps growers identify which rain events
could potentially lead to disease development, and aids growers in decision making
around fungicide spraying.
The weather stations used in the orchards supply reliable weather data if
correctly installed and properly maintained. However, as they have a limited
lifetime, require both weekly and yearly maintenance to be reliable, and are costly
to purchase, another option has started to gain popularity, namely virtual weather
stations. In Sweden, there is a virtual weather station every 2.5x2.5 km. The weather
data for each virtual weather station is calculated based on both observations from
local weather stations and weather radar and satellites. Getting weather data from
these virtual weather stations instead of physical weather stations in apple orchards
would be less costly and include less work for growers since no maintenance would
be required. The question asked in this study was if virtual weather stations in
southern Sweden can act as a sufficient replacement for physical weather stations
in orchards for modelling apple scab.
The results show that virtual weather stations may become a viable option to in-
orchard weather stations. Since multiple fungicide sprayings are usually carried out
every season to prevent apple scab, further confirmation is needed to make sure
virtual weather stations supply reliable weather data.Table of contents
Acknowledgements........................................................................................................... 4
List of tables ...................................................................................................................... 9
List of figures ................................................................................................................... 10
Abbreviations .................................................................................................................. 12
1. Introduction ............................................................................................................. 13
1.1. Apple scab ................................................................................................... 13
1.2. Decision support systems............................................................................ 14
1.3. RIMpro ......................................................................................................... 15
1.3.1. RIMpro Model ..................................................................................... 15
1.4. Weather data ............................................................................................... 17
1.4.1. Grid data model background .............................................................. 17
1.4.2. Weather stations ................................................................................. 17
1.4.3. Leaf wetness ....................................................................................... 18
1.5. Integrated pest management ...................................................................... 19
1.5.1. The role of SJV in integrated pest management ................................ 21
1.6. Objective ...................................................................................................... 21
2. Material and methods ............................................................................................. 22
2.1. Software and weather data.......................................................................... 22
2.2. Site selection and experimental design ....................................................... 22
2.3. Statistical analysis ....................................................................................... 23
2.3.1. Comparison of infection events .......................................................... 24
2.3.2. Causes of differences between stations ............................................. 24
2.3.3. Impact of distance between grid-point and weather station ............... 25
2.3.4. Regional differences in infection events ............................................. 25
3. Results ..................................................................................................................... 26
3.1. Numerical comparison of infection events ................................................... 27
3.2. Principal component analysis of predicted infections .................................. 27
3.3. The number of predicted infections ............................................................. 29
3.4. Causes of differences in predicted infection ................................................ 30
3.5. Distance between weather sources ............................................................ 314. Discussion............................................................................................................... 32
4.1. Numerical comparison of infections ............................................................ 32
4.2. Principal component analysis and correlations of infections ....................... 33
4.3. Categorical differences of infections ........................................................... 33
4.4. Distances ..................................................................................................... 34
4.5. Potential problems and future directions ..................................................... 35
4.6. Conclusion ................................................................................................... 36
References ....................................................................................................................... 38
Appendices 1 ................................................................................................................... 44
Appendices 2 ................................................................................................................... 45List of tables
Table 1. Categorization of RIM values based on risk levels from graphical outputs
in RIMpro. .................................................................................................24
Table 2. Predicted primary infection events of apple scab 2019 and 2020 by
different weather stations compared against each other for 10 Swedish apple
orchards. “Δ” shows differences in infection severity. n = 130 for 2019; n
=100 for 2020. ...........................................................................................27
Table 3. The average number of infection events per station, region, and year. West
n=4, Southeast n=3, Northeast n = 3. ........................................................29
Table 4. Primary causes of categorical differences greater than 1 arranged by
stations against each other for each region and year. ................................30
Table 5. RIM infection value for all 10 stations for the primary infection period of
apple scab 2019. Organized in color by region. ........................................45
Table 6. RIM infection value for all 10 stations for the primary infection period of
apple scab 2020. Organized in color by region. ........................................46
9List of figures
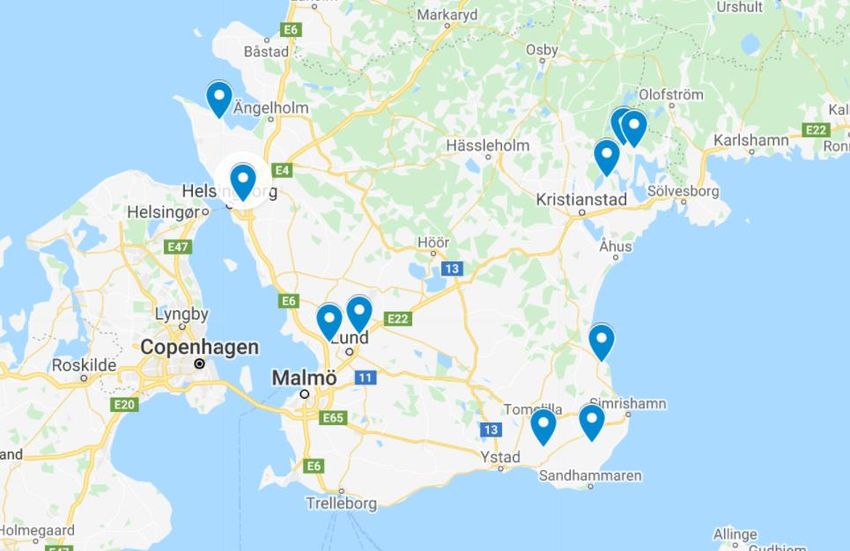
Figure 1. The location of the ten selected orchards in Scania, Sweden. Source:
https://www.google.com/maps ..................................................................23
Figure 2. Graphical output of the RIMpro apple scab model. The bottom axis shows
rain (dark blue) and leaf wetness (light blue) over the growing season.
Above, the proportion of mature spores (light red) and immature spores
(dark red) are shown. The main graph shows the number of spores ejected
during rain events (yellow bars), the number of spores germinating (white
area), while the red lines represent the RIM infection value. The orange area
indicates scab lesions that were initiated by infection from the germinating
spores and are incubating in the leaf after which scab lesions will become
visible. Used by permission of RIMpro B.V., Netherlands. ......................26
Figure 3. Loading plots from principal component analysis for standardized RIM
infections for the 2019 and 2020 apple scab season. Within parentheses of
the different components are the percentage of variance explained. For all
but the West region 2020, the first component shows the difference between
Meteoblue and both the weather station and LantMet. The second
component then explains the difference in variance between the weather
station and LantMet. For the West region in 2020, there was no large
difference between any of the stations. .....................................................28
Figure 4. Pearson correlation matrices for each region in 2019 and 2020. For all
regions and both years, excluding 2020 West, the correlation between the
weather station and LantMet is stronger. For 2020 West, there are smaller
differences between the different weather sources. ...................................29
Figure 5. Graphical outputs from the same orchard for the same period but with
different weather sources used (weather station, LantMet and Meteoblue).
Highlighted in red is a predicted infection event which occurred on all three
weather sources, with the same infection severity. Highlighted in blue is a
predicted infection event which occurred only on the Meteoblue weather
source. The RIM-value of this predicted infection passed the threshold for
the highest severity risk, giving a category 4 infection. As the other two
weather sources did not predict any infection for this event, a category 4
difference in infection severity were seen between Meteoblue and the other
two weather sources. Used by permission of RIMpro B.V., Netherlands. 44
1011
Abbreviations

AROME    Applications of Research to Operations at Mesoscale
DSS      Decision Support System
IPM      Integrated Pest Management
LWD      Leaf Wetness Duration
MESAN    Mesoscale Analysis
PAD      Potential Ascospore Dose
RIM      Relative Infection Measure
RIMpro   Relative Infection Measure program
SJV      The Swedish Board of Agriculture
SLU      Swedish University of Agricultural Sciences
SMHI     Swedish Meteorological and Hydrological Institute
VPD      Vapour Pressure Deficit

                                12
1. Introduction
1.1. Apple scab
Apple scab, caused by the fungus Venturia inaequalis (Cke.) Wint. (anamorph
Spilocea pomi Fr.) is globally the most important disease affecting apples when
measured by economic loss, the amount of fungicides needed to control scab and
effort spent by growers to monitor infestations and to time treatments (MacHardy
1996). Apple scab occurs in all apple growing areas and is especially destructive
where spring weather is mild and wet. Commercial apple production largely
depends on fungicides for effective apple scab management.
The overwintering form of the fungus are pseudothecia, fungal fruiting bodies,
in infected leaves remaining on the orchard ground (MacHardy 1996; Vincent et al.
2004). When temperatures are increasing in spring, ascospores, the primary
inoculum, are produced in asci that develop within the pseudothecia (Carisse et al.
2006). When the ascospores are mature, they discharge during rain events. The
spores are dispersed by wind, landing on young leaves, fruit, or sepals where
infections occur given the right conditions (MacHardy 1996; Belete & Boyraz
2017).
For ascospores to be released the pseudothecia require wetting (Brook 1969;
Singh 2019). The overwhelming majority of ascospores are released when wetting
occurs in daylight. Higher temperatures and humidity before wetting also increase
the amount of ejected ascospores. The germination of ascospores is dependent on
the surface of the tissue being wet, usually referred to as leaf wetness. The number
of hours of leaf wetness required for a germination is dependent on the temperature
(MacHardy 1996).
Scab lesions that develop from the ascospores produce conidia (secondary
inoculum) which can cause further infections on leaves, fruit, and shoots during wet
weather for the rest of the season (MacHardy 1996; Belete & Boyraz 2017).
A potential ascospore dose (PAD) is a scab risk assessment for the following
season, which can be done after harvest but before leaf-fall. A sequential sampling
technique is used where all leaves on 10 shoots from 10 random trees in the orchard
are examined for apple scab (Reardon et al. 2005). The number of infected leaves
13can be used to predict the infection risk level for the following season. If the number
of infected leaves is between the threshold values for high and low risk, it is
necessary to examine another 100 shoots. In low-risk orchards, fungicide
applications can be delayed in spring. Sanitation measures during autumn have an
important effect on threshold values (Cooley et al. 2009).
The risk for apple scab in spring depends on the susceptibility of the apple
variety and the level of foliar scab infections at leaf-fall as well as the amount of
leaf litter remaining on the ground during winter and spring (MacHardy 1996;
Biggs et al. 2010). Reducing the amount of apple scab inoculum overwintering on
leaves is therefore an important measure to reduce disease pressure (Creemers et al
2002). Although this may not necessarily allow for fewer fungicide applications
during the primary infection period (ascospore infections), applications may
become more efficient and therefore reduce the need for additional applications
during the secondary infection period (conidial infections). Measures taken during
the autumn to reduce the inoculum aim to accelerate leaf decomposition, by
shredding leaves and spraying urea (Sutton et al. 2000; Vincent et al. 2004).
Infection risk is highest in spring and early summer since young leaves and fruit
are particularly susceptible to V. inaequalis infections (Schwabe et al. 1984; Jamar
2011). Mature leaves and fruits gain resistance as they age, where young leaves are
most susceptible the first 8 days after emergence (Carisse et al. 2006). Moreover,
failure to control scab during spring is difficult to amend later in the season (Köhl
et al. 2015). Thus, to avoid a buildup of scab in the orchard, the timing of fungicide
application during spring is critical. Using weather-based decision support systems,
growers can monitor infection risk to properly time fungicide applications.
Management of apple scab has high priority for growers, since even subtle
infections reduces fruit quality. In Sweden apples are sorted according to EU’s three
quality norm classes for apples (Jordbruksverket 2019). The most desirable is Class
Extra, where the apples must be free of any defects, except for insignificant external
damage. Second is Class I, where the total surface of apple scab on an apple may
not exceed 0.25 cm2, and finally Class II, where the total surface of apple scab may
not exceed 1 cm2. Each class has a quality tolerance of 5-10% for apples that do not
fulfil the criteria. If none of the quality class requirements are met, the apples are
sorted as processing fruit (Eneqvist Staflin 2017).
1.2. Decision support systems
Decision-support systems (DSS) are interactive computer-based systems that help
growers to make informed management decisions by taking several parameters and
large amounts of data into account (Shtienberg 2013). DSSs may also act as a bridge
14between research and growers to facilitate knowledge transfer, which is often a
decisive point in implementing integrated pest management (IPM) strategies.
1.3. RIMpro
RIMpro Cloud Service (www.rimpro.eu) is an interactive DSS for pest and disease
management in fruit production developed by Marc Trapman (RIMpro B.V.,
Zoelmond, NL). Among some of the pests and diseases it contains models for are
apple scab, apple sawfly (Hoplocampa testudinea), codling moth (Cydia
pomonella) and powdery mildew (Podosphaera leucotricha). RIMpro builds on
algorithms that model the biological development of the pests and diseases
(RIMpro 2020). The RIMpro simulation models are developed in collaboration
with experts for the different pests or diseases. RIMpro is continuously developed
based on user feedback, input from working groups and projects, and gains in
knowledge of the biology of the respective pests and diseases. To predict the
development of diseases and pests, the RIMpro models use weather forecasts from
either the Norwegian world-wide weather service YR (www.yr.no) or the swiss
meteorological service Meteoblue (www.meteoblue.com). RIMpro also provides a
historical record of the development of the pests or diseases based on weather data
from either in-orchard weather stations or virtual weather stations. By using user-
friendly interfaces RIMpro aids growers and advisers to decide upon and to time
applications of pesticides. However, the apple scab model does not calculate an
absolute risk since it cannot account for the ascospore potential in the orchard or
the susceptibility of apple varieties to apple scab (Trapman 2013). To gain a better
understanding of the actual risk level and how to interpret the model output,
growers and advisers should first establish the general risk for each specific
orchard, before the growing season.
Several other decision support systems have been developed for apple scab, such
as Fruitweb, Ag-Radar, NEWA and Skybit (Wallhead & Zhu 2017).
1.3.1. RIMpro Model
The RIMpro apple scab model computes a RIM value which indicates the number
of spores germinated. The RIM value increases proportionally with infection risk,
where the number of the RIM value can be considered as the percentage of
ascospores in an orchard that are likely to cause an infection – divided by 100 (as
the number of ascospores are set to 10 000 at the start of the season). For example,
a RIM value of 500 indicates that 5% of the ascospores are likely to cause an
infection at that given moment. If the orchard was relatively free of scab infections
the previous season, fungicide applications for RIM infection values below 300 can
possibly be avoided (Trapman 2013). However, at RIM values above 600 it is
15recommended to spray twice, usually with an application before the predicted
infection and one either during the infection or immediately after.
Several factors are of importance for an apple scab infection. Some of the key
factors the RIMpro apple scab model takes into account include:
• The impact of rain and leaf wetness on the maturation of ascospores, and
delayed maturation of ascospores during dry intervals.
• Rain requirements for discharge of ascospores.
• The effect of light and humidity on ascospore discharge, as adequate
humidity and the light condition prior to a rain event increases the amount
of dischargeable ascospores. On the other hand, low light and humidity
levels, have an opposite effect.
• Leaf wetness requirements for germination of ascospores.
• The effect of temperature on the germination of ascospores, using the
“revised mills infection curve” by MacHardy and Gadoury (1989) with
some improvement from Stensvand et al. (1997) for lower temperatures.
• Survival of ascospores during dry conditions.
Weather data is sent to the RIMpro server where the apple scab model produces
new outputs every 30 minutes. The user must provide a starting date, a biofix, when
the first ascospores are ready to be discharged (RIMpro user manual, 2013). There
are four options in RIMpro for setting a biofix. The preferred approach is petri-plate
assay to observe discharge of first ascospores. The second option is to use spore
traps in the orchard for detection of the first discharged ascospores. If these methods
cannot be used, for lack of time or expertise, it is instead possible to use the date of
when the first morphologically mature ascospores under microscope can be seen,
or to use the phenological stage green tip.
RIMpro contains another feature in which fungicide applications can be
simulated. The apple scab model estimates the coverage and degradation of the
fungicide, where the decline of the fungicide cover is estimated based on wash-off
by rain and dilution by leaf growth (Wallhead & Zhu 2017). This means growers
can verify the timing and efficacy of fungicide applications, and for how long the
fungicide residue from a previous application may provide sufficient coverage for
the next infection.
161.4. Weather data
1.4.1. Grid data model background
In Sweden, the Swedish Board of Agriculture (SJV) uses RIMpro. Currently,
weather data is obtained from in-orchard weather stations at 35 locations. However,
SJV is considering to obtain weather data from grid-data instead. Grid-data has a
resolution of 2.5x2.5 km in Sweden and is calculated by the Swedish
Meteorological and Hydrological Institute (SMHI). The current weather data is
calculated for every grid-point by combining weather data from local weather
stations and data from weather radar and satellites (SMHI 2019). This is done by
the real time analysis model Mesoscale Analysis (MESAN) (Häggmark et al. 2000;
SMHI 2019). As a starting value, MESAN uses a weather forecast from a numerical
weather prediction model called AROME (Applications of Research to Operations
at Mesoscale). This forecast is then modified by using observations from local
weather stations and data from weather radar and satellites to get a better
representation of the actual weather for a grid-point. A method called Optimal
Interpolation is used to evaluate how the information given in the observations vary
with the distance between the grid-point and the place of the observation. If SJV
would eventually switch to using grid-data, LantMet, a database that collects and
stores weather data from SMHI and local weather stations, would be used as a
provider of the grid-data (Swedish University of Agricultural Sciences 2020b). The
LantMet database is managed by Fältforsk, Swedish University of Agricultural
Sciences (SLU), and is financed jointly by SLU, SJV and Hushållningssällskapet
(Swedish University of Agricultural Sciences 2020a). Due to the large amount of
processing power required to store data from all SMHI’s grid-points, LantMet has
restricted its grid-points to only include those in areas with at least 37% open
ground (T. Leuchovius 2020, personal communication, 11 September).
1.4.2. Weather stations
In Swedish apple orchards, Davis’ weather stations (Davis Instruments
Corporation, Hayward, California) are currently used to collect weather data. For a
successful disease and pest warning system weather data needs to be reliable. To
attain reliable weather data using weather stations, it is critical to properly install
and maintain the equipment and to continuously check for errors (Gleason et al.
2008). Physical weather stations require constant maintenance for accurate weather
data to be collected (Karlsson et al. 2016). As the scab model is highly dependent
on rain, humidity, leaf wetness and temperature data, weather stations that are not
providing correct data can impact the disease development in the model. For
example, the entry hole of the rain bucket funnel is sometimes covered by debris –
impacting the amount of water measured by the rain gauge (Hernebring 2008;
17Karlsson et al. 2016). Other problems concern calibration of the temperature
humidity sensor or that the rain gauge is not being leveled. A rain gauge tilted by
more than a few degrees may not work properly since it affects the calibration of
the rain gauge mechanism (Campell Scientific 2015). In addition, the amount of
rain collected from a tilted rain bucket varies with wind direction. Therefore, rain
gauge, temperature and humidity sensors need to be checked weekly. A yearly
service comprising all parts of the weather station and calibrations is also required
(Karlsson et al. 2016).
1.4.3. Leaf wetness
The presence of free water on the surface of a crop canopy is defined as leaf wetness
(Rowlandson et al. 2015). As leaf wetness duration (LWD) is an important factor
for infection of apple leaves, apple scab models are dependent on the LWD
parameter (Stensvand et al. 1997; Leca et al. 2015). In Swedish apple orchards leaf
wetness sensors are currently used. It is often difficult to measure leaf wetness as
there are a variety of different sensors which lack reliable standards. Ehlert et al.
(2019) showed that several commonly used leaf wetness sensors in Germany did
not accurately reflect apple scab infections that occurred during the study period.
Angle, orientation and canopy position are other non-standardized factors that
influence the readings of a leaf wetness sensor (Rowlandson et al. 2015).
Calibration and maintenance of the sensors are crucial for reliable LWD data.
RIMpro provide users with the option of using virtual stations, based on weather
data from Meteoblue. The meteorological data obtained for the virtual weather
stations contain information for parameters such as temperature, air humidity and
rain but not for LWD. This means that LWD has to be calculated from the other
weather parameters (Trapman 2017). RIMpro uses a model which simulates the
wetting and drying of apples leaves developed by Leca et al. (2015). It was
validated on a large scale in 2016 by asking the RIMpro users each time they used
RIMpro whether apple trees were wet or dry in that moment (Trapman 2017). For
74 locations in central Europe, each observation made by the grower was compared
to the wetness indicated by the weather station and the virtual leaf wetness. In 81%
of the cases, the observation made by the grower agreed with the in-orchard weather
station, while the virtual leaf wetness was correct in 73% of the cases. The main
discrepancy was that virtual data returned “false wets” in comparison with orchard
observations. For 35 locations all primary infections were then compared using both
the in-orchard station and virtual data. For the 417 potential infection events that
occurred, 88% were calculated by both data types, while 9% of the infection events
were calculated only on the orchard station data and 3% only on virtual data. In
65% of the infection events the severity class of the infection was the same between
the two types of stations.
18In RIMpro, the leaf wetness calculations for the LantMet interface are simpler
than the leaf wetness model used for the Meteoblue interface. The LantMet
interface uses vapour pressure deficit (VPD) and rain as indicators of leaf wetness.
VPD is a combined function of air temperature and relative humidity, calculated by
the difference of the amount of moisture in the air and air moisture at saturation
point, 100% relative humidity (Medina et al. 2019). VPD drives the transpiration
of plants. If the air humidity becomes saturated, vapour condenses to form clouds
which will lead to condense on leaves (Prenger & Ling). In other words, a low VPD
means the relative humidity is high whereas transpiration will be low, which
produces leaf wetness.
1.5. Integrated pest management
Integrated pest management (IPM) is an ecologically based pest control strategy
which is dependent on natural mortality factors, such as natural enemies or weather
(Flint & Bosch 1981). IPM strategies attempts to reduce harmful organisms by
disrupting the natural control mechanisms as little as possible. Pesticides may still
be used, but only after careful monitoring of both pest populations and natural
control factors. It is therefore necessary to adopt a holistic view (Barzman et al.
2015). A holistic view requires continuous collection of information about different
parameters such as natural enemies, other pests, and cultural practices used. These
parameters must then be evaluated with respect to interactions between the different
factors and the impact of control actions (Flint & Bosch 1981). The consideration
of all available plant protection methods to reduce the development of harmful
organisms includes even the option to take no action. It is therefore central for IPM
strategies to reduce pesticide usage to levels that are both economically and
ecologically justified. This is best achieved by resorting to pesticides only when
other management tools are insufficient (Barzman et al. 2015; European
Commission 2020).
As of 2014 professional pesticide users throughout EU must comply with eight
general principles of IPM (Directive 2009/128/EC). These include: (1) Prevention
and suppression, (2) monitoring, (3) decision making, (4) non-chemical methods,
(5) pesticide selection, (6) reduced pesticide use, (7) anti-resistance strategies and
(8) evaluation (Barzman et al. 2015).
An example of the first principle, “prevention and suppression”, of apple scab is
shredding leaves. Decision support systems (DSS) can be of great value for IPM as
it helps growers determine the level of disease and pest incidence and estimate
potential economic loss (BiPRO GmbH 2009; Barzman et al. 2015). This can be
done by using scientifically sound DSSs, such as RIMpro, to monitor pests and
diseases, such as apple scab, since DSSs provide a simulation of the development
of the pest or disease in relation to weather conditions (Shankar & Abrol 2012).
19Monitoring provides the basis for the third principle, decision making. By
evaluating the information from the monitoring methods, ecological and
economical costs can be considered, and appropriate action can be taken. Choosing
the most appropriate management strategy avoids unnecessary pesticides use, thus
reducing a detrimental effect on environment and human health and even saving
economic expenditure for the grower (Jordbruksverket 2020). A prime focus in IPM
is threshold-based interventions (Barzman et al. 2015). Thresholds are however
rarely universal. RIMpro provides risk-levels, but growers need to individually
evaluate the situation in their respective orchards before taking action (Trapman
2013). This is done by assessing the amount of apple scab during the previous
season, which sanitary measures were taken during the fall, and how susceptible
the varieties grown are.
The fourth IPM principle, non-chemical methods, means the grower should
avoid using pesticides if other alternatives are available (BiPRO GmbH 2009).
Non-chemical methods such as biological methods are not available against apple
scab. Preventative measures, such as scab-tolerant cultivars, are the only option to
potentially avoid chemical methods (Carisse et al. 2006).
Principles five, six and seven, are all related to the pesticide use which greatly
depend on DSSs. Using pesticides may cause undesired side effects on beneficial
organisms, increasing the risk for pest outbreaks (Reddy 2016).
When pesticides are deemed necessary, pesticides with minimum impact on
human health, non-targeted organisms and the environment should be prioritized
(BiPRO GmbH 2009; Barzman et al. 2015; European Commission 2020). The
pesticide application frequency, dose and area should be the lowest possible. As
RIMpro models the development of the disease, and contains a fungicide simulation
feature, the user may lower the application dose and frequency, based on the
information provided by RIMpro. In addition to adverse health, economic, and
environmental effects, the risk of resistance is another important reason why the
use of fungicides should be limited (European Commission 2020). The seventh
principle, anti-resistance strategies, depends on the fungicide chosen.
The fungicide resistance action committee (FRAC 2019) classifies apple scab as
a plant pathogen showing high risk for the development of resistance to fungicides.
Using systemic fungicides with a curative mode of action may result in resistance
development, while contact fungicides with a protectant quality have a lower risk
of developing resistance (Wenneker & Jong 2018; Chatzidimopoulos et al. 2020).
The protectant fungicides primarily affect spore germination while systemic ones
are absorbed by the plant and then affect the fungal growth. Due to the high risk of
resistance development of systemic fungicides, it is recommended to primarily use
contact fungicides. An example of a multisite contact fungicide is dithianon
(quinone class), which FRAC classifies as a low risk of resistance development.
Dithianon has been used for almost 50 years and yet there are no reports of reduced
20sensitivity (Stammler et al. 2013). The grower can prioritize protectant fungicides
by applying fungicides with the correct timing based on the information provided
by DSSs.
The final principle, evaluation, demands that the grower evaluates the success of
the plant protection measures taken.
1.5.1. The role of SJV in integrated pest management
The Swedish Board of Agriculture (SJV) is the authority in Sweden that is
responsible to inform about IPM and to facilitate implementation, although other
agencies are also involved (Nyrén 2013).
SJV can offer assistance to apple growers practicing IPM. They have used
RIMpro for 35 orchards in southern Sweden during the past decade, providing
information about different diseases and pests, including apple scab. This service is
provided to the public for free as a part of the government-funded goal to reduce
the effects of pesticide use on public health and the environment (Swiergiel et al.
2019). SJV sends weekly updates on the current situation of pests and diseases in
Sweden. Alerts are sent to growers when the scab model exceeds warning
thresholds for their orchards.
It is essential that governmental institutions play a leading the role in IPM by
providing salient information about IPM and supporting projects working to
improve IPM-strategies, for example by making DSSs easily accessible.
Currently 33 out of 35 weather stations used by SJV for RIMpro are situated in
Scania, where most of the commercial apples are grown (www.fruitweb.se).
However, switching to virtual weather data would give new opportunities to expand
the area which is currently covered and to include more orchards. Moreover, virtual
weather data would render installation and maintenance of weather stations
superfluous.
1.6. Objective
The aim of this project was to evaluate if grid weather data can replace physical
weather stations in the RIMpro apple scab disease model for Swedish apple
growers. To evaluate this aim, two main questions needs to be answered:
• Is the leaf wetness model and calculation used for virtual weather stations
sufficient to replace the leaf wetness sensors used by the in-orchard weather
stations?
• Will virtual weather stations produce similar outcomes in apple scab disease
development when compared to the physical weather stations?
212. Material and methods
2.1. Software and weather data
To evaluate grid data for apple scab decision support systems, the cloud-based
decision support system RIMpro (RIMpro B.V., Zoelmond, NL) was used. An
interface for LantMet (http://www.ffe.slu.se/lm) (cooperation between SLU, SJV
and Hushållningssällskapet) grid weather data was created by Marc Trapman in
RIMpro. Since grid data from LantMet does not include leaf wetness
measurements, vapor pressure deficit (VPD) was used as the leaf wetness parameter
in the grid data model. The model assumed that trees were wet when the amount of
rain was greater than 0.0 mm or when VPD was smaller than 2.5 hPa. As RIMpro
users already have the option of adding virtual weather stations based on data from
Meteoblue (Meteoblue AG, Basel, Switzerland), an extra set of virtual stations were
created for every orchard to compare the use of Meteoblue versus LantMet.
2.2. Site selection and experimental design
For ten commercial apple orchards, virtual weather stations were created based on
weather data from both LantMet and Meteoblue. The ten sites selected were based
on the geographical distribution of apple orchards in Scania (Figure 1). A
requirement was that the orchard had a functional weather station with few data
gaps for the previous two seasons. The orchards where divided into three regions,
West, Northeast, and Southeast.
RIM values were gathered for each infection event for the primary scab infection
period of 2019 and 2020. To compare infections between the different types of
stations, infections were determined by the rain events which caused the main
ejection of ascospores. When rain occurred within 5 h from each other at different
stations they were considered to be part of the same rain event. When multiple rain
events stretching over several days contributed to an infection, it was difficult to
separate which of the rain events had the greatest impact. For an infection to be
22considered the same in these instances, at least one rainfall with a meaningful
contribution of ejected ascospores had to occur at the different stations.
Additionally, an overlap in the RIM value infection period was required.
Figure 1. The location of the ten selected orchards in Scania, Sweden. Source:
https://www.google.com/maps
2.3. Statistical analysis
All data was processed and analysed using Minitab 19 (v. 19.2020.1.0) for
statistical analyses and Microsoft Excel (v. 16.0.13328.20356) for the numerical
comparisons.
To simplify the comparison between weather sources and stations, the RIM
infection values were categorized from 0-4 based on the infection risk levels as
defined by RIMpro graphical outputs (Table 1).
23Table 1. Categorization of RIM values based on risk levels from graphical outputs in RIMpro.
RIM value Category Risk levels in RIMpro
0-9 0 No infection risk
10-99 1 Sligh infection risk
100-299 2 Medium infection risk
300-599 3 High infection risk
600+ 4 Extreme infection risk
2.3.1. Comparison of infection events
To compare infection events between the stations, principal component analysis
(PCA) was carried out for the seasons 2019 and 2020 for all three regions. As this
study aimed to compare three different types of stations, the difference in infection
severity between the different stations at every infection event was the main
interest. This means comparing different infection events was of no interest. To
eliminate this difference in the PCA, the infection values for the different stations
at each infection event were standardized to have an average of zero. This was done
by subtracting the mean of the three stations infection value from each individual
station’s infection value.
The PCA was also complemented with Pearson correlation matrices for every
region for the 2019 and 2020 seasons. Additionally, a simple numerical comparison
of each stations infection category for every infection event was carried out (see
Appendices 1 for example).
2.3.2. Causes of differences between stations
The main cause of categorical differences larger than one between two stations was
further investigated. This was done by carefully comparing RIMpro’s graphical
output and weather data for each of the three types of station for every infection
event. Since multiple factors may contribute to differences between stations, the
investigation of the differences was evaluated in the following order: 1) rain, 2)
available mature spores, 3) leaf wetness duration and temperature, and 4) relative
humidity. Only the highest ranked difference observed was counted for each
infection event. Rain differences included both differences in rain amount and
timing of the rain, while mature spores included differences in both available
mature spores during the season and when spores were depleted at the end of the
season.
242.3.3. Impact of distance between grid-point and weather
station
The distance between LantMet grid-points and weather stations in orchards was
measured using google maps (www.google.com/maps). To determine if the
distance of a LantMet grid-point and a weather station had any effect on the output,
a Pearson correlation matrix was produced containing distance and the percentage
of infections differing between LantMet and weather stations.
2.3.4. Regional differences in infection events
The average number of infections per orchard, each year, for the different stations
and regions were calculated. This was done to investigate potential differences in
performance for the different type of weather sources between the two seasons
studied.
253. Results
Three different weather data sources, for the 2019 and 2020 seasons, were
investigated for the RIMpro apple scab model in southern Sweden. This was done
for primary infections, which is caused by the sexually reproduced spores
(ascospores). The weather data sources used were from in-orchard, physical
weather stations, Meteoblue and LantMet grid-data.
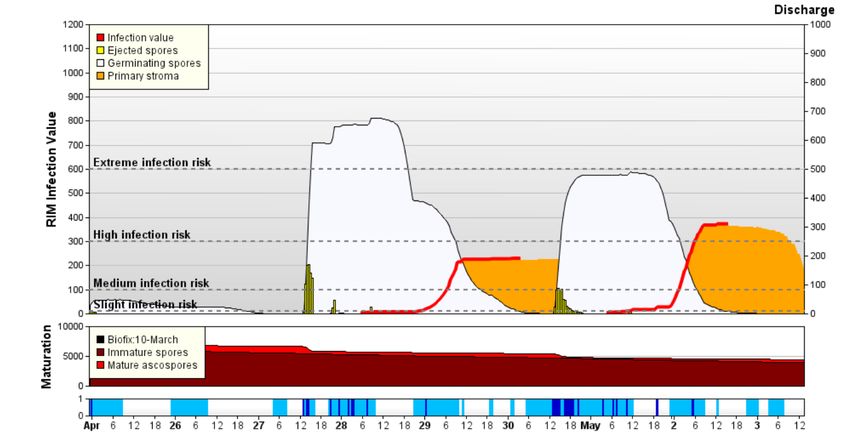
A typical output of the RIMpro apple scab model is shown in figure 2. The RIM
infection value is represented by the red line. This project was carried out after
primary infection period ended, and therefore, a forecast was not included in the
study. The graph shows only historical data which can be obtained by RIMpro with
weather data from either an in-orchard weather station or a virtual weather station.
During the ongoing primary infection period, both historical and forecasted
infections are represented in the graphical output.
Figure 2. Graphical output of the RIMpro apple scab model. The bottom axis shows rain (dark blue)
and leaf wetness (light blue) over the growing season. Above, the proportion of mature spores (light
red) and immature spores (dark red) are shown. The main graph shows the number of spores ejected
during rain events (yellow bars), the number of spores germinating (white area), while the red lines
represent the RIM infection value. The orange area indicates scab lesions that were initiated by
infection from the germinating spores and are incubating in the leaf after which scab lesions will
become visible. Used by permission of RIMpro B.V., Netherlands.
263.1. Numerical comparison of infection events
For the primary infection period of apple scab in 2019, there were 130 predicted
infection events (Table 2). In 11% of the events, all three stations produced unique
RIM category infections, while in 19% of the cases all three stations produced the
same RIM infection category. As seen in table 2, in 62% of the events, the RIM
infection categories were the same for weather stations and LantMet grid-data. The
weather station and Meteoblue data predicted the same RIM infection category for
29% of events. When comparing the virtual stations based on LantMet and
Meteoblue, the two produced the same RIM infection category for 37% of the
infection events. Differences between the weather station and LantMet did not
exceed two categories during any infection event, while the comparison of
Meteoblue compared with either the weather station or LantMet showed differences
of three to four categories. For the 2020 season, 100 infection events were
predicted, 30 less than 2019. Again, the weather station and LantMet gave the
highest percentage of the same category infections at 53%. For the weather station
and Meteoblue 39% of the infection events had the same category and for LantMet
and Meteoblue, 35% were the same. For 2020 there were no category 4 differences
between any stations (Table 2).
Table 2. Predicted primary infection events of apple scab 2019 and 2020 by different weather
stations compared against each other for 10 Swedish apple orchards. “Δ” shows differences in
infection severity. n = 130 for 2019; n =100 for 2020.
Year Stations compared Δ0 Δ1 Δ2 Δ3 Δ4
2019 Weather station - LantMet 62% 33% 5% 0% 0%
Weather station - Meteoblue 29% 52% 13% 3% 3%
LantMet - Meteoblue 37% 44% 14% 4% 2%
2020 Weather station - LantMet 53% 45% 2% 0% 0%
Weather station - Meteoblue 39% 48% 11% 3% 0%
LantMet - Meteoblue 35% 51% 12% 3% 0%
3.2. Principal component analysis of predicted
infections
For the principal component analyses (Figure 3), all three regions in both years,
with the exception of the West region during 2020, produced similar outputs. For
the five plots with similar output, the first component explained the difference in
data between Meteoblue and the other two stations, with a variance explained
between 60.1- and 77.4%. The second component in these five analyses showed the
27difference between LantMet and the weather stations with a variance explained
between 22.6- and 39.4%. The PCA of the Western region in 2020 differed from
the others where the two components are similar in variance explained, and no large
differences were seen between the three different weather data sources.
Figure 3. Loading plots from principal component analysis for standardized RIM infections for the 2019 and 2020 apple
scab season. Within parentheses of the different components are the percentage of variance explained. For all but the
West region 2020, the first component shows the difference between Meteoblue and both the weather station and
LantMet. The second component then explains the difference in variance between the weather station and LantMet. For
the West region in 2020, there was no large difference between any of the stations.
The PCA was complemented with correlation matrices for every region both 2019
and 2020 (Figure 4).
28Figure 4. Pearson correlation matrices for each region in 2019 and 2020. For all
regions and both years, excluding 2020 West, the correlation between the weather
station and LantMet is stronger. For 2020 West, there are smaller differences between
the different weather sources.
3.3. The number of predicted infections
There were both regional and station-type differences associated with the number
of infections per orchard in both years (Table 3). For all three regions, except West
2019, the weather stations predicted more infections than Meteoblue. On average,
weather stations and LantMet predicted infections differed between 0- and 1, while
it differed between 0- and 2.7 for the weather station and Meteoblue.
Table 3. The average number of infection events per station, region, and year. West n=4, Southeast
n=3, Northeast n = 3.
Year Region Weather station LantMet Meteoblue
2019 West 10.0 9.0 10.0
Southeast 11.3 11.3 11.0
Northeast 12.0 12.0 9.3
2020 West 6.0 6.5 5.5
Southeast 7.7 6.7 6.3
Northeast 7.0 8.0 6.0
293.4. Causes of differences in predicted infection
There were 87 infection events in total for 2019 and 2020 where a categorical
difference in infection larger than one could be seen between two stations, of which
eight involved the weather station versus LantMet (Table 4). The four causes of
differences were rain, leaf wetness, mature spores, and relative humidity. Rain
differences were the most common cause, contributing to 69% of the differences.
Both mature spores and leaf wetness were found to cause 15% of the total
differences. Relative humidity caused only one categorical difference larger than
one. Temperature caused no observed differences.
Table 4. Primary causes of categorical differences greater than 1 arranged by stations against each
other for each region and year.
Year Region Stations Rain Mature LW RH
spores
2019 West Weather station - LantMet 2 0 0 0
Weather station - Meteoblue 7 1 2 0
LantMet - Meteoblue 7 0 2 0
Southeast Weather station - LantMet 2 0 0 0
Weather station - Meteoblue 1 0 3 0
LantMet - Meteoblue 1 0 4 0
Northeast Weather station - LantMet 1 0 1 0
Weather station - Meteoblue 8 2 1 0
LantMet - Meteoblue 10 1 0 0
2020 West Weather station - LantMet 1 0 0 0
Weather station - Meteoblue 1 0 0 0
LantMet - Meteoblue 2 1 0 0
Southeast Weather station - LantMet 0 0 0 1
Weather station - Meteoblue 2 1 0 0
LantMet - Meteoblue 1 3 0 0
Northeast Weather station - LantMet 0 0 0 0
Weather station - Meteoblue 8 2 0 0
LantMet – Meteoblue 6 2 0 0
303.5. Distance between weather sources
The distance between the in-orchard weather station and the LantMet grid-points
ranged between 0.4- and 4.1 km. The correlation between the percentage of
infections differing between physical weather stations and LantMet and the distance
between the grid-points and the in-orchard weather station was not significant (r =
0.151).
314. Discussion
The scope of this study was to compare different sources of weather data, two
sources of virtual weather data and physical weather stations, feeding into the apple
scab forecast provided by the decision support system RIMpro. This study
compares 10 apple orchards in Southern Sweden, during the 2019 and 2020
seasons. The amount and severity of infections using weather data from in-orchard
weather stations and LantMet grid-data in southern Sweden correlated to a higher
extent when compared to Meteoblue and the weather station. The results show that
replacing in-orchard weather stations with LantMet grid-data in Sweden could be a
viable option.
4.1. Numerical comparison of infections
The categorical infection did not exceed a difference of two between the weather
station and LantMet at any infection event, while it was in some instances as large
as three or four when comparing Meteoblue and the weather station. Thresholds for
when treatment is necessary are impacted the apple variety grown, the level of scab
recorded in the orchard the previous season, and the phenological stage of the tree.
As these factors were not recorded for any of the stations and are not accounted for
in the RIMpro model (with the exception of phenological stage), threshold values
for treatment were not verified. However, category 4 infections are recommended
to always be sprayed twice, while several factors impact the spraying decisions for
the lower categories (Trapman 2013; Veens 2014). If the orchard had low amounts
of scab the previous season, category 1 and 2 infections might not need treatment.
This indicates that large categorical differences between stations will likely result
in different management decisions.
In 42% and 63% of the cases in 2019 and 2020, respectively, when a categorical
difference of one was observed, one of the two stations had a category 1 infection
while the other had no infection. This suggests a correlation between low
categorical differences and a low severity of infection. Protection may not be
recommended for infections of low severity and in some cases, fungicide residue
from previous applications might be enough to protect the plant from these
infections.
32The categorization of the infections was necessary in order to enable statistical
analyses. A potential problem with this categorization is that the difference in
absolute RIM infection values between two stations may vary greatly (see
Appendices 2). This means that two stations with different categories could be very
similar in absolute RIM values, and therefore be treated the same way. Meanwhile
two stations with the same category could have a larger difference in absolute RIM
values, leading to a difference in treatment.
4.2. Principal component analysis and correlations of
infections
The variation of infection severity between stations was mostly ascribed to
differences between Meteoblue and the weather station or LantMet when running
a principal component analysis. Only one region in one year was found to have
similar variation between all stations. The amount of scab infections per orchard
were 28-43% lower in 2020 than 2019 and infections were particularly mild in the
West region, which may explain the similarities between weather data sources for
that region. The differences seen between the stations were supported by correlation
matrices.
The observed differences between Meteoblue and the in-orchard weather station
contradicts Trapman (2017). This is most likely due to the geographical factors,
since the study by Trapman (2017) was carried out in central Europe where
Meteoblue is based. The weather data for Meteoblue does not seem to have the
same accuracy in southern Sweden as in central and southern Europe. For all three
locations in the Northeast region 2020, Meteoblue had the same rain data despite a
distance of 12 km between the orchards. This had some major impacts on the result,
as two rain events were reported for all three Meteoblue stations, but not reported
for either the weather stations or LantMet stations in that region. These two rain
events caused a categorical difference in infection of two and three between the
Meteoblue stations and the other two. For 2019, there was one rain event on May
20th that gave an infection on all ten weather stations, whereas seven out of ten
LantMet stations and zero Meteoblue stations predicted any infection.
4.3. Categorical differences of infections
Of categorical differences larger than one in predicted infections between the
different weather sources, 65% was mainly due to differences in rainfall prediction.
This was also where most of the difference between the weather station and
LantMet was seen. This is not surprising since rainfall measurements are
33You can also read