Has Africa Missed the Bus? The Condescending Consensus on the Continent's Growth
←
→
Page content transcription
If your browser does not render page correctly, please read the page content below
Has Africa Missed the Bus?
The Condescending Consensus on the Continent’s Growth

                       Indermit S. Gill
                   (indermit.gill@duke.edu)
                              and
                      Kenan Karakülah
                 (kenan.karakulah@duke.edu)

           Duke Center for International Development
                 Sanford School of Public Policy
               Duke University, Durham NC 27708

                    First Draft: August 2017
                    Current Draft: May 2018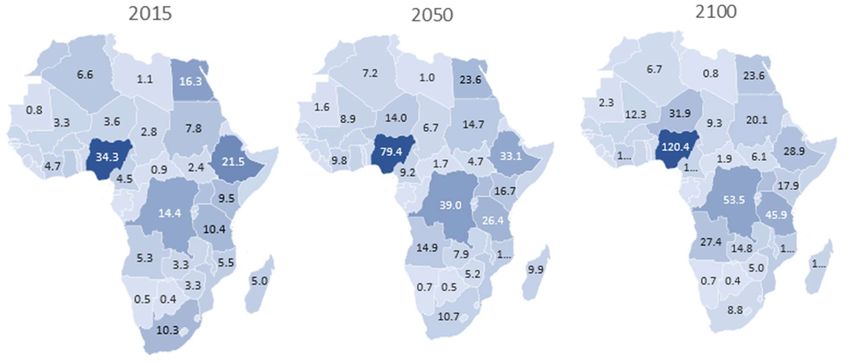
Has Africa Missed the Bus?

This paper takes a hard look at Sub-Saharan Africa’s economic growth between 1960 and 2016.
We have not chosen the period accidentally. 1960 was the year in which developing East Asia’s
per capita income first exceeded Sub-Saharan Africa’s. 2016 was when, in recorded history,
South Asia’s per capita income first exceeded that of Sub-Saharan Africa (henceforth Africa,
SSA, or the subcontinent). These numbers translate directly into changes in the global
distribution of misery. In 1960, more than half of the world’s abject poverty was in East Asia;
today that number is less than 15 percent. Back then, Africa’s share in world poverty was 15
percent; today it’s more than 50 percent. In 1980, there were about 205 million Africans living
in extreme poverty. Today, the number is slightly over 410 million. While headcount poverty
has doubled in Africa, it has gone down everywhere else.

Figure 1: Since 1980, the number of poor people has doubled in Sub-Saharan Africa

Source: World Bank (n/a), The State of the Poor

This long-term look leads us to a conclusion that is quite different from what many Africa
specialists seem to have concluded about the subcontinent’s development prospects. Their
consensus is an optimistic one, based largely on what has happened in the subcontinent since
2000 compared with what had happened in Africa in the last few decades of the 20 th century. A
broader perspective that goes back a few more decades and also compares Sub-Saharan Africa
with other regions is considerably more sobering. During the last three decades—the best
period ever for the developing world—the African subcontinent fell further behind the rest of
the world. Now, with tougher times ahead for the global economy, it is not unreasonable to ask
whether Africa has missed its big chance.

                                                  1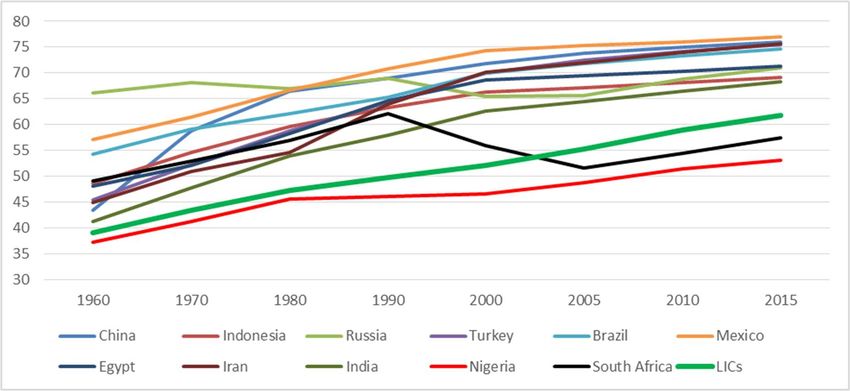
More importantly, this wider and longer look points to development strategies for the region
that are radically different from the current consensus. To simplify somewhat, the current
consensus treats each of the subcontinent’s 48 countries as equally important for the region’s
fortunes. Our conclusion is that what really matters are the prospects of Africa’s biggest middle
income economies—especially those of Nigeria, South Africa and Angola, which together
account for almost 60 percent of the region’s GDP. What dims the region’s prospects is that
these economies are not doing well, but this can change quickly. What is disheartening for us is
that these three middle-income countries have many of the structural attributes of low-income
economies. This is disheartening because it cannot quickly or easily be changed.

The Current Consensus
17 years ago, the front cover of the Economist called Sub-Saharan Africa “the hopeless
continent”. Scholars and economists who study Sub-Saharan Africa appear to have changed
their views since. So has the Economist. In 2011, a scant decade later, it apologized, with a new
cover and slogan “Africa rising”.
The Economist might have popularized the Africa Rising refrain, but it was Mahajan (2009) who
started to change the narrative with his claim that “the rise of Africa is hidden in plain sight”. In
his book Africa Rising: How 900 Million African Consumers Offer More Than You Think, he
proposed that expanding airports and flight paths and the rapid growth of banking, cellphones,
automobiles, and consumer goods are main indicators of Africa’s changed fortunes. These
developments are just the beginning, the book reasoned; the future held much promise.
The main cause for optimism was decent economic growth in Sub-Saharan Africa between 2000
and 2010. But there were other promising changes as well. In Emerging Africa: How 17
Countries are Leading the Way, Radelet (2010) thought that Africa’s future was bright because
of quicker economic growth, poverty reduction, and increased political accountability since the
1980s. Radelet (2010) emphasized five changes: more democratic and accountable
governments; better economic policies; the end of the debt crisis and changed relationships
with donors; the spread of new technologies; and the emergence of a new generation of
policymakers, activists, and business leaders.
By 2011, when the Economist expressed regret for calling Africa hopeless, it was the world’s
fastest-growing region. Over the next decade, its GDP was expected to grow by six percent
annually—if that happened, it would mean that its output would double by 2022. The article
emphasized past investments as the main reason to be hopeful about the continent, since the
benefits of investments take time (The Economist, 2013). According to Sachs (2012) new
energy discoveries, improvements in agriculture, advances in public health, better
infrastructure, and improved information, communications and transportation technologies
had helped countries in Africa to overcome many development problems. These advancements
would be the harbingers of rapid and self-sustaining growth in Africa (Sachs, 2012).
Based on an analysis of Demographic and Health Survey data on the consumption of consumer
durables and housing, children's health and mortality, the schooling of youth, and the allocation
of women's time between marriage and childbirth and market activity, Young (2012) concluded

                                                  2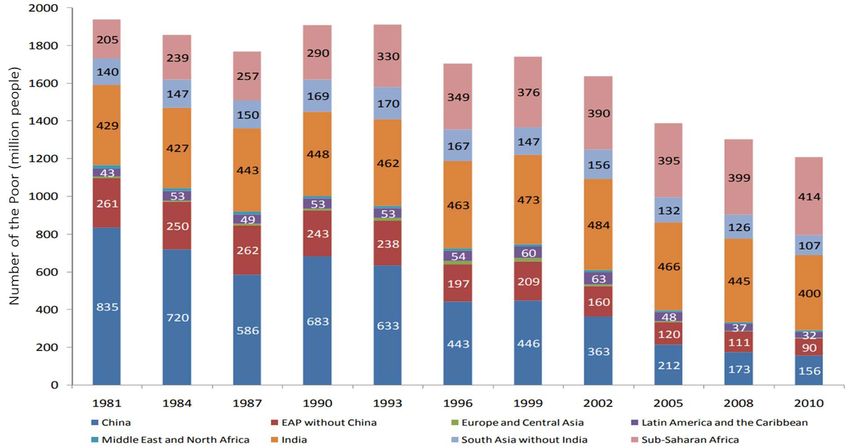
that Africa’s performance in raising living standards had been outstanding after 1990. The
increase in real material consumption in Africa was on par with growth rates in other regions of
the world. According to Young (2012), considering the devastating effects of the AIDS epidemic
the increase in living standards of about 3.4 to 3.7 percent per annum since 1990 was
miraculous.
By the turn of the century, Africa’s economies were not just growing rapidly in size, their shapes
were also being transformed—the surest sign that this growth would be sustained. McMillan et
al. (2014) argued that while structural change in the continent had been growth-reducing
between 1990 and 1999, it contributed positively to Africa’s overall growth after 2000. Low
levels of productivity and industrialization across most of the continent concealed a great
potential for growth through structural change. They also saw the recent trends in the global
economy as potential opportunities for SSA. First, Africa would be of interest to foreign and
local entrepreneurs because of increasing agricultural productivity in the continent. Second,
Africa’s young workforce could be attractive for labor-intensive manufacturing owing to rising
wages in China. Third, resource rich African governments could access financial resources by
taking advantage of the bargaining power stemming from natural resources (McMillan, Rodrik,
& Verduzco-Gallo, 2014).
To see whether the growth was sustainable or temporary, Cho and Tien (2014) analyzed
sources of exceptional growth in SSA that began in the mid-1990s. The subcontinent had
experienced promising developments, such as steady progress in decreased fertility, increased
foreign direct investment, political stability, and structural transformation (Cho & Tien, 2014).
Based on their analysis, they concluded that SSA would sustain its high growth performance.
McMillan and Harttgen (2014) claimed that “recent evidence suggests that the continent is
anything but hopeless”. They found that the share of labor force employed in agriculture
declined between 2000 and 2010 while shares of labor force employed in manufacturing and
services increased during the same period. In addition, they found that the mentioned
structural change accounts for about half of Africa’s per capita output growth for the period
2000-2010 (McMillan & Harttgen, 2014).
Diao and McMillan (2015) argued that Africa’s recent growth has been led by the “in-between”
sector.1 Since the “in-between” sector is often informal, it is not reflected in official statistics
and hence missed by empirical studies. Many studies therefore give misleading views of Africa’s
growth performance. According to Diao and McMillan (2015), either the “in-between” sector or
modern sector can be the driving force of economy-wide growth in SSA. The co-existence of
“in-between” and modern sectors can be an opportunity for SSA rather than a sign of the
failure of the development process if governments take into account “in-between” sector in the
policy dialogue and development strategies (Diao & McMillan, 2015).

1
 Diao and McMillan (2015) classified small and medium sized businesses as the “in-between” sector by reference to
the Lewis Model (1979). According to them, small and medium-sized businesses, which are often informal and mainly
focus on buying and selling goods and services to and from the domestic market, have played a greater role in African
growth.

                                                         3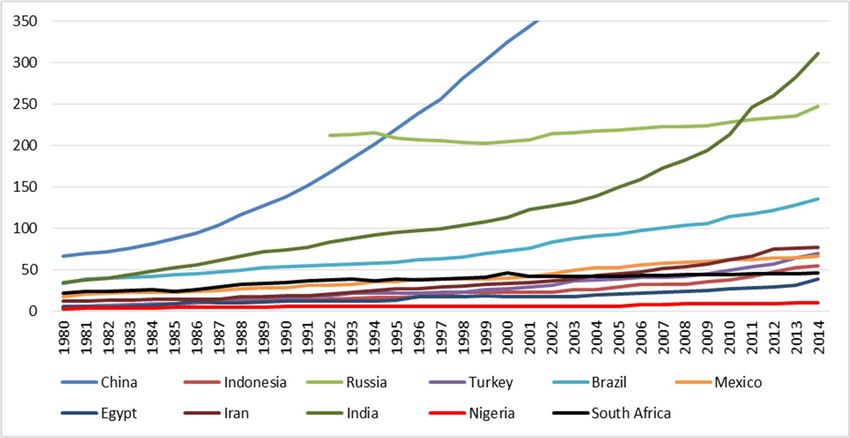
In an especially rosy view of Sub-Saharan Africa in a generally optimistic book, Radelet (2015)
pointed out that Africans are not as poor, not sick nearly as often, a lot more educated, and
better governed than they have ever been before. It is understandable why he was so upbeat:
incomes were rising, debt levels had been reduced, inflation had come down a lot, investment
was growing, and civil conflict had plummeted. (Radelet, The Great Surge: The Ascent of the
Developing World, 2015).
A year later, the McKinsey Global Institute (2016) was still singing the same tune, but it had
begun to hedge its bets. In its report on African economy—Lions on the Move II: Realizing the
Potential of Africa’s Economies—it documented that many SSA countries had grown quickly
since 2000, even though growth in oil exporting economies wobbled to a slowdown after 2010.
This has caused divergence between countries in the subcontinent. But McKinsey put on a
brave face: Africa still had strong fundamentals across the whole continent, it said, and long-
term growth prospects for the continent were good. Moreover, Africa’s young and growing
population had created a coming window of opportunity for Africa: the subcontinent was the
only remaining “pre-dividend region” in demographic terms, in that the share of the working
age population will continue to rise for the rest of the century. If its structural transformation
were sustained, Africa would have the fastest urbanization rate in the world. If Africans played
their cards right, this rapid urbanization would lead to massive productivity increases and much
higher incomes (McKinsey Global Institute, 2016).
All in all, then, Africa specialists have been bullish on the subcontinent’s growth prospects. We
are not sure that the optimism is justified.

Is the Consensus Correct?
In the 1960s Asians, on average, were much poorer than Africans. In 1960, SSA’s Gross
Domestic Product (GDP) per capita was slightly less than East Asia and Pacific’s GDP per capita,
but it was 3.5 times higher than South Asia’s. Between 1960 and 2016, the countries in SSA
grew at an average of about 0.7 percent per year in per capita terms while the countries in East
Asia and Pacific and South Asia grew by about 3.7 percent and 3.1 percent, respectively. By
2015, the per capita GDP of East Asia and the Pacific was roughly six times that of SSA. A year
later, South Asian per capita output levels had for the first time exceeded Africa’s.

                                                4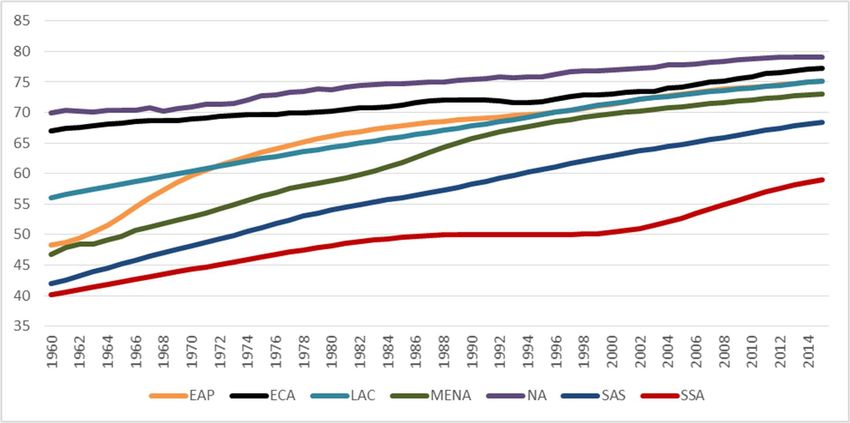
Figure 2: Sub-Saharan Africa and East Asia: GDP per capita (constant 2010 US$); 1960-2016

Source: Authors’ calculation based on data from the World Bank’s World Development Indicators.

Figure 3: Sub-Saharan Africa and South Asia: GDP per capita (constant 2010 US$); 1960-2016

Source: Authors’ calculation based on data from the World Bank’s World Development Indicators.

Comparisons with other regions are no more comforting. Between 1960 and 2016, the annual
growth rate of per capita GDP of Latin America and the Caribbean (LAC) averaged 1.7 percent,
more than double Africa’s. For a more meaningful comparison, though, we would have to
analyze LAC’s growth patterns prior to 1960 since by then the per capita GDP of LAC was three
times that of SSA. The World Bank’s World Development Indicators database goes back to only
to 1960, so we used data from the Groningen Growth and Development Center’s (GGDC)
Madison Project database to compare LAC’s earlier growth with SSA’s.
Between 1900 and 1960, the average per capita GDP growth rate of the largest eight Latin
American countries ranged between 1.1 percent per annum in Argentina and Chile to 4.2
percent per annum in Venezuela. Moreover, countries with lower per capita GDP levels in 1900
performed better than countries with higher initial per capita GDP, such as Argentina, Chile,
and Uruguay. Average annual per capita GDP growth rate of the mentioned eight Latin

                                                  5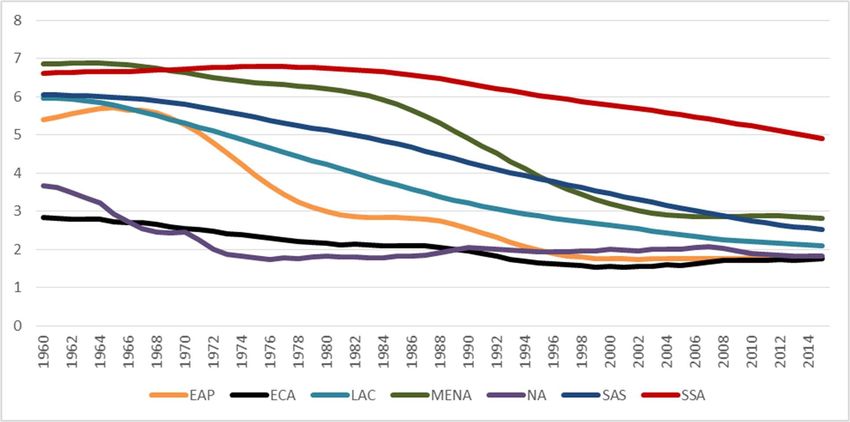
American countries was 1.8 percent per annum between 1900 and 1960. Taking into
consideration initial GDP per capita levels, SSA’s long-run growth lags far behind that of Latin
America.

Table 1: 8 Latin American Countries: Average Annual GDP per Capita Growth; 1900-1960
 GDP/Cap in 1900 Argentina          Brazil   Chile Colombia Mexico    Peru Uruguay Venezuela 8 L. America
 (1990 Int. GK$)     2,875             678    2,194     683   1,319      680   2,219     821        1,181
       1910-1900   2.9%             1.3%     3.2%    1.3%    2.5%     3.7%    3.5%    0.8%       2.6%
       1920-1910 -1.0%              2.3%     -0.8%   3.2%    0.7%     2.3%   -1.6%   2.8%        0.6%
  Growth Rates

       1930-1920   1.6%             0.9%     0.3%    3.3%   -1.2%     3.1%    4.9%   11.4%       1.6%
       1940-1930   0.2%             1.8%     1.2%    2.5%    1.4%     1.4%   -1.6%    1.6%       1.0%
       1950-1940   1.8%             3.0%     1.3%    1.3%    2.5%     1.9%    2.4%    6.3%       2.4%
       1960-1950   1.1%             3.4%     1.5%    1.5%    2.9%     2.6%    0.6%    2.6%       2.3%
                 1960-1900   1.1%   2.1%     1.1%    2.2%     1.5%    2.5%    1.3%     4.2%      1.8%
Source: Authors’ calculation based on data from the Groningen Growth and Development Center’s
(GGDC) Maddison Project database.

As a rule, over long enough periods, poorer economies tend to grow faster than countries that
have higher levels of income. African economies are now the only exception to this rule.
In general, people who are hopeful about Africa point to the region’s growth after 1990 and,
even more so, after 2000. A few years ago, some economists called African growth a miracle,
mainly due to the region’s unusually good performance between 2000 and 2010. The question
we ask is: While it was unusual by Africa’s own standards, was it miraculous?
To assess this claim, we divide our analysis into three periods: 1990–2000, 2000-2010, and
2010-2016. In all three periods, SSA’s average annual per capita growth rate was a lot lower
than South Asia’s and East Asia and Pacific’s. Between 1990 and 2000, SSA’s per capita GDP
actually shrank by 0.6 percent per annum while other regions’ per capita GDP grew between
1.4 percent to 3.2 percent annually. Between 2000 and 2010, even though SSA’s per capita GDP
grew by 2.8 percent per annum, it remained well below South Asia’s and East Asia and Pacific’s
per capita GDP growth rates, which were 5.2 percent per annum and 3.7 percent per annum,
respectively. Finally, between 2010 and 2016, SSA’s per capita GDP growth dropped to 0.8
percent per annum, falling far behind South Asia’s 5.1 percent growth performance and East
Asia and Pacific’s 3.7 percent growth. Unless Africa is being held to lower standards than half of
humanity—South and East Asia account for 55 percent of the world’s population—SSA’s per
capita GDP growth rates after 1990 fall short of exhibiting the attributes of a “growth miracle”.

                                                        6
Figure 4: No Miracle in Africa: Per capita GDP growth between 1990 and 2016

Source: Authors’ calculation based on data from the World Bank’s World Development Indicators.

In addition to SSA’s relatively growth performance, growth in Africa is more volatile. In its 2017
Regional Economic Outlook, the IMF analyzed growth accelerations (‘up-breaks’), growth
decelerations (‘down-breaks’) and sustained growth episodes (growth spells) in SSA and the
other regions of the world. According to the report, SSA experienced a significant portion of all
growth up-breaks and down-breaks over 1950–2016. This evidence suggests that growth in SSA
was marked by relatively frequent swings between expansions and contractions (IMF, 2017).

Figure 5: Selected Regions: Growth Up-Breaks and Down-Breaks; 1950-2016

Source: IMF, Regional Economic Outlook: Sub-Saharan Africa–Restarting the Growth Engine, 2017 (April).

African economies are also more prone to bigger fluctuations between up-breaks and down-
breaks. The median difference between after the up-break per capita GDP growth and before
the up-break per capita growth was ten percentage points in SSA, the highest volatility among
all regions. Likewise, the median difference between after the down-break per capita GDP

                                                    7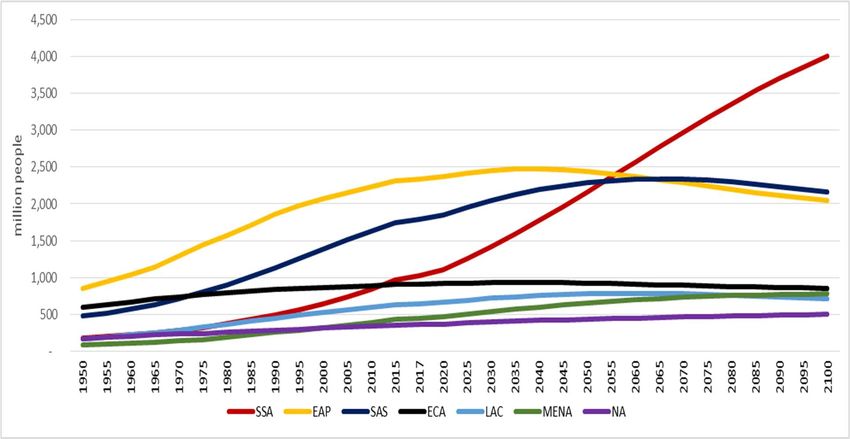
growth and before the down-break per capita growth was seven percentage points in SSA,
exceeded only by developing Middle East and North Africa (IMF, 2017).

Figure 6: Change in Median Annual per GDP Growth during Up-Breaks and Down-Breaks

Source: IMF, Regional Economic Outlook: Sub-Saharan Africa, 2017.

Perhaps the principal attribute of long-run growth patterns in Sub Saharan Africa is the brevity
of its growth spells.2 Over the last six decades, SSA has experienced more volatile and shorter
growth spells. The median length of complete growth spells in resource-intensive SSA
economies was about six years; it was five years in non-resource-intensive SSA countries (IMF,
2017). In contrast, this duration was close to 13 years in emerging Asia.
In assessing the region’s growth prospects, improvements in infrastructure are an important
indicator. The literature has documented the close relationship between infrastructure
development and economic growth. Higher productivity, potential for the creation of jobs,
reducing transaction costs, increasing human capital are a few of many outcomes of
infrastructure development3. According to the World Bank’s report Africa’s Pulse, SSA is lagging
all developing regions in nearly every dimension of infrastructure development. Even though
SSA has improving its infrastructure after 1990, the region is still well behind in the quality and
quantity of infrastructure compared to other regions in the world.
In particular, improvements in power and transport have been unimpressive (World Bank, 2017
b). In 2012, SSA’s electricity-generating capacity—which had improved from about 0.03
megawatts per 1,000 people to 0.04 megawatts per 1,000 people since 1990—was still less

2
  According to the IMF 2017 Regional Economic Outlook, a complete growth spell is defined as a period of time that
is sustained an average rate of per capita GDP growth of at least 2 percent after a growth up-break.
3
  See e.g., Commission for Africa (2005) and Straub (2008).

                                                        8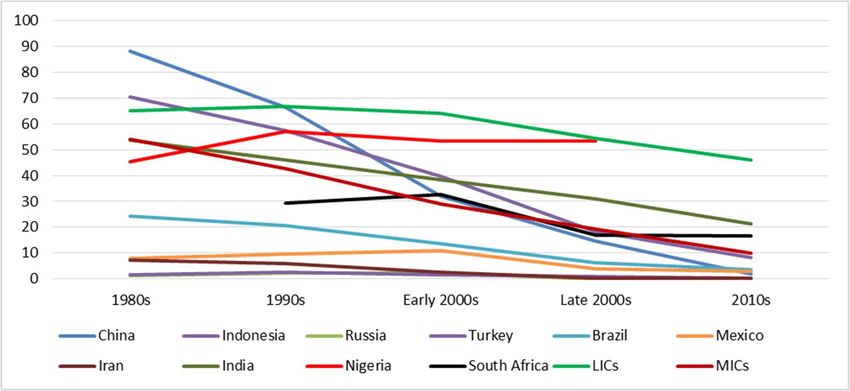
than a third of South Asia’s electricity-generating capacity. Besides this low capacity, only 35
percent of the population had access to electricity in SSA in 2014. The rural population’s access
to electricity rate was less than 20 percent in 2014. These numbers paint a dark picture in a
subcontinent where two thirds of the population are still rural.
SSA’s transport infrastructure is also inferior to that of other regions in the world. SSA had the
lowest road and railroad densities among developing regions in 1990-2014. This is
understandable for a large, sparsely populated, continent. What is discouraging is that it is the
only region where density of roads actually declined over 1991-2011. Even though access to
safe water and access to improved sanitation facilities rose significantly in SSA after 1990,
problems still persist. For instance, the access rate to improved sanitation facilities was just 30
percent in 2015. In addition, access to safe water in both urban and rural areas was much lower
than other developing regions over 1990-2015 (World Bank, 2017: Africa’s Pulse).

Figure 7: Selected Regions: Transport and Power Infrastructure

Source: World Bank Group, Africa's Pulse, No. 15, April 2017.

                                                    9
SSA also ranked at the bottom of all regions in almost every health indicator. The problem is not
just in outcomes; expenditure outlays have not increased nearly as much as in other parts of
the world. In 2014, SSA accounted for just 1.6 percent of global health expenditures. Though
per capita health expenditure in SSA more than doubled over 1995-2014, the regional growth
rate was the lowest—just about 4 percent annually, as compared with almost 7.5 percent for
South Asia and more than 8 percent for East Asia and the Pacific. Per capita health expenditures
in SSA were about $200 in 2014 (PPP constant 2011 dollars).
Figure 8: Per Capita Health Expenditures (PPP, constant 2011 international $); 1995-2014
Source: Authors’ calculation based on data from the World Bank’s World Development Indicators.
With an average life expectancy at birth of 59 years in 2015, SSA ranked at the bottom of all
regions. Even though the region’s performance was outstanding over 1960-2015, the
improvement in life expectancy at birth was not as rapid as in South Asia, East Asia and Pacific,
and Middle East and North Africa. In 1960, for example, SSA’s and South Asia’s life expectancy
at birth were, respectively, 40 years and 42 years. By 2015, life expectancy at birth in South Asia
exceeded that of SSA by 9 years.
Figure 9: Life Expectancy at Birth (years); 1960-2015
Source: Authors’ calculation based on data from the World Bank’s World Development Indicators.
10Fertility rates of other developing regions–EAP, MENA, SAS, LAC–had converged to developed
regions’ levels over 1960-2015, reaching 2-3 births per woman in 2015. Sub Saharan Africa
didn’t experience such a rapid decline in its fertility rates. Fertility decline in SSA proceeded
slowly, declining from 6.6 births per woman in 1960 to 4.9 births per woman in 2015.
Figure 10: Fertility Rates (births per woman); 1960-2015
Source: Authors’ calculation based on data from the World Bank’s World Development Indicators.
With about 83 deaths per 1000 births in 2015, under-5 mortality rate in SSA was still far worse
than other regions, even though the improvement since 1960 has been outstanding. During the
same period, under-5 mortality rates in other regions had converged to developed countries’
under-5 mortality rates. A similar story can be told for maternal mortality. SSA made progress in
reducing maternal mortality rate between 1990 and 2015, but the progress is less than in other
regions. During 1990-2015, the reduction in maternal mortality rate in SSA was 45 percent, but
it was 67 percent in South Asia. In 2015, maternal mortality in SSA was almost three times that
of the next worst performer, South Asia.
High levels of stunting4 among children under the age of five years in SSA is another
impediment to development of the continent. Stunting in early life has long term effects,
including poor cognition and educational performance, diminished physical development, low
adult wages, lost productivity, increased risk of nutrition-related chronic diseases (de Onis,
Blössner, & Borghi, 2012). With 34.1 percent of children under the age of five, the prevalence of
stunting was highest in SSA in 2016 after South Asia. Furthermore, improvement in prevalence
of stunting in SSA has remained behind that of other developing regions over 1990-2016.
Reduction in prevalence of stunting was 31 percent in SSA over 1990-2016 while it ranged from
36 percent in North America to 67 percent in East Asia and Pacific.
4
According to the World Health Organization, stunting is defined as having a height more than two standard
deviations below the median value of the NCHS/WHO growth reference for any given age (WHO, 1995).
11Figure 11: Selected Regions: Maternal and Under-5 Mortality Rates
Source: Authors’ calculation based on data from the World Bank’s World Development Indicators and
UNICEF database.
Figure 12: Prevalence of Stunting (Height for age, % of children under-5); 1990-2016
Source: Authors’ calculation based on data from the World Bank’s World Development Indicators.
12With an average annual growth rate of population of 2.6 percent, SSA’s population has
skyrocketed from 180 million people in 1950 to 1,023 million people in 2017. Its population is
projected to exceed South Asia’s and East Asia and Pacific’s population by around 2050 (United
Nations, 2017). According to the United Nations’ World Population Prospects, SSA’s population
is projected to maintain an average annual growth rate of 1.7 percent; average annual
population growth will range between -0.2 percent in East Asia and Pacific to 0.7 percent in
Middle East and North Africa.
A growing population can have potentially positive impacts on the economy if a rapid increase
in absolute number of young workers entering the labor force is matched with growing demand
for their labor and skills. Otherwise, a large youth cohort may reduce cohort wages. Moreover,
generating enough jobs can be difficult in order to absorb large inflows of youth. Therefore,
rapid increase in population can lead to large-scale youth unemployment and destabilize
economies (Canning, Raja, & Yazbeck, 2015).
Figure 13: Asia, SSA, LAC, Europe and North America: Population; 1950-2100
Source: Authors’ calculation based on data from the United Nations’ World Population Prospects, the
2017 Revision.
According to the United Nations’ World Population Prospects, SSA’s young population will
continue to grow a lot over the next eight decades while other regions’ youth population will
either stabilize or decrease. SSA’s youth population will catch up to East Asia and Pacific’s and
South Asia’s by around 2035 and 2040, respectively. If current trends continue, by 2100, there
will be as many young people in Sub Saharan Africa as in the rest of the world.
13Table 2: Asia, SSA, LAC, Europe and Northern America: Population Growth Rate (Average
Annual Percentage Change); 1950-2100
1960-1950 1970-1960 1980-1970 1990-1980 2000-1990 2010-2000 2017-2010 2017-1950
SSA 2.1% 2.5% 2.8% 2.9% 2.7% 2.7% 2.8% 2.6%
MENA 2.6% 2.8% 2.9% 3.2% 2.2% 2.0% 1.9% 2.5%
SAS 1.8% 2.2% 2.4% 2.3% 2.0% 1.6% 1.3% 2.0%
LAC 2.7% 2.7% 2.4% 2.0% 1.7% 1.3% 1.1% 2.0%
EAP 1.9% 2.3% 1.9% 1.7% 1.1% 0.8% 0.7% 1.5%
NA 1.7% 1.2% 1.0% 1.0% 1.1% 0.9% 0.7% 1.1%
ECA 1.1% 1.0% 0.7% 0.6% 0.2% 0.3% 0.3% 0.6%
Source: Authors’ calculation based on United Nations’ World Population Prospects, the 2017 Revision.
Among economists and international development scholars, wishful thinking about Africa’s
youth is common. Many see the rise of Africa’s youth population as an aid to prosperity, not a
drag on economic growth. McKinsey Global Institute’s Lions on the Move II argued that Africa’s
young and growing population is an opportunity for Africa since aging is one of the greatest
risks of the world, pointing to a positive association between an increasing working-age
population and economic growth (McKinsey Global Institute, 2016). Theoretically, a rapid
increase in youth population could lead to an increase in savings, higher productivity and more
rapid economic growth. But for this to happen, there have to be adequate investments in the
health and education of young people; rapid growth in the number of youth necessitates rapid
improvements in both access to education and its quality. And private enterprise should be
sufficiently vibrant—and regulations reasonably balanced—to create enough job opportunities
in order to absorb growing workforce. It is not obvious that most countries in Africa have
created these conditions.
Figure 14: Asia, SSA, LAC, Europe and Northern America: Youth aged 15-24 years; 1950-2100
Source: Authors’ calculation, based on the United Nations World Population Prospects, the 2017 Revision.
14Figure 15: The youth population in Africa will double by 2050
Population aged 15-24 years, by country
Source: Authors’ calculation, based on the United Nations World Population Prospects, the 2017 Revision.
Students in SSA have the worst education, on average, in the world. Pupil-teacher ratios in
primary education in SSA actually got worse over 1970-2014, while all other regions had
experienced improvements. In 2014, SSA ranked at the bottom of all regions in pupil-teacher
ratio in primary education. In secondary education, the situation is similar.
Figure 16: Selected Regions: Pupil-Teacher Ratio; 1970-2014
Source: Authors’ calculation based on data from the World Bank’s World Development Indicators.
SSA also ranked at the bottom of all regions in school gross enrollment rates. Although there
were improvements in both primary school and secondary school gross enrollment rates over
1970-2014, SSA is still well behind other regions. Moreover, gross enrollment rates for
secondary and tertiary levels are worrying for SSA. In 2014, secondary school gross enrollment
rate in SSA was 42.7 percent and tertiary school gross enrollment rate in SSA was just 8.6
percent. In other regions, secondary school gross enrollment rates ranged from 64.8 percent in
South Asia to 106 percent in ECA and tertiary school gross enrollment rates ranged from 20.8
percent in South Asia to 65.1 percent in ECA.
15Figure 17: Selected Regions: School Enrollment Rate (percent, gross); 1970-2014
Source: Authors’ calculation based on data from the World Bank’s World Development Indicators.
Unless education is improved in a hurry, the growing youth population is likely to be a threat
for countries in Sub Saharan Africa, not an opportunity.
Since 2000, African economies have proved that they can grow. But even so, growth in Sub-
Saharan Africa lagged behind that of developing East Asia and South Asia. Sub-Saharan Africa’s
annual per capita income growth averaged 2.8 percent per annum between 2000 and 2010 and
0.8 percent between 2010 and 2016. But South Asian incomes have grown by 5 percent each
year, and East Asia at almost 4 percent. Africa is moving forward, but it is getting left behind.
Part of the problem is that Africa’s economies have been more volatile. Growth in Sub-Saharan
Africa is characterized by frequent swings between expansions and contractions. In Africa,
these swings are not just more frequent, they are also bigger. The IMF has estimated that the
median difference in growth before and after expansion per capita growth was ten percentage
points in Sub-Saharan Africa, the highest volatility among all regions.
In short, SSA has fallen short of depicting “growth miracle” characteristics during 1950-2016 in
spite of the region’s impressive economic progress during some shorter periods. SSA still has a
long way to catch up to East Asia and Pacific and South Asia, regions that have depicted
“growth miracle” characteristics after the 1970s. To get to the root of the problem, the next
section of this paper take a closer look at countries in the subcontinent.
The Problem: Africa’s Big Middle-Income Economies
When we looked at Sub-Saharan Africa more closely, and contrasted what we found with the
experience of other regions, it was not hard to see the problem. The main problem with the
subcontinent is that its biggest economies have not done well. And even when they did, their
relatively weak economic relations with neighbors contributed to the sluggishness of the
subcontinent.
16The importance of Nigeria and South Africa
Even if Nigeria and South Africa did not have any economic relations with the countries around
them, their economic performance would sizeably determine that of the continent. In 2016, the
two countries constituted more than half of SSA’s GDP. Adding Angola to the mix makes it
almost 60 percent.
Unsurprisingly, South Africa and Nigeria play a big role in SSA’s intra-regional trade. According
to the World Bank’s World Integrated Trade Solution database, exports from South Africa and
Nigeria to the rest of SSA constituted about 21 percent of SSA’s intra-regional exports in 2015,
and their total imports from SSA was some 63 percent of intra-regional imports in 2015.
Moreover, in 2015, South Africa was the fifth export partner of SSA (as a region) after China,
India, the United States and Netherlands. In addition, South Africa was the second import
partner of the region after China in 2015.5 Furthermore, according to the IMF’s 2012 Regional
Economic Outlook, the imports of 21 countries in SSA from South Africa add up to more than
one percent of their GDP.
Like any other part of the world, intra-regional trade is important for economic growth in SSA
(Kimenyi, Zenia A., & Routman, 2012). The World Bank’s Africa’s Pulse states that “…there is
enormous untapped potential for intra-regional trade in Africa to increase and drive export
diversification, job creation, and poverty reduction…” (World Bank, 2017 b). By creating
economies of scale, intra-regional trade can help the region’s industries become more
competitive (Kimenyi, Zenia A., & Routman, 2012). Moreover, intra-regional trade allows
export-oriented firms to learn how to enter more distant foreign markets, access foreign
suppliers and customers (Page, 2012).
Further, intra-regional trade can help in establishing regional value chains to shape global
exports of manufactures, such as phosphates for fertilizers and regional processing of nickel
and copper (World Bank, 2017 b). It can enable technology and knowledge transfers to SSA
countries (Kimenyi, Zenia A., & Routman, 2012). Improving food security, potential for cross-
border trade in services, such as health, education and business services, and arising
opportunities for cross-border trade in basic manufactures, such as metal and plastic products
are among many other benefits of increasing intra-regional trade (World Bank, 2017 b). In
addition, improving intra-regional trade can generate the pressure and resources for improving
infrastructure and bring in much needed foreign direct investment (Kimenyi, Zenia A., &
Routman, 2012). For all these reasons, trade within Sub-Saharan Africa has to be a high priority.
Slowly growing intra-regional trade and financial relations
It would be fair to say that it has not been a priority. Intra-SSA trade has remained quite low
over the years. Regional exports and imports are, on average, about 24.8 percent and 17.5
percent of SSA’s total exports and imports in 2015, respectively. Even though SSA recorded an
improvement in intra-regional trade in recent years, it is still limited.
5
For further details, see http://wits.worldbank.org/CountryProfile/en/Country/SSF/Year/2015/Summary
17Figure 18: Within region trade, 2010-2015
Source: Authors’ calculation based on data from the World Bank’s World Integrated Trade Solution
Database 2017.
In addition to formal trade relationship between Nigeria and South Africa and the rest of SSA,
there are longstanding informal trade links between Nigeria and its neighbors. Trade in some
agricultural goods such as cereals and grains and some petroleum products between Nigeria
and its neighbors are sizeable, but largely not recorded. For example, 70 percent of the cereal
needs of Niger and Chad are met by Nigeria, but just a fraction of this trade is recorded in
merchandise trade data. Moreover, smuggled Nigerian gasoline meets more than 80 percent of
Benin’s domestic fuel consumption (IMF, 2012).
According to the IMF’s 2017 Regional Economic Outlook, Pan-African banks have been
expanding across the subcontinent over the last two decades. The number of subsidiaries of the
largest pan-African banking groups skyrocketed after the early 2000s (IMF, 2017). South Africa
and Nigeria are the headquarters of many of the largest Pan-African banks. In 2013, for
18example, South Africa based pan-African banks had 35 branches and subsidiaries across SSA
whereas Nigeria-based Pan-African banks had 62 branches and subsidiaries (IMF, 2015). 6
In addition, Pan-African banks in Nigeria and South Africa have big ownership stakes in other
countries’ financial and nonfinancial entities. Among such banks, Nigerian banking groups have
the most controlling ownership linkages with other African economies’ corporate sectors. South
African banking groups have strong linkages with the rest of Africa through non-controlling
interests even though they have fewer controlling ownership linkages (IMF, 2017). Pan-African
banks have been increasing their activities, including nonbank activities such as insurance and
securities dealings (IMF, 2017). Moreover, South African firms have started to provide nonbank
financial services, including insurance and wealth management, across the region (IMF, 2012).
As a result, Pan-African banks in Nigeria and South Africa are the largest banks across SSA, and
have strong linkages with the rest of the region. So financial sector growth in Nigeria and South
Africa has spillover effects in the rest of SSA. In the 2012 (October) Regional Economic Outlook,
the IMF documented the significant impact of South Africa’s outward foreign direct investment
(FDI) on the region’s total inward FDI. The report stated that roughly one-fourth of total
recorded FDI by South Africa was to SSA in 2011. In other words, as of 2011, South Africa’s
outward FDI to SSA had reached 6 percent of its GDP (IMF, 2012).
Figure 19: South Africa’s Outward Direct Investment; 1997-2010
Source: IMF, Regional Economic Outlook: Sub-Saharan Africa – Maintaining Growth in an Uncertain
World, 2012 (October).
Other spillovers
The Nigerian and South African economies also create other spillover effects across SSA. Many
immigrants and temporary workers from SSA live and work in South Africa and Nigeria (IMF,
2012). In 2014, for example, South Africa hosted some 1.6 million immigrants from SSA, of
which roughly about 1.5 million are from Southern African Development Community (SADC)
6
According to IMF (2015), Kenya had 27 branches and subsidiaries across SSA and all other SSA countries had 85
branches and subsidiaries across SSA.
19region (Lehohla, 2015). These immigrants contribute to their home countries by sending
remittances (IMF, 2012). According to the World Bank’s Migration and Remittances Factbook
2016, South Africa, Côte d’Ivoire, and Nigeria are the top three immigration countries in 2013.
Moreover, with $1.1 billion in remittances sent in 2014, South Africa is the second remittance
sender in SSA (World Bank, 2016).
According to the IMF’s 2012 (October) Regional Economic Outlook, there is also a strong
association between Nigeria and its neighboring countries in terms of inflation dynamics. The
correlation in food prices is even stronger (IMF, 2012).
There are political spillovers too. Being a member of international clubs such as the G20 and
the BRICS club, South Africa is a gateway to SSA for emerging and advanced economies in other
parts of the world.7 Since the G20 brings leaders and high level executives together from major
economies of the world, critical and important decisions are made in the G20 summits. For
instance, during its 2009 summit, member countries agreed on $1.1 trillion in new funds,
including trade credits and capital increases to the IMF, in order to help countries with troubled
economies (Hutt, 2016) & (Landler & Sanger, 2009). Therefore, South Africa is a bridge between
the world’s major economies and SSA, and well-placed to inform the world about the region’s
opportunities and aspirations.
Generating about 23 percent of the world economy and constituting some 43 percent of the
world’s population, the BRICS club is made up of Brazil, Russia, India, China and South Africa
(BRICS Official Website, 2017). The BRICS countries have begun to influence global economic
and political affairs. It is expected that the BRICS club will play a role in bringing about global
economic governance reforms (Yong, 2012). Furthermore, South Africa can be a bridge
between the rest of Africa and the BRICS countries, and can provide a platform for a fruitful
dialogue between Africa, the BRICS and the G20 (Yong, 2012).
The regional role of large Middle Income Countries
Emerging market economies have been playing a significant role in the global economy for the
last a couple of decades. Growth in emerging market economies can have meaningful cross-
border spillovers taking into consideration their rapid integration into global trade and finance
networks (Huidrom, Kose, & Ohnsorge, 2017). The study by Huidrom et al. (2017) found that a 1
percentage point increase in growth of seven largest emerging market economies is associated
with a 0.9 percentage points increase in growth in other emerging and frontier markets in
cumulative terms at the end of three years (The countries are China, Russia, India, Brazil,
Turkey, Mexico, and Indonesia). Moreover, at the end of three years, the spillover effects on
world growth is an estimated 0.6 percentage points in cumulative terms (Huidrom, Kose, &
Ohnsorge, 2017).
In addition to seven largest emerging economies identified by Huidrom et al. (2017), we
included two largest middle income economies in both SSA and Middle East and North Africa
7
The G20 includes 19 major middle income and advanced economies and the European Union. Its members account
for about 85 percent of the world economy, and about two-thirds of the world’s population (Hutt, 2016).
20(MENA) into our analysis. Thus, the emerging economies included in this paper are
representative of their regions not only in terms of GDP, but also population and trade.
The relationship between annual growth rate of the largest emerging economies and that of
the rest of the countries in each region is different. Even though the aforementioned
relationship is positive in SSA, it is not strong over 1961-2016. We also decomposed our analysis
into six periods. The relationship between annual growth rate of the largest emerging
economies and that of the rest of the countries in each region is positive and stronger, except
Iran for both periods and China for the period after 2000. Moreover, the relationship between
annual growth rate of South Africa and that of SSA is quite strong over 1991-2016. The
relationship is even stronger for some regions when 5-year average growth rates are taken into
account. A possible reason is that spillover effects from the largest regional economies to the
rest can take time.
Table 3: Selected Countries and Regions: Population and GDP
ii iii, iv ii iii, iv
iPopulation Population's GDP GDP's v Population GDP GDP's
EAP-Dev ECA-Dev Share
(million) Share (trillion $) Share (million) (trillion $) Share
China 1,409.5 67.4% 19.85 75.4% Russian Federation 144.0 34.7% 3.52 45.6%
Indonesia 264.0 12.6% 2.81 10.7% Turkey 80.7 19.5% 1.88 24.4%
Sample Total 1,673.5 80.0% 22.66 86.0% Sample Total 224.7 54.2% 5.41 69.9%
Region Total 2,091.4 26.34 Region Total 414.7 7.73
ii iii, iv ii iii, iv
Population GDP GDP's Population GDP GDP's
LAC Share MENA Share
(million) (trillion $) Share (million) (trillion $) Share
Brazil 209.3 32.5% 2.91 31.9% Egypt 97.6 20.1% 0.99 12.8%
Mexico 129.2 20.0% 2.15 23.5% Iran 81.2 16.7% 1.27 16.5%
Sample Total 338.5 52.5% 5.06 55.4% Sample Total 380.1 78.3% 2.26 29.4%
Region Total 644.4 9.13 Region Total 485.2 7.69
ii iii, iv ii iii, iv
Population GDP GDP's Population GDP GDP's
SAS Share SSA Share
(million) (trillion $) Share (million) (trillion $) Share
India 1,339.2 74.9% 8.07 81.3% Nigeria 190.9 18.0% 1.01 28.5%
South Africa 56.7 5.3% 0.69 19.3%
Sample Total 1,339.2 74.9% 8.07 81.3% Sample Total 247.6 23.3% 1.70 47.8%
Region Total 1,787.8 9.93 Region Total 1,061.1 3.55
Notes:
i) EAP-Dev: Developing countries in EAP region.
ii) 2017 data.
iii) GDP PPP (constant 2011 international $)
iv) 2015 data for Iran and 2016 data for the rest.
v) ECA-Dev: Developing countries in ECA region.
Source: Authors’ calculation based on data from the World Bank’s World Development Indicators and the
United Nations’ World Population Prospects, the 2017 Revision.
21Table 4: Selected Regions: The Relationship between Growth Rates of the Largest Emerging
Economies and the Rest of the Region (Correlation Coefficients); 1961-2016
Correlation Coefficients 1961-2016
Annual 5 Yr Avg
Country Region 1961-1970 1971-1980 1981-1990 1991-2000 2001-2016 growth growth
India SAS 0.03 -0.18 0.20 0.06 0.60 0.14 0.34
Russia ECA-Dev 0.74 0.95 0.83 0.98
Turkey ECA-Dev -0.20 0.09 0.49 0.24 0.14 0.17 0.28
Egypt MENA-Dev 0.45 -0.06 0.12 0.70 0.12 0.13 0.67
Iran MENA-Dev -0.44 -0.02 -0.05 -0.46 -0.19 -0.19 -0.40
China EAP-Dev -0.32 -0.18 0.27 0.53 -0.18 -0.09 -0.37
Indonesia EAP-Dev -0.37 0.12 -0.27 0.79 0.18 0.10 0.15
Nigeria SSA 0.20 0.35 0.12 0.21 0.20 0.22 0.35
South Africa SSA 0.23 -0.26 0.03 0.58 0.59 0.07 0.06
Brazil LAC-Dev 0.34 0.60 0.25 0.08 0.42 0.30 0.40
Mexico LAC-Dev 0.35 0.11 -0.24 0.12 0.39 0.20 0.07
Source: Authors’ calculation based on data from the World Bank’s World Development Indicators.
The problem with Africa’s two biggest economies: South Africa and Nigeria
Empirical evidence suggests that many countries were able to grow from low income to middle
income economies; however, only a few of them were able to grow to high income economies
over the years. Gill and Kharas (2007) defined this tendency as the “middle income trap”.
According to the World Bank, only 13 countries out of 101 middle income countries in 1960
were able to grow to high income status over 1960-2010 (Agénor, Canuto, & Jelenic, 2012). 8
One of the interpretations of the middle income trap is the absence of convergence to a
benchmark advanced country (Gill & Kharas, 2015). In our analysis, we use the United States as
the benchmark country. Figure 20 shows that all of the largest middle-income economies
except China did not converge to the United States during the period 1950-2010. In Figure 20,
all emerging market economies except China are located near the 45-degree line, which means
their income per capita relative to the United States didn’t change too much during this period.
The most striking result of this analysis is that besides Russia, the only countries below the 45-
degree line are the two largest middle income economies of sub-Saharan Africa. In other words,
SSA’s largest middle income economies underperformed the US as well as other large middle
income economies.
Keep in mind that Nigeria and South Africa account for more than half of the region’s economic
output. If half the region’s economy not converge to the benchmark, the odds of Africa doing
well as a region are remote.
8
Equatorial Guinea, Greece, Hong Kong SAR (China), Ireland, Israel, Japan, Mauritius, Portugal, Puerto Rico, the
Republic of Korea, Singapore, Spain, and Taiwan, China.
22Figure 20: The Largest Middle-Income Countries: Growth Performance Relative to the US;
1950 and 2010
Source: Authors’ calculation based on data from the Groningen Growth and Development Center’s
(GGDC) Maddison Project database.
Looking for reasons for this lack of convergence points to the importance of self-financing.
Domestic resources are the most essential untapped source for developing countries for
financing national development efforts (Inter-Agency Task Force on Financing for Development,
2016). Domestic revenue mobilization generates fiscal space for sustainable budget
expenditures, improves accountability and reduces dependency on foreign aid (Domestic
Resource Mobilisation, n.d.). Total government revenue as percentage of GDP is one of the key
monitoring indicators of the Sustainable Development Goals (17.1) in order to track domestic
revenue mobilization efforts of countries (Inter-Agency Task Force on Financing for
Development, 2016). The average tax to GDP ratio is around 10–15 percent in the low income
countries while it averages 35 percent for high-income Organization for Economic Cooperation
and Development (OECD) countries (Runde & Savoy, 2016).
Tax-to-GDP ratios of the largest middle income economies other than South Africa and Nigeria
range from 10 percent to 20 percent. Nigeria is at the bottom of all selected middle income
economies with a tax to GDP ratio of about 2 percent in 2013, while South Africa’s tax to GDP
ratio is getting close to the average of high-income OECD countries. Since Nigeria is an oil-rich
country, the low level of tax to GDP ratio may not be perceived as a problem. However,
mobilizing domestic revenues is particularly important for resource rich countries since
volatility in resource revenues is transmitted to the budget unless an appropriate fiscal
framework is instituted (Crivelli & Gupta, 2014). Nigeria’s low level of tax to GDP ratio poses a
risk to economic growth. For example, although Nigeria’s accumulated government debt is
about 18.6 percent of its GDP, it is more than three times its annual revenues. At 5.3 percent of
GDP, the Nigerian government’s revenues are considerably below South Africa’s average of
about 25 percent since 2005 (Johnson, 2017).
23Figure 21: The Largest Middle-Income Countries: Tax to GDP Ratio (Percentage); 1975-2015
Source: Authors’ calculation based on data from the World Bank’s World Development Indicators.
Modern energy services are key for both economic development and human well-being
(International Energy Agency, n/a). Access to reliable and modern energy is the fundamental
ingredient for the provision of clean water, sanitation, healthcare, reliable and efficient lighting,
heating, cooking, mechanical power, transport and telecommunications services (International
Energy Agency, n/a). Low levels of access to electricity is another challenge for major
economies of SSA as well as the rest of the region.
With just 58 percent of population having access to electricity in 2014, Nigeria stands at the
bottom among eleven selected major developing economies. Even South Africa does not do
well: though 86 percent of its population had access to electricity in 2014, the level was below
the average of all middle income countries, which was 89 percent in 2014. Access to electricity
in Nigeria and South Africa in 2014 was below that of other major developing countries, except
India and Indonesia, in 1990. By 2014, it was below that of every major developing economy
except India.
In addition to low levels of access to electricity in Nigeria and South Africa, total installed
capacity in these two countries is abnormally low. With less than 50 million megawatts in 2014,
Nigeria and South Africa ranked at the bottom of comparator countries, with the exception of
Egypt.
24Figure 22: The Largest Middle-Income Countries: Access to Electricity (Percentage of
Population); 1990-2014
Source: Authors’ calculation based on data from the World Bank’s World Development Indicators.
Figure 23: The Largest Middle-Income Countries: Total Electricity Installed Capacity (Million
Kilowatts); 1980-2014
Source: Authors’ calculation based on data from the US Energy Information Administration’s
International Energy Statistics.
Note: China is not included in the figure after 2001 due to the large gap between China and other
countries. China’s total electricity installed capacity reached 1.6 billion kilowatts in 2014.
25Transport is key to ensure the effective functioning of the economy. Effective transport facilities
ensure access to markets for manufacturing and service sector firms, farms and agribusinesses,
and facilitate the movement of workers to suitable jobs (World Economic Forum, 2016). Nigeria
and South Africa fall on opposite sides of the transport spectrum. According to the Global
Competitiveness Report 2016-2017, Nigeria is at the bottom of the selected countries (and
nearly at the bottom of all 138 countries) in transport infrastructure, while South Africa is
nearly at the top of all selected countries in transport infrastructure.
Table 5: The Largest Middle-Income Countries: Transport Infrastructure9; 2016-2017
Quality of Railroad Quality of Port Quality of Air Transport
Quality of Roads
Infrastructure Infrastructure Infrastructure
Rank Value Rank Value Rank Value Rank Value
China 39 4.8 14 5.1 43 4.6 49 4.8
Indonesia 75 3.9 39 3.8 75 3.9 62 4.5
Russia 123 2.8 25 4.4 72 4 65 4.4
Turkey 28 5 55 3 52 4.5 29 5.4
Brazil 111 3 93 1.9 114 2.9 95 3.9
Mexico 58 4.3 59 2.9 57 4.4 61 4.6
Egypt 107 3 73 2.6 58 4.3 52 4.8
Iran 68 4.1 46 3.5 73 3.9 111 3.4
India 51 4.4 23 4.5 48 4.5 63 4.5
Nigeria 126 2.6 103 1.5 117 2.8 119 3.2
South Africa 29 5 40 3.8 37 4.9 10 6
Source: World Economic Forum, The Global Competitiveness Report 2016-2017.
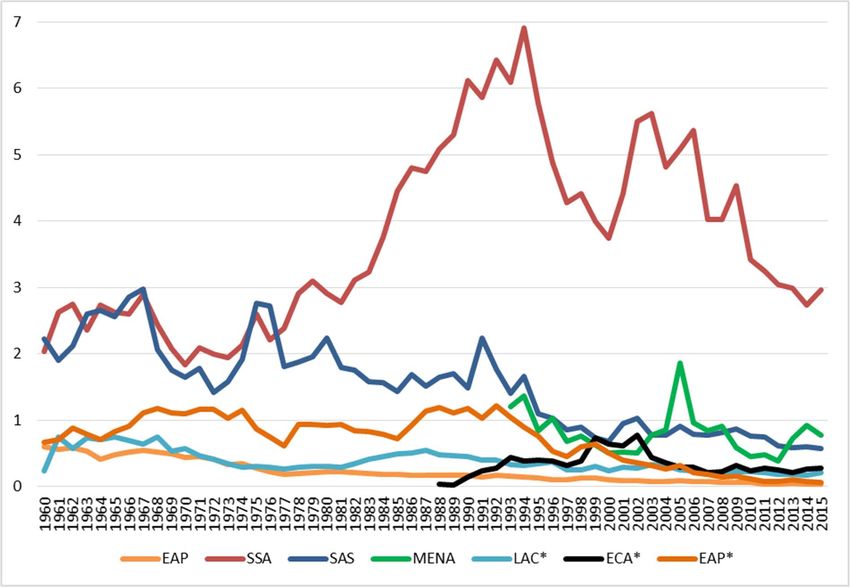
Economies and societies in which youth unemployment is high are prone to be vulnerable to
instability and stagnation (ILO, 2010). Among selected middle income countries, South Africa is
especially exposed to the risk of high youth unemployment. With an unemployment rate of
52.3 percent in 2016, South Africa compares poorly with other large middle income countries.
South Africa’s youth unemployment rate was the third highest in the world after Bosnia and
Herzegovina (67.6 percent) and Swaziland (52.8 percent).
9
As shown in the Global Competitiveness Report 2016-2017, values are on a 1-7 scale of which 7 is the best. Ranks
depict the country’s relative rank among 138 countries.
26Figure 24: The Largest Middle-Income Countries: Youth Unemployment (Percentage of total
labor force ages 15-24) (modeled ILO estimate); 1991-2016
Source: Authors’ calculation based on data from the World Bank’s World Development Indicators.
A large informal economy has many drawbacks. Informality is often associated with lower
growth and productivity, and lack of social coverage and other related employment benefits
(Benjamin, Beegle, Recanatini, & Santini, 2014). Moreover, informal companies are prone to be
small and uncompetitive because of poor access to finance and new technology. In addition,
informality reduces government revenues. As a consequence of this, it may be hard for
governments to provide public services. If governments try to increase tax rates, this may
create an additional incentive to be informal for those in formal sector, creating a vicious cycle
between high taxes and high informality (García-Bolívar, 2006).
Table 6: The Largest Middle-Income Countries:
Informal Economy (Percentage of GDP)10
% of GDP 2008 2010-2014
China 11.5
Indonesia 17.8
Russia 40.3
Turkey 28.6
Brazil 36.4
Mexico 28.5
Egypt 32.4
Iran 17.0
India 20.0
Nigeria 49.6 65.1
South Africa 24.9 25
Sources: Elgin, C., and Oztunali, O. (2012). Shadow Economies around the World: Model Based Estimates. Bogazici
University,, Department of Economics. Istanbul, Turkey: Bogazici University. (for 2008 data)
Medina, L., Jonelis, A., & Cangul, M. (2017). The Informal Economy in Sub-Saharan Africa: Size and Determinants.
Washington, D.C.: International Monetary Fund (for 2010-2014 data)
10
The studies have different methodologies. In order to estimate the size of informal economy, Medina et al. (2017)
used the multiple indicator-multiple cause method whereas Elgin and Oztunali (2012) used a model relying on a two-
27Accounting for about 65 percent of its GDP, the size of informal economy in Nigeria is larger
than that of any other large middle-income country. For other largest middle-income
economies, the size of informal economy ranged from 11.5 percent of GDP in China, which was
lower than advanced economies’ average of 18 percent, to 40.3 percent in Russia, which was
slightly higher than low income economies’ average (Medina, Jonelis, & Cangul, 2017) & (Elgin
& Oztunali, 2012). The aforementioned high debt to revenue problem of Nigeria stems in part
from its large informal economy. Since the Nigerian government is unable to collect revenues
from informal businesses, its revenues fall short of middle income standards. Therefore, Nigeria
faces debt unsustainability problems not fully reflected in its debt to GDP ratio.
Education has a central role in development since it provides both private returns through
higher earnings and productivity increases for workers, and social returns, through reduced
crime, increased political awareness, and better health outcomes. Among the largest middle
income countries, Nigeria and South Africa are the worst performers in primary and tertiary
school gross enrollment rates. Nigeria also does the worst in secondary school gross enrollment
rate. South Africa, interestingly, is one of the best performers. Moreover, both countries’
primary and tertiary school gross enrollment rates are below the middle income average; more
strikingly, the primary gross enrollment ratios are below the average for low income countries.
Figure 25: The Largest Middle-Income Countries: School Gross Enrollment Rate (percent)
Source: Authors’ calculation based on data from the World Bank’s World Development Indicators.
Notes: The latest available data are shown in the chart. Countries other than Nigeria have either 2014 or
2015 data. Nigeria’s primary and secondary school gross enrollment rates are from 2013 data and its
tertiary school gross enrollment rate reflect the numbers in 2011.
sector dynamic general equilibrium model. In addition, data for other countries are left blank since Medina et al.
(2017) focuses on SSA in their paper.
28You can also read