Counting the Cost AUTHORS - Servaas van der Berg & Nic Spaull - Stellenbosch University
←
→
Page content transcription
If your browser does not render page correctly, please read the page content below
AUTHORS
Servaas van der Berg & Nic Spaull

                                     Counting the Cost
                               COVID-19 school closures in South
                                  Africa & its impact on children

                                                          15 June 2020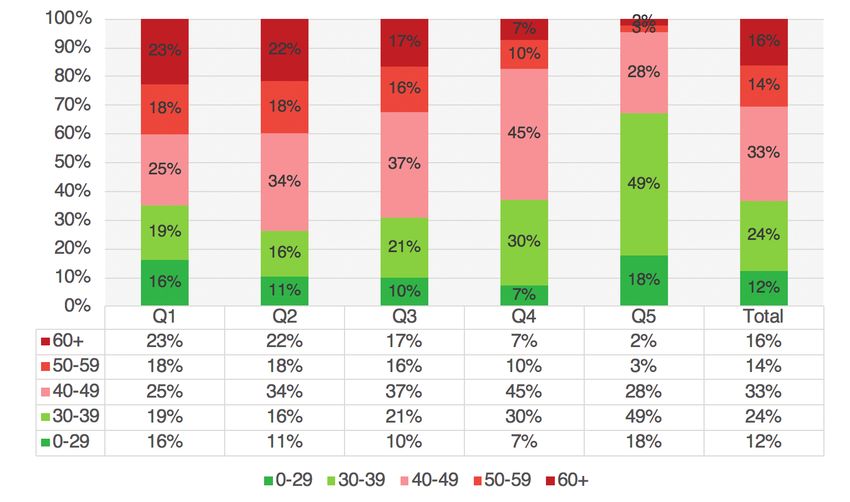
Stellenbosch University
Research on Socioeconomic Policy Group (RESEP)
Schumann Building Room 609
Stellenbosch, 7600

This research was funded by the Allan Gray Orbis Foundation Endowment, the FEM Education Foundation and
the Michael and Susan Dell Foundation (MSDF) as part of the Coronavirus Rapid Mobile Survey (CRAM) project.

Van der Berg, S & Spaull, N. (2020). Counting the Cost: COVID-19 school closures in South Africa & its impacts
on children. Research on Socioeconomic Policy (RESEP). Stellenbosch University. Stellenbosch.
Counting the Cost
COVID-19 school closures in South
Africa & its impact on children

Servaas van der Berg & Nic Spaull

                         “In all matters concerning the care, protection and well-being of a child the
                 standard that the child’s best interest is of paramount importance, must be applied.”
                                                                           (Children’s Act, 2005: p.34)

Executive Summary
The present paper sets out to offer evidence drawn from nationally representative household
surveys, school surveys and administrative datasets, as well as research reports. The paper
focuses on children, teachers and schooling with the following five focal areas: (1) school days
lost to COVID-19, (2) comparing regular mortality risk by age to COVID-19 mortality risk by
age, both for teachers and the public at large, (3) the feasibility of practicing social distancing
within classrooms, (4) the social, economic and health costs associated with lockdown and
school closures, (5) the challenges of re-opening the economy without re-opening schools, and
especially the prevalence of young children being “home alone” without any adult care givers.
We summarise the findings of each these areas below:

School days lost: Based on the government’s current plans, by the end of Term 2 (7th of August
2020) South African children will have lost between 25% and 57% of the ‘normal’ school days
scheduled up to that point as a result of COVID-19 school closures (depending on the grade
of the child). If schools do not close again later in the year then children will have lost between
14% and 33% of the regular academic year (Table 1).

Comparing COVID-19 mortality risk and regular mortality risk: Using StatsSA data on 2016
mid-year population estimates and 2016 mortality figures, we calculate the regular mortality
risk by age. This ranges from a 1-in-1000 chance (0.1%) of dying in the year for 0-19 year olds,
and a 1-in-7 chance (15.2%) of dying in the year for those 80 years and older (Table 3). This
is based on 2016 data and is not affected by COVID-19. We then look at the Department of
Health’s current projections for total annual deaths from COVID-19 in 2020, which range from
40 000 to 48 000 deaths (which are sourced from the Actuarial Society of South Africa (ASA)
modelling, the Deloitte modelling and the South African COVID-19 Modelling Consortium
(SACMC)). We use the Western Cape’s COVID-19 age fatality distribution and apportion
the higher number of deaths (49 000) across the population’s age distribution to give the
projected annual COVID-19 mortality by age. Given that these are now both annual figures
we can compare “regular” annual mortality with COVID-19 annual mortality in 2020. We
show that the risk of death from COVID-19 ranges from a 1-in-76 878 chance (0.001%) for

                                                                                                          1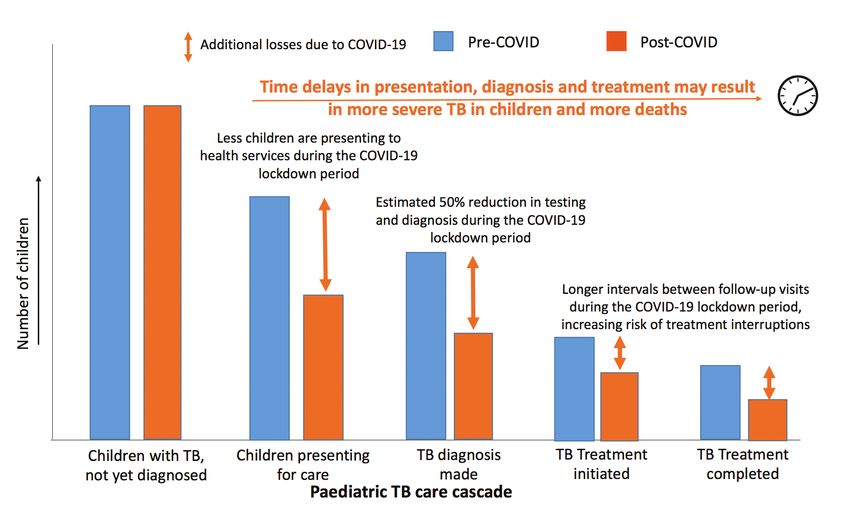
those aged 0-19 years, and a 1-in-94 chance for those aged 80 years and older. It is clear that
“regular” South African mortality risk in 2020 is far higher than COVID-19 mortality risk for
all age ranges. While age and comorbidities do increase mortality risk from COVID-19, the
total number of projected deaths from COVID-19 in South Africa (48 000) is considerably
smaller than the total number of annual deaths from “regular” causes (435 000). Although
initially there was considerable uncertainty about the number of deaths that COVID-19 would
cause in South Africa, and there is still some ongoing uncertainty, existing projections from
almost all analysts do not show more than 48 000 deaths from COVID-19 in South Africa.
We argue that the relatively low mortality risk from COVID-19 needs to be contrasted to
the significant additional mortality risk from acute malnutrition and associated mortality in
children (especially pneumonia, diarrhoea and HIV/AIDS) arising from the lockdown.

Social distancing: Reviewing the evidence on class size in South Africa, at least 50% of learners
are in classes that exceed 40 learners per class (and 10 - 20% exceed 60 learners per class).
South African classrooms are built to accommodate 40 learners with 1.2 to 1.5 square metres
per learner. As a result, widespread overcrowding makes practicing social distancing in most
classrooms in the country practically impossible. Given that COVID-19 mortality risk is very
low compared to regular mortality risk (Table 3), and virtually non-existent for children, we
believe the Department of Basic Education should acknowledge that it is not feasible for most
South African schools to practice social distancing within the classroom. Other preventative
measures like hand hygiene and mask-wearing for older children should be implemented but
social distancing within the classroom should not be enforced.

Social, economic and health costs of lockdown and school closure:
Malnutrition and stunting: Even before the lockdown began, General Household Survey data
showed that at least 2.5-million children experienced hunger and lived below the food poverty
line. Approximately 1-million children under the age of five are stunted. Hunger and acute
malnutrition are likely to have been severely aggravated by the lockdown and school closures
since hundreds of thousands of informal workers lost all income and children no longer
received free-school meals. Even though malnutrition is not often stated as the cause of death
in South Africa, it often remains an important contributor. Child mortality audits show that
almost a third of children who die are severely malnourished (Bamford, McKerrow, Barron, &
Aung, 2018). Emerging evidence from rapid surveys from both Statistics South Africa and the
HSRC have shown clear increases in rates of hunger among children and adults. Increases in
acute malnutrition significantly raise the risk of children dying from pneumonia, diarrhoea and
HIV/AIDS. These avoidable deaths need to be considered when deciding whether and how to
lockdown South Africa, and whether schools should be closed again in future.

Mental health: School closures, lockdowns and increased financial stress are likely to have
increased the risk of child abuse, mental health breakdowns and the emotional exhaustion of
caregivers together with rising rates of depression and anxiety. Recent surveys of children in
Nicaragua, Indonesia and a number of other countries have shown that children are at higher
risk of lasting psychological distress, including depression (Radesky, 2020). After one month
school closures in Hubei, nearly a quarter (23%) of children in Grades 2-6 reported symptoms of
depression (Xie et al., 2020). Recent reviews of lockdowns, school closures and natural disasters
show increases in rates of substance abuse, depression, fear, loneliness, domestic violence and
child abuse (Galea et al., 2020; Soland et al., 2020).

Health and education: Children’s routine immunisations, testing for HIV and TB, and health
seeking behaviour when children seem sick are all likely to have decreased as a result of the
lockdown and school closures. The NICD reports a 48% reduction in TB testing. Any delays in

                                                                                                    2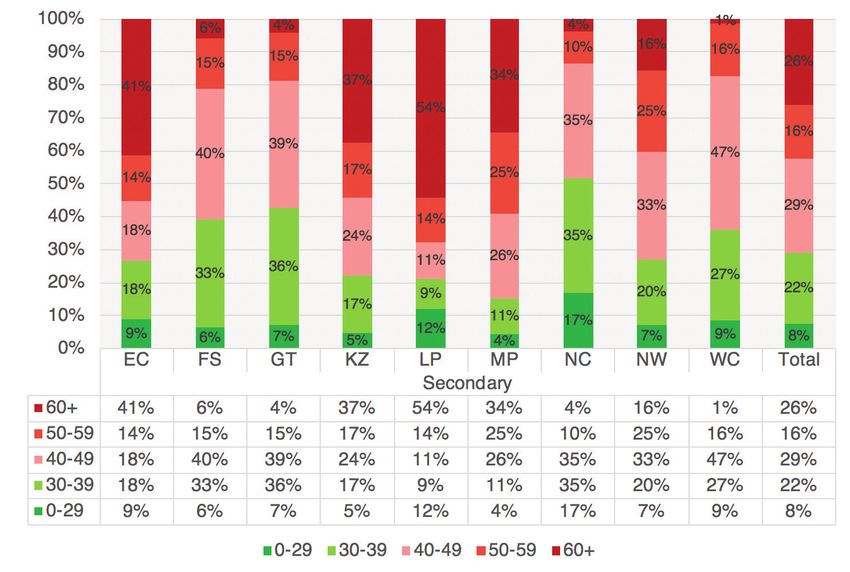
the diagnosis and treatment of HIV in either pregnant mothers or new-born children is likely to
have long term consequences. The education impacts of the lockdown and school closures are
likely to be large and sustained. By the 7th of August 2020 at least 4 million children will have
missed more than half (57%) of the number of school days that are normally scheduled up to
this point. Teachers will not be able to complete the entire remaining curriculum in the limited
time available. Inequality is likely to increase since poorer learners and schools are least able
to catch up. International research on the cumulative effects of learning losses and subsequent
income losses indicate that many of the losses in both learning and income are long term in
nature and can be measured five years after the event (Das et al., 2020). As these authors
conclude “the hidden paradox of disasters is that even if those who suffer today are the elderly,
those who will pay throughout their lives will be the youngest” (Das et al., 2020).
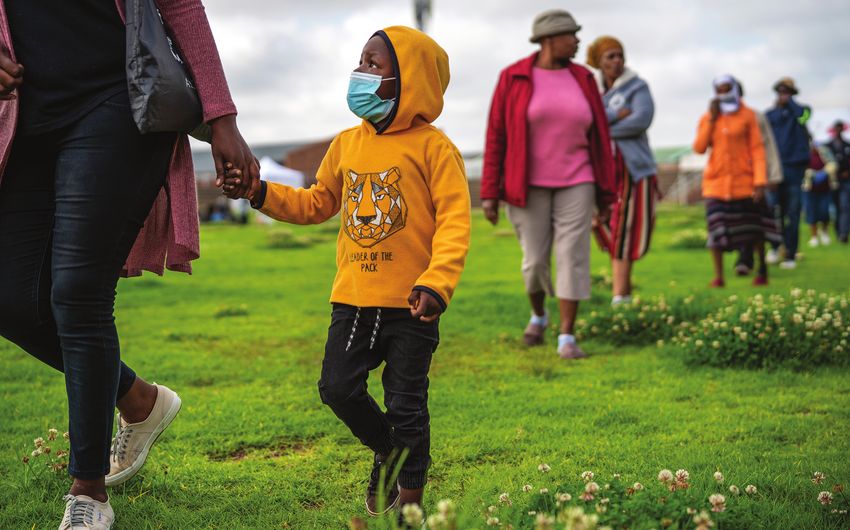
Young children left home alone: One of the least appreciated costs of re-opening the economy
while keeping schools closed for 90% of learners (as is currently the case in South Africa) is
that children are at higher risk of being left home alone. Our analysis of the Quarterly Labour
Force Survey (QLFS) data of 2019 shows that if all employed workers return to work, there
would be more than 2-million children aged 0-15 years without an older sibling (15 years+) or
an adult caregiver to look after them. Of highest concern are the almost one million children
(974 000) below the age of six who have no other adult caregiver in the household except a
working parent. It is highly plausible that hundreds of thousands of these children would be left
home alone in households without an adult caretaker if their employed caregiver was forced
to return to work to earn an income and sustain her family. Even though most sectors of the
economy have re-opened, ECD centres or crèches remain closed.
Conclusion and recommendations:
After reviewing the evidence presented in this paper, it is our view that keeping children out
of school is not in the best interests of the child. Consequently, all children should return to
schools, crèches and ECD centres without any further delay. The profound costs borne by small
children and families as a result of the ongoing nationwide lockdown and school closures will
be felt for at least the next 10 years.
When the new coronavirus rapidly spread across the globe, the impact of the virus on children
was still unclear, and closing schools from an abundance of caution seemed the responsible
thing to do. But much has been learnt since about both COVID-19 and about the effects
of lockdown and school closures, both in South Africa and internationally. Given the large
social and economic costs of hard lockdowns and wholesale school closures we would strongly
caution against future nation-wide lockdowns or school closures, even in the presence of a surge
in COVID-19 infections. Policy-makers and government leaders have an obligation to weigh up
the costs and collateral damage of their policies, particularly for those who are most vulnerable,
such as small children, the elderly and those in poverty.
Millions of South African children’s education and mental health have been compromised
in this initial period of uncertainty. Given what is now known about the mortality rates of
COVID-19, we believe that the ongoing disruptions to children’s care, education and health
are no longer justified.
3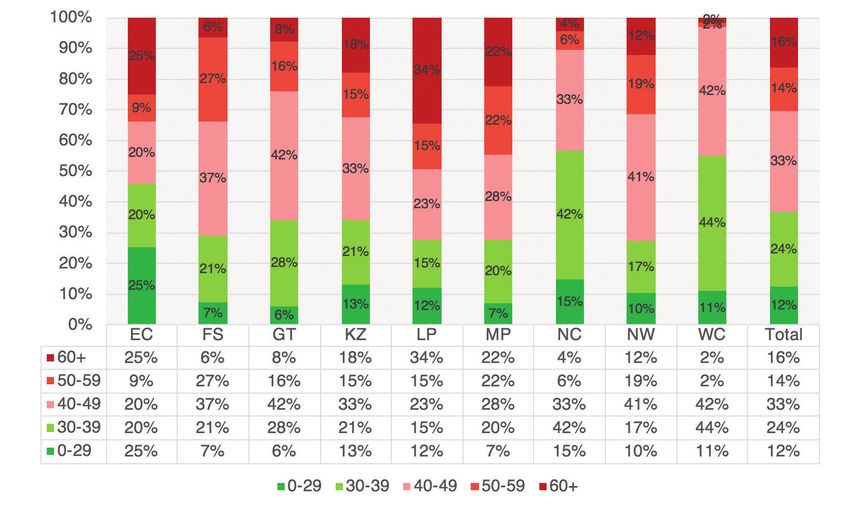
1. Introduction
Like most countries around the world, South Africa has experienced disruptions of
unprecedented proportions as a result of the novel coronavirus SARS-CoV-2 commonly
referred to as COVID-19. Following the World Health Organisation’s (WHO) declaration of
COVID-19 as a global pandemic, South Africa acted swiftly and severely to limit the spread of
this virus. On the 23th of March 2020 the President announced that South Africa would enter
a state of almost complete lockdown three days later on the 26th of March. At the time there
were 927 positive cases in the country and zero deaths.

What began as a three-week lockdown period morphed into an eight-week lockdown that
is now in its ninth week and still on-going, albeit with fewer restrictions. The eight- week
lockdown included bans of all public gatherings, closing all schools, and prohibiting all forms
of physical commercial activity, except for the sale of food and medicine. The sale of alcohol
and tobacco was banned. A national curfew was imposed prohibiting movement between 8pm
and 5am. For the first time since apartheid the army was deployed across the country with
the intention of maintaining law and order and supporting the police. This included 70 000
reserve soldiers who, at the time of writing, are still deployed across South Africa, largely in
informal settlements. Even parliament was temporarily closed. Only the courts remained open
out of fear that there would be no recourse to challenge government actions or to oppose the
constitutionality of the measures being implemented.

By and large these containment measures were initially welcomed, or at the very least accepted,
by the public, opposition parties and most scientific advisors. This is now to starting to change.
There are now numerous legal challenges (the Helen Suzman Foundation, Democratic Alliance)
and growing scientific opposition to the way the government is handling the crisis (Mendelsohn,
Madhi, Nel & Venter, 2020; Van Bruwaene, Mustafa, Cloete, Goga and Green, 2020).

It is within this context that crèches and schools were also closed, and at the time of writing
remain closed for 90% of children. For the ten weeks of lockdown up to the 8th of June,
children were not allowed to go to school or see their friends and family outside of their house.
During the first five weeks of ‘hard’ lockdown children were not allowed to leave their homes
for any reason except to seek medical attention. Based on the government’s current plans, by
the end of Term 2 (7th of August 2020), South African children will have lost between 25%
and 57% of the ‘normal’ school days scheduled up to that point (Table 1). The reason for the
range is that school reopenings are staggered such that Grade 7 and 12 children miss only 25%
of days up to 7 August, while their Grade 4, 5, 8 and 9 peers will miss 57% of scheduled school
days up to 7 August 2020.

Table 1 on the following page reports the old and new school calendar based on amendments
documented in Government Gazette No. 43381 (1 June 2020). Given that South Africa has
not yet reached its expected peak in terms of infections, and may well lockdown again when it
does reach the peak, it is unclear yet how long schools will remain open and whether they will
close again when the peak does arrive. If schools close again, these trends are likely to be true
for the entire academic year of 2020, and possibly the first half of 2021.

                                                                                                     4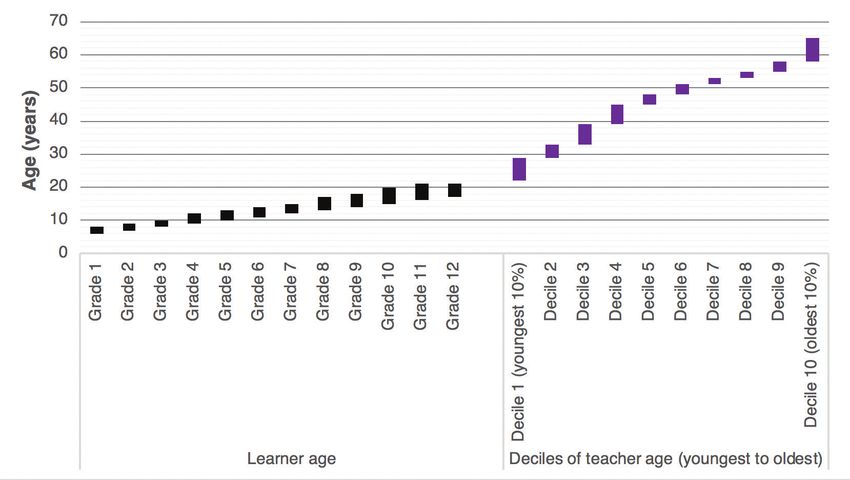
Table 1: School days lost due to school closures up to 7 August 2020 and in the 2020 calendar
year (assuming no further closures)

                                    School days lost up to 7 August 2020 by Grade

                   (New calendar)       (Old calendar)                                         School days lost as a
                   Current school   Pre-COVID scheduled                                       percentage of pre-COVID
                                                                 Days lost up to 7 Aug
                    days up to 7     school days up to 7                                     scheduled school days up
                        Aug                  Aug                                                   to 7 Aug 2020

   Grades 7 &12         92                   122                          30                           25%
  ECD + Grades
                        72                   122                          50                           41%
   1,2,3,6,10,11
    Gr 4,5,8,9          53                   122                          69                           57%
                          School days lost in 2020 by Grade (assuming no further closures)
                    (New calen-
                                                                                             School days lost in 2020
                    dar) Current        (Old calendar)         Days lost up tin 2020 (as-
                                                                                             compared to pre-COVID
                   school days in   Pre-COVID scheduled        suming no further school
                                                                                             scheduled school days
                   proposed 2020     school days in 2020              closures)
                                                                                                     in 2020
                      calendar
   Grades 7 &12         175                  204                          29                           14%
  ECD + Grades
                        155                  204                          49                           24%
   1,2,3,6,10,11
    Gr 4,5,8,9          136                  204                          68                           33%

The aim of this paper is to provide empirical evidence on how COVID-19, lockdown(s) and
school closure(s) affect children (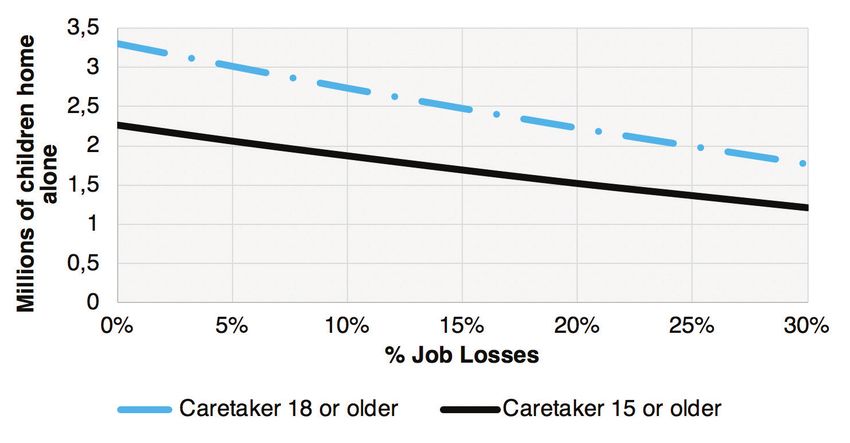
Figure 1: Distribution of COVID-19 deaths in South Africa by age category. Total deaths = 998
(Source: Department of Health, 9 June 2020)

Table 2 below reports the case fatality rate (CFR) by age in China (China CDC, 2020: p.115)
and compares this to the latest data available for the Western Cape (Western Cape Government,
2020). The CFR is the probability of dying if you are infected with COVID-19. The Western
Cape was selected as the best proxy for South African risk by age since it has the highest
number of infections (66% of the national total), the highest number of deaths (77% of the
national total), as well as the highest rate of testing per 100 000 persons – at least as at the time
of writing (NICD, 2020a: p.6). Apart from having the largest sample size on which to make
conjectures, the province is also reporting testing and deaths by age group, which is necessary
to calculate the CFR. If the age distribution of the 851 deaths in the Western Cape (as at 9
June 2020) is a reliable indicator of age and susceptibility to severe COVID-19 illness, it would
seem that COVID-19 mortality risk starts increasing from those aged 50 and older in South
Africa, rather than 60 and older as in China and most high-income countries. Note this is for
those who are infected.

Table 2: Comparing COVID-19 Case Fatality Rates in China and the Western Cape by age

                   COV-19 Case Fatality       COV-19 Case Fatality
Age category                                                                 WC Cases               WC deaths
                   Rate (CFR) in China         Rate (CFR) in WC

0-9yrs                      0.0%                       0.2%                     2 377                   5
10-19yrs                    0.2%
20-29yrs                    0.2%                       0.3%                     7 501                   19
30-39yrs                    0.2%                       0.6%                     9 345                   55
40-49yrs                    0.4%                       1.5%                     6 833                  105
50-59yrs                    1.3%                       4.9%                     4 488                  218
60-69yrs                    3.6%                      12.7%                     1 837                  233
70-79yrs                    8.0%                      17.6%                      780                   137
80+yrs                     14.8%                      13.9%                      569                    79
Total                       2.3%                       2.5%                    33 730                  851
                                              WC COVID-19 Dashboard
                    China CDC (2020: p.115)                               WC COVID-19 Dash-    WC COVID-19 Dashboard
Source                                         10 June 2020, based on
                     based on 1023 deaths                                 board 10 June 2020       10 June 2020
                                                     851 deaths

                    Of those infected what      Of those infected what
Note:               percentage die (Deaths    percentage die (WC deaths
                           = 1023)                   / WC Cases)

                                                                                                                       6
This data from the Chinese CDC show that the average Chinese 55 year old had a 1.3% chance
of dying of COVID-19 if they were infected, while the average South African 55 year old had
a 4.9% chance of dying of COVID-19 if they were infected. These differences are likely due to
contextual and demographic differences between South Africa and China. Due to higher rates
of malnutrition, wider prevalence of tuberculosis and HIV, and lower access to healthcare, it is
plausible that South Africa may have a higher CFR per age group, and indeed preliminary data
from the Western Cape supports that hypothesis.
It is worth contextualising COVID-19 mortality risk relative to ‘normal’ mortality risk. That is
to say that in a regular year people that are older also have a higher probability of dying from
non-COVID-19 causes. Comparing COVID-19 mortality risk to ‘normal’ mortality risk is also
helpful to put the relative risk of death in terms that are understandable. Table 3 below reports
Statistics South Africa’s mid-year population estimates for 2016 (StatsSA, 2016b: p.9) as well
as deaths for the same year (StatsSA, 2018c: p.8) by age category. They show that a typical
45 year old in South Africa had a 1 in 100 chance of dying in 2016 from ‘regular’ (i.e. non-
COVID-19) causes. It is clear that regular mortality risk is also strongly associated with age, as
one would expect.
Given that South Africa has not yet experienced peak infections or deaths from COVID-19,
in order to compare annual risk of death (from 2016) to COVID-19 risk of death in 2020,
one needs to make assumptions about the total number of deaths from COVID-19 in 2020 in
South Africa.
The Department of Health has consulted numerous modelling experts to predict the total
number of infections and deaths from COVID-19 since this is important information needed
for planning and preparation. Reviewing the projections put forward by the Actuarial Society
of South Africa (ASA, 2020: p.4), the South African COVID-19 Modelling Consortium
(SACMC) and Deloitte indicate that there may be as many as 40 000 deaths (optimistic) or
48 000 deaths (pessimistic) from COVID-19 by the end of 2020 (Davis, 2020; Child, 2020).
These are also the current projections cited by the Minister of Health. Taking a conservative
approach and using the higher projection of COVID-19 deaths in South Africa in 2020 (48
000), we use the distribution of deaths by age in the Western Cape (Column E) to apportion
the 48 000 total deaths across the different age categories. For example, if the 48 000 deaths
follow the Western Cape distribution of COVID-19 deaths then there will be 13 142 deaths
among the 60-69 year age group.
This table allows one to ask “What is the probability that someone in a particular age category
is going to die from COVID-19 in 2020 in South Africa?”. It shows that for those under 70 the
risk of death from COVID-19 is exceedingly small. For example the average 35 year old has a
1-in-2753 chance of dying of COVID-19 in 2020.
7Table 3: Comparing risk of death in a regular year and risk of death from COVID-19 infection by age
Column A B C D E F G H I
Projections:
WC distri-
Projected Projections: COVID-19 risk
bution of Projections: Prob-
Normal probabili- SA Cov-19 Probability categorization
Age cate- Population Deaths in % died in COVID-19 ability of dying of
ty of dying is 1 in deaths in of dying of relative to reg-
gory in 2016 2016 2016 deaths up COVID-19 in 2020
___ 2020 if fol- COVID-19 in ular mortality
to 10 June in SA
lowing WC 2020 in SA risk
2020
pattern
0-9yrs 11 624 007 9 974 0.1% 1 in 1 000 chance Practically
5 282 0.001% 1 in 76 878 chance
10-19yrs 10 057 108 9 904 0.1% 1 in 1 000 chance non-existent
20-29yrs 10 822 615 35 917 0.3% 1 in 333 chance 19 1 072 0.010% 1 in 10 099 chance
30-39yrs 8 540 322 56 763 0.7% 1 in 143 chance 55 3 102 0.036% 1 in 2 753 chance
Very Low
40-49yrs 6 085 366 57 925 1.0% 1 in 100 chance 105 5 922 0.097% 1 in 1 028 chance
50-59yrs 4 302 071 65 535 1.5% 1 in 67 chance 218 12 296 0.286% 1 in 350 chance
60-69yrs 2 739 297 72 056 2.6% 1 in 39 chance 233 13 142 0.480% 1 in 208 chance Low
70-79yrs 1 320 831 63 628 4.8% 1 in 21 chance 137 7 727 0.585% 1 in 171 chance Moderate
80+yrs 417 248 63 549 15.2% 1 in 7 chance 79 4 456 1.068% 1 in 94 chance High
Total 55 908 865 435 251 0.8% 1 in 129 chance 851 48 000 0.086% 1 in 1 165 chance Low
(StatsSA, 2018c:
Apportioning
p.8). Infant deaths
ASA, SAMRC
(age 0 years; 20
& Deloitte 2020
649) are excluded WC COVID-19
(StatsSA, 2016: Calculated total projected Calculated as Column G reported as Comparing column
Source so as to make Calculated as 100/C Dashboard 10
p.9) as B/A deaths conser- F/A chance (1/G) H and column D
these figures June 2020
vative estimate
comparable to the
(48 000) across
Population esti-
age distribution
mates in Column A
8While it is true that these projections depend on the assumption of 48 000 COVID-19 deaths
in South Africa in 2020, there are very few specialists who believe that the figure will be higher
than this. Furthermore, even if COVID-19 deaths were twice as large as predicted here (96
000) (which would halve the chance numbers in Column H), the risk of death from regular
causes for all age groups would still drastically outweigh the risk of death from COVID-19
multiple times over. It is for this reason that the risk categorization in Column I, which reports
the relative risk of COVID-19 mortality and regular mortality, indicates that for the population
at large under 70 years of age, the risk of death from COVID-19 is low or very low when
compared to regular mortality risk. Put differently, people should be far more worried about
dying of regular causes than from COVID-19. This does not, however, indicate that sensible
precautions such as social distancing or wearing a mask should be ignored.
The above discussion has important implications for school closures, since these measures are
justified partly on the basis that they will prevent the healthcare system becoming overwhelmed,
but also because of the excess mortality risk to teachers. For example, schools were scheduled
to be opened for some grades on the 1st of June 2020, but this was delayed based on teacher
union opposition that schools were not adequately prepared to protect learners and teachers.
Yet if the assumptions underlying the above data are correct, the additional mortality risk to
teachers and caregivers up to age 70 is low relative to the normal mortality risk that they face.
For children the risk is exceedingly small. Following analysis of COVID-19 mortality data in
the United Kingdom by Professor David Spiegelhalter at Cambridge University, he concluded
that “In school kids aged five to 15 it’s not only a tiny risk, it’s a tiny proportion of the normal
risk.” He went on to say that the risk was so low that children were more likely to get struck
by lightning (a chance of one in 1.7-million) than die of COVID-19 (one in 3.5-million)
(Spiegelhalter, 2020).
The evidence emerging from South Africa on children’s COVID-19 risk of severe illness is
completely congruent with international research showing that children do not get severely
ill from COVID-19. There are so few recorded deaths of children from COVID-19 that it
is difficult to draw any conclusions (see Spaull, 2020 for an overview of the epidemiological
research on this). The South African Paediatric Association (SAPA) in their statement on
COVID-19 (SAPA, 2020) explain that “Children biologically contain SARS-CoV-2 better
than adults, are less likely to get sick if infected, have milder disease, are unlikely to die from
COVID-19, and are probably less infectious than adults.”
b. The age distribution of learners and teachers in South Africa
Although it is clear that the additional mortality risk posed by COVID-19 is small relative to
regular mortality risk, it is nevertheless true that this additional risk is related to age. Therefore
we report the age distributions of both learners and teachers in South Africa with the aim of
identifying the number and percentage of teachers in higher risk age categories. To do so we use
data from the Education Management Information System for learner age (EMIS, 2013) and
government payroll data for teacher age (PERSAL, own 2020 projections based on 2017 data).
For learners we report the age range of the 10th to the 90th percentile per grade, while for
teachers we order the distribution by age from youngest to oldest and create ten equal deciles
of age (Figure 2 and Table 4). For example, in Grade 12 there are 10% of learners who are
younger than 17 (10th percentile) and 90% of learners who are under the age of 21 (90th
percentile). Given that those under the age of 60 are at low risk of severe illness and death from
COVID-19, of most interest for the present purposes is the finding that 10% of teachers are
aged 58 to 65 years old (10th decile). There are approximately 380 000 teachers in the system,
so approximately 38 000 are aged 58-65 years (see also Figure 3 on the next page).
9Figure 2: The distribution of learner age range (10th-90th percentile) by grade (EMIS), and
teacher age by decile (PERSAL) in South Africa
Table 4: The distribution of learner age range (10th-90th percentile) by grade, and teacher age
by decile in South Africa
Distribution of learner age in years (EMIS) Distribution of teacher age in years (PERSAL)
10 90th
Youngest Oldest
percentile percentile
Grade 1 6 8 Decile 1 (youngest 10%) 22 29
Grade 2 7 9 Decile 2 29 33
Grade 3 8 10 Decile 3 33 39
Grade 4 9 12 Decile 4 39 45
Grade 5 10 13 Decile 5 45 48
Deciles of
Learner Grade 6 11 14 Decile 6 48 51
teacher age
age by
Grade 7 12 15 (youngest to Decile 7 51 53
grade
oldest)
Grade 8 13 17 Decile 8 53 55
Grade 9 14 18 Decile 9 55 58
Grade 10 15 20 Decile 10 (oldest 10%) 58 65
Grade 11 16 21
Grade 12 17 21
10Figure 3: Projected teacher age in South Africa, 2020 (PERSAL)
c. What percentage of teachers have co-morbidities?
In addition to age, international research has shown that individuals with certain co-morbidities
are at higher risk of COVID-19 mortality. The World Health Organisation (WHO) reports
that “evidence to date suggests that two groups of people are at a higher risk of getting severe
COVID-19 disease. These are older people (that is people over 60 years old); and those with
underlying medical conditions (such as cardiovascular disease, diabetes, chronic respiratory
disease, and cancer)” (WHO, 2020: p.2).
There is currently no nationally-representative data on the comorbidities of teachers specifically.
However, nationally 4 581 200 South Africans aged 20-79 are estimated to have diabetes,
according to the International Diabetes Federation (2019). Applying the ratio of teachers to
the national population in this age group, there could be perhaps around 47 500 teachers
who have diabetes, or one in every eight teachers. Cardiovascular disease is a major source
of mortality in South Africa, often associated with hypertension. These diseases increase an
individual’s COVID-19 mortality risk. However, it should be noted that the mortality total
provided in Table 3 is a national figure and already includes deaths associated with these and
other comorbidities.
3. School infrastructure, class sizes and social distancing in
South Africa
While there are numerous ways to limit the spread of COVID-19, the two preventative measures
that receive the most attention are (1) washing hands with soap and water or alcohol-based
sanitizer, and (2) practicing social distancing. At the most elementary level the former requires
soap and water and the latter requires space. To what extent are these available in South African
schools? In the section below we look at data from the School Monitoring Survey (SMS) of
2017 to report what percentage of primary schools and high schools in South Africa have access
to running water, and what is the distribution of class sizes in the country.
a. Access to running water
The SMS data show that nationally 74% of primary schools and 80% of secondary schools report
11access to running water in 2017 (DBE, 2018: p.80). However, there is considerable provincial
variation in access to this most basic resource. Lack of access to running water is especially acute
in KwaZulu-Natal, where only 53% of primary schools and 59% of secondary schools report
access. In contrast, approximately 95% of primary schools and high schools in Gauteng and the
Western Cape have running water (DBE, 2018: p.81). Without access to running water, how are
children and teachers expected to wash their hands? Thus special measures had to be instituted.
COVID-19 is an opportunity for South Africans to reflect and acknowledge that in 25 years of
democracy we have not managed to provide all schools with basic infrastructure like running
water, electricity, and safe toilet facilities 1. The fact that a quarter of primary schools do not
have access to running water in a middle-income country like South Africa is an indictment
and an ongoing source of shame. While this is clearly a pre-requisite for basic hygiene during a
pandemic, it is also a pre-requisite for basic dignity in everyday life.
Due to teacher union opposition about returning to schools where there is no running water
and therefore limited ability to practice personal hygiene, the Department of Basic Education
went into overdrive to provide schools with water tanks so that teachers would return. On the
7th of June the Minister announced that 95% of schools now had running water (Motshekga,
2020). This was accomplished through a contract with Rand Water to provide water tanks to
3500 schools:
“The support provided by the Department of Water and Sanitation, Rand Water, the
Department of Health, National Treasury; and the recent involvement of the South African
National Defence, the Development Bank of Southern Africa (DBSA), the Department of
Transport, and Mvula Trust is second to none. Their involvement has accelerated our
interventions in the provinces, especially the reach to the most rural and remote
schools” (Motshekga, 2020).
This is a commendable achievement, and may yet be one of the few positive outcomes of
the pandemic. It is truly remarkable that in the space of six weeks the Department of Basic
Education has managed to do what it was unable to do in the last 20 years.
b. Class sizes and the feasibility of social distancing
In addition to information on school infrastructure, the School Monitoring Survey also asked
teachers about the class size of the largest class 2 that they taught. This was asked of teachers
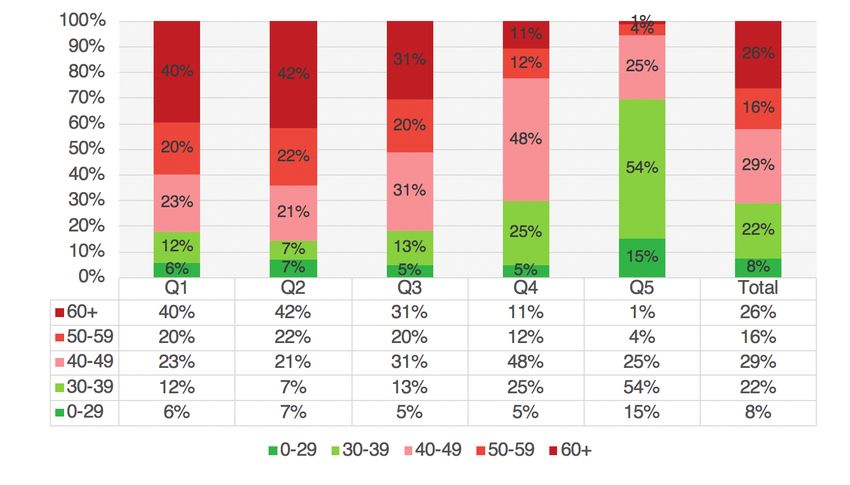
in Grades 3, 6, 9 and 12. The two graphs below report the distribution of class sizes in South
African primary schools (Figure 4) and high schools (Figure 5) split by quintiles of school
wealth (Q1 is poorest, Q5 is richest). They show that nationally 63% of primary school children
are in classes of 40 or more learners per class, with 16% in classes of 60 or more per class. In
secondary schools 70% of learners are in classes of 40 or more learners per class and 26% are
in classes of 60 or more learners per class. Appendix A reports the same figures separated by
province. Appendix B provides corroborating evidence on class sizes from TIMSS, PIRLS and
SACMEQ.
1
The SMS data show that nationally 12% of primary schools and 6% of high schools do not have electricity, while 21% of primary schools and 16% of high schools do
not have adequate toilets (DBE, 2020: p.80). Provinces with the greatest needs are Limpopo, KwaZulu-Natal, the Eastern Cape and the Free State. Note that the SMS
sample is nationally representative and includes 1000 primary schools and 1000 secondary schools (DBE, 2018: p.11).
2
It is only in Grade 3 that we also have the observed class sizes in SMS (not Grades 6, 9 and 12), in addition to the question on largest class taught. However, it is
reassuring to note that the observed and self-reported class sizes are not very dissimilar. Thanks to Tim Kohler for help with this.
12Figure 4: Distribution of largest class taught by Grade 3 and 6 teachers in South African primary
schools by school wealth quintile (School Monitoring Survey 2017, own calculations)
Figure 5: Distribution of largest class taught by Grade 6 and 9 teachers in South African
secondary schools by school wealth quintile (School Monitoring Survey 2017, own calculations)
13The Department of Basic Education’s draft “National Minimum Norms and Standards for
School Infrastructure” document reports architectural norms that must be followed when
building classrooms. Page 91 of those norms state that the maximum class size that should be
considered is 40 learners per class (SA Government, 2008: p.91). As a result virtually all South
African classrooms are built to accommodate 40 learners. The norms further specify sitting
spaces of 1.2 to 1.5 square metres for each child (p.91). If a class had 40 learners in it, then
social distancing within the classroom in accordance with the WHO guidelines (WHO, 2020)
would be possible.
Reviewing the data on class sizes in South Africa (Figures 4 and 5) in conjunction with
government regulations and the spatial realities of South African classrooms, it is clear that
at least half of South African learners will not be able to practice social distancing within
a classroom. Furthermore, teaching outdoors is problematic, since South Africa is now in
the winter season. This is apart from the fact that teaching 50+ learners in an open space is
practically very difficult even without weather considerations.
Given that COVID-19 mortality risk is very low compared to regular mortality risk (Table 3),
and virtually non-existent for children, we believe the Department of Basic Education should
acknowledge that it is not feasible for most South African schools to practice social distancing
within the classroom. While it should require mask-wearing for older children and social
distancing on the playground, social distancing within the classroom is simply not realistic.
Attempts to do so are futile in our context and are likely to further disrupt teaching and
learning, to the detriment of children.
4. Household living situations
Thanks to Statistics South Africa and other surveys and an active research community, we
know a lot about the often dismal social and economic conditions that many children still find
themselves in today. We know that poverty has declined since the political transition, and so has
one of its worst manifestations, child hunger – but they have not been eliminated. According to
the Community Survey of 2016, exactly one-third of children were still in households that had
an income below the food poverty line, where not even minimum food needs can be met, and
just over two-thirds (67%) were below the higher, but still frugal, upper-based poverty line, the
level of income required to meet most basic needs (Statistics South Africa, 2016). Thanks to
the expansion of the Child Support Grant, these child poverty rates have been declining over
a large part of the post-transition period, but even in 2018, parents indicated that 2½ million
children (13% of children) sometimes go hungry. As Table 5 shows, this ratio was as high as 21%
in the North West province, before the economic effects of COVID-19 and the lockdown were
felt. Anthropometric indicators of nutritional status in the Demographic and Health Survey
(DHS) indicate that stunting (low height for age, an indicator of long term nutrition and health
status), was still prevalent in 27% of children under 5 in 2016. Wasting (low weight for height),
a measure of shorter term nutritional adequacy, was less common at less than 3% (National
Department of Health et al, 2019). In the context of COVID-19 it is especially concerning
that school closures and the lockdown are likely to have significantly exacerbated child hunger.
Both because of job and income losses, but also because children are not receiving free school
meals. In 2018, 77% of children in public schools, approximately 9-million children, received
a school meal every school day (Statistics South Africa, 2019a). This is an important source of
food that would have fallen away during the lockdown and continues for those who are not yet
allowed to go back to school. Even though malnutrition is not often stated as the cause of death
in South Africa, it often remains an important contributor. Child mortality audits show that
almost a third of children who die are severely malnourished. (Bamford, McKerrow, Barron, &
Aung, 2018)
14Table 5: Children who live in households with no employed adults, who experience hunger, or
who live in areas where crime prevents them from using parks, 2018
Children Children Areas where
living in Children Children in public fear of crime
Child
house-holds experiencing experiencing schools prevent
population
with-out an hunger hunger (%) who benefit children
2018 (‘000)
employed (‘000) from school from going
adult feeding (%) to parks
Western Cape 1 971 8% 288 15% 54% 47%
Eastern Cape 2 514 46% 212 9% 90% 38%
Northern Cape 436 29% 73 17% 83% 57%
Free State 1 021 35% 131 13% 80% 35%
Kwazulu-Natal 4 184 36% 826 20% 84% 28%
Northwest 1 382 35% 284 21% 80% 21%
Gauteng 4 186 15% 345 8% 55% 46%
Mpumalanga 1 673 29% 222 13% 88% 39%
Limpopo 2 374 41% 118 5% 91% 15%
Total 19 741 30% 2 500 13% 77% 35%
Sources: Statistics South Africa, 2019a; Statistics South Africa, 2018a; Hall, 2019; Statistics Sount Africa, 2019c
Households: It is perhaps helpful to provide some context as to the types of households that
children find themselves in. Altogether 62% of South African children, and three-quarters of
those in rural areas, live in extended families. Less than one-third of children live in households
where both parents are present, and almost 42% live in households where the mother is the
only parent present (Statistics South Africa, 2019). Only 13% of children are in households
with medical aid, 32% live in households without potable water, and almost 20% in homes
without sanitation (Statistics South Africa, 2018a).
Stimulation: Although almost half (49%) of children aged 0 to 4 stay at home with parents
or guardians, research shows a worrying lack of stimulation for many children. Only 53% of
parents or guardians report reading books with children, 57% report colouring or drawing with
them, and 65% report telling stories (Statistics South Africa, 2019a). For those without these
forms of stimulation at home, the lockdown experience is likely to be dire. In addition there
have been further limitations placed on these children, given that they could not play outside
or see their same-age peers.
Child abuse: In 2016, the extensive Optimus study was undertaken on child abuse in South
Africa. The researchers found that “one in every three young people had experienced some form
of sexual abuse at some point in their lives” (Artz, et al., 2016: p.11). Other forms of child abuse
were also investigated; among children aged 15-17, they found that 42% had experienced some
form of maltreatment (sexual, physical, emotional or neglect), and 82% reported that they had
experienced criminal victimisation or exposure to family or community violence (Artz, et al.,
2016). The authors recognize that many parents and caregivers lack the financial and emotional
support needed to nurture children, and that caregivers struggling with poverty and adversity
were more likely to be perpetrators of violence. Pelton (2015) also identifies poverty as one of
the risk factors for child maltreatment, together with sleeping density – the number of people
a child shares a room with at night (Richter, Dawes & Higson-Smith, 2004).
155. Impacts of the lockdown(s) and school closure(s)
on children
a. Learning loss
Existing research in South Africa shows that children in weaker schools fall increasingly below
a threshold of required achievement (Van der Berg, 2015; Spaull & Kotze, 2015). The learning
deficits resulting from COVID-19 are likely to further exacerbate this problem and widen
overall inequality in South Africa. Furthermore, with an ever-dwindling number of school days
left in the year, teachers will be increasingly under pressure to cover an already “full” curriculum
in a fraction of the time. An emerging body of research shows the detrimental effects of a
disconnect between curricular expectations and the level of the child (Pritchett & Beatty, 2013:
Banerjee & Duflo, 2011). In the South African context, how much can teachers adjust the level
at which they teach to the new reality of children who have missed 29-68 out of 204 days
of the school year? How much of the curriculum can be excluded in any one grade without
affecting children’s readiness for the subsequent grades and the expectations of further study?
Using assessment data from 5 million American students in Grades 3 to 8 and extrapolating
from that based on learning losses during school holidays or absenteeism from school, Soland,
et al. (2020) estimate that COVID-19 may result in around 30% of a year’s learning in reading
and more than 50% in mathematics in the U.S. Younger children may lose almost a full year
of mathematics learning. Moreover, a long lockdown will increase heterogeneity in classes
when schools reopen, which would raise the challenges for teachers, especially in mathematics.
(Soland, et al., 2020). All of these estimates are likely to be drastic underestimates when applied
to South Africa, due to the low levels of educational materials at home, the lack of educational
technology like computers and the internet and the inability of most South African teachers to
continue teaching while children are not at school. Realistically, for the poorest 80% of learners
in South Africa, virtually no curricular learning is taking place during lockdown.
Apart from the fact that parents and caregivers are not trained or equipped to teach their own
children, the existing lockdown ‘plans’ for learning have not significantly mitigated the losses
in learning for children that do not have proper technology-enabled learning at home. At most,
5-10% of learners can continue learning at home given their access to computers and the
internet. Data from the Trends in International Mathematics and Science Study (TIMSS 2015,
Grade 9) shows that for no-fee schools (the poorest 75%), less than half of children in a given
class have a computer with internet access. Only in the wealthiest 5% of schools do at least 90%
of learners have access to a computer and the internet at home (Gustafsson 2020).
The DBE’s partnership with the South African Broadcasting Corporation (SABC) to provide
“COVID-19 Learner Support” via television and radio (DBE, 2020b), while admirable, is not
a replacement for school. It targets only “Grade 10-12 and ECD” and is only available for 1.5
hours per day across three television channels. Given that these programs would need to be
subject- and grade-specific for students to continue with curricular work, this still amounts
to less than 5% of the ‘instruction’ time learners would be receiving if they were in school,
assuming they watch all the programs dedicated to their grade. It is also not clear what children
in Grades R-9 are meant to do.
Access to computers and the internet in South African homes is very low. The General Household
Survey of 2018 shows that only 22% of households have a computer in them (StatsSA 2019a,
p. 63) and only 10% of respondents have an internet connection in their home (p.57). While
it is true that 90%+ of South African households report access to a mobile phone (p.56), only
1660% report access to the internet via their mobile phone. It should further be emphasised that
these rates are for adults in the household. One cannot assume that during lockdown, children
in a household would have exclusive or unlimited access to the cell phone to access educational
content. There is also the issue of multiple children in the same household needing to share a
mobile phone, and the high cost of data, although there are now some free educational sites
(Duncan-Williams 2020).
b. Economic effects, nutrition and immunisations
The lockdown and school closures have had severe economic effects for many households,
especially households where the informal sector contributes a large part of household income,
or where people have lost jobs or income because of the lockdown. Government social relief
for the unemployed has not been very effective, due to the difficulties of setting up new
payment systems and procedures, and problems in dealing with the application process and
documentation. Social relief through increased social grants was much more successful, despite
some hurdles in implementation (for example in the Western Cape, where social pensioners
received pensions twice in one month). Thus children in the 20% of households whose main
income source is social grants may have been better off since the lockdown began, but it is not
so clear that this would also be true for the other 24% of households where social grants are
only one of the main income sources (Statistics South Africa 2019a).
It will take some time before we will know how the gains from social relief match up against
the effect of job and income losses in these households. The South African Reserve Bank and
the International Monetary Fund (IMF) estimate that the South African economy will contract
by 6% in 2020 (National Treasury, 2020a: p.5), while a social accounting model by Arndt et al.
(2020) point to a much bigger economic decline, perhaps as much as 16% without consideration
of government social relief efforts. It is worth noting that labour market income makes up more
than 70% of total household income and that grant income has never been more than 7% of
total household income in South Africa (StatsSA, 2019b: p.41). Given the relative proportions
of government grants to total market income, the additional relief in government grants can
unfortunately never outweigh the loss in income from job losses and income shocks. To place
the R500-billion government relief package in further context, the ‘pre-COVID-19’ 2020
budget had allocated approximately R276-billion to government grants and social security
(UIF) (National Treasury, 2020b). Therefore, the total amount of government social assistance
is likely to be three times higher in 2020 than it would normally be.
Since the widespread lockdowns in response to COVID-19, there has been increasing evidence
of disruptions to routine childhood immunisation services globally, with more than 68 countries
reporting moderate to severe or even total suspension of such services. This may affect provision
of vaccines against measles, polio and cholera to around 80 million children under one year
globally. Delays in vaccine deliveries, fears of visiting health facilities and pressure on health
workers all contribute (WHO, 2020). This is in line with a systematic review of articles on the
indirect health effects of the Ebola virus outbreak in West Africa that showed substantial short
and long term effects on health services, including declines in caesarean sections and facility-
based deliveries and in utilisation of antenatal, postnatal, family planning and children’s health
services (Brolin Ribacke, Saulnier, Eriksson, & Von Schreeb, 2016).
In South Africa, too, some members of the medical community have tried to highlight the
effect of the focus on COVID-19 on other health services. The public’s fear of contracting
the coronavirus may have led to children not being immunised, pregnant mothers avoiding
antenatal care appointments and many patients with chronic comorbidities not presenting for
treatment or not collecting needed medications (‘Greater crisis’ looms: 38 doctors plea for non-
17COVID health care resources, 2020). Among children under five years of age, three conditions
make up 50-60% of non-neonatal deaths: pneumonia, diarrhoea and HIV/AIDS (Nannan et
al., 2019: p. 482). All three of these require prompt medical services to avoid severe illness and
deaths. Given the very low mortality of COVID-19 among children, it is extremely probable
that excess and avoidable deaths from these three illnesses will outweigh COVID-19 deaths
among children.
Of particular concern in South Africa is the high prevalence of HIV and Tuberculosis. Any decline
in the rates of testing and treatment of these pernicious diseases is likely to have significant
long-term consequences. Already the National Institute of Communicable Diseases (NICD)
has reported that “The COVID-19 level 5 restrictions have resulted in an approximately 48%
average weekly decrease in TB Xpert testing volumes” (NICD, 2020b: p.6).
Statement from the Desmond Tutu TB Centre
At the Desmond Tutu TB Centre, as advocates for children affected by TB and by HIV, we
urge that the limited risk that COVID-19 infection poses on children be balanced against the
substantial risks posed by other leading causes of childhood morbidity and mortality in South
Africa, including TB and HIV.
Tuberculosis (TB) and HIV and South African children
TB is one of the top 10 causes of deaths in children globally with most children developing
pulmonary TB (TB of the lungs). Each year in South African approximately 17 500 children
under the age of 15 are treated for TB. However, this is likely only two thirds of the actual TB
burden in children due to missed diagnosis and underreporting of cases. There are also about
300 000 children under the age of 15 who are living with HIV in South Africa. Diagnosing
and treating TB and HIV in children relies on a functional and accessible health system, and
if TB in children is diagnosed early and appropriate treatment is started, treatment outcomes
are excellent with close to 95% treatment success for most forms of disease. If the diagnosis of
TB in a child is delayed by several weeks, the child may die or develop more severe TB disease
(such as TB meningitis), and subsequently suffer long-term morbidity. Interruptions to TB
treatment, where less than 80% of doses are taken, are associated with worse TB treatment
outcomes and also risk of development of drug-resistant TB, which is more difficult to treat and
requires longer treatment. If a child has been exposed to TB, preventive therapy dramatically
reduces their risk of developing TB disease.
Lockdown can impact on TB and HIV services for children at multiple levels
Delays to a TB diagnosis in adults may lead to more household transmission of Mycobacterium
tuberculosis, the organisms causing TB, and possibly more children infected with TB. During
lockdown in South Africa, overall TB testing has declined by 50% at a national level, which
will result in fewer children being diagnosed and started on TB treatment. Fewer children with
TB disease are being brought for evaluation and diagnosis to health services which means that
the diagnosis of TB or other diseases is not being made and that children are not started on
treatment. Children brought to health services are less likely to be correctly diagnosed with
TB due to COVID focussed care, e.g. fewer children are getting chest x-rays or are having
sputum taken.
18Children with HIV are also less likely to be diagnosed with TB in the current context, and if
on antiretroviral therapy, are less likely to be supported in taking their treatment by healthcare
services. If antiretroviral therapy requires modification for TB treatment, this may be harder to
do and could lead to antiretroviral resistance. Children with TB are less likely to be supported
by healthcare in completing their TB treatment, for all forms of TB. There is currently limited
TB contact tracing of at-risk close TB contacts like children and HIV-positive people, leading to
a decrease in starting much-needed TB preventative treatment for children.
Figure 6 below shows the TB care cascade for children with TB, entering care, being tested
and diagnosed and started on TB treatment to treatment completion. Before the COVID-19
pandemic there were already substantial losses in every step of this care cascade in South Africa
(e.g. children not presenting to care, not being diagnosed or no treatment being initiated and
children not being reported). During the COVID-19 pandemic, substantial additional losses are
expected due to direct and indirect effects of COVID-19 on children’s access to health services
in the public sector.
Figure 6: The TB care cascade for children with TB, entering care, being tested and diagnosed
and started on TB treatment to treatment completion.
c. Mental health
Large-scale disasters, such as terrorist attacks, mass shootings or natural disasters “…are almost
always accompanied by increases in depression, posttraumatic stress disorder (PTSD), substance
use disorder, a broad range of other mental and behavioural disorders, domestic violence, and
child abuse” (Galea, Merchant, & Lurie, 2020). This was also the case with the SARS epidemic
in the countries that it affected. It is therefore quite likely that following the pandemic there
will be increases in anxiety and depression, substance abuse, loneliness, domestic violence and
child abuse (Soland, et al., 2020).
19A recent study of 1784 children in Grades 2 to 6 in Huebei Provine in China when schools had
been closed as a result of the pandemic for over a month found that 23% reported depression
symptoms and 19% had anxiety symptoms (Xie et al., 2020). Depression was more common
amongst children who were worried about being affected by the virus.
Recent surveys by Save the Children in the United States, Spain, UK, Finland, Germany,
Nicaragua and Indonesia led them to conclude that almost one-quarter of children affected
by lockdowns and school closures have feelings of anxiety, and that many are at risk of lasting
psychological distress, including depression (Radesky, 2020). Similarly, Lee (2020) argues that
“School routines are important coping mechanisms for young people with mental health issues.
When schools are closed, they lose an anchor in life and their symptoms could relapse.”
Drawing from other situations, such as the effect of Hurricane Katrina, Soland, et al. (2020) note
that children may face greater food insecurity, loss of family income, loss of family members
to the virus, and fear of being infected themselves. The return to school may therefore not be
easy for all children. Some would have trouble concentrating and would manifest symptoms
of depression and acute anxiety. It is essential to try to understand these impacts and support
children’s social and emotional needs after the disruption of the pandemic and the lockdown.
An especially pertinent recent systematic review on the psychological impact of quarantine-
type situations has found that it led to high levels of post-traumatic stress (29% to 34%) and fear
(20%), while also increasing depression, low mood, irritability, insomnia, anger and emotional
exhaustion (Fegert, Vitiello, Plener, & Clemens, 2020).
Increased financial stress during economic recessions is also associated with increases in domestic
violence. The added complications of the lockdown and permanent presence of children in the
home increases the likelihood of children falling victim to such behaviour. As Fegert, Vitiello,
Plener, & Clemens (2020) state,
“… [the lockdown phases] of the current COVID-19 pandemic represent a dangerous
accumulation of risk factors for mental health problems in children and adolescents of enormous
proportions: re-organization of family life, massive stress, fear of death of relatives, especially
with relation to grandparents and great-grandparents, economic crisis with simultaneous loss
of almost all support systems and opportunities for evasion in everyday life, limited access to
health services as well as a lack of social stabilization and control from peer groups, teachers
at school, and sport activities.”
The Human Sciences Research Council (HSRC) and a University of Johannesburg team
analysed the mental health consequences of the lockdown for adults in South Africa, based on
an online survey. They derived two latent variables from the responses they obtained about the
emotions people felt. The one they termed psychological distress (including stress, being scared,
irritability, feeling depressed, sadness, anger) and the other isolation (boredom and loneliness).
Further investigation found that the components of psychological distress are higher among
individuals that reported feeling hunger. The strong presence of this emotion in the contexts of
hunger, and its association with psychological distress, is something that children are also likely
to experience (Orkin et al., 2020).
20You can also read