Understanding the Socioeconomic Conditions of the Stateless Shona Community in Kenya - Results from the 2019 Socioeconomic Survey - UNHCR
←
→
Page content transcription
If your browser does not render page correctly, please read the page content below
Understanding the
                         Socioeconomic
                         Conditions of the
                         Stateless Shona
                         Community in Kenya
                         Results from the
                         2019 Socioeconomic Survey

                                                     2020

10183_Shona_CVR.indd 3                                12/14/20 11:20 AM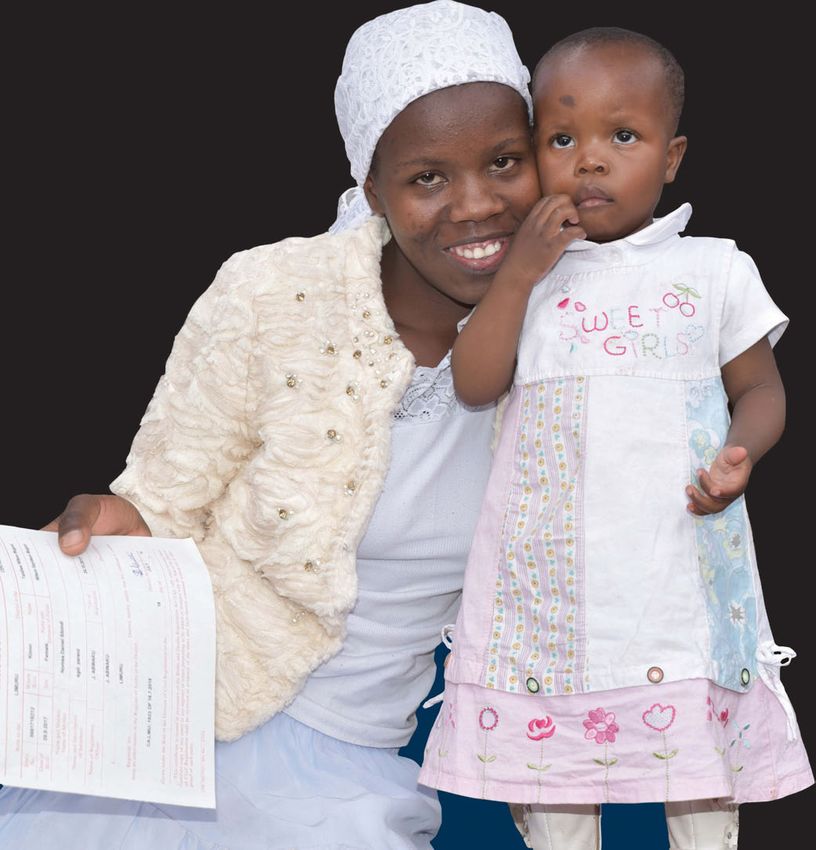
Understanding the Socioeconomic
              Conditions of the Stateless Shona
              Community in Kenya
              Results from the 2019 Socioeconomic Survey

10183_Shona Report.indd 1                                  12/14/20 2:56 PM
Cover photo: © Rose Ogola, UNHCR. 10183_Shona Report.indd 2 12/14/20 2:56 PM
Table of Contents
ACKNOWLEDGMENTS . . . . . . . . . . . . . . . . . . . . . . . . . . . . . . . . . . . . . . . . . . . . . . . . . . . . . . . . . . . . . . . vi
LIST OF ABBREVIATIONS . . . . . . . . . . . . . . . . . . . . . . . . . . . . . . . . . . . . . . . . . . . . . . . . . . . . . . . . . . . . vii
FOREWORDS . . . . . . . . . . . . . . . . . . . . . . . . . . . . . . . . . . . . . . . . . . . . . . . . . . . . . . . . . . . . . . . . . . . . . . . viii
EXECUTIVE SUMMARY . . . . . . . . . . . . . . . . . . . . . . . . . . . . . . . . . . . . . . . . . . . . . . . . . . . . . . . . . . . . . . . x
BACKGROUND AND OBJECTIVES . . . . . . . . . . . . . . . . . . . . . . . . . . . . . . . . . . . . . . . . . . . . . . . . . . . . . 1
I. Statelessness in Kenya . . . . . . . . . . . . . . . . . . . . . . . . . . . . . . . . . . . . . . . . . . . . . . . . . . . . . . . . . . . . . . . 2
FINDINGS . . . . . . . . . . . . . . . . . . . . . . . . . . . . . . . . . . . . . . . . . . . . . . . . . . . . . . . . . . . . . . . . . . . . . . . . . . 7
I. Consumption and Poverty . . . . . . . . . . . . . . . . . . . . . . . . . . . . . . . . . . . . . . . . . . . . . . . . . . . . . . . . . . . 7
II. Demographic Profile . . . . . . . . . . . . . . . . . . . . . . . . . . . . . . . . . . . . . . . . . . . . . . . . . . . . . . . . . . . . . . . . . 8
III. Access to Basic Services . . . . . . . . . . . . . . . . . . . . . . . . . . . . . . . . . . . . . . . . . . . . . . . . . . . . . . . . . . . . . 11
i. Housing . . . . . . . . . . . . . . . . . . . . . . . . . . . . . . . . . . . . . . . . . . . . . . . . . . . . . . . . . . . . . . . . . . . . . . . . . 11
ii. Water and sanitation . . . . . . . . . . . . . . . . . . . . . . . . . . . . . . . . . . . . . . . . . . . . . . . . . . . . . . . . . . . . . 15
iii. Energy . . . . . . . . . . . . . . . . . . . . . . . . . . . . . . . . . . . . . . . . . . . . . . . . . . . . . . . . . . . . . . . . . . . . . . . . . . 16
iv. Education . . . . . . . . . . . . . . . . . . . . . . . . . . . . . . . . . . . . . . . . . . . . . . . . . . . . . . . . . . . . . . . . . . . . . . . 18
IV. Employment and Livelihoods . . . . . . . . . . . . . . . . . . . . . . . . . . . . . . . . . . . . . . . . . . . . . . . . . . . . . . . . . 24
V. County Trends . . . . . . . . . . . . . . . . . . . . . . . . . . . . . . . . . . . . . . . . . . . . . . . . . . . . . . . . . . . . . . . . . . . . . . 28
CONCLUSIONS AND RECOMMENDATIONS . . . . . . . . . . . . . . . . . . . . . . . . . . . . . . . . . . . . . . . . . . . . . 30
BIBLIOGRAPHY . . . . . . . . . . . . . . . . . . . . . . . . . . . . . . . . . . . . . . . . . . . . . . . . . . . . . . . . . . . . . . . . . . . . 32
APPENDIXES . . . . . . . . . . . . . . . . . . . . . . . . . . . . . . . . . . . . . . . . . . . . . . . . . . . . . . . . . . . . . . . . . . . . . . . 34
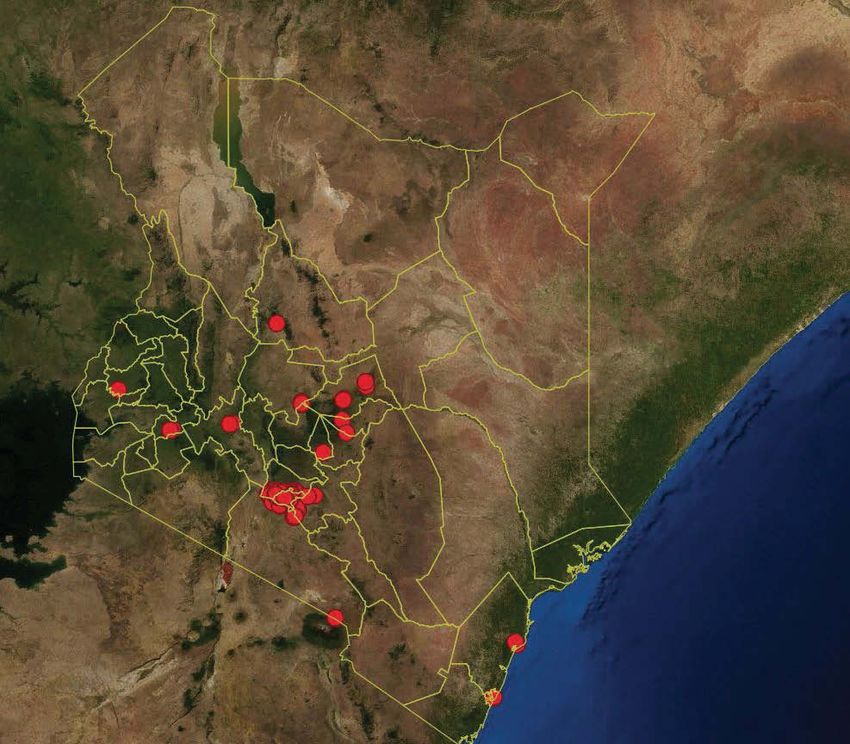
Appendix A. Locations of Interviewed Shona Households in Kenya . . . . . . . . . . . . . . . . . . . . . . . . . . . . 34
Appendix B. Methodology . . . . . . . . . . . . . . . . . . . . . . . . . . . . . . . . . . . . . . . . . . . . . . . . . . . . . . . . . . . . . . . . . 35
iii
10183_Shona Report.indd 3 12/14/20 2:56 PMLIST OF TABLES
Table B.1: Households that completed the various sections of the SES questionnaire . . . . . . . . . . . . . 36
Table B.2: Sample allocation for KIHBS 2015/16 . . . . . . . . . . . . . . . . . . . . . . . . . . . . . . . . . . . . . . . . . . . . . . 36
Table B.3: Shona questionnaires for registration and SES . . . . . . . . . . . . . . . . . . . . . . . . . . . . . . . . . . . . . 36
LIST OF FIGURES
Figure 1: Poverty headcount (national poverty line) . . . . . . . . . . . . . . . . . . . . . . . . . . . . . . . . . . . . . . . . . . 8
Figure 2: Poverty gap and severity (national poverty line) . . . . . . . . . . . . . . . . . . . . . . . . . . . . . . . . . . . . 8
Figure 3: Gender distribution for the Shona community and Kenyans, by county . . . . . . . . . . . . . . . . 9
Figure 4: Demographic profile of the Shona community and Kenyans . . . . . . . . . . . . . . . . . . . . . . . . . . 9
Figure 5: Household size for the Shona community and Kenyans . . . . . . . . . . . . . . . . . . . . . . . . . . . . . . 10
Figure 6: Dependency ratio for the Shona community and Kenyans . . . . . . . . . . . . . . . . . . . . . . . . . . . . 10
Figure 7: Distribution of men-headed households for the Shona community and Kenyans . . . . . . . . 11
Figure 8: Proportion of improved housing for the Shona community and Kenyans . . . . . . . . . . . . . . . 11
Figure 9: Type of roofing materials for the Shona community and Kenyans . . . . . . . . . . . . . . . . . . . . . 12
Figure 10: Type of floor material for the Shona community and Kenyans . . . . . . . . . . . . . . . . . . . . . . . 13
Figure 11: Type of wall material for the Shona community and Kenyans . . . . . . . . . . . . . . . . . . . . . . . . . 13
Figure 12: Number of habitable rooms for the Shona community and Kenyans . . . . . . . . . . . . . . . . . . 14
Figure 13: Proportion of households living in overcrowded conditions . . . . . . . . . . . . . . . . . . . . . . . . . 14
Figure 14: Access to drinking water for the Shona community and Kenyans . . . . . . . . . . . . . . . . . . . . . 15
Figure 15: Access to improved sanitation for the Shona community and Kenyans . . . . . . . . . . . . . . . . 16
Figure 16: Sharing of toilet facilities for the Shona community and Kenyans . . . . . . . . . . . . . . . . . . . . . 16
Figure 17: Source of lighting for the Shona community and Kenyans . . . . . . . . . . . . . . . . . . . . . . . . . . . 17
Figure 18: Lower access to health facilities than before March 2020 . . . . . . . . . . . . . . . . . . . . . . . . . . . . 17
Figure 19: Reasons for lower access to health facilities . . . . . . . . . . . . . . . . . . . . . . . . . . . . . . . . . . . . . . . . 17
Figure 20: Distribution of population attended school, ages 15 and above . . . . . . . . . . . . . . . . . . . . . . 18
Figure 21: Primary attendance rates for the Shona community and nationals by county . . . . . . . . . . 19
Figure 22: Primary attendance rates, by county and gender . . . . . . . . . . . . . . . . . . . . . . . . . . . . . . . . . . . 19
Figure 23: Secondary attendance rates by county . . . . . . . . . . . . . . . . . . . . . . . . . . . . . . . . . . . . . . . . . . . 20
Figure 24: Secondary school attendance rates, by county and gender . . . . . . . . . . . . . . . . . . . . . . . . . 20
Figure 25: Educational achievement by county (15 years+, not currently attending) . . . . . . . . . . . . . 21
Figure 26: Educational achievement by county and gender (15 years+, not currently attending) . . 21
Figure 27: Population distribution, by ability to read and write in any language . . . . . . . . . . . . . . . . . 22
Figure 28: Population distribution among the Shona community, by literacy in official languages . 22
Figure 29: Engagement in learning activities in the last seven days . . . . . . . . . . . . . . . . . . . . . . . . . . . . 23
Figure 30: Main learning-related activities . . . . . . . . . . . . . . . . . . . . . . . . . . . . . . . . . . . . . . . . . . . . . . . . . . . 24
Figure 31: Labor force participation for the Shona community and Kenyans . . . . . . . . . . . . . . . . . . . . . 24
Figure 32: Type of work activity in the last seven days, for Shona and nationals . . . . . . . . . . . . . . . . . 26
Figure 33: Type of work activity in the last seven days by gender, for Shona and nationals . . . . . . . 26
Figure 34: Main reason for not working or looking for a job in last four weeks . . . . . . . . . . . . . . . . . . . 27
iv Understanding the Socioeconomic Conditions of the Stateless Shona Community in Kenya
10183_Shona Report.indd 4 12/14/20 2:56 PMFigure 35: Employed in the last seven days . . . . . . . . . . . . . . . . . . . . . . . . . . . . . . . . . . . . . . . . . . . . . . . . . 27
Figure 36: Changes in revenue among the self-employed . . . . . . . . . . . . . . . . . . . . . . . . . . . . . . . . . . . . . 28
Figure 37: Changes in earnings among paid employees . . . . . . . . . . . . . . . . . . . . . . . . . . . . . . . . . . . . . . . 28
Figure A.1: Map of location of interviewed Shona households in Kenya . . . . . . . . . . . . . . . . . . . . . . . . . 34
Figure B.1: Poverty headcount for the Shona community and Kenyans (international poverty line) 38
LIST OF BOXES
Box 1: Methodological summary . . . . . . . . . . . . . . . . . . . . . . . . . . . . . . . . . . . . . . . . . . . . . . . . . . . . . . . . . . . . 5
Box 2: Kenya COVID-19 rapid response phone surveys . . . . . . . . . . . . . . . . . . . . . . . . . . . . . . . . . . . . . . . 6
Box 3: Poverty calculation . . . . . . . . . . . . . . . . . . . . . . . . . . . . . . . . . . . . . . . . . . . . . . . . . . . . . . . . . . . . . . . . . 7
Box 4: Kenya RRPS insights on access to health facilities . . . . . . . . . . . . . . . . . . . . . . . . . . . . . . . . . . . . . 17
Box 5: Kenya RRPS insights on education . . . . . . . . . . . . . . . . . . . . . . . . . . . . . . . . . . . . . . . . . . . . . . . . . . . 23
Box 6: Labor force participation . . . . . . . . . . . . . . . . . . . . . . . . . . . . . . . . . . . . . . . . . . . . . . . . . . . . . . . . . . . 25
Box 7: Kenya RRPS insights on employment . . . . . . . . . . . . . . . . . . . . . . . . . . . . . . . . . . . . . . . . . . . . . . . . . 27
Table of Contents v
10183_Shona Report.indd 5 12/14/20 2:56 PMAcknowledgments
This report was led by Florence Nimoh (UNHCR), together with the team consisting of Theresa Bel-
tramo (UNHCR), Jedediah Fix (UNHCR), Felix Appler (World Bank), Utz Pape (World Bank) and Laura
Abril Ríos Rivera (World Bank). This report benefitted from comments by Felix Schmieding (UNHCR,
JDC) and Craig Loschmann (UNHCR). The data collection took place as part of a joint preregistration
activity between the Government of Kenya, including the National Bureau of Statistics, and UNHCR.
UNHCR Assistant Protection Officer Wanja Munaita provided leadership and coordination, under the
supervision of UNHCR Deputy Representative Protection, Walpurga Englbrecht, with support from
UNHCR Assistant Representative Programme, Ivana Unluova, and technical assistance from Helge
Brunborg (Statistics Norway), Sebastian Steinmuller (UNHCR), and Sadiq Kwesi Boateng (UNHCR).
The team is grateful to the Shona people without whose participation, insights, and contributions this
work would not be possible.
The team would like to thank the peer reviewers Arthur Alik Lagrange (World Bank) and Dhiraj Sharma
(World Bank).
Finally, the team would like to express its gratitude to the Government of Kenya for their collaboration
and to recognize UNHCR Kenya Representative, Fathiaa Abdalla; UNHCR (then) Director of Division of
Resilience and Solutions, Ewen Macleod; UNHCR Division of Resilience and Solutions Chief of Section
for Partnerships Analytics Research and Knowledge, Betsy Lippman; and UNHCR Division of Inter-
national Protection Chief of Section for Statelessness, Melanie Khanna, who provided the vision and
support for this project.
This report is part of the program “Building the Evidence on Protracted Forced Displacement: A
Multi-Stakeholder Partnership.” The program is funded by UK aid from the United Kingdom’s Depart-
ment for International Development (DFID). It is managed by the World Bank Group (WBG) and was
established in partnership with the United Nations High Commissioner for Refugees (UNHCR). The
scope of the program is to expand the global knowledge on forced displacement by funding quality
research and disseminating results for the use of practitioners and policy makers. This work does not
necessarily reflect the views of DFID, the WBG, or UNHCR.
This work is also part of the Prospects partnership program funded through the Multi Donor Trust
Fund for Forced Displacement (FDTF) administered by the World Bank.
vi
10183_Shona Report.indd 6 12/14/20 2:56 PMList of Abbreviations
DIS Department of Immigration Services
ECOWAS Economic Community of West African States
EHAGL East and Horn of Africa, and the Great Lakes
GoK Government of Kenya
KCHS Kenya Continuous Household Survey
KCIA Kenya Citizenship and Immigration Act
KIHBS Kenya Integrated Household Budget Survey
KNBS Kenya National Bureau of Statistics
NGO Non-Governmental Organization
RRPS Rapid Response Phone Survey
SES Socioeconomic Survey
UNHCR United Nations High Commissioner for Refugees
UNICEF United Nations Children’s Fund
WASH Water, Sanitation and Hygiene
vii
10183_Shona Report.indd 7 12/14/20 2:56 PMForewords
Around the world, millions of people are stateless, as they do not hold the nationality of any country.
Their precise number is not known due to lack of official data, but UNHCR estimates that there are
4.2 million or more globally. In Kenya, there are about 18,500 stateless people.
While the likely negative impact of statelessness on the socioeconomic status of affected populations
can be intuitively understood, there is an urgent need to address the existing data gap in order to
measure the disparities between those with and those without a nationality. High-quality disaggre-
gated socioeconomic data will inform government policy making and monitoring in this area. Devel-
opment actors also need better information about the impact of statelessness in order to prioritize it
appropriately.
This new study on the stateless Shona population, an ethnic group with origins in present-day Zim-
babwe and Zambia that has been present in Kenya for multiple generations, is a groundbreaking first
step in this regard. The study was conducted by UNHCR and the World Bank, in collaboration with
the Kenya National Bureau of Statistics, and is aligned with the broader efforts of the World Bank-
UNHCR Joint Data Center on Forced Displacement to expand the collection of socioeconomic data on
affected populations and host communities. It reveals disparities in terms of the Shona community’s
household characteristics, housing conditions, education, employment, and consumption and expen-
diture, in comparison with Kenyan nationals living in the same areas. Some of the disparities include:
• The poverty rate among the Shona is 24 percent higher than in the urban Kenyan population.
• Access to education is lower for the Shona than for Kenyan nationals, a situation that threatens
human capital development and economic growth.
• The lack of citizenship and identity documents hinders the Shona from securing formal jobs and
leaves them with no option other than to engage in informal employment to survive.
Kenya has taken important steps toward resolving the issue of statelessness in the country. In 2019, at
a high-level event on statelessness co-organized by the Government of Kenya, the Executive Secretar-
iat of the International Conference of the Great Lakes Region, and UNHCR, the government pledged to
recognize the Shona as Kenyan citizens. The data in this study, prior to citizenship, are thus timely, as
development gains due to acquisition of nationality may be observed in the near future.
Sustainable development can only be achieved if all people have a chance to fulfil their potential with-
out any barriers. It is therefore crucial that the international community steps up collective efforts to
promote inclusive economic growth, in line with the Sustainable Development Goals (SDG), that meets
the needs of both stateless people and nationals and ensures that no one will be left behind.
Fathiaa Abdalla
Representative, UNHCR Kenya
viii
10183_Shona Report.indd 8 12/14/20 2:56 PMThe right to a nationality is a fundamental human right that has been denied to millions of people in the
world. Stateless persons are not considered nationals of any state, and thus are officially ‘inexistent’.
Stateless people are not only deprived from their right to a nationality but are subject to several other
human rights violations and restrictions to access health, education, and livelihood opportunities. As
people with no nationality are administratively ‘invisible’, it is extremely difficult to estimate the exact
number of stateless people. The living conditions, aspirations, and challenges they face are equally
unknown, which severely hinders efforts to develop policy and programmatic responses to effectively
address their needs.
In Kenya, at least 18,500 people live in statelessness. The Shona community comprises more than
3,500 of them, whose families arrived in Kenya from modern-day Zimbabwe and Zambia. As in other
regions in the world, data on stateless persons in Kenya are scarce. To help design e
vidence-based
policy interventions for the Shona population, the UNHCR and the World Bank, in collaboration with
the Kenya National Bureau of Statistics, carried out the present socioeconomic survey (SES). In addi-
tion to creating evidence for policy decisions, the undertaking provides lessons learned to collect
socioeconomic data of stateless persons in similar settings.
The Shona SES provides an overall picture of the socioeconomic conditions of Kenya’s stateless Shona
communities compared to nationals in the neighboring counties of Nairobi and Kiambu. While offering
a comparative outline of stateless people and nationals, the SES acknowledges both communities’
needs and offers evidence-based recommendations: first, collecting socioeconomic data of stateless
people that are comparable to that of nationals can help design effective development policy to help
lift their living standards. Second, building and maintaining human capital among the Shona commu-
nity, especially among girls and women, needs to be prioritized. Third, understanding barriers to for-
mal employment and increasing work opportunities for the Shona community can help improve their
livelihoods. Fourth, ensuring that the right to a nationality is fulfilled can not only improve the living
standards of stateless people but also of nationals.
Acknowledging stateless communities by understanding their socioeconomic conditions can contrib-
ute to designing effective policy interventions to end statelessness and give voice to the ‘invisible’.
Xavier Devictor
Manager
Fragility, Conflict, and Violence
World Bank
Forewords ix
10183_Shona Report.indd 9 12/14/20 2:56 PMExecutive Summary
Statelessness is a global challenge affecting millions of people who face multiple legal and socio-
economic deprivations that can last for generations. At least 4.2 million people live in statelessness
(UNHCR 2020).1 “The very nature of statelessness means it is difficult to determine exactly how many
people are affected, or at risk,” and therefore, the true number could be three times higher (United
Nations 2018). Without a nationality or citizenship, individuals are often denied access to basic human
rights, such as education, health, documentation, employment, marriage, and freedom of movement.
As one-third of the known stateless population are children and young adults, without remedying their
statelessness, this population is sentenced to a lifetime of social and economic deprivations.
Pursuant to its mandate to identify, prevent, and reduce statelessness, UNHCR and the Government
of Kenya have initiated steps to resolve statelessness in the c
ountry—however, socioeconomic data
gaps hinder efforts to design targeted policy interventions. UNHCR has set out the Global Action
Plan to End Statelessness: 2014–2024, and launched the #IBelong Campaign,2 resulting in the acquisi-
tion or confirmation of the nationality of more than 166,000 stateless persons. As part of these efforts,
UNHCR and the Government of Kenya (GoK) initiated a series of steps to address statelessness in
the country. Such efforts have resulted in a pledge to ensure the protection of stateless persons, the
naturalization of the Makonde community, and an agreement to naturalize qualifying members of the
Shona community. However, scarce socioeconomic information of stateless populations that is com-
parable to nationals prevents a deeper understanding of their living conditions, hence hindering efforts
to design targeted policy aimed at solving statelessness.
The Shona SES provides comparable socioeconomic profiles for the Shona community and nation-
als, while contributing toward informing a targeted response to address the socioeconomic impacts
of the COVID-19 pandemic. Together with the Department of Immigration Services (DIS) and the
Kenya National Bureau of Statistics (KNBS) of the GoK, UNHCR Kenya, with technical support from the
World Bank, conducted a preregistration exercise and socioeconomic survey for the Shona commu-
nity. The Shona SES marks one of the first quantitative studies of a stateless population that is based
on a national socioeconomic assessment tool. The SES compares the living conditions of the Shona
community residing in Nairobi and urban Kiambu counties to the conditions of Kenyan nationals in
such counties, as well as to the national urban average.3 This approach does not attempt to establish
a causal connection between their legal status and living conditions. It does, however, provide evi-
dence that shows strong correlations between statelessness, access to rights, and key indicators of
well-being. In addition, the SES links its findings to the results of the first wave of the Kenya COVID-19
Rapid Response Phone Surveys (RRPS) designed to assess the socioeconomic impacts of the COVID-
19 pandemic on nationals, refugees, and stateless persons.
1Based on the information available from 76 countries.
2 https://www.unhcr.org/protection/statelessness/54621bf49/global-action-plan-end-statelessness-2014-2024.html
3 Results from the Shona survey are compared to those from the Kenya National Bureau of Statistics and its Kenya Integrated
Household Budget Survey 2015/16.
x
10183_Shona Report.indd 10 12/14/20 2:56 PMCompared to Kenyan nationals, the Shona community is poorer; has larger household sizes and lives
in crowded conditions; has lower access to secondary education; is more likely to be self-employed;
and has been heavily affected by the COVID-19 pandemic.
The Shona community has a 24 percent higher chance of being poor than the urban Kenyan popula-
tion. Over half of the Shona community (53 percent) live below the national urban poverty line, com-
pared to 29 percent of the broader urban population and 36 percent of all Kenyans (urban and rural).
Similar trends are observed at the county levels. In Kiambu County, 56 percent of the Shona commu-
nity live below the national poverty line, compared to 25 percent of urban nationals. In Nairobi County,
49 percent of the Shona community live below the poverty line compared with 17 percent of Kenyans.
These discrepancies lead to a higher incidence and severity of poverty among the Shona community
than nationals as measured by the poverty gap (17 percent vs. 10 percent) and poverty severity (7 per-
cent vs. 5 percent). The poverty gap is crucial for estimating the minimum amount needed to eliminate
poverty. For the 1,616 Shona community individuals covered in this report, it would cost an estimated
US$122 per person per year to raise incomes to meet the national urban poverty line. These poverty
rates are likely to increase as a result of the socioeconomic impacts of the COVID-19 pandemic.
The Shona community households tend to be larger in size and contain a greater share of depen-
dents than urban Kenyan households, whose households are mostly headed by men. Compared to
Kenyans living in urban areas, the Shona community has the same proportion of elders in their house-
holds, but a higher share of children than urban nationals (49 percent vs. 41 percent). While every
Shona of working age is responsible for one dependent, two working-age Kenyans are responsible for
one dependent (0.6 vs. 0.9, plighting powered by the electricity grid in Nairobi County, both the Shona and Kenyans report almost
the same level of access (90 percent vs. 91 percent).
While a nominal difference in primary education is observed for the Shona community compared to
nationals, the difference is more pronounced at the secondary level. Primary school attendance is
slightly lower for Shona children ages 6–13 years compared to urban Kenyan children (81 percent vs.
86 percent). At the secondary level, urban nationals are almost twice as likely to be attending school
than their Shona peers (50 percent vs. 28 percent). Among the Shona, there is a significant gender
gap in secondary educational attainment, with 20 percent of men having some secondary or higher
education compared to 11 percent of women. For urban Kenyans, the gender gap is smaller, although
men are likely to be more highly educated than women. The lower transition to secondary school for
the Shona may partly be explained by the fact that a birth certificate is required to register for primary
8 (the last grade in primary) in order to continue to the secondary level. Moreover, as the employment
rate for Shona youth is higher than that of nationals, low secondary school attendance can also be
explained by the high opportunity cost of going to school, suggesting that Shona youth may drop out
of school to enter the labor market. The COVID-19 pandemic has translated into zero attendance for
the Shona, thus posing additional challenges to building human capital.
Literacy rates for the Shona community are high, but slightly lower than the national urban aver-
age and vary significantly by gender. While 89 percent of the Shona population report being able to
read and write in at least one language, 93 percent of urban nationals can do so. Male Shonas report
a slightly higher literacy rate at 93 percent, compared to 85 percent of women. In contrast, urban
national rates are 95 percent and 91 percent for men and women, respectively. Considering the two
official languages in Kenya, English and Swahili, more than 75 percent of the Shona community popu-
lation can read and write in at least one of them: English (74 percent) and Swahili (87 percent).
The employment rate of the Shona community is higher than for urban nationals, although this does
not translate into lower poverty rates; most of the employed Shona are self-employed. Most of the
working-age Shona population is employed, which is slightly higher than the urban Kenyan average
(73 percent vs. 69 percent). However, the Shona poverty rate remains higher than for nationals. More-
over, nearly 8 in 10 Shona employed are self-employed compared to only 3 in 10 among nationals.
Such a differing trend may be explained by the lack of identity documents needed to access the formal
employment market, which may force most of the Shona community to engage in self-employment to
earn a living. Only 2 percent of the Shona report being unemployed, which is in line with the 4 percent
of urban Kenyans, whereas 24 percent are outside the labor force (OLF) compared to the national
urban average of 27 percent.
The findings from the Shona SES also reflect differences in intra-household bargaining power among
men and women. Overall, Shona community women are less likely to be involved in decision making,
be less educated, and have lower labor force participation. Women and girls in the Shona community
have lower overall educational attainment, attendance, and literacy rates than Shona men and boys.
In addition, when the two official languages in Kenya are considered, fewer women can speak Swahili
and English than men. While higher literacy is associated with higher levels of education and socioeco-
nomic standing, proficiency in an official language of Kenya may help facilitate integration into the local
community and employment opportunities. This implies that the lower literacy rate among women can
xii Understanding the Socioeconomic Conditions of the Stateless Shona Community in Kenya
10183_Shona Report.indd 12 12/14/20 2:56 PMhinder their access to better economic opportunities, including barriers to accessing local employment
opportunities and education. Indeed, women in the Shona community report having lower labor force
participation rates than men, and are more likely to be outside the labor force, often citing their role as
homemakers.
The outbreak of the COVID-19 pandemic worsened the livelihoods and access to services of the
Shona. Results from the Kenya RRPS show that employment rates, earnings, and business revenues
have dropped sharply since the pandemic outbreak in March 2020. While 73 percent of the Shona
were employed before the COVID-19 pandemic, only 22 percent were employed as of July 2020.
The decrease in hours worked by the few that were formerly employed before the outbreak and the
temporary closure of businesses have tremendously affected wages and revenues. In addition, even
though the majority of Shona children (66 percent) are engaged in some form of learning activities at
home due to school closures, the means of learning raises questions of efficacy. Access to e-learning
platforms as recommended by the GoK is low, and learning activities are mainly done through the
reading of school textbooks. Furthermore, access to health facilities compared to before the pandemic
outbreak has also decreased, due mainly to fear of contracting the virus.
The SES provide the following policy recommendations while offering options to help mitigate the
socioeconomic impacts of the COVID-19 pandemic on stateless communities:
1. Strengthening job-related skills, increasing work opportunities, and understanding barriers to for-
mal employment can help improve living standards among the Shona community. Strengthening
job-related skills through programs linked to work opportunities can be instrumental in increasing
employment rates and addressing market needs. Evidently, facilitating issuance of identity docu-
ments and work permits can also enhance access to formal employment. Furthermore, a deeper
understanding of barriers to formal employment can help inform targeted policies to improve live-
lihoods. A gender-responsive approach must be integrated to ensure women’s participation in the
paid labor market.
2. Building and maintaining human capital among the Shona community, especially among girls and
women, emerges as a policy priority. Substantial investment is needed to build and maintain human
capital by improving access to education and supporting the transition to secondary school, espe-
cially among secondary school-age children. Removing the requirements of identity documents
to enroll in education and enhancing access to income generating opportunities among adults of
nonschool age will be key in supporting access to education for Shona children and youth. Easing
access to education will be key in mitigating the socioeconomic impacts of the COVID-19 pandemic.
3. Investing in health, education, and livelihood strategies can help mitigate the impacts of the
COVID-19 pandemic. Ensuring access to safe health care for non-COVID-19-related health concerns
can help reduce the risk of future health crises and overwhelming the health system. On education,
providing homeschooling materials and increasing access to e-learning can support children’s edu-
cation and keep students from falling behind. Finally, targeted cash transfers, increased access to
financial services, and information campaigns on existing support programs can help reduce nega-
tive impacts on livelihoods.
Executive Summary xiii
10183_Shona Report.indd 13 12/14/20 2:56 PM4. Recognizing and registering the Shona stateless community can have a positive impact, not only
on the socioeconomic lives of stateless persons, but on Kenyans overall. Even though the Kenyan
government has taken steps to address the issue by establishing a national taskforce for the identifi-
cation and registration of eligible stateless persons as Kenyan citizens, a significant amount of work
still lies ahead. Direct government interventions, and further advocacy can support the integration
of this community into social services, the formal labor market, and ultimately the socioeconomic
development of the nation.
xiv Understanding the Socioeconomic Conditions of the Stateless Shona Community in Kenya
10183_Shona Report.indd 14 12/22/20 5:40 AMBackground and Objectives
1. Despite laws safeguarding rights to citizenship and providing pathways toward regularization for
longstanding residents, millions of people in the world are denied a nationality. The 1954 Convention
relating to the status of stateless persons defines a ‘stateless person’ as one “who is not considered
as a national by any State under the operation of its law” (UNHCR 2005).4 According to Article 15 of
the 1948 Universal Declaration of Human Rights, “everyone has the right to a nationality. No one shall
be arbitrarily deprived of their nationality nor denied the right to change his nationality.” The 1954
Convention relating to the Status of Stateless Persons and the 1961 Convention on the Reduction of
Statelessness form the foundation of the international legal framework to prevent and address state-
lessness (United Nations 1961). Despite legal frameworks and efforts to reduce statelessness, at least
4.2 million people are reported as stateless based on data available from 76 countries (UNHCR 2020).
However, the true global figure is estimated to be significantly higher.
2. Statelessness usually starts in childhood, bringing along multiple legal and socioeconomic depri-
vations that can last for generations. As many countries around the world observe a jus sanguinis
(“right of blood”) nationality regime whereby citizenship is determined by the nationality or citizen-
ship of one or both parents, children of stateless parents ‘inherit’ such a status (Kohn and Gurd 2011).
Without a nationality or citizenship, individuals are often denied access to basic human rights, such as
education, health, documentation, employment, marriage, and freedom of movement. An estimated
one-third of stateless persons are children—without the legal protection that comes with citizenship
this minority group is sentenced to a lifetime of social and economic inequity associated with the lack
of access to fundamental rights.
3. UNHCR is mandated by the United Nations General Assembly to identify and protect stateless
persons and to prevent and reduce statelessness globally. Statelessness and displacement are deeply
interlinked, as the former can cause the latter (Norwegian Refugee Council 2015).5 Such a link initially
led the United Nations General Assembly to ask UNHCR in 1975 to provide assistance to individu-
als under the 1961 Convention on the Reduction of Statelessness.6 Through a series of resolutions
beginning in 1995, UNHCR was officially designated as the agency responsible for overseeing the pre-
vention and reduction of statelessness. Pursuant to this mandate, in consultation with states, civil soci-
ety, and international organizations, UNHCR has set out the Global Action Plan to End Statelessness:
2014–2024, and launched the #IBelong Campaign (UNHCR 2017a). Since the launch of the #IBelong
4 While nationality is acquired through birth, adoption, marriage, or descent, citizenship is granted to an individual by the
government of the country when he or she complies with the legal formalities: in doing so, citizenship or nationality not only
provides people with a sense of identity, it entitles individuals to the protection of a state and to many civil and political rights
(UNHCR 2005).
5 For example, many Rohingyas, despite living in Rakhine for generations, were forced to leave their homes for safety in
nearby countries due to a revision in Myanmar citizen law in 1982. The revision of the law deprived them of their nationality,
restricting their freedom of movement, access to education, health, employment, and land ownership. https://files.institutesi
.org/stateless_displacement_brief.pdf
6 The 1961 Convention, which complements the 1954 Convention relating to the status of stateless persons, is the leading
international instrument that sets rules for the conferral and non-withdrawal of citizenship to prevent cases of statelessness
from arising by setting out rules to limit the occurrence of statelessness.
1
10183_Shona Report.indd 1 12/14/20 2:56 PMCampaign, more than 166,000 stateless persons have acquired or had their nationality confirmed, and
many states have complied with the statelessness convention resolutions. In 2019, UNHCR convened a
High-Level Segment on Statelessness that generated 360 pledges of concrete actions, most of which
were delivered by states.7 Despite these achievements, the challenge of identifying stateless persons
and those at risk contributes to the prevalence of statelessness (UNHCR 2018).
4. Statelessness remains a significant, yet inadequately documented problem in Sub-Saharan Africa.
Sub-Saharan Africa is the second largest hosting region of stateless persons in the world, after Asia
and the Pacific.8 From the limited data available to UNHCR, 23 percent of the world’s stateless persons
(974,988) live in this region, of whom some 98 percent live in West and Central Africa compared to
2 percent in the East and Horn of Africa, and the Great Lakes (EHAGL) region (UNHCR 2019). Despite
the large number of stateless persons in this region, governments in Africa have only recently recog-
nized it as a serious problem and many are now taking steps to address it.9 However, the scope of the
problem still remains poorly documented due to, among other reasons, the common misconception
that all refugees are stateless and the overlap between the official stateless population and the much
larger population of undocumented persons who are unaware of their official nationality status (Mules
2019). Therefore, important socioeconomic data gaps on statelessness persist.
I. Statelessness in Kenya
5. Kenya is home to an estimated 18,500 stateless persons, making it the largest hosting nation in the
EHAGL region.10 In Kenya, there are different groups of stateless persons, including the Pemba, Galjael,
Shona, and groups of individuals of Burundian, Congolese, Indian, and Rwandan descent, many of whom
have been in the country for decades or even generations. These populations inherited statelessness
from their ancestors, as the Kenyan Constitution at the time of independence lacked a provision for the
recognition of stateless persons as Kenyans (UNHCR 2017b). The revised 2010 Kenya Constitution gives
prominence to citizenship, which is implemented by the Kenya Citizenship and Immigration Acts (KCIA)
of 2011. Section 15 of the KCIA 2011 indicates that stateless persons living in Kenya for a continuous
period since December 12, 1963, may be considered for citizenship upon fulfilling set criteria.11 However,
a lack of information on the existence of this legislation and unfamiliarity with the process, as well as the
inability to invoke the relevant registration provisions, still leave many in statelessness. While the con-
stitution also guarantees every child the right to a name and nationality from birth, it does not include
specific safeguards to protect individuals from statelessness.12
7 For a complete list of pledges, see https://www.unhcr.org/ibelong/results-of-the-high-level-segment-on-statelessness/
8 Statelessness in Africa is deeply embedded in discrimination based on ethnicity, religion, or gender; the transfer of territory
between existing states, conflicting nationality laws; and migration, nomadism, and forced displacement (Institute on
Statelessness and Inclusion 2017).
9 For instance, the African Human Rights System, a composition of several human rights treaties between African Union
Member States, has developed its position and guidance on the right to nationality, while the Abidjan Declaration by the
Heads of State of the Economic Community of West African States (ECOWAS) has shown that there is a political will to
eradicate statelessness.
10 The estimated number of stateless persons is derived from the communities.
11 Kenya: s.15 of the Kenya Citizenship and Immigration Act, 2011, Act No. 11 of 2011, 30 August 2011, available at: https://www
.refworld.org/docid/4fd9a3082.html
12 For instance, it does not contain adequate guarantees to ensure that children of stateless persons who would otherwise be
stateless can acquire nationality (Abuya 2010).
2 Understanding the Socioeconomic Conditions of the Stateless Shona Community in Kenya
10183_Shona Report.indd 2 12/14/20 2:56 PM6. Birth certificates are the key supporting documents for citizenship applications in Kenya. Birth
registration is a two-step process: first, parents need a birth notification from the health care facility
where the child is born and from the local administrative authority for those born at home. Second,
parents need to apply for a birth certificate at the civil registrar’s office within six months, during
which time no supporting document is required apart from birth notification. Late birth registration
applications (those done after six months) are at the discretion of the principal registrar and require
the submission of additional supporting documents, such as a passport or identity card which state-
less persons do not have. The lack of information to register children in a timely manner leads to
heightened risks of childhood statelessness. In addition, childhood statelessness is exacerbated by
the limited number of birth registration centers in the sub-counties, extreme poverty among affected
persons, the higher cost of late birth registration, ethnic discrimination, and fear of authorities due to
past expulsion of stateless communities (UNHCR 2017b).
7. Positive steps are being taken by the government to improve civil registration. In January 2019,
the government established the National Integrated Identity Management System (NIIMS) with the
purpose of integrating and managing a central population database.13 In May 2019, the government
began to collect data from all persons in the country, including non-Kenyans, with the aim of issuing
a personal identifier known as Huduma Namba, which would provide access to services that non-
Kenyans were not entitled to before. At the same time, the Civil Registration Services intensified its
efforts of increasing birth registration through the Rapid Results Initiative. The GoK, in collaboration
with UNHCR, UNICEF, and the NGO Haki na Sheria Initiative, organized mobile birth registration exer-
cises in 11 Early Childhood Development Centers, issuing birth certificates to 1,524 children.
8. The GoK’s commitment to resolving statelessness has resulted in a pledge to ensure the protec-
tion of stateless persons, the naturalization of the Makonde community, and an agreement to natu-
ralize qualifying members of the Shona community. During the Global Refugee Forum in December
2019, the GoK pledged to ensure the protection of stateless persons, committing to implementing
a new act that would provide safeguards to prevent statelessness by 2020. Likewise, it pledged to
accede to the UN statelessness conventions. Furthermore, in 2016, the Makonde community14 was
recognized as Kenyan nationals, officially making them Kenya’s 43rd tribe. In 2019, at the Ministerial
Conference on the Eradication of Statelessness in the Great Lakes Region, the GoK agreed to expand
this initiative to qualifying members of the Shona community.
9. The Shona community comprises more than 3,500 stateless persons whose ancestors arrived in
Kenya from modern-day Zimbabwe and Zambia between the 1950s and 1970s. According to the
Shona elders, when they arrived in Kenya, they did not plan to return to their country of origin, as the
gaining of independence by Kenya motivated them to settle and continue their missionary work in the
country. Upon arrival, the Shona were issued certificates of registration under the Alien Restriction Act.
However, a change in the Registration of Persons Act of 1978 prevented them from accessing identity
cards. As a result, most of those who were among the first wave of arrivals do not hold valid legal iden-
tity documents. At the same time, Zimbabwe and Zambia do not consider them as nationals since many
13 The database contains information of all Kenyan citizens and foreign nationals residing in Kenya and serves as a reference
point for ease of service delivery to the people in Kenya.
14 An ethnic minority with origins in northern Mozambique who moved to Kenya before independence.
Background and Objectives 3
10183_Shona Report.indd 3 12/14/20 2:56 PMof those who were born there did not have their births registered and lost all traces of their ancestry
since they never returned, hence rendering them stateless (UNHCR Kenya 2017).15
10. The Shona preregistration and Socioeconomic Survey (SES) serve the continued efforts to resolve
statelessness in Kenya, while adding new evidence on the socioeconomic conditions of stateless per-
sons that is key for evidence-based policy planning and programming.16 While two previous studies on
the Makonde and Pemba communities provide information on the number and characteristics of state-
less communities, little information is available on the Shona.17 The Makonde study led to the registration
of the Makonde as Kenyans in 2016; however, it provided few insights on their socioeconomic conditions.
This left a knowledge gap on the relationship between statelessness and well-being, which is essential
for evidence-based policy interventions.18 With the aim of contributing to filling this gap, in collaboration
with the Department of Immigration Services (DIS) and the Kenya National Bureau of Statistics (KNBS)
of the GoK, UNHCR Kenya, with technical support from the World Bank, conducted a preregistration
exercise and socioeconomic survey for the Shona community living in Nairobi and Kiambu counties
between May and July 2019. While the objective of the registration was for the GoK to prepare the appli-
cation for citizenship of qualifying members,19 the SES was carried out to understand the socioeconomic
conditions of the Shona community compared to those of nationals.
11. The Shona SES provides comparable socioeconomic profiles for the Shona community
and nationals while contributing toward informing a targeted response to address the socio-
economic impacts of the COVID-19 pandemic.20 As part of the socioeconomic household sur-
vey series to understand the living conditions of refugees and persons of concern to the UNHCR
in Kenya, the Shona SES provides a comprehensive snapshot of the economic lives of the Shona
community and the broader national population. The SES presented here compares the living con-
ditions of the Shona community residing in Nairobi and Kiambu counties to the conditions of Ken-
yan nationals in such counties, as well as to the national urban average (Box 1). Thus, by providing
one of the first comparative socioeconomic profiles of nationals and stateless persons, it enables
the design of evidence-informed programming and development policy. The SES links its findings to
the results of the first wave of the Kenya COVID-19 Rapid Response Phone Surveys (RRPS) (Box 2).
15 UNHCR became aware of the Shona community in 2016 through several news reports and meetings with the Shona
community leaders.
16 https://www.unhcr.org/ibelong/makonde-in-kenya/
17 UNHCR (2016a, 2016b).
18 Limited information is available on planned socioeconomic surveys with representative samples. Nevertheless, thanks to
the #IBelong Campaign and to the collaborative work of diverse stakeholders, further quantitative research is expected to be
carried out.
19 This included documenting migration history, residence in Kenya, family circumstances, and available documentation.
20 The UNHCR carried out a preregistration.
4 Understanding the Socioeconomic Conditions of the Stateless Shona Community in Kenya
10183_Shona Report.indd 4 12/14/20 2:56 PMBOX
1 Methodological summary
The results presented in this report are based on data gathered from households of the
Shona community living in Nairobi and Kiambu counties. The Shona SES occurred concur-
rently with the preregistration data collection activity, which aimed to interview all Shona
households in Kenya. Therefore, no sampling frame was used. UNHCR and the Shona com-
munity leaders estimate that there were some 3,500 individuals, although the preregistration
activity interviewed only 2,084 individuals (equivalent to 465 households). These house-
holds were identified through household listings, with the help of Shona community elders
as key informants. The Shona were initially identified to be living in four main areas in Nairobi
and Kiambu counties: Githurai and Hurlingham in Nairobi, and Kiambaa and Kinoo in urban
Kiambu. The four areas included only urban households.21 Households in Hurlingham were
excluded because they are part of a religious order who maintain significantly different living
conditions than the average population (see details in Appendix B, Table B.1). This report
covers 1,616 Shona community individuals forming 328 households.
The questionnaire used in the Shona SES produces data comparable to national house-
hold surveys and other standard instruments. Modules on education, employment, house-
hold characteristics, and consumption and expenditure are aligned with the most recent
national poverty survey, the 2015/16 KIHBS, and provides comparable results reported at
the county and national levels.22 Questions are also aligned with the KCHS which, since 2019,
collects comparable statistics on an annual basis for all counties in Kenya. The poverty level
of the stateless Shona community is estimated by using the full consumption module used
by KNBS. Households were defined using KNBS’ guidelines as a group of people who live
together, share meals, and recognize the same and only one head of household among them.
In addition to this, the household must have at least one person who identifies as Shona, that
is, was either born in Rhodesia, Zimbabwe, or Zambia, or can be linked to these countries
through past or current marriage or direct ancestors who migrated to Kenya.23 However,
this definition does not require an individual to be stateless, as the main goal was to study
the Shona community who are likely to be affected by statelessness and to advocate for
citizenship on their behalf.
Comparability between the Shona community and nationals can be limited. First, the com-
parison is limited by a gap of four to five years between the Shona SES data and the KIHBS
2015/16 data, during which national averages might have changed considerably. Secondly,
21 The pilot study revealed the migration of some members of the community to other counties, mainly Meru and Mombasa,
whereas others had moved to other areas within Nairobi and Kiambu counties. Households located in Meru and Mombasa
were excluded from the analysis in order to maintain representativeness of the households in the main study areas.
22 Kenya National Bureau of Statistics (KNBS), 2015/16 Kenya Integrated Household Budget Survey (KIHBS). http://statistics
.knbs.or.ke/nada/index.php/catalog/88
23 This filter was applied at the listing stage.
Background and Objectives 5
10183_Shona Report.indd 5 12/14/20 2:56 PMa smaller population of the Shona community who live closer to the capital are being com-
pared to a larger group of urban nationals spread across the country. This can also affect the
differences between the Shona community data and the KIHBS data aside from stateless-
ness. Comparisons were done only at the urban level, thus only urban Kenyan households
at the national and county levels were compared to urban Shona households (see national
sample size in Appendix B, Table B.2).
BOX
2 Kenya COVID-19 rapid response phone surveys
The Kenya RRPS is designed to respond to the urgent need for timely data and evidence to
help monitor and mitigate the impact of the COVID-19 pandemic. The World Bank, together
with the KNBS and UNHCR, and in collaboration with the University of California Berkeley,
designed and implemented the high frequency phone survey to measure the socioeconomic
impacts of the pandemic on nationals, refugees, and stateless people. The RRPS collects
bimonthly data on knowledge about COVID-19, behavior changes, income loss, safety nets,
access to medicine and food, employment, food security, coping mechanisms, and concerns.
The RRPS recently completed the first of three data collection rounds, including a sample
of about 1,250 refugees and stateless people in the Kalobeyei settlement, Kakuma camps,
Dadaab camps, Nairobi, and the Shona community. This report includes selected preliminary
results on health, education, and livelihoods for the Shona community, refugees living in
urban Nairobi, and nationals, while providing relevant recommendations. More details on the
Kenya RRPS as well as a results dashboard can be accessed through the Kenya COVID-19
tracker website (www.kenyacovidtracker.org).24
24
24 The statistics on nationals exclude refugees and Shona stateless persons. Thus, they differ slightly from statistics on the
entire population of Kenya, which includes refugees and Shona stateless people, used in other publications based on the 2020
Kenya COVID-19 RRPS.
6 Understanding the Socioeconomic Conditions of the Stateless Shona Community in Kenya
10183_Shona Report.indd 6 12/14/20 2:56 PMFindings
I. Consumption and Poverty25
12. More than half of the Shona community population is poor, and they are 17 percentage points
more likely to be poorer than the average Kenyan national. About 53 percent of the Shona popu-
lation lives below the national poverty line of US$59.95 per month, which is higher than the national
average of 36 percent (p FIGURE 1: Poverty headcount (national poverty line)
60 56
53
49
50
Percent of population
40 36
29
25
30
17
20
10
0
Shona National National Shona National Shona National
(urban)
Population average Kiambu County Nairobi County
Source: Shona SES (2019) and KIHBS (KNBS 2015/16).
FIGURE 2: Poverty gap and severity (national poverty line)
20
18
17
16
16
Percent of population
12 10
9 7
8 8
7
8
5
4 3 3
4
1
0
Shona National National Shona National Shona National
(urban)
Population average Kiambu County Nairobi County
Poverty gap Poverty severity
Source: Shona SES (2019) and KIHBS (KNBS 2015/16).
(p FIGURE 3: Gender distribution for the Shona community and Kenyans, by county
100
80
49 50 49 48 49 50
Percent of population
60
40
51 50 51 52 51 50
20
0
Shona National Shona National Shona National
(urban)
Population average Kiambu County Nairobi County
Men Women
Source: Shona SES (2019) and KIHBS (KNBS 2015/16).
FIGURE 4: Demographic profile of the Shona community and Kenyans
Population pyramid Shona Population pyramid urban Kenya
Year 2019 Year 2016
70+ 70+
65–69 65–69
60–64 60–64
55–59 55–59
50–54 50–54
Age group
45–49 45–49
40–44 40–44
Age group
35–39 35–39
30–34 30–34
25–29 25–29
20–24 20–24
15–19 15–19
10–14 10–14
5–9 5–9
Under 5 Under 5
–150 –100 –50 0 50 100 150 1,000 800 600 400 200 200 400 600 800 1,000
Population Population (’000)
Men Women Men Women
Source: Shona SES (2019) and KIHBS (KNBS 2015/16).
15. The Shona community population is younger—almost half are below 18 years old but have the
same proportion of elders as urban Kenyans. Among the Shona population, about 49 percent are below
18 years old, which is greater than the national urban average of 41 percent (p FIGURE 5: Household size for the Shona community and Kenyans
6
Number of household members
5.1
4.9
5 4.6
4
3.3 3 3
3
2
1
0
Shona National Shona National Shona National
(urban)
Population average Kiambu County Nairobi County
Source: Shona SES (2019) and KIHBS (KNBS 2015/16).
while for Kenyans it is 18 years for men and 19 years for women. Among urban Kenyans, there is a larger
proportion of the population within the 20–34 age groups and relatively fewer children.
16. The Shona community households are larger in size and have two more members on average, and
the working population bears more economic burden than urban Kenyans. The average Shona com-
munity household size is 4.9 compared to 3.3 in urban Kenya (p FIGURE 7: Distribution of men-headed households for the Shona community and Kenyans
100 77
77 72 78 76
75
80
Percent of households
60
40
20
0
Shona National Shona National Shona National
(urban)
Population average Kiambu County Nairobi County
Source: Shona SES (2019) and KIHBS (KNBS 2015/16).
have larger dependency ratios than nationals in their respective counties: while one Shona is responsible
for one dependent in Kiambu and Nairobi, two Kenyans are responsible for only one dependent (p FIGURE 9: Type of roofing materials for the Shona community and Kenyans
100 4 3 2 3
2 5 2
11 5 17
15 23
80 35
Percent of households
60
85 80 90 81
40 75
62
20
0
Shona National Shona National Shona National
(urban)
Population average Kiambu County Nairobi County
Iron sheets Concrete Grass/makuti Other
Source: Shona SES (2019) and KIHBS (KNBS 2015/16).
and Taylor 2016). The types of wall, roof, and floor materials used for the construction of residen-
tial dwellings are used to determine the classification of housing as improved or unimproved based
on classification from the Demographic and Health Survey (DHS) Analytical Studies.26 Based on this
classification, about 6 in 10 Shona houses are improved; however, differences exist among counties.
Less than half of Shona houses in Kiambu County are made of improved materials, lower than what is
observed for nationals in the same county (pFIGURE 10: Type of floor material for the Shona community and Kenyans
100 2 1 2 1
7 4
9 4 13 8
5 7 19 8
9
80
Percent of households
8
60
69 73 78
84 92
40
69
20
4
12 0.5 5
0 2 5
Shona National Shona National Shona National
(urban)
Population average Kiambu County Nairobi County
Earth/sand Dung Cement Carpet Ceramic tiles Other
Source: Shona SES (2019) and KIHBS (KNBS 2015/16).
FIGURE 11: Type of wall material for the Shona community and Kenyans
100 4 2
5 6 7
80 25 29
28
Percent of households
30
47
60 77
16
48 37
39
40 16
20 14 46
32 21 15 29
13 8 3
0 2
Shona National Shona National Shona National
(urban)
Population average Kiambu County Nairobi County
Mud/with stone/bamboo/uncovered adobe
Corrugated iron sheet
Cement/cement blocks/bricks
Stone with lime/cement
Other
Source: Shona SES (2019) and KIHBS (KNBS 2015/16).
69 percent). However, for Kenyans, those living in Nairobi are almost as likely to use cement as those in
Kiambu (78 percent vs. 73 percent, pYou can also read