Structure and performance of Ethiopia's coffee export sector - Bart Minten, Seneshaw Tamru, Tadesse Kuma, and Yaw Nyarko
←
→
Page content transcription
If your browser does not render page correctly, please read the page content below
WORKING PAPER 66

Structure and performance of
Ethiopia’s coffee export sector
Bart Minten, Seneshaw Tamru, Tadesse Kuma, and Yaw Nyarko

June 2014
TABLE OF CONTENTS
Abstract ..................................................................................................................................................................................1
1. Introduction .......................................................................................................................................................................1
                                                                                                                                                             SUMMARY | APRIL 2010
2. Coffee in Ethiopia ..............................................................................................................................................................       2
3. Data ...................................................................................................................................................................................4
4. Structure of the coffee export sector in Ethiopia ...............................................................................................................5
   4.1. Characteristics of coffee transactions and coffee exporters ......................................................................................5
   4.2. Firm concentration and dynamics ..............................................................................................................................5
   4.3. Seasonality .................................................................................................................................................................7
   4.4. Private versus public coffee exporting firms ...............................................................................................................8
5. Coffee Quality ...................................................................................................................................................................9
6. Coffee Export destination markets ..................................................................................................................................14
7. Performance of Ethiopia’s coffee export sector ..............................................................................................................17
   7.1. Values and quantities ...............................................................................................................................................17
   7.2. Changes in international coffee prices .....................................................................................................................18
   7.3. Quality premiums offered for Ethiopian coffee .........................................................................................................19
8. Discussion and conclusions ............................................................................................................................................25
References ...........................................................................................................................................................................28

                                                                            LIST OF TABLES
Table 1—Ethiopia’s coffee exports – descriptive statistics ....................................................................................................5
Table 2—Factors associated with the export of washed and certified coffee – probit model .............................................13
Table 3—Multinomial logistic regression model of destination markets for Ethiopian coffee ..............................................16
Table 4—Determinants of coffee prices (log(US cents per lb)); hedonic price model .........................................................21
Table 5—Testing the benefits of vertical integration and traceability in the Ethiopian coffee export sector .......................23
Table 6—Determinants of coffee prices (log(US cents per lb)) by destination market; hedonic price model .....................24
Table 7—Determinants of coffee prices (log(US cents per lb)); quantile hedonic price models .........................................25

                                                                           LIST OF FIGURES
Figure 1—Location of coffee production in Ethiopia ..............................................................................................................2
Figure 2—Value of coffee exports from Ethiopia and year-on-year growth in coffee exports, compared to total
            exports, 2002/03 to 2012/13 ...........................................................................................................................3
Figure 3—Number of exporters and annual average/median value of coffee exports per exporter, 2007 to 2012 ..............6
Figure 4—Concentration ratios in Ethiopia’s coffee export sector, 2006 to 2013 at six-month intervals ..............................6
Figure 5—Evolution of incumbent (present year before and after), exiter (not present year after), and entrant (not
            present the year before) firms in the coffee export sector, by number and by share in coffee exports .........7
Figure 6—Monthly seasonality index for quantity of coffee exports for period 2003 to 2012 ................................................8
Figure 7—Share of coffee exports by cooperatives and parastatal firms, 2006 to 2013 at six-month intervals ...................9
Figure 8—Quality premiums for coffee certification and washing, 2006 to 2013 ................................................................10
Figure 9—Shares of washed coffee in total exported coffee quantities, monthly, 2006 to 2013 ........................................10
Figure 10—Evolution of grades within washed and unwashed market segment, 2006 to 2013 at six-month intervals......11
Figure 11—Export share of the different producing regions by quantity and value, 2006 to 2013 at six-month intervals ..12
Figure 12—Share of different destination markets for Ethiopia’s coffee exports in 2012....................................................14
Figure 13—Share of different destination markets in Ethiopia’s coffee exports ..................................................................14
Figure 14—Cumulative price distribution by destination market, 2005 to 2013 ..................................................................15
Figure 15—Share of exports of washed and unwashed coffee by export destination, 2005 to 2013 .................................17
Figure 16—Trends in real value and quantities of coffee exports from Ethiopia, 2003 to 2012 (Jan. 2003=100; 12-
            month moving average) ................................................................................................................................17
Figure 17—Trends in Ethiopian export coffee price versus reference international coffee price, 2002 to 2013 .................18
Figure 18—Difference between Addis Ababa retail coffee price and the Ethiopia coffee export price, 2002 to 2013 by
month ............................................................................................................................................................19
Figure 19—Regional coffee premiums over time, compared to Sidama coffee ..................................................................22
SUMMARY | APRIL 2010ABSTRACT
We study the structure and performance of the coffee export sector in Ethiopia, Africa’s most important coffee
producer, over the period 2003 to 2013. We find an evolving policy environment leading to structural changes in
the export sector, including an elimination of vertical integration for most exporters. Ethiopia’sSUMMARY | APRILearn-
coffee export 2010
ings improved dramatically over this period, i.e. a four-fold real increase. This has mostly been due to increases
in international market prices. Quality improved only slightly over time, but the quantity exported increased by 50
percent, seemingly explained by increased domestic supplies as well as reduced local consumption. To further
improve export performance, investments to increase the quantities produced and to improve quality are needed,
including an increase in washing, certification, and traceability, as these characteristics are shown to be associ-
ated with significant quality premiums in international markets.
1. INTRODUCTION
Coffee is one of the most important traded commodities in the world. The sector’s trade structure and perfor-
mance have large development and poverty implications, given the high concentration of production by small-
holders in poor developing countries. Coffee’s global value chains are quickly transforming because of shifts in
demands and an increasing emphasis on product differentiation in importing countries (Ponte 2002; Daviron and
Ponte 2005). There is a growing willingness-to-pay for premium, high quality coffee by rich consumers and the
demand for specialty and certified coffee is on the rise.1 Moreover, international coffee markets have experienced
significant price variation over the last decade – prices were five times higher in 2011 than in 2002.
These changes have important implications for a number of the poorest developing countries, as most
coffee production takes place in these countries, even though most coffee consumption is in developed countries
(Pendergrast, 2010; Ponte, 2002). While there are a number of studies that have looked at price formation for
different types of coffee at the retail consumption level in importing countries (e.g. Teuber and Herrmann, 2012),
important questions remain on who benefits from this increasing willingness-to-pay for coffee and on how
changes in global coffee markets are transmitted to producing countries. Moreover, few researchers have looked
at how domestic policy change is affecting the performance of the coffee sector in these exporting countries.
In this paper, we look at the structure and performance of the coffee export sector in Ethiopia. In 2012,
Ethiopia exported 3.2 million bags, making it the most important African coffee exporter and the tenth largest ex-
porter in the world (ICO, 2013). Its share of the international coffee trade that year was about 3 percent. Coffee is
the most important export product of the country, accounting for about a quarter of the value of all exports in
2012. Coffee is cultivated by over 4 million primarily smallholder farming households (CSA, 2013) and, with those
employed in ancillary activities to coffee production, even more households are dependent on coffee for part of
their livelihoods (LMC, 2003). Furthermore, coffee plays an important role in social gatherings and is important in
local consumption, as more than half of Ethiopia’s coffee production is consumed locally (CSA, 2013).
We study the structure and performance of Ethiopia’s coffee export sector over the last decade. First, we
document the characteristics of the sector, the policy shifts affecting the sector, and the important structural
changes that have occurred in Ethiopia’s coffee export market during the study period. We then study how price,
quantity, and quality variation is associated with export performance. Local policy changes in Ethiopia, primarily
those related to the start of the Ethiopian Commodity Exchange (ECX) at the end of 2008, as well as export li-
cense suspensions, have contributed to structural shifts in the sector. We find a lower concentration ratio in the
export sector, an inflow of smaller firms, a slowly increasing importance of cooperatives and parastatals, and a
slight diversification in the countries to which coffee is exported subsequent to these policy changes. Over the
last decade, we also note a large increase in the value of coffee exports over time. This change has mostly been
driven by increases in international prices and to a lesser degree by increased quantity and quality of exported
1
Specialty coffee and high-quality coffee are typically synonymous. However, certified coffee is not necessarily specialty coffee.
1coffee from Ethiopia. While the exported quantity has increased, this has seemingly been driven by both in-
creased production and reduced local consumption. We further note important premiums being paid in interna-
tional markets for washing, certification, vertical integration, and for geographical indications of origin. The latter
two are especially rewarded in emerging high-end markets.
SUMMARY | APRIL 2010
The structure of the paper is as follows. First, we give some background information on the coffee sector
in Ethiopia. Thereafter, in Section 3, we describe the data used for this study. Structural characteristics of the cof-
fee sector are discussed in Section 4. We discuss quality issues in the Ethiopian coffee market and export desti-
nation markets in Sections 5 and 6, respectively. The performance of the sector over the last decade is consid-
ered in Section 7, particularly examining export prices and quality and their associations with different influencing
factors. We finish with a discussion of the findings and conclusions.
2. COFFEE IN ETHIOPIA
Ethiopia is endowed with a good production environment for growing coffee with a combination of appropriate
altitude, temperature, rainfall, soil type, and pH. Ethiopia is the center of origin for Coffea arabica. The country
possesses a diverse genetic base for this Arabica coffee with considerable heterogeneity. Ethiopia produces a
range of distinctive Arabica coffees and has considerable potential to sell a large number of specialty coffees
(Nure, 2008).2 Little of the lower-value Robusta coffee is produced in Ethiopia, being better suited for production
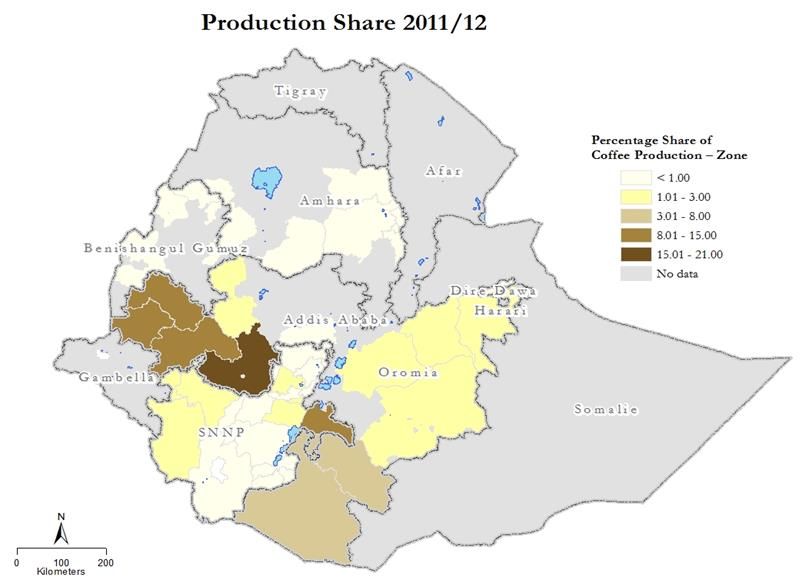
in lower altitude equatorial climates. Coffee production in Ethiopia is almost exclusively situated in the two regions
of Oromia and the Southern Nations, Nationalities, and People Regions (SNNPR) in the south and west of the
country (Figure 1).
Figure 1—Location of coffee production in Ethiopia
2
The Specialty Coffee Association of America (SCAA) defines specialty coffee in its green stage as coffee that is free of primary defects, contains no
unripened beans, is properly sized and dried, is free of faults and taints, and has distinctive attributes (Rhinehart, 2012).
2Smallholder farmers produce 95 percent of Ethiopia’s coffee (Tefera and Tefera, 2013). It is produced un-
der several types of production systems, including forest, semi-forest, garden, and plantation coffee (Tulu, 2008).
Forest coffee is grown in the wild under natural forest cover and is gathered by farmers from trees with minor tree
maintenance. Semi-forest coffee is also grown in forest conditions, but there is some limited maintenance by
SUMMARY | APRIL 2010
farmers, mostly annual weeding. This type of coffee has clearly delineated boundaries of ownership, although the
trees usually are located away from agricultural plots. Garden coffee is defined as coffee from trees planted by
farmers in the vicinity of their residences. It is often intercropped with other crops or trees. Plantation coffee is
grown on large commercial farms, private as well as state farms. Modern production practices – such as irriga-
tion, modern input use, mulching, stumping, and pruning - are often applied in this case. While reliable recent sta-
tistics are lacking, it is estimated that these different production systems make up about 10, 35, 50, and 5 per-
cent, respectively, of total coffee production in the country (Kufa, 2012).
Figure 2 shows the variation in the value (in nominal USD) of both overall exports and coffee exports from
Ethiopia over the last decade. The figure illustrates two main patterns. First, coffee makes up an important part of
overall exports. Second, we see strong growth rates in both over the last decade. The overall value of exports
grew at an average compounded annual rate of 21 percent, while coffee exports grew at 16 percent. This slightly
slower growth rate of coffee exports compared to overall exports implies that the share of coffee exports in total
exports has decreased over time. While coffee made up almost 35 percent of the value of total export in 2002/03,
this came down to 24 percent for the period 2012/13, which suggests that export commodities have diversified in
recent years.
Figure 2—Value of coffee exports from Ethiopia and year-on-year growth in coffee exports, compared to total ex-
ports, 2002/03 to 2012/13
3,500 70.0
coffee
total 60.0
3,000
growth coffee 50.0
growth total 40.0
2,500
30.0
1000 USD
2,000
percent
20.0
1,500 10.0
0.0
1,000 -10.0
-20.0
500
-30.0
0 -40.0
There have been significant domestic policy reforms in the last decade that affected the structure and per-
formance of the coffee export sector. First, from December 2008 onwards it became mandatory for private trad-
ers to sell their coffee through the Ethiopian Commodity Exchange (ECX), a new modern commodity exchange.3
ECX trades standard coffee contracts, based on a warehouse receipt system, with standard parameters for cof-
fee grades, transaction size, payment, and delivery. The first level quality control is decentralized and undertaken
3
Producers who are exporters can bypass the ECX, as can farmer cooperatives.
3in nine liquoring and inspection units in major production areas.4 The establishment of the ECX has led to im-
portant changes in the structure of the coffee value chain (Gabre-Madhin, 2012).
Second, the government intervened in the coffee market on several occasions in an effort to reduce
hoarding by exporters. In April 2009, six large traders were banned from exporting coffee because
SUMMARY of their pre-
| APRIL 2010
sumed excessive hoarding. The government revoked their licenses, closed down their warehouses, seized their
coffee stocks, and sold them on their behalf (Alemu, 2009). A policy was further implemented in May 2011 that
limited the amount of coffee an exporter can store. An exporter, for example, selling and buying coffee on the
ECX will have his or her right to trade on the commodity exchange revoked if found to be storing more than 500
metric tons of coffee without a shipment contract with an importer (Tefera and Tefera, 2013).5 Failing to adhere to
these regulations has led to the banning of coffee exporters, as seen in 2011 and 2013 (Araya, 2011; Ye-
wondwossen, 2014).
Third, there have been a number of changes regarding export taxes on coffee over time. Core changes
include the removal of entry barriers (Proclamation No. 70/1993); the consolidation of all taxes and duties levied
on coffee export into a single tax family (Proclamation No. 99/1998), which consolidated all taxes on coffee export
to 6.5 percent; and, following the 2002 international coffee crisis, the waiving of all export taxes on coffee exports.
Finally, an Ethiopian Fine Coffee Trademark Licensing Institute was set up in February 2005 with the pur-
pose of setting up a system to secure legal ownership in international markets of specialty coffee names (espe-
cially Sidamo, Harar, and Yirgacheffe) (Agrer, 2004). There was initial resistance against this initiative, but they
were ultimately settled. The goal of this effort was to add brand value to Ethiopian coffee. Signatories entered into
a brand management strategy with the government with the purpose of achieving better farm-gate and export
prices for coffee (Arslan and Reicher, 2010).
3. DATA
To understand Ethiopia’s coffee export sector, we relied on different sources of information and methods. First, a
large number of key informants in the sector were contacted and interviewed. These included employees of pri-
vate exporters, the Coffee Liquoring Unit (CLU), the Coffee Plantation and Development Enterprise, the Coffee
Processing and Warehouse Enterprise, government entities, ECX, coffee producers and retailers, as well as cof-
fee researchers.
In addition, we used a number of secondary data sources. First, data were obtained from the National
Bank of Ethiopia (NBE) on monthly coffee exports for the period 2002 to 2013. These data were used to calculate
trends, 12-month moving averages, as well as seasonal movements. Second, the International Coffee Organiza-
tion (ICO) calculates an international composite price for coffee based on future contract prices recorded on the
London and New York stock exchange. Historical monthly data were downloaded from their webpage.6 Third, a
database of coffee export transactions is maintained by the Ministry of Trade. This export transactions dataset for
the period July 2006 to June 2013 was used.
An important aspect in coffee exports is quality. Coffee quality assessments for exports are conducted by
the Coffee Liquoring Unit (CLU) to ensure that it meets export standards. After buying coffee on the ECX trading
floor (or, before 2009, at the coffee auction), exporters pick up the coffee from regional ECX warehouses and it
undergoes further processing to meet export standards.7 On reaching this export standard, a quality certificate is
4
Before the establishment of ECX, all first and second level quality inspection was carried out in Addis Ababa.
5
A directive requiring the shipment of coffee in bulk containers, instead of 60-kilogram jute-bags, was put in place in mid-November 2011. However, it
was revoked soon after because of pressures from exporters. Such bags are widely used in international trade and help to better maintain the identity
of the coffee (Tefera and Tefera, 2013).
6
http://www.ico.org/
7
It is estimated that there are about 80 of these processing units, mostly based in Addis. The most sophisticated processing machine is held by the
Coffee Processing and Warehouse Enterprise. It is estimated that they process in their unit about one-quarter of all coffee exported from Ethiopia.
4issued by the CLU. A quality inspection sheet is prepared and is attached to the lot to be exported.8 These quality
indicators, as well as others (such as washing, certification, and origin), are part of the coffee export transactions
dataset, which was used for this study. We also obtained a list of private commercial coffee farms (with cultivated
areas of 40 hectares and above) from its association. This information was integrated into the analysis as well.
SUMMARY | APRIL 2010
4. STRUCTURE OF THE COFFEE EXPORT SECTOR IN ETHIOPIA
4.1. Characteristics of coffee transactions and coffee exporters
Table 1 gives an overview of some of the characteristics of coffee export transactions and of exporters over the
period 2006 to 2013. The average coffee export transaction over this period involved 37 metric tons with a value
of 133,000 USD. The average price was 173 US cents per pound (lb). The large standard deviations indicate sig-
nificant variations in quantity, value, and price between transactions. 51 percent of the export transactions were
destined for Europe, 14 percent for North America, 12 percent for Saudi Arabia, and 10 percent for Japan. Sudan
accounted for 4 percent of all the export transactions over that period.
Transactions were aggregated by coffee exporter for every year to give an idea of the scale of operations
of the exporters. An average exporter over that period exported 1,266 metric tons of coffee per year for a value of
4.5 million USD. Again, we see large variability in scale of operations across exporters.
Table 1—Ethiopia’s coffee exports – descriptive statistics
Mean Median Standard
Unit deviation
Transaction data (07/2006 - 06/2013)
Quantity Metric tons 37.8 19.2 36.1
Price US cents/lb 173.2 159.0 66.8
Value 1000 USD 132.7 91.5 131.4
Destination markets:
Europe % of transactions 51.2
Japan % of transactions 9.6
North-America % of transactions 13.9
Saudi-Arabia % of transactions 12.0
Sudan % of transactions 4.1
Other % of transactions 9.1
Exporters annually (01/2007 -12/2012)
Quantity exported by active exporters per year Metric tons 1,265.7 340.5 2,610.1
Value of exports by active exporters per year 1000 USD 4,516.3 1,062.5 8,966.2
4.2. Firm concentration and dynamics
We note large changes over the study period in the number of exporters that are active in coffee export markets.
In the beginning of the period (2007-2008), there were about 100 active coffee exporters (Figure 3). This in-
creased to 175 exporters by 2012, an increase of 75 percent. The evolution of the median value of exports per
exporter shows a slight decline over time, seemingly indicating an inflow of smaller exporters. While the average
8
The analysis of coffee quality by the CLU is based on two measures, the raw and physical inspection and the cup inspection. The raw and physical
inspection contributes for 40 percent to the final quality grade, while the cup inspection contributes for 60 percent. However, moisture and screen
analysis are the two requisites before grading any coffee. The moisture content should be less than 11.5 percent, while the size of the bean should be
above screen size 14 for 85 percent of the bean sample. In the case of unwashed coffee, raw quality is determined based on defect count of the beans
and on odor. In the case of washed coffee, the raw quality is based on an assessment of shape and make, color, and odor. Cup quality is assessed along
four criteria, including cup cleanliness, acidity, body, and flavor. Each characteristic counts for 15 percent of the 60 percent of the cup quality value.
The washed coffee export standards vary between grade 1 and 2, as well as under-grade (UG) while unwashed coffee is graded 3, 4, 5, or under-grade.
Within the under-grade category, a further distinction is made for under-grade type ‘inferior, but exportable’ coffee, while the worst under-grade
coffee is not exportable and is destined for domestic consumption.
5value of exports per exporter came down in 2009 (the first year of the ECX), it has rebounded since, although the
median value has not.
Figure 3—Number of exporters and annual average/median value of coffee exports per exporter, 2007 to 2012
SUMMARY | APRIL 2010
200 6
180
5
Number of exporters 160
140
4
million USD
120
100 Number of exporters 3
80 Average value
2
60 Median value
40
1
20
0 0
2007 2008 2009 2010 2011 2012
We look at the concentration ratio of export firms in Ethiopia. Common measures used to measure the
concentration of firms in economic sectors are the CR4 and CR8, the share of business in the sector handled by
the four and by the eight largest firms in the sector, respectively. These concentration ratios have decreased sig-
nificantly over time, especially after 2008 (Figure 4). Before 2008, the CR4 on average was about 40 percent,
while the CR8 approached 60 percent. Since the ban of export licenses of six major exporters in early 2009 (Al-
emu, 2009), this share came down by 16 percent and 14 percent for the CR8 and CR4, respectively, compared to
the end of 2008.9 Over the period considered, the lowest concentration was at the beginning of 2011, but has
been slowly increasing since. At the beginning of 2013, the CR8 was almost 40 percent, while the CR4 was 25
percent.
Figure 4—Concentration ratios in Ethiopia’s coffee export sector, 2006 to 2013 at six-month intervals
70
60
50
percent
40
30
20 CR4
CR8
10
0
9
The license ban was triggered by the perception that these exports were involved in excessive hoarding, contributing to a general lack of foreign
exchange in Ethiopia (Alemu, 2009).
6The World Bank (2014) shows that the largest exporters, i.e. those selling more than 5 million USD per
year, account for nearly 80 percent of coffee exports. They further argue that the coffee market is hard to enter –
new firms have limited opportunities to enter into the coffee export business. This is illustrated in Figure 5, which
plots the share of entrants (coffee export firms that were not in business the year before), exiters (firms that were
SUMMARY | APRIL 2010
not there the year after), and incumbents (firms that are there both the year before and after) for the period 2007
to 2012. On the left (Figure 5a), we see that a relatively large number of new entrants came into the market in
2010/11, possibly attracted by the high prices in that year. In 2007/08, we find that a large number of firms exited
the market the year after, possibly related to the start of the ECX. However, in the graph on the right (Figure 5b),
the share in total coffee exports of firms that moved in and out of the market is shown to be small, with entrants
and exit firms typically making up less than 10 percent of the market. The graph also illustrates the disruptive ef-
fect of the ban on large exporters in the year 2008/09. The six banned firms made up a large proportion of the 35
percent of firms in that year who were exiters and would not export coffee anymore.
Figure 5—Evolution of incumbent (present year before and after), exiter (not present year after), and entrant (not
present the year before) firms in the coffee export sector, by number and by share in coffee exports
a. Number of coffee export firms b. Share in coffee exports
200 100%
Share in total coffee exports
80%
Number of firms
150
60%
100
40%
50
20%
0 0%
2007/08 2008/09 2009/10 2010/11 2011/12 2007/08 2008/09 2009/10 2010/11 2011/12
incumbents entrants exiters incumbents entrants exiters
4.3. Seasonality
As for most agricultural crops, the production, processing, and marketing of coffee is characterized by important
seasonal patterns. Coffee is mostly harvested during the period October to December. It can be sold immediately
in the form of red cherries, or farmers might dry the cherries and sell them later in the year as whole dried cher-
ries. Figure 6 shows how coffee exports vary over the year. The peak is achieved in the period from March until
June when exports are on average more than twice as high as during the lean period, i.e. October to January.10
The timing of the peak of exports indicate a significant lag between production and exports, linked to time con-
suming post-harvest and processing activities, but also due to storage. If the share of washed coffee in total ex-
ports had increased over time, one might have expected a shift forward in the timing of exports, since washed
coffee is sold slightly earlier in the season. However, such a shift is not noted. In fact, the reverse is observed.
Comparing exports for the period 2003 to 2007 to those of the period 2008 to 2012, a shift in the main export
season to about 2 months later in the year is seen (Figure 6).11 While the peak month of exports was April for the
period 2003 to 2007, this had shifted to June for the period 2008 to 2012.
10
During that period, left-over stocks of the previous year are mostly sold. It is not yet the new harvest.
11
Part of the explanation is seemingly linked to late exports in 2009. As there were wide expectations of currency depreciation and as there was a
decline in international coffee prices, exporters held on longer than usual to their coffee stocks. This led the government to take the drastic measure
of banning licenses of major coffee exporters in April 2009.
7Figure 6—Monthly seasonality index for quantity of coffee exports for period 2003 to 2012
1.8
1.6
SUMMARY | APRIL 2010
1.4
1.2
1.0
0.8
0.6 average 2003-2007
0.4 average 2008-2012
overall average 2003-2012
0.2
0.0
J F M A M J J A S O N D
4.4. Private versus public coffee exporting firms
Figure 7 shows the extent to which cooperatives and parastatals, including the Ethiopian Grain Trade Enterprise
(EGTE) and state farms, play a role in coffee exports from Ethiopia. Three main findings appear from the graph.
First, the share of cooperatives and parastatals in export trade is relatively small. The large majority of coffee ex-
ports is in the hands of the private sector. The lowest share in total exports for the private sector was achieved at
the end of 2009, when its share was 83 percent. However, in most years the private sector largely dominated,
with a share close to 90 percent.
Second, we see significant variation in the share of exports for cooperatives and parastatals over time. In
the case of cooperatives, we see a steadily increase from between 3 and 4 percent in 2006/07 to between 5 and
6 percent in 2012/13. The most important cooperative involved in coffee exports is the Oromia Coffee Coopera-
tive Union, which over this period accounted for 57 percent of the export transactions made by cooperatives.
Other important cooperatives include the Yirgacheffe, Sidama, and Kafa Forest Coffee Cooperatives.
Third, there also is large variation in the share of exports made by parastatal firms. They were the source
of 3 to 4 percent of all coffee exports until the end of 2008. However, their share increased to more than 10 per-
cent at the end of 2009. This was mostly driven by the seizure of coffee stocks of a number of large traders by
the government.12 These stocks were then consequently exported by EGTE on behalf of the government (Alemu,
2009). Since the end of 2009, the share of coffee exports coming from parastatals has been diminishing as many
state farms were privatized over this period. These include the Bebeka and Teppi Coffee Plantations of the Cof-
fee Plantation and Development Enterprise, which were privatized in 2011/12 and 2012/13, respectively. The
Limu Coffee Plantation was the last to be privatized in 2014. Currently, there are no more state coffee plantations
in Ethiopia.
12
Alemu (2009) states that the government received 21 million dollars from exporting the seized stock owned by the six coffee exporters.
8Figure 7—Share of coffee exports by cooperatives and parastatal firms, 2006 to 2013 at six-month intervals
12
10 cooperatives SUMMARY | APRIL 2010
parastatal
8
percent
6
4
2
0
In short, we see a significant number of structural changes in the coffee sector over the last decade. First,
we see a decline in concentration ratios in the export sector over time. Second, seasonality in coffee exports is
pronounced with most exports being shipped between March and June. There also has been a recent shift in the
major peak of exports to a later period in the year. Third, we find variation in the share of cooperatives (increasing
over time) and parastatals (first an increase and then a decrease) in total exports over time. However, their share
in total exports is relatively small. Overall, we note an increase in the number of exporters and increasing diver-
sity of players (e.g. private sector, cooperatives, parastatals) in the export market. However, the shares of incum-
bent firms are large, possibly because of the expertise and reputation required to gain market share in the coffee
export business, as well as problematic access to trade credit for new entrant firms, especially (World Bank,
2014).
5. COFFEE QUALITY
There are several measures of coffee quality in the Ethiopian market place. They include, most importantly, certi-
fication, which affects marketability and prices, but not necessarily the intrinsic quality of the coffee; geographical
indications of origin; grades; and washing. Each is discussed in turn.
Certification and traceability have become major new requirements in the global food trade (Swinnen,
2007), with such certification schemes often implemented to add value to a product (Jena et al., 2012). By guar-
anteeing the product origin, fair prices to producers, ethical standards of production and processing, environmen-
tal sustainability in production, and safety and quality safeguards for a product, international buyers and consum-
ers are often willing to pay extra for a product. Conversely, adhering to those new requirements can be costly. In
the global coffee sector, it is estimated that around 16 percent of current coffee production is certified. This share
should reach over 25 percent by 2015 (Panhuysen and Van Reenen, 2012). There are currently a number of cer-
tification schemes in place, most importantly Fair Trade, Organic Coffee, Bird-Friendly, UTZ, and Global Forest
Alliance. In the case of Ethiopia, the share of certified coffee is increasing, but is significantly lower than in other
countries. For example, data from the Ministry of Trade show that only 2 percent of coffee transactions over the
period 2006-2013 were done under the Fair Trade scheme. This suggests that Ethiopia likely foregoes the com-
mercial rewards of the price premiums associated with these certification schemes. Figure 8a illustrates the size
of the certification premium over the period 2006 to 2013. It is observed that the density function of prices of certi-
fied coffee is distinctively to the right of non-certified coffee.
9Figure 8—Quality premiums for coffee certification and washing, 2006 to 2013
a. Premium certified coffee b. Premium washed coffee
.008
.01
SUMMARY | APRIL 2010
.006
Density
Density
.004
.005
.002
0
0
0 100 200 300 400 500 0 100 200 300 400 500
US cents/lb) US cents/lb)
non-certified certified unwashed washed
Second, the quality of coffee can be increased by washing, i.e. processing red cherries immediately after
harvest in wet mills, instead of sun-drying the cherries (Nure, 2009). Washed coffee preserves the intrinsic quality
of the bean better than unwashed beans, and the process leads to homogenous coffee with fewer defective
beans. The washing process is carried out in washing stations where cherries are pulped immediately after har-
vesting, fermented in tanks, and washed in clean water to remove the mucilage. The wet parchment coffee is
then dried in the sun. For unwashed coffee, cherries are dried on mats or concrete floors. After drying, the outer
layer of the cherries is removed by hulling in coffee processing plants. Figure 8b (the right panel) is a graph of the
price density functions for washed and unwashed coffee over the period 2006 to 2013. The graph reflects the sig-
nificant rightward shift for the distribution of the export prices of washed coffee, illustrating the premium paid for
washed coffee over unwashed coffee. However, this price difference might be linked to other explanatory varia-
bles as well. We explore this below through the use of multivariate regression analysis.
Given the sizable premiums for washed coffee in international markets, investments in a number of coffee
producing countries have focused on setting up more wet mills. Figure 9 shows the share of coffee exports from
Ethiopia that were washed. As shown in the linear trend line, the share of washed coffee in total exports has not
changed significantly over time, remaining close to 30 percent. We see strong seasonality in the exports of
washed coffee. The importance of washed coffee is higher at the beginning of the year, reflecting the fact that
washed coffee is coming earlier to market than the unwashed coffee.
Figure 9—Shares of washed coffee in total exported coffee quantities, monthly, 2006 to 2013
35,000 unwashed 80
washed
30,000 share washed 70
Linear (share washed)
60
25,000
50
percent
20,000
tons
40
15,000
30
10,000
20
5,000 10
0 0
2006 2007 2008 2009 2010 2011 2012 2013
10The Coffee Liquoring Unit (CLU) grades the quality of each exported lot of coffee beans, for both washed
and unwashed coffee, based on physical and cup inspection. Grades range from 1 to 5, where 1 is the best and
highest grade and 5 is the lowest. Ungraded (U.G.) is the worst quality and this coffee is destined to those export
markets where there is less demand for quality or alternatively, this type of coffee quality is not allowed to be ex-
SUMMARY | APRIL 2010
ported and is sold on the local market. Grades 1 and 2 and grades 3, 4, and 5 are assigned to washed and un-
washed coffee, respectively. Overall, we find a slight increase in quality over the study period for both washed
and unwashed coffee. For the unwashed bean market segment, the share of the worse qualities (grade 5) has
been decreasing slightly over time, while the share of grade 4 has been increasing slightly (Figure 10b). In
2006/07, 24 percent of unwashed coffee was grade 4, but this increased to 31 percent in 2012/13. We see little
changes over time in the quality grades for washed coffee (Figure 10a). However, there is a small decline in the
low quality washed U.G.
Figure 10—Evolution of grades within washed and unwashed market segment, 2006 to 2013 at six-month intervals
a. Washed b. Unwashed
100% 100%
90% 90%
Washed U.G. Unwashed U.G.
80% 80%
70% Grade 2 70% Grade 5
60% 60%
Grade 1 Grade 4
50% 50%
40% 40% Grade 3
30% 30%
20% 20%
10% 10%
0% 0%
2006-2
2007-1
2007-2
2008-1
2008-2
2009-1
2009-2
2010-1
2010-2
2011-1
2011-2
2012-1
2012-2
2013-1
2010-1
2011-1
2006-2
2007-1
2007-2
2008-1
2008-2
2009-1
2009-2
2010-2
2011-2
2012-1
2012-2
2013-1
Third, the geographic origin of coffee is an important quality consideration, as it is strongly related to taste.
In our analysis, we distinguish between Sidama, Jimma, Wollega (Nekempt), Yirgacheffe, Limu, Harar, and other
coffees.13 Kufa (2012) associates tastes and regions as follows: spicy for Sidama, fruity for Wollega (Nekempt),
floral for Yirgacheffe, winy for Limu and Jimma, and mocha for Harar. Figure 11a shows the export share in quan-
tity over time of the different origins of coffee. The three major coffee types that are exported are Sidama, Jimma,
and Nekempt. While our data shows significant variation of the shares of different origins over the time period,
there are no systematic trends. The combined share of these three major regions has stayed stable over the
years at around 80 percent. Figure 11b further illustrates that, while the shares of the premium quality coffees of
Harar and Yirgacheffe in total exports is relatively small in quantity, they are higher in value terms given their rela-
tively high prices.
13
It is to be noted that some coffees are put in these categories even though they might be produced in areas that are located outside these geograph-
ical delineations.
11Figure 11—Export share of the different producing regions by quantity and value, 2006 to 2013 at six-month intervals
a. Quantity b. Value
100 100%
90 90%
Other SUMMARY | APRIL 2010
Other
80 80%
70 Harar 70% Harar
60 60%
Limu Limu
50 50%
40 Yirgacheffe 40% Yirgacheffe
30 30%
Nekempt Nekempt
20 20%
10 Jimma 10% Jimma
0 0%
Sidama Sidama
2007-1
2012-2
2006-2
2007-1
2007-2
2008-1
2008-2
2009-1
2009-2
2010-1
2010-2
2011-1
2011-2
2012-1
2012-2
2013-1
2006-2
2007-2
2008-1
2008-2
2009-1
2009-2
2010-1
2010-2
2011-1
2011-2
2012-1
2013-1
To understand the links of different associated variables with measures of coffee quality, we ran a regres-
sion on two main quality indicators, i.e. certification and washed coffee (Table 2). In the left columns, we present
the results of a probit regression where we regress washed (1) versus unwashed (0) on a number of associates.
As expected, we find that washed coffee is exported earlier in the year. The coefficients for the dummy variables
for February, March, and April are positive and significant, while those for the rest of the year are negative. This
indicates that washed coffee is significantly less likely to be exported in the latter period of the year compared to
the default month January. We also find that there are strong linkages of washed coffee with regional dummies.
Compared to the default region Sidama, Yirgacheffe has a significantly higher likelihood to export washed coffee.
On the other hand, Jimma and Wollega (Nekempt) coffee exports are much less likely to be washed. No washed
coffee is exported from the region of Harar and no coefficient estimates are therefore available. We also note that
certification schemes as well as the type of exporters are strongly linked with washed coffee exports. Parastatals,
cooperatives, state farms, and commercial private farms are significantly more likely to export washed coffee than
are private sector traders. Fair Trade coffee is also much more likely to be washed.
12Table 2—Factors associated with the export of washed and certified coffee – probit model
Washed coffee Certification
Unit Coef. z-value* Coef. z-value*
Type of exporter (default=private)
Cooperative yes=1 0.530 8.06 3.452 61.39
SUMMARY | APRIL 2010
Parastatal yes=1 1.042 7.53 0.000 -
State farm yes=1 1.358 9.54 0.000 -
Private commercial farm yes=1 0.389 4.85 1.924 25.34
Region of origin (default=Sidama)
Jimma yes=1 -5.098 -22.23 -0.832 -12.41
Wollega/Lekempte yes=1 -3.126 -26.51 -0.958 -8.35
Yirgacheffe yes=1 1.495 33.15 0.137 2.51
Limu yes=1 0.936 13.36 -0.852 -8.14
Harar yes=1 - - -1.016 -8.44
Other yes=1 -0.572 -8.48 -0.339 -2.43
Certificate
Fair Trade yes=1 0.799 8.06 - -
Organic yes=1 -0.131 -1.91 - -
Year (default=2006)
2007 yes=1 0.210 2.77 0.057 0.38
2008 yes=1 0.188 2.32 0.015 0.09
2009 yes=1 0.174 2.15 -0.372 -2.48
2010 yes=1 0.153 2.11 0.126 0.91
2011 yes=1 -0.123 -1.62 0.060 0.42
2012 yes=1 0.039 0.49 0.243 1.74
2013 yes=1 -0.253 -2.86 -0.067 -0.42
Month (default=January)
February yes=1 0.472 4.46 0.067 0.47
March yes=1 0.436 4.28 0.014 0.09
April yes=1 0.084 0.89 -0.024 -0.18
May yes=1 -0.290 -3.11 0.016 0.12
June yes=1 -0.332 -3.59 0.012 0.09
July yes=1 -0.351 -3.72 -0.190 -1.38
August yes=1 -0.463 -4.80 -0.567 -4.15
September yes=1 -0.435 -4.38 -0.284 -2.01
October yes=1 -0.542 -5.34 -0.170 -1.11
November yes=1 -0.549 -5.07 -0.007 -0.05
December yes=1 -0.413 -2.82 -0.352 -1.75
Intercept 0.395 3.71 -2.513 -14.07
Number of observations 28220 28893
Wald chi2(29) 3455 5716
Prob>Chi2 0 0
Pseudo R2 0.6147 0.7277
* robust standard errors; z-values in bold are significant at the 5 percent level
For the factors associated with certified coffee, Yirgacheffe coffee is more likely to be certified than is
Sidama coffee, the default category of origin. Coffee from other zones of origin is less likely to be certified. We
note higher shares of certified coffee are exported at the beginning of the year, which also suggests that most
certified coffee is washed. Although there is high volatility, the prevalence of certification in general is increasing
over time, as seen by the generally increasing positive coefficients linked with the year dummy variables. Cooper-
atives and private commercial farms are significantly more likely to export certified coffee. This is presumably be-
cause they are not required to transact on the ECX platform, and trading certified coffee on the ECX platform was
not an option over the period considered.
136. COFFEE EXPORT DESTINATION MARKETS
In this section, we look more closely at the export destination markets. Ethiopian coffee was exported on average
to about 50 countries annually over the period 2005 to 2012. Figure 12 shows the share of different destination
markets for coffee exported from Ethiopia in 2012. The largest share of coffee exports went to Germany.
SUMMARY It ac-
| APRIL 2010
counts for one-third of Ethiopia’s coffee exports. The second most important importing country of Ethiopian coffee
is Saudi Arabia, accounting for 12 percent of coffee exports.
Figure 12—Share of different destination markets for Ethiopia’s coffee exports in 2012
AUSTRALIA U.K.
JORDAN 2% 1%
2%
Other
KOREA
9%
2%
SWEDEN GERMANY
3% SUDAN 33%
4% ITALY
5%
FRANCE
6%
U.S.A. S/ARABIA
6% JAPAN BELGIUM 12%
7% 8%
Figure 13 shows how the share of the different destination markets has evolved over the period 2005 to
2012. We note a number of changes. While the share of Japan was almost 20 percent in the year 2005, this de-
clined to considerably lower levels in 2009, as Japan halted deliveries of coffee from Ethiopia in May 2008 after
finding abnormally high pesticide residues in a shipment of coffee beans (Oakes and Thompson, 2009). This
problem has since been addressed and the share of coffee exports to Japan is slowly increasing. We also see
some increase in diversification of destinations. While exports to countries outside Europe, North America, Japan,
and Saudi Arabia made up 5 percent of the export market in 2005, this share was more than 10 percent in 2012.
Moreover, while no coffee was exported to Sudan in 2006, its share rose to 4 percent in 2012.
Figure 13—Share of different destination markets in Ethiopia’s coffee exports
100%
90%
80% Europe
70% Japan
60% North America
50% Saudi Arabia
40%
Sudan
30%
Other
20%
10%
0%
2005 2006 2007 2008 2009 2010 2011 2012
14Figure 14 shows the cumulative price distributions over the period that data were collected for five major
destination markets: North America, Europe, Saudi Arabia, Japan, and Sudan. It shows different price patterns
for these markets. The lowest price is noted for exports to Sudan. These exports also show relatively little price
variation, possibly because Sudan came later into the market and was therefore less exposed to international
SUMMARY | APRIL 2010
price changes. The variation in prices for exports to North America is much wider than for all other countries. The
graph also indicates that North American prices are superior to the other countries as the cumulative price distri-
bution curve for North America lies beneath all other distribution curves. European prices are second to North
American ones, followed by Saudi Arabia and then Japan. This variation in prices between countries and conti-
nents reflects mainly different quality demands.
Figure 14—Cumulative price distribution by destination market, 2005 to 2013
1
.8
.6
.4
.2
0
0 100 200 300 400 500
USC/LB
Europe Japan
NorthAmerica SaudiArabia
Sudan
To analyze to what extent different characteristics of coffee exports are associated with the different desti-
nation markets, we run a multinomial logistic regression with the destination markets as dependent variables (us-
ing Europe as the default market) and quality characteristics as explanatory variables, using a similar model to
Boger (2001). The results are presented in Table 3. Overall, we find strong effects of different quality indicators
on specific destination markets, indicating possible market segmentation.
15Table 3—Multinomial logistic regression model of destination markets for Ethiopian coffee
(default = Europe)
Mean Japan North-America Middle East Africa Other
Unit share Coef. z-value Coef. z-value Coef. z-value Coef. z-value Coef. z-value
Washed coffee (grade 2 = default) 0.37
Grade 1 yes=1 0.01 2.43 10.39 1.57 7.57 -14.91 -0.01 -13.47 0.00 SUMMARY
1.74 | APRIL 2010
7.71
Un-graded yes=1 0.02 -1.20 -4.04 -0.84 -6.49 -1.03 -2.02 2.16 2.84 -1.40 -5.89
Unwashed coffee
Grade 3 yes=1 0.02 1.49 7.96 1.60 12.54 -1.07 -1.05 -14.50 -0.01 1.84 12.84
Grade 4 yes=1 0.18 2.66 37.69 0.81 12.67 1.36 9.61 -1.48 -1.07 1.73 25.02
Grade 5 yes=1 0.36 -0.23 -2.13 -1.46 -12.20 2.75 16.26 -1.75 -1.63 -0.58 -4.66
Un--graded yes=1 0.05 1.18 6.77 -0.47 -2.35 2.99 12.89 5.18 4.87 -0.39 -1.50
Region of origin (default=Sidama)
Jimma yes=1 0.24 0.55 5.57 0.93 7.92 -1.94 -12.55 4.60 4.90 0.82 6.96
Wollega/Lekempte yes=1 0.15 0.76 9.22 -0.32 -2.58 0.97 6.92 1.06 1.00 -0.31 -2.66
Yirgacheffe yes=1 0.12 0.69 7.21 1.41 25.70 -1.04 -3.12 0.74 0.86 1.39 19.75
Limu yes=1 0.05 -0.34 -1.98 0.76 9.92 -0.76 -2.04 0.66 0.58 0.89 9.22
Harar yes=1 0.07 0.02 0.11 1.90 15.96 3.53 24.76 -15.10 -0.01 1.61 13.46
Other yes=1 0.04 0.54 4.75 0.43 4.19 -0.62 -3.16 -15.87 -0.01 -0.32 -2.10
Certificate
Fair Trade yes=1 0.02 -2.19 -3.69 -0.14 -1.27 -0.65 -0.81 -14.04 -0.01 0.08 0.53
Organic yes=1 0.09 0.15 0.97 0.72 8.41 -4.70 -4.59 -15.28 -0.01 0.57 4.73
Type of exporter (default=private) 0.81
Cooperative yes=1 0.10 -0.60 -3.99 0.58 6.93 -0.09 -0.46 1.12 1.48 -0.16 -1.34
Parastatal yes=1 0.03 -1.50 -6.27 -0.76 -5.33 -1.41 -6.88 -19.58 -0.01 -0.36 -2.68
State farm yes=1 0.03 0.06 0.38 -0.63 -4.49 -0.90 -2.11 -18.37 -0.01 -0.10 -0.69
Private commercial farm yes=1 0.03 -0.09 -0.55 1.44 16.80 -0.20 -0.73 -18.36 -0.01 0.09 0.65
Intercept -2.70 -45.09 -1.93 -48.57 -3.67 -35.87 -7.34 -12.74 -2.46 -47.58
Number of observations 30354
LR chi2(106) 27945
Prob > chi2 0
Pseudo R2 0.32
* z-values in bold are significant at the 5 percent level
First, Japan and the Middle East are more likely to import unwashed coffee than are other countries. The
impression of washed coffee being cleaner is strong in the US and Europe. Japan and the Middle East generally
prefer unwashed coffee for a presumed better and richer natural taste (Tefera and Tefera, 2013). These different
preferences for washed and unwashed coffee are illustrated in Figure 15. Second, we see significant differences
in demand for different grades. For example, Sudan is more likely to import ungraded coffee, both washed and
unwashed. Third, different destination markets import coffees from different specific regions. The Middle East is
much more likely to import coffee that originates from Harar and from Wollega (Nekempt). Japan and North
America import relatively more coffee from Yirgacheffe than do European importers. African importers focus
mostly on the lower priced coffees from Wollega and Jimma. Fourth, coffee with Fair Trade certificates are more
likely to be exported to Europe than to other destinations. Organic coffee on the other hand is in greatest demand
by North American markets. These markets also import relatively more coffee from cooperatives than the other
destination markets. Overall, these results suggest that quality differences explain an important part of the signifi-
cant differences in prices between destination markets. This will be further discussed below.
16Figure 15—Share of exports of washed and unwashed coffee by export destination, 2005 to 2013
0% 20% 40% 60% 80% 100%
Other
Africa SUMMARY | APRIL 2010
Middle East
North-America
Japan
Europe
Washed Unwashed
7. PERFORMANCE OF ETHIOPIA’S COFFEE EXPORT SECTOR
7.1. Values and quantities
We start with a discussion of the performance of the coffee sector through an analysis of the changes in quanti-
ties and values of coffee exports. Figure 16 shows how the values, in real USD14, and quantities of coffee exports
have evolved over the last 10 years. To illustrate trends over time, we plot 12-month moving averages for value
and quantity that we equate to 100 percent for January 2003 and then add linear trend lines to these plots. There
are two main findings. First, we see large growth rates in the values and quantities of coffee exported. Figure 16
illustrates that the real value of Ethiopia’s coffee exports at the end of 2012 was four times higher than it was at
the beginning of 2003. The value of exports in nominal terms was five times as high. Quantities exported also
increased by 50 percent over the same period. Even though the growth rate in quantity terms is much smaller
than for real values, this is still an impressive performance. Second, we see a significant drop in the real value
and the quantity of exports from the trend line in 2009, indicating a bad production year as well as disruption to
coffee exports with the revocation of export licenses. However, exports have increased and remained on an up-
ward trend since then.
Figure 16—Trends in real value and quantities of coffee exports from Ethiopia, 2003 to 2012 (Jan. 2003=100; 12-month
moving average)
450
400 value
volume
350
Linear (value)
300 Linear (volume)
250
Index
200
150
100
50
0
14Deflated by the US CPI downloaded from http://www.usinflationcalculator.com/inflation/consumer-price-index-and-annual-percent-changes-from-
1913-to-2008/
17The change in the real value of exports is largely driven by the increasing international prices offered for
Ethiopian coffee. In the next two sections, we explore to what extent international price changes and quality
changes (rewarded in quality premiums) in exported coffee from Ethiopia, have contributed to this change.
SUMMARY | APRIL 2010
7.2. Changes in international coffee prices
Figure 17 compares the export prices, as reported by the Ministry of Trade, and the composite price of Brazilian
natural Arabica coffee, as constructed by the International Coffee Organization (ICO), based on coffee futures
contracts in commodity exchanges in London and New York. The graph illustrates the large variations found in
coffee prices over time. Coffee prices in 2011 were five times higher than prices in 2002, with the price in 2011 at
around 2.5 USD per lb, compared to 0.5 USD per lb in 2002. While the price has come down significantly since
its peak in 2011, prices in mid-2013 had not yet declined to the low level of 2002. This large price variability in
recent years has led both to increasingly unpredictable windfalls and losses in Ethiopia’s export sector. Several
key informants reported that a lack of hedging instruments in local coffee markets, such as futures contracts, was
a source of weakness in the coffee sector in the face of this price variability in Ethiopia. The graph further shows
a strong correlation and synchrony between export and international prices. The reported export prices are
mostly higher than the ICO composite price, reflecting the relatively good quality Arabica coffee produced in Ethi-
opia. However, a drop below the ICO price is seen in 2010 and 2011. The reasons for this are unclear, although
this pattern in the relationship of the two prices has since been reversed.
Figure 17—Trends in Ethiopian export coffee price versus reference international coffee price, 2002 to 2013
300
NY/London price
250
export price
200
US cents per lb
150
100
50
0
In principle, all marketed coffee in Ethiopia has to go through the ECX to determine the quality standard of
the coffee. If the quality of coffee is judged to be of export quality, then it must be exported and cannot be sold
locally. This makes the local market a residual market, where prices are in theory detached from international
prices. Given the government’s need of foreign currency to finance its ambitious development agenda, it may be
the case that this export requirement has become increasingly stringent over time and there has been less coffee
supplied to local markets. This pattern is possibly confirmed in Figure 18 where we compare the retail prices for
coffee in Addis Ababa markets, as collected by the Central Statistical Agency, with export prices for coffee. We
plot monthly differences as well as 12-month moving averages of that difference to more accurately discern the
trend.15 While the retail prices for coffee beans in Addis Ababa was 20 cents lower per pound than export prices
in the years 2002 and 2003, this difference was reversed in 2011 and 2012 when local prices in Addis Ababa
15
Unfortunately, we cannot control for changes in coffee quality over time, but it seems safe to assume that these do not explain these trends.
18You can also read