No Pain, No Gain: The Effects of Exports on Job Injury and Sickness
←
→
Page content transcription
If your browser does not render page correctly, please read the page content below
No Pain, No Gain:
The Effects of Exports on Job Injury and Sickness
David Hummels, Purdue University and NBER
Jakob Munch, University of Copenhagen and IZA
Chong Xiang, Purdue University
February 2015
Abstract: We live in a century of globalization and rising expenditures on health, but little rigorous
research has been done to understand the impacts of globalization on individuals’ health. We combine
Danish data on individuals’ health with Danish matched worker-firm data to understand how increases
in exports by firms affect their employees’ job injuries and sick-leave days during 1995-2006. We find
that an exogenous increase in exports leads to higher work efforts and higher rates of injury and
sickness. The former includes less minor sick-leave days and more total hours (regular plus over-time),
and the latter includes higher rates of job injury, higher incidence of stress and depression for women,
and more genuine sick days per worker per year. In addition, these effects differ for large vs. small
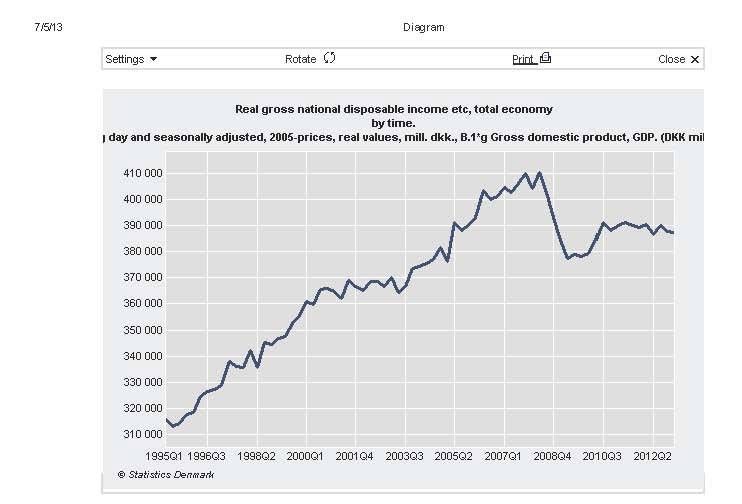
export shocks and also differ for men vs. women. During the 2007-2009 recession, Danish exports and
on-the-job injuries fell significantly. Our estimates could account (out of sample) for 12%- 62% of the
actual decrease in job injury counts in this period. Finally, we develop a framework to calculate the
contemporaneous welfare losses due to higher rates of multiple types of injury and sickness.1. Introduction
A large literature examines how globalization affects wages and pecuniary welfare; e.g.
Feenstra and Hanson (1999), Autor, Dorn and Hanson (2013), and Hummels, Jørgensen, Munch and
Xiang (2014), or HJMX 2014. Another large literature examines how individuals’ health is shaped by
economic conditions; e.g. Marmot et al. (1991), Ruhm (2000), and Sullivan and von Wachter (2009).
In this paper we take a small step to bridge the gap between the two literatures by examining how
globalization, in particular exports, affects workers’ health.
We do so by using Danish administrative data that match the population of Danish workers to
the universe of private-sector Danish firms. For each individual we have rich information about work
intensity (total hours worked, including over-time) and health outcomes, including on-the-job injuries,
number and severity of worker absences due to illness, and utilization of the healthcare system,
including prescription drug use, doctors visits and hospitalization. For each firm, we have detailed
information on production characteristics and international trade (imports, exports) disaggregated by
partner country and product.
Using these data we can match worker health outcomes to characteristics of the firms and
industries in which they work, and to study how exogenous changes in those characteristics affect
worker health outcomes. The richness of the data allows us to describe work intensity and access to
health care in novel ways. For example, because we see both counts and dates, we can distinguish
between workers’ “major” and “minor” sick-leave days. Major-leave sick days correspond to time off
of work in which workers also access the health care system (seeing a doctor or buying prescription
drugs) within a week. Minor sick-leave days correspond to time off work in which workers do not
access the health care system. This may represent actual sickness of sufficiently mild severity that
health professionals are not required or shirking (e.g. claiming additional vacation time in the guise of a
medical event).
1Our hypothesis is as follows. Suppose a firm faces an upward sloping labor supply curve (due
to, e.g. labor market frictions) and a rise in demand for its products. To respond to this demand shock
the firm increases labor quantities, either by hiring more workers or increasing work intensity.
Examples of the latter channel include working additional hours, choosing to work rather than to stay
home in case of mild sickness, and working at a more rapid pace on the job. If an increase in work
intensity leads to increased risk of adverse health outcomes, then we will see a positive relationship
between three variables within the firm: rising exports, rising work intensity, and adverse measures of
employee health. The reverse may occur during recessions: reductions in exports, work intensity, and
adverse health outcomes.
We face a significant identification challenge in taking our hypothesis to the data. Firms may
differ in task composition, technology employed, and the strength of work ethic in ways that are
correlated with output and with health outcomes. For example, better technology may increase sales
and reduce injury risk, but a hard-driving corporate culture may increase sales while increasing injury
risk. Similarly, changes in worker health, especially for smaller firms, may significantly reduce worker
and firm productivity and firm sales. To address this problem, we rely on shocks to demand arising
from exogenous changes in export markets.
The work intensity and health outcome effects of changes in output could in principle be the
same regardless of whether they arise from domestic or foreign shocks. However, the output of the
firms in our data is highly oriented toward export markets and relying on exports to identify the effects
yields several significant benefits. First, within the same industry, otherwise similar firms sell products
to different markets. This allows us to construct instruments (transportation costs and importer demand
shocks) that are specific to a particular partner country x product x year, but whose impact varies across
firms. These instruments generate large exogenous firm-year variation in the exports, providing an
excellent source of identification for changing work intensity and health outcomes. Second, trade-
2related shocks may be more transient than domestic demand shocks (c.f. the literature on short export
durations as in Besedeš and Prusa, 2006). This makes it more likely that firms will respond to a
positive foreign demand shock by increasing work intensity rather than hiring additional workers.
In our base regressions, we condition on job-spell fixed effects so that the source of our
variation is the change over time within a given worker-firm relationship. We find that an exogenous
increase in exports leads to higher rates of job injury, higher incidence of stress and depression for
women, and more genuine sick days per worker per year. These adverse effects on workers’ health are
likely due to increased efforts/work intensity. Following an export shock, workers reduce the numbers
of minor sick-leave days but increase total hours (regular hours plus over-time hours). In addition,
these effects of exports on workers’ health and efforts differ for large vs. small export shocks, and also
differ for men vs. women. These results are novel to the literature.
To provide some context for these estimates we perform two exercises. First, our estimates
from micro data may provide a new channel through which the reduction in work intensity during
economic recessions affects injury. Using our estimates and the actual decrease in exports for
Denmark, we predict the fall in job-injury counts due to the fall in exports during the Great Trade
Collapse for Denmark. We find that declining output due to exports accounts for 12% - 62% of the
actual decrease in job-injury counts in this period. Second, while our injury result captures the “pain”
from globalization, our earlier work, HJMX 2014, shows the “gain” from globalization: wage rises in
response to exogenous increases in exports. Which is more substantial? The literature that estimates the
economic values of better health focuses on reduced mortality and longer life span,1 and so we develop
a framework to calculate the contemporaneous welfare loss due to higher rates of multiple types of
injury and sickness. Using this framework we show that the injury-and-sickness pain from rising
exports is small but substantial, as compared with the wage gain.
1
E.g. Murphy and Topel (2003), Becker, Philipson and Soares (2005), and Egan, Mulligan and Philipson (2013). An
exception is Finkelstein, Luttmer and Notowidigdo (2013), who estimate the effects of chronic diseases on marginal utility
using data on subjective happiness.
3Our work mainly speaks to the following strands of literature. In the trade literature, one line of
work examines the effects on wages and/or employment of offshoring (e.g. Feenstra and Hanson 1999),
exports (e.g. Verhoogen 2008), import competition (e.g. Autor, Dorn and Hanson 2013), offshoring and
exports (e.g. HJMX 2014), and the threat of import competition (e.g. Pierce and Schott 2014). 2 Autor,
Dorn, Hanson and Song (2013) and McManus and Schaur (2014) examine, respectively, how U.S.
imports from China affect the social-security-disability-insurance (SSDI) take-up rates and injury rates.
Another line of work estimates pecuniary welfare gains from trade (e.g. Broda and Weinstein 2006,
Arkolakis, Costinot and Rodriguez-Clare 2012). In the health literature,3 one line of work studies how
economic recessions affect mortality rates (e.g. Ruhm 2000, Coile, Levine and McKnight 2014),4 a
second line of work studies the effects of displacement and plant closures on mortality and
hospitalization (e.g. Sullivan and von Wachter 2009, Browning and Heinesen 2012),5 and a third line of
work estimates the economic values of better health, as we discussed previously. Relative to the trade
literature we explore the non-pecuniary effects of globalization on individual workers’ health. Relative
to the health literature, we explore a unique set of exogenous trade shocks that change the competitive
environment of firms and study the micro channels through which these shocks affect workers’ injury
and sickness. The comprehensive and panel structure of our Danish data allow us to study effects that
occur within job spells, and to avoid a significant problem that confounds identification with previous
work. Since Danish health care is free and universal, changes in income or job status do not affect
workers’ access to health care. We can then attribute changes directly to the work environment itself.
In addition, our work is also related to other studies, such as those using similar dependent
variables. We will bring them up later in the paper. In what follows, section 2 describes our data.
2
For recent surveys see Goldberg and Pavcnik (2007), Harrison, McLaren and McMillan (2011), and Hummels, Munch and
Xiang (2014).
3
For surveys of older work see Currie and Madrian (1999) and Smith (1999).
4
See also Stevens, Miller, Page and Filipski (2011), Lindo (2013), Tekin, McClellan and Minyard (2013), and Ruhm
(2013).
5
See also Black, Devereaux and Salvanes (2012), Browning, Dano and Heinesen (2006), Eliason and Storie (2007, 2009).
4Section 3 provides a theoretical framework to motivate our empirical specifications, and describes how
we construct our instrument variables. Section 4 presents our main results. section 5 draws out their
broader implications for changes in injury counts during recessions. Section 6 calculates the non-
pecuniary welfare effects of exports. Section 7 concludes.
2. Data, Danish Labor Market, and Danish Healthcare System
2.1 Data on Workers, Firms, and Trade, and Danish Labor Market
In previous work (HJMX 2014) we have used Danish6 administrative data that matches workers
to firms and the import and export transactions of those firms. The data cover the period 1995-2006
and match the population of Danish workers to the universe of private-sector Danish firms. Each
firm’s trade transactions are broken down by product and origin and destination countries. The primary
data sources are the Firm Statistics Register, the Integrated Database for Labor Market Research
(“IDA”), the link between firms and workers (“FIDA”), and the Danish Foreign Trade Statistics
Register. This link enables us to study exogenous shocks to each firm’s trading environment and how
those shocks are translated into changes in firm outcomes (output, employment) as well as labor market
outcomes for each worker. We again use this strategy, but augmented to include measures of health
outcomes and work intensity for workers.
We have three ways to measure worker health outcomes. One, individual-transactions data on
doctor visits, prescriptions and hospitalizations. Two, data on individual’s work-related injuries.
Three, episodes in which individuals miss work due to illness. Each has its advantages and
disadvantages. Individual transactions data provide the most comprehensive look at health care
utilization. However, utilization may not indicate an adverse health outcome (as in well-patient visits)
or it may indicate an adverse health outcome that is unrelated to employment. Work-related injuries
6
As we describe in HJMX 2014, Denmark is a good candidate for studying the effect of labor demand shocks on wages
because it has one of the most flexible labor markets in the world (e.g. Botero et al. 2004).
5are clearly adverse health outcomes related to employment, but are relatively rare. The use of sick
leave is much more common, and in many cases represents an adverse health outcome but may or may
not be related to employment, and it is possible that workers may “shirk” by falsely claiming illness.
We will use each of these in different ways to try and understand the effects of export shocks on
worker’s health.
2.2 Data on Individual Transactions within the Danish Healthcare System
For this paper we bring in additional administrative datasets that contain comprehensive
information about individuals’ health care utilization during 1995-2009. We observe the universe of
transactions for every person within the Danish healthcare system, including doctors visits,
prescription drug purchases, and hospitalization.7 These datasets are organized by the same worker
identifiers as the data in sub-section 2.1, allowing us to merge them.
The data on doctors visits includes each individual’s visit dates (by week), type of doctors
visited (e.g. general practitioner, psychiatrist), and total cost of the visit. The data on prescriptions
include each individual’s prescription date, detailed drug classification following the Anatomical
Therapeutic Chemical classification system (ATC), copay (out-of-pocket expenses by patients) and
total prescription drug cost. The data on hospitalization includes dates for first and last day of the
hospitalization period and the diagnosis which follows the International Classification of diseases
(ICD10).
In the literature, a common concern for data on the utilization of medical care is that access to
care could be correlated with individuals’ socio-economic conditions (e.g. income and employment
7
Prescription drugs data are drawn from the “Register of Medicinal Product Statistics” maintained by Statens Serum
Institut (SSI). These data hold all individual transactions at pharmacies. There is information about the transaction price, the
price paid by the consumer, a detailed ATC drug code and the date of the transaction. Data for contacts with the doctor are
drawn from the “Doctoral Visits Register”. In this register every visit to the doctor (including phone calls) is identified by a
visit date and a doctor type (e.g. general practitioner, specialized doctor, dentist, psychologists etc.). We disregard all dental
visits in the data.
6status), and that this correlation could contaminate the care-utilization data (e.g. Currie and Madrian
1999). This concern would be especially serious for care-utilization data for the U.S., since the majority
of healthcare in the U.S. is employer-based. For example, an unemployed worker in the U.S. might
visit doctors less, not because he/she is healthier, but because he/she has lost access to healthcare.
However, this concern is unlikely to be a main issue for us, because the Danish healthcare system is
almost entirely funded by the government, available to all Danish residents regardless of employment
status, and virtually free to all. 8
There are two main exceptions to free healthcare in Denmark. Dental care is not covered and a
small portion of prescription-drug expenses are borne by the patients. We do not consider dental visits
in our data, and the prescription co-pays are small enough (roughly 0.13 percent of median income)
that income constraints on access are unlikely to be binding.9 Given the free and universal nature of
the Danish healthcare system, access to healthcare in Denmark is independent of economic shocks to
individual workers.10 Therefore, our data provides us a unique opportunity to study the effects of
economic shocks on individual workers’ health, because any time a Danish individual interacts with the
Danish healthcare system, we observe this interaction and its detailed information in our data.
The main variables we use in the paper are the following dummies that indicate severe stress
and depression: whether an individual has positive expenses on any anti-depressant prescription drug,
and whether an individual purchases anti-depressants or visits a psychiatrist.11As in many developed
countries, the number of antidepressants prescribed in Denmark has increased markedly over the past
8
There are private hospitals in Denmark which suggests queuing might be an issue for hospitalization. We do not address
quality of care issues in this paper.
9
For all Danish full time workers aged 20-60 during 1995-2009, the median out-of-pocket expense is 404 DKK while the
median labor income is 296,379 DKK (1 DKK is about 0.18 USD in this time period).
10
Even if a worker is unemployed, the unemployment benefits are generous, as discussed in sub-section 2.1.
11
Anti-depressants are defined as ATC code N06A, which includes the subgroups N06AA (Non selective monoamine
reuptake inhibitors), N06AB (Selective serotonin reuptake inhibitors), N06AF (Monoamine oxidase inhibitors, non-
selective), N06AG (Monoamine oxidase type a inhibitors) and N06AX (Other antidepressants). Of these Selective serotonin
reuptake inhibitors account for the bulk of anti-depressant purchases. For example Prozac belongs to this group of anti-
depressants.
7decades. Danish sales of anti-depressants have increased from less than 10 per 1000 inhabitants in 1990
to 84 per 1000 inhabitants in 2010. Anti-depressants are often used as first-line treatment of severe
depression and for treatment of mild to moderate depression that persist after alternative treatments
such as cognitive therapy. Table 1 shows the summary statistics of these variables. In our main sample,
the workers with large manufacturing firms that import and export at some point during 1995-2006,12
2.93% of worker-years have positive expenses on anti-depressant drugs, and 3.24% either purchase
anti-depressants or visit psychiatrists.
2.3 Job-Related Injury
When a worker is injured on the job, they may file a petition for compensation with the
National Board of Industrial Injuries (NBII). If the job injuries are severe enough to cause permanent
damages to the workers’ earning and working abilities, then the workers are also eligible for a one-
time, lump-sum monetary compensation from the Danish government.
We observe all the petitions filed during 1995-2009, and the final decision by NBII for each
petition. Among those filed by Danish workers aged 20-60, NBII rejected 44% of petitions, accepted
28% but paid no compensation, and accepted 22% with compensation. For each petition with positive
compensation, we observe: (1) the percentage damage to the workers’ working and earning abilities
(e.g. 15%), as determined by NBII; (2) the monetary compensation awarded; (3) detailed types of
injury (e.g. “sprain, strain, etc.”, and “toxic eczema”); and (4) the year of the injury and other
information. The main injury variable we use is a dummy that equals 1 if worker i is injured in year t,
and the injury is severe enough to warrant positive monetary compensation.13
12
We focus on these workers and firms in order to construct instruments, which we will explain in sub-section 3.4. In Table
A1 we show the summary statistics for several variables for the “Full” sample, which consists of all Danish workers aged
20-60 during 1995-2009, and the “Mfg.” sample, those with the manufacturing sector. These summary statistics are similar
to our main sample.
13
A medical literature studies the risk factors of job injury using data for individual firms or industries (e.g. Bigos et al.
1991), and a small economic literature studies the “Monday effect”, that the number of injury claims jumps on Mondays in
8One potential concern with our main injury dummy is that the standard used by NBII to award
compensation may endogenously respond to economic fluctuations (e.g. tougher standards during
recessions). This is not the case in our data. During 2007-2009, Denmark’s Great Depression, NBII
accepted around 51% of all petitions, while during the pre-recession years of 2004-2006, NBII
accepted about 48% of all petitions.
The first panel of Table 1 shows the summary statistics of our injury variables. The mean injury
rate is about 4 per thousand in our main sample. 4.1 per thousand for the manufacturing sample. Our
injury rate is lower than in the U.S. data, probably because we only include severe injuries while the
U.S. data includes all injuries. The mean injury compensation across all workers, including those who
do not receive positive compensation is 1542.5 DKK; the mean conditional on receiving positive
compensation, however, is 401,987 DKK in our main sample.14 This is roughly similar to the median
annual labor income (see sub-section 2.2).
Note that in Denmark, workers typically do not exit the labor force after receiving monetary
compensation. In our data, most workers stay employed with the same firm after injury. This is
different from the U.S., where workers typically exit the labor force upon receiving Social Security
Disability Insurance (SSDI).
2.4 Minor and Major Sick-leave Days
Worker sick leaves are recorded in the “Sickness benefit register”, along with the reason for
absence from work (sickness, birth of child, child care leave, child sick etc). We use this register to
count the number of days absent from work due to sickness for each worker-year. The reasons for
absences are self-reported, which suggests the possibility of shirking, or workers calling in sick when
U.S. data (e.g. Campolieti and Hyatt 2006). Finally, the U.S. data on injury rates by industry and occupation are widely used
to estimate the value of a statistical injury (e.g. Viscusi and Aldy 2003).
14
The mean injury rate and injury compensation in our main sample are very similar to the sample of all manufacturing
worker-years, the “Mfg” sample in Table A1.
9they are not. This kind of variables has been used in the literature before as a measure for
shirking/efforts (e.g. Ichino and Maggi 2000, Hesselius et al., 2009). The interpretation is that more
sick-leave days are more days of absence from work, and so more shirking, less efforts.15 Taking full
advantage of our data we are able to go one step further than the literature, to show exactly what the
workers do during their sick-leave spells.
We split the sick-leave variable into two components by cross-checking the exact dates of every
sick-leave spell in the sick-leave Register data against the precise dates of every individual’s
prescription drug purchases and doctor visits. Since our prescription-drug Register and doctor-visit
Register data cover the universe of these transactions in Denmark, when we do not observe any drug
purchase or doctor visit one week before, during or one week after a sick-leave spell, we are confident
that this particular worker never visited a doctor or purchased any prescription drug during his sick
leave. We count the number of such days as minor sick-leave days. We count all the other sick-leave
spells as major sick-leave days.16
Table 1 shows that for our main sample, the average is 6.11 per worker per year for major sick-
leave days, and 0.21 per worker per year for minor sick-leave days. However, the vast majority of the
observations have 0 values for major sick-leave days (over 90%) and minor sick-leave days (over
95%). Among those with positive values, the mean is 38.9 per worker per year for major sick-leave
days in the full sample, and 2.5 per worker per year for minor sick days. Table 1 also shows that
Danish firms are very export oriented, which is useful for our identification strategy. Exports as a share
of firm sales is 0.66 for the average worker in the sample.
15
Other measures for shirking/efforts include survey questions (Freeman, Kruse and Blasi, 2008) and outputs of individual
workers at individual firms (e.g. Lazear 2000, Mas and Moretti 2009). The medical literature also uses the number of sick-
leave days (e.g. Kivimaki et al, 2005), but, again, does not have information about what the workers do during sick-leave
spells.
16
Henrekson and Persson (2004) show that the number of sick-leave days responds to changes in sick-leave benefits in
Sweden. There has been no major policy change regarding sick-leave benefits in Denmark in our sample period.
102.5 Work Hours
We observe over time hours and total hours (over time plus regular hours) for a sub-sample of
our workers from the “Wage Statistics Register”. This register is based on reporting from the firms and
covers in principle workers in all private sector firms with at least 10 employees. One potential concern
is that our work-hour sub-sample may be subject to selection: some occupations (e.g. managers) may
be more subject to the reporting rules than others (e.g. assembly line workers). Table A2 in the
Appendix tabulates the fractions of 1-digit occupations in employment for our main sample and for the
work-hour subsample. The employment shares are similar.
Table 1 shows that the mean number of total hours is 1532.6 per year in our main sample. Of
these, 50.6 hours are over time. In our analysis we focus on the number of total hours, because over-
time hours take the value of 0 for a large fraction of our work-hour sub-sample.
To summarize, our dataset provides several advantages. First, the data cover the population of
Danish workers and firms. Second, we consistently track the actual health utilization of individual
workers over time so we control for unobserved worker heterogeneity. Finally, the large number of
variables in the data provides rich information, and this helps us to pinpoint the specific channels
through which exports affect health, as we explain below.17
3. Framework and Specification
3.1 Conceptual Framework
Figure 1 shows our conceptual framework. Firm j faces an upward sloping labor supply curve
(e.g. Manning 2011). Its demand for labor is derived from the firm’s production function and
(domestic plus foreign) demand for firm j’s output. The intersection of firm j’s labor demand and
17
Two very well-known panel datasets with individuals’ health information are the Framingham heart sample (e.g. Hubert
et al. 1983), and the Whitehall sample (e.g. Bosma et al. 1997, Marmot et al. 1997). These samples are not fully
representative of the population: those in the Framingham heart sample are relatively obese, and those in the Whitehall
sample British civil servants located in London.
11supply curves determine wage and the quantity of labor supplied to firm j. Suppose an exogenous
shock increases firm j’s exports so that j’s demand for labor increases. It follows that wages rise for
firm j (which HJMX 2014 has shown), and that the quantity of labor supplied to the firm also rises
(which we will show below). Labor supplied to the firm can increase either through an increase in the
number of workers, or an increase in work intensity holding the number of workers constant. Examples
of the latter channel include working additional hours, taking fewer minor sick-leave days off, and
working at a more rapid pace on the job.
Medical research has shown that working long and extended hours is associated with a wide
range of negative health outcomes, including higher blood pressure, higher cortisol level (an indicator
for stress), more depression, higher probability of coronary heart disease and death (e.g. Virtanen et al.
2012, O’Reilly and Rosato 2013).18 In addition, prolonged squatting and working with hands are
associated with widespread body pain (e.g. Harkness et al., 2004).19 Following this line of work we
hypothesize that an increase in work intensity increases the likelihood of injury and sickness. It then
follows that a rise in exports should be associated with higher injury and sickness rates. These are our
main hypotheses.
On the other hand, offshoring20 is likely to have ambiguous effects on injury. An exogenous
increase in offshoring may either increase or decrease firm j’s labor demand, depending on the
complementarity between labor and imported inputs, and could also change the task composition
within firm j (e.g. firm j could have offshored more hazardous tasks).21 Therefore, our main focus in
this paper is exports, but we also control for offshoring in our estimation.
18
This point has recently received media coverage, such as the blog “Get a life – or face the consequences”, January 30,
2014, of the Economist magazine (http://www.economist.com/blogs/freeexchange/2014/01/working-hours?fsrc=rss).
19
These studies in the medical literature focus on identifying risk factors and correlation patterns, and do not separate
exogenous changes in work intensity from the tendency of certain individuals to work hard and suffer adverse health
consequences.
20
Given previous work (e.g. Autor, Dorn, Hanson and Song 2013) we do not focus on the effects of import competition.
21
HJMX 2014 show that exogenous increases in offshoring lead to higher (lower) wages for skilled (unskilled) workers,
and lower wages for the workers of more hazardous occupations conditional on skill.
12We face two challenges in taking our hypotheses to the data. First, exports are endogenous.
Productive firms may export more and use better technology, which could reduce injury rates. Second,
individual workers’ work intensity is typically unobservable to researchers. We will follow the
instrument-variable strategy of HJMX 2014 to address the endogeneity of exports, and our data allows
us to observe total hours, including over-time work. We spell out the details below.
3.2 Theory
We first formalize the conceptual framework laid out in sub-section 3.1 and derive our
estimation equations. To ease exposition we will drop subscripts during the initial derivation, but add
them back when we transit to the empirical specifications.
Consider a single Danish firm selling in both domestic and foreign markets, and its total
revenue is ψY. The parameter ψ is a demand shifter, and could potentially capture aggregate
expenditure, elasticity of demand, trade cost to the destination markets, and so on. Y depends on the
quantity of the firm’s output, Q, and the elasticity of demand.22 The firm produces output Q using
capital, K, materials, M, and labor, the quantity of which depends on employment, L, and effort of
individual workers, e. Assume that the firm’s production function is continuously differentiable and
concave (e.g. Cobb-Douglas, CES), and that individual workers’ effort cost is ac(e), where a is a
parameter, and the function c(.) is continuously differentiable and convex.
The firm and its employees engage in multi-lateral bargaining, where each worker receives the
same weight in the bargaining process (Stole and Zwiebel 1996, and Helpman, Itskhoki and Redding
22
E.g. consider the following monopolistic-competition framework. Preferences are CES with substitution elasticity σ > 1.
There is a single foreign market, and the ice-berg trade cost between Denmark and the foreign market is τ > 1. Let “*”
denote the variables for the foreign market. Then it is easy to show that the firm’s total revenue, from both the domestic and
1 1
E
* 1
E
foreign markets, equals ( 1
*1
) Q
, where E is consumer expenditure and P the CES price index (e.g. Helpman,
P P
1 1
E
* 1
E
Itskhoki and Redding 2010). In this example, ψ = ( 1
*1
) and Y = Q
.
P P
132010, or HIR 2010). The solution of this bargaining process has the firm collecting the fraction 1 – β of
the total surplus, while each individual worker collects the fraction β of total surplus per worker. The
parameter β is a constant.23 We assume that the workers’ outside options are 0. The firm’s outside
option equals the fraction 1 – θf of total revenue, ψY.
The total surplus of the bargaining game is then ψY – pMM – rK – (1 – θf)ψY = θf ψY – pMM –
rK, where pM is the price of materials, including domestic materials and imported/offshored inputs, and
r is the price of capital. We assume that the firm takes pM and r as given. The firm’s problem is to
choose L, M and K to maximize its take (1 – β)[ψY – pMM – rK – (1 – θf)ψY] + (1 – θf)ψY – b(L),
where b(L) is search/hiring cost. The optimally chosen employment, L, is the extensive margin for
labor quantity. For the rest of the paper we push the firm’s problem into the background and focus on
the workers’ problem.24
The workers take the firm’s optimal choices of L, M and K as given and
f Y rK pM M
max e { ac( e)} . (1)
L
Let y = Y/L be revenue per worker. Then the first-order condition for (1) is
y
f ac '(e) . (2)
e
Equation (2) determines the optimal effort level, e, which is the intensive margin for labor quantity.
Equation (2) implies that
e f (y / e)
. (3)
2 y
ac ''( e) f 2
e
23
β, in turn, depends on such parameters as the elasticity of demand (e.g. HIR 2010). For our purpose, how β depends on
these other parameters does not matter, as long as β is a constant.
24
The firm takes as given individual workers’ optimal choices of effort level, which we derive below.
14Because y / e > 0 (effort makes a positive contribution to total output), c ''( e) > 0 (effort cost is
2 y e
convex), and < 0 (diminishing returns with respect to effort level), equation (3) says that > 0;
e 2
i.e. as export increases for exogenous reasons, effort level rises. The intuition is simply that the increase
in export raises returns to effort. Therefore,
Proposition 1. Effort level rises as export rises for exogenous reasons.
To make the transition from (2) to an estimation equation we add the following specifications
for effort cost and revenue per worker:
ac( e) ae ,1 . (4)
y e F ( K , M , L),0 1 . (5)
Equation (4) specifies a power function for effort cost. The power, η, exceeds 1 to ensure that effort
cost is a convex function. One special case of specification (4) is the quadratic functional form
1 2
c( e) e . On the other hand, equation (5) says that effort level enters revenue per worker in a
2
multiplicative way and as a power function. The parameter value for the power γ is to ensure that
revenue per worker is increasing and concave in effort level.25
f
Plugging (4) and (5) into equation (2) yields e F ( K , M , L) , or
a
1 1
ln e (ln ln f ln ln ln a ) ln F ( K , M , L) . (6)
We now specify how the variables in (6) change across workers, i, firms, j, and years, t. We
assume that β and γ are constant, since they reflect inherent input-output relationship in firm-level
production and elasticity of demand. The firm’s demand shifter, ψ, and input uses, K, L, and M, all
25 K M L
A special case of (5) is for the production function to be Cobb-Douglas (i.e. Q BK M ( eL ) , K M L 1 ), and
1
for preferences to be CES so that revenue is a power function of output (see note 10, where we show that Y = Q , where σ
> 1 is the substitution elasticity).
15vary by firm by year, while the firm’s outside option, θf, varies across firms but not over time (since we
do not have good measures for θf in the data). For the workers’ variables, effort level, e, varies by
worker by year. We assume that the shape of the effort cost function, η, captures time-invariant worker
characteristics (e.g. gender), while the shifter of the effort cost function, a, captures time-varying
worker characteristics (e.g. union status).26 Adding worker, firm and year subscripts to equation (6) we
get
1 1
ln eit (ln ln f , j ln jt ln ait ln ) ln F ( K jt , M jt , L jt ) . (7)
i i i
ln eit 1
Equation (7) implies that 0 . This simply echoes Proposition 1. In addition, it
ln jt i
suggests the following interaction effect. A given exogenous change in export has larger effects on the
effort levels of the workers whose effort costs, ηi, are smaller. We will estimate both the direct effect of
exports and how it interacts with time-invariant worker characteristics.
In our data, we use exogenous changes in export, Xjt, to measure changes in the demand shifter,
ψjt. Let Ci be time-invariant worker characteristics that may affect the shape of the cost function, ηi.
Equation (7) then implies the following regression
ln eit ij 1 lnX jt 2Ci lnX jt x it b1 z jt b2 x it z jt b3 R IND ,t ijt . (8)
1
In equation (8), 1 lnX jt 2Ci lnX jt represent the way we estimate the term ln jt in
i
equation (7). β1 captures the direct effect of exogenous changes in export on overtime hours, and by
Proposition 1, β1 > 0. β2 captures how the effects of exports interact with time-invariant worker
characteristics, and β2 > 0 if an increase in Ci means a decrease in effort cost by equation (7).
26
Implicitly we have also assumed that the relationship between ηi and ait and individual effort costs cannot be verified with
third parties, so that they do not affect the bargaining game between workers and the firm.
16The motivation for the other variables in equation (8) is as follows. αij is job-spell fixed effects
1 1
and it controls for the terms ln and ln f , j in (7), and also absorbs the portion of
i i
1
ln F ( K jt , M jt , L jt ) that is worker-firm specific. αR and αIND,t represent region and industry-by-
i
year fixed effects. The vector of firm characteristics, zjt, and worker characteristics, xit, control for the
1 1
terms ln ait and ln F ( K jt , M jt , L jt ) .
i i
3.3 Empirical Specifications
Motivated by (8), we first estimate the effects of exports on IOSijt, the injury or sickness status
of worker i employed by firm j in year t. We then estimate how export affects WKijt, measures for how
much or how hard worker i works for firm j in year t. The estimation for IOSijt shows how export
affects individual workers’ health, while that for WKijt helps identify the micro channels of these
effects.
To be specific, for IOSijt we estimate
IOSijt 1 lnX jt 2 Fi lnX jt x it b1 z jt b2 b3 F j ln M jt ij R IND ,t ijt . (9)
Equation (9) comes from (8). Fj is the dummy for female. The vector of time-varying worker
characteristics, xit, includes union status, marital status and experience. The vector of time-varying firm
controls, zjt, includes value of offshoring, Mjt, employment, capital/labor ratio, and the share of skilled
workers in employment. αij, αR, and αIND,j represent job-spell, region and industry-by-time fixed effects.
Relative to (8), we have only included the interaction between the female dummy and offshoring in (9),
and not the other interaction terms between the vectors xit and zjt. The effects of exports on men’s
health are β1, and those for women β1 + β2.
Of the variables we have discussed in section 2, we use the following for IOSijt: (1) the dummy
17for job-related injuries; and (2) the dummies for severe stress or depression. If higher efforts by
individual workers lead to more injury and sickness, by (8) we have β1 > 0, β1 + β2 > 0, or both.
To identify the micro channels through which exports affect injury and sickness, we estimate
WKijt 1 lnX jt 2 Fi lnX jt xit b1 z jt b2 b3 F j ln M jt ij R IND ,t ijt . (10)
The right-hand side variables of equation (10) are the same as in (9), and we think about the dependent
variable of (10), WKijt, as a proxy for the unobservable effort level, eit, of (8). Of the variables we have
discussed in section 2, we use the following for WKijt: (1) the number of minor sick-leave days; and (2)
the number of total work hours. We expect the coefficients of exports for total hours to be positive.
However, the export coefficients for minor sick-leave days should be negative, for the following
reason. When a worker claims sick leave but never visits a doctor or purchases any prescription drug
one week before and one week after his spell of absence, there are two possibilities. One, the worker
could be shirking. Or, his sickness could be so mild that he could have chosen to work. In either case,
we interpret a reduction in the number of minor sick-leave days as evidence for increased effort level.
We also use the number of major sick-leave days as our dependent variable. For this variable
the interpretation of the estimation results is more subtle, because it could measure both sickness and
efforts. Suppose our results suggest that worker i has more major sick-leave days in year t. This clearly
shows that worker i has more sickness in t, because we know that he/she either visited doctors or made
new purchases of prescription drugs during the sick-leave spells. Whether worker i has decreased
efforts, however, is unclear.27 On the other hand, suppose worker i reduces his/her major sick-leave
days. This likely implies more time at work and so more efforts on the part of worker i. But whether
worker i has less sickness is unclear, since he/she may choose to work while sick, which is not
uncommon. A recent survey by the National Foundation for Infectious Diseases shows that in the U.S.,
27
More major sick-leave days likely imply more absence from work, and absenteeism has been used in the literature as a
measure for shirking/efforts (see sub-section 2.4). However, worker i may be too sick to show up to work.
1866% of workers still go to the office while showing flu symptoms.28 We will re-visit these points when
we present our results in section 4. We will also use our results for the other dependent variables to
help interpret the results for major sick-leave days.
In both equations (9) and (10) we control for job-spell fixed effects αij. This allows us to sweep
out individual-level time-invariant factors that could affect health (e.g. Black, Devereux and Salvanes,
2007, Case and Paxson 2008).29 A central concern for our estimating strategy is that exports, Xjt, could
be correlated with the error term, εijt. For example, variation in firm-year productivity is correlated
with exporting (see HJMX 2014 for evidence on this point within our sample). Productivity may also
co-vary with worker health outcomes for two reasons. Firms may be more productive because they use
more modern, and safer, technology that reduces injury rates. This implies a negative correlation
between Xjt and εijt. Alternatively, firms may be more productive in an output-per-worker sense
precisely because they have a corporate culture of high work intensity. This implies a positive
correlation between Xjt and εijt. Therefore, ex ante, it is unclear how Xjt is correlated with εijt. Below we
explain how we deal with the endogeneity of export.
3.4 Instrumental Variables
We follow HJMX 2014 and use external shocks to Denmark’s trading environment to construct
instruments for Xjt. First, world import demand WIDckt is country c’s total purchases of product k from
the world market (less purchases from Denmark) at time t. A rise in WID could result from shocks to
demand (either consumer tastes or industrial uses of particular products) or reflect a loss of
comparative advantage by c in product k.
28
This survey result was recently mentioned in the media (e.g. http://www.newrepublic.com/article/119969/new-york-city-
ebola-case-why-did-dr-craig-spencer-go-bowling).
29
We also control for industry x year fixed effects, which sweep out the effects of import competition at the industry level.
19In addition, changes in transport costs capture shocks to the delivered price of particular inputs
purchased by Denmark. To get transportation costs we first estimate cost functions using US imports
data following Hummels (2007). We then use the estimated coefficients plus pre-sample information
on the destination, bulk, and modal use for Danish imports to construct c-k-t varying cost measures,
tcckt . The key source of variation is an interaction between distance, modal use, and oil prices. In our
sample period real oil prices fell from $20 to $11 per barrel between 1995 and 1998, and then rose
sharply to $45 per barrel in 2005. These fuel prices have an especially strong effect on goods air
shipped long distances and a very weak effect on goods moved short distances via train. This implies
that changes over time in fuel prices affect the level of costs, the relative cost of employing air v. ocean
v. land transport and the relative cost of distant versus proximate partners.
The instruments have country-product-time variation. To get a single value for each firm-year
we aggregate as follows. Let I ckt represent instrument I (tc,WID) for importing country c, selling HS
6 product k, at time t, and let s jck represent the share of c-k in total exports for firm j in the pre-sample
year (1994).30 Then to construct a time varying instrument for firm j we have I jt s jck I ckt .
c ,k
The idea behind this strategy is the following. For some reason firm j exports a particular
product k to country c. Firm j may have a long standing business relationship with a firm in c, or the
products that c makes might be a particularly good fit for the firms in j. This relationship is set in the
pre-sample and is fairly consistent over time (see HJMX 2014). Over time there are shocks to the
desirability of exporting product k to country c. Transportation costs become more favourable or
country c experiences changes in its production costs or consumer demand that are exogenous to firm j,
and these are reflected in changing imports from the world as a whole by country c. Because firm j
exports product k to country c more than other firms it disproportionately benefits from these changes.
30Some firms enter or begin exporting within sample. For these firms we use export patterns in their first years of
exports to construct pre‐sample weights and employ data from year 2 and onwards for the regression analyses.
20HJMX 2014 show that firms have very few export-product-by-destination-country in common and that
in most cases, firm j is the only firm that exports product k to country c.
Our strategy for instrumenting offshoring is similar. Rather than WID, we use World export
supply, or WESckt , country c’s total supply of product k to the world market, minus its supply to
Denmark, in period t. WES captures changes in comparative advantage for the exporting country,
arising from changes in production price, product quality, or variety. For transport costs we focus on
those for Danish imports, and we use the firm’s pre-sample shares of imports from c-k.
To summarize, we instrument for offshoring (exporting) using the weighted averages of world
export supply (world import demand), and transport costs. The weights are pre-sample import (export)
shares, and these differ significantly across firms. The use of these instruments implies that we focus on
large manufacturing firms that both import and export, as in HJMX 2014. Table 1 shows the summary
statistics of the following worker characteristics: log hourly wage, experience, marital status and union
status. These values are similar for our main sample as compared with the samples of the Danish labor
force (“Full”), or the Danish labor force in manufacturing (“Mfg”).
4. Results
We organize the results of regressions (9) and (10) by the dependent variables. Our estimation
sample spans 1995-2006 and includes nearly 2 million observations, each being worker-i by firm-j by
year-t. We include job-spell fixed effects in the estimation; i.e. we ask, during worker i is employed by
firm j, if j changes how much it exports for exogenous reasons, does worker i become more likely to be
injured on the job? Since our main explanatory variable, export, varies by firm-year, we cluster
standard errors by firm-year.
4.1 Physical Health: Injury
21Table 2 reports how export affects individual workers’ likelihood of getting injured on the job.
The dependent variable equals 1 if worker i, employed by firm j, gets injured in year t, and 0 otherwise.
In Column 1 of Table 2, labeled “FE” (for job-spell fixed effects), we report the OLS estimate for
regression (1). The coefficient for export is 0.4 per thousand (precisely estimated). However, as we
discussed in sub-section 3.2, this estimate may be biased downward due to the endogeneity of exports.
We then construct instruments for export (and offshoring) as described in sub-section 3.3. Following
Wooldridge (2002), we instrument the interactions of export and offshoring with the female dummy
using the interactions of the export-instruments and offshoring-instruments with the female dummy,
and include the full set of instruments in the first stage of each of the four endogenous variables
(exports, offshoring, and their interactions). Table A2 in the Appendix reports the first stage results.
They are similar to HJMX 2014.
We report the IV estimates in column 2 of Table 2, labeled “FE-IV”. The export coefficient is
marginally significant at the 10% level, and suggests that if export doubles for exogenous reasons, the
workers’ likelihood of injury rises by 2.0 per thousand within job spells. The IV estimate is four times
as large as the OLS estimate, consistent with our earlier discussions (sub-section 3.2) that productive
firms may export more and use good technology that reduces injury rate. The IV estimate is also
economically significant, since the mean injury rate is 4.1 per thousand in our estimation sample.
One reason for the marginal significance of the export coefficient can be non-linearity: large
export shocks could have different effects than small ones. To investigate this we calculate, within each
job spell, the deviation of log exports (by firm by year) from the mean within the job spell. We then use
the quartiles of the distribution of the mean-deviations in our sample to construct four export quartile
dummies: the 1st quartile dummy is for all the observations where the mean-deviations of log exports
22fall into the first quartile, and so on.31 Interacting the export quartile dummies with the two gender
dummies, we get 8 dummies with 6 degrees of freedom.32 We leave out the first quartile dummies and
estimate the effects of 2nd – 4th quartile export shocks on injury rate, and how these effects vary across
gender.
Column 3 of Table 2 reports the OLS estimates for the discrete export shocks. The effects of
exports are the most pronounced when export shocks are large, in the 4th quartile (relative to 1st-quartile
export shocks). In response to these export shocks, injury rate rises by 0.4 per thousand for women and
0.6 per thousand for men (these coefficient estimates are not statistically different). Column 4 reports
the IV estimates, and they are again larger than OLS. For our 6 disrete-export-shock variables, 5 are
statistically significant under IV. The effects of exports on injury rate are similar for 2nd-quartile export
shocks and 3rd-quartile export shocks, and this non-linearity may explain why our estimate is
marginally significant when our export variable is continuous. The estimates for the 4th quartile export
variables, however, are significantly larger than for the 2nd and 3rd quartiles. Finally, our IV estimates
for men are similar to women. For example, export shocks in the 3rd quartile increase men’s injury rate
by 0.5 per thousand and women’s by 0.6 per thousand. Export shocks in the 4th quartile raise both men
and women’s injury rate by 1.1 per thousand.
4.2 Numbers of Sick-Leave Days
We have hypothesized that exports increase workers’ injury rates because they increase
workers’ efforts. One way to observe changes in workers’ efforts in our data is to look at the changes in
the number of minor sick-leave days. Since these are sick-leave spells during which the workers neither
visit doctors nor make new purchases of prescription drugs, a reduction in their number likely reflects
31
The cut-off points for the quartiles for observed exporting are -0.117, 0.005 and 0.134, and for predicted exporting they
are -0.088, 0.004 and 0.101. For predicted exporting in the total hours sub-sample they are -0.071, 0.000 and 0.065.
32
The four export quartile dummies sum up to the constant and so do the two gender dummies.
23increased efforts (e.g. reducing shirking, or choosing to work rather than staying home in case of mild
sickness/discomfort). As a result, according to our hypothesis, the number of minor sick-leave days
should decrease in response to exports.
Table 3 reports our results. In columns 1 and 2 our export variable is continuous and we do not
find significant results. In columns 3 and 4 our export variables are discrete, and we obtain precisely
estimated coefficients. Under both OLS (column 3) and IV (column 4), men reduce their minor sick-
leave days in the presence of 2nd-quartile export shocks (relative to 1st-quartile export shocks). The
magnitude of this reduction, 0.016 – 0.018 days per worker per year, is sizable given the sample mean
of 0.21 days. In the presence of 3rd-quartile export shocks, men reduce their minor sick-leave days even
more, by 0.031 – 0.048 days, or 14.6% - 22.9% of the sample mean. When export shocks are in the 4th
quartile, however, our estimates are statistically insignificant, and this non-linearity could help explain
why our estimates are insignificant when our export variable is continuous. On the other hand, women
also reduce minor sick-leave days (e.g. the coefficient estimate for the 3rd-quartile export shock is
significant under IV). The magnitudes of women’s responses tend to be smaller than men’s. This could
be because in our sample, women have less minor sick-leave days than men, 0.175 vs. 0.225.
We now turn to the number of major sick-leave days. As we discussed earlier (e.g. sub-section
3.3), this variable could either increase (e.g. workers become less healthy due to increased efforts) or
decrease (more working-while-sick) when exports increase. In addition, while more major sick-leave
days clearly indicate worse health, less major sick-leave days do not necessarily imply better health, as
workers might choose to work while sick.
Table 4 reports our estimation results. When our export variables are continuous (columns 1
and 2), the IV and OLS estimates have opposite signs, making them hard to interpret. When our export
variables are discrete (columns 3 and 4), however, the OLS and IV estimates are similar. In the
presence of 2nd and 3rd quartile export shocks, men cut back on their number of major sick-leave days
24by 0.43 – 1.05 days per person per year (all the coefficient estimates for men are statistically
significant). These are sizable effects, given that the number of major sick-leave days has the sample
mean of 6.11. The evidence for women is also strong, showing that they reduce their major sick-leave
days by 1.24 – 2.42 per person per year (3 out of 4 coefficient estimates for women are statistically
significant). The magnitudes of women’s responses tend to be similar to men’s. These results
corroborate our findings for the number of minor sick-leave days in Table 3, and provide further
empirical evidence that workers increase efforts when exports rise exogenously (e.g. more working-
while-sick).
On the other hand, when export shocks fall in the 4th quartile, our estimates show that men have
more major sick-leave days (under IV), and women have even more than men (both OLS and IV).
Again, this non-linearity may help explain why our OLS and IV estimates differ when our export
variables are continuous. There are two possible interpretations for the 4th-quartile results. First,
workers actually reduce efforts, contrary to our hypothesis. Second, rises in exports have such large
effects on workers’ health that they are too sick to work more, consistent with our hypothesis. While
the 1st interpretation seems unlikely, given our results for the 2nd and 3rd quartile export shocks, we
want to explore further by drawing out contrasting implications and then taking these to our data.
The 1st interpretation implies that in the presence of 4th-quartile export shocks, workers should
reduce total work hours, and that they do not suffer any other adverse health consequences. The 2nd
interpretation implies that 4th-quartile export shocks lead to additional adverse health outcome, and that
workers do not reduce total hours, even though they have more major sick-leave days. Our findings so
far are already lined up against the 1st interpretation: more major sick-leave days are, in itself, an
adverse health outcome, and workers suffer higher injury rates (Table 2). We bring in additional
evidence against this interpretation below.
25You can also read