Myopia and Complex Dynamic Incentives: Evidence
←
→
Page content transcription
If your browser does not render page correctly, please read the page content below
Myopia and Complex Dynamic Incentives: Evidence
                 from Medicare Part D
                                ∗
    Christina M. Dalton                Gautam Gowrisankaran†                  Robert Town          ‡

                                        March 30, 2015

                                             Abstract
         Standard Medicare Part D drug insurance provides no coverage in a “donut hole”
     region, making the purchase problem dynamic. We develop a discontinuity based test
     for myopia using enrollees who arrived near the coverage gap early in the year. We find
     that there are fewer and cheaper purchases immediately after reaching the gap, pro-
     viding evidence in favor of myopia. We structurally estimate a dynamic drug purchase
     model and find complete myopia. For a nationally representative sample, “behavioral
     hazard” increases enrollee spending by 44%. Entirely eliminating the gap would in-
     crease insurer spending 31%, with a 6% increase for generic gap coverage.

     Keywords: Medicare Part D, cost sharing, donut hole, regression discontinuity

     We have received helpful comments from Jason Abaluck, David Bradford, Juan Esteban Car-
     ranza, Pierre Dubois, Liran Einav, Dave Frisvold, Guido Lorenzoni, Carlos Noton, Matthew
     Perri, Asaf Plan, Mary Schroeder, Marciano Siniscalchi, Ashley Swanson, William Vogt, Glen
     Weyl, and seminar participants at numerous institutions. We are especially indebted to Doug
     Mager at Express Scripts for data provision. Nora Becker and Mike Kofoed provided excellent
     research assistance. Gowrisankaran acknowledge research support from the Center for Manage-
     ment Innovations in Health Care at the University of Arizona.

∗
  University of Georgia
†
  University of Arizona, HEC Montreal and NBER
‡
  University of Pennsylvania and NBER
1 Introduction
The introduction of Medicare Part D in 2006 was the most important benefit change to
Medicare since its inception. Part D added drug coverage to Medicare’s hospital and physi-
cian/outpatient benefits. Evidence indicates that Part D lowered Medicare beneficiaries’
out-of-pocket costs while increasing prescription drug consumption (Yin et al., 2008; Zhang
et al., 2009; Lichtenberg and Sun, 2007; Ketcham and Simon, 2008). As a consequence, the
program is popular, enrolling over 35 million Medicare beneficiaries in Medicare sponsored
plans and an additional 3.5 million in employer provided, Medicare subsidized plans in 2013
(Medpac, 2014).
Medicare Part D nonetheless has its critics. Perhaps the biggest criticism is concern
over Part D’s “donut hole” benefit structure. Enrollees in plans with a standard benefit
structure face a nonlinear price schedule where out-of-pocket expenditures are modest until
their accrued total year-to-date expenditures place them in the coverage gap – the so-called
donut hole. Once in the coverage gap, the enrollee pays the full price of all drugs until she
spends through the gap into the “catastrophic zone.” In 2008, the year of our data, the donut
hole cannot begin before $2,510 in total expenditures or end after $4,050 in out-of-pocket
expenditures1 and approximately one-third of Part D enrollees entered the coverage gap.2
Importantly, the coverage gap creates a complex dynamic decision problem for enrollees.
To optimally decide on a drug purchase, an enrollee must forecast her future expenditures over
the remaining portion of the year. While a donut hole is relatively unusual, most health insur-
ance plans have dynamic aspects, in the form of out-of-pocket maximums and deductibles.
These dynamic aspects create a complex decision problem where optimal decision-making
depends on rationally forecasting future healthcare consumption, a point that has been rec-
ognized since at least the RAND Health Insurance Experiment.3
Critics of Part D point to the possibility that enrollees may reduce drug consumption upon
1
Some plans offer partial coverage in the donut hole, though few offer complete coverage (Neuman and
Cubanski, 2009).
2
Source: http://www.medpac.gov/documents/reports/mar11 ch13.pdf?sfvrsn=0.
3
The Rand Health Insurance Experiment found that utilization increased once enrollees hit their out-of-
pocket maxima (Newhouse, 1993). The study did not disentangle the reasons for this increase.
1entering the donut hole, with adverse consequences for health (Liu et al., 2011). Concern
regarding the coverage gap has also led to legislation that will phase out the donut hole
over time, enacted as part of the 2010 Affordable Care Act. However, economic models of
forward-looking rational consumers predict that the donut hole, per se, should have little real
effect on behavior, as what matters most is the expected end-of-year price.
Given this dichotomy, a relevant concern is whether the rational model accurately reflects
Part D enrollee behavior. Are the mostly senior-citizen enrollees accurately making the
tradeoffs required to dynamically optimize their choice of prescription drugs? This concern
is underscored by the fact that a number of studies have found that Part D enrollees act
myopically, or at least not fully rationally, when faced with the plan choice part of the Part
D decision (see Abaluck and Gruber, 2011, 2013; Abaluck et al., 2015; Ho et al., 2014; Heiss
et al., 2010; Schroeder et al., 2014). In contrast, other studies find that Medicare Part D
enrollees are at least partly rational in their choices of plans or drug purchases (see Ketcham
et al., 2012; Einav et al., 2015; Ketcham et al., 2014).
Dynamic health insurance contracts can lead to “behavioral hazard” (Baicker et al., 2012),
where non-rational consumers make suboptimal decisions. A donut hole structure is partic-
ularly problematic in the presence of myopia, because it causes individuals to over-consume
before the coverage gap, compounding the moral hazard from health insurance, which also
causes overconsumption before the gap. In contrast, with myopia, deductibles may counter-
balance the effects of moral hazard.
This paper has two goals. First, we develop robust tests for whether Part D enrollees act
myopically in their choice of drug treatments. Our tests avoid several selection issues that
often makes such inference challenging. Second, we quantify the relative extents of moral
and behavioral hazards and empirically evaluate how these hazards affect the outcomes and
welfare of policies such as eliminating the coverage gap. We proceed by specifying a dynamic
model of drug choice which allows for non-rational, time inconsistent behavior. Using the
model, we first provide evidence – using a regression discontinuity – that people do not act
rationally in their drug purchase decision. We then structurally estimate the parameters of
the model and examine the implications of counterfactual policies regarding the coverage
2gap. We believe that both our tests of myopia and our estimation framework may be more
broadly useful in analyzing the implications of different insurance schemes.
Our model and estimation strategy focus on enrollees’ spending behavior as they transi-
tion from the initial coverage region (before $2,510 in spending) to the coverage gap region
(starting at $2,510). In our model, each week, each Part D enrollee has a distribution of
possible health shocks. Each health shock is characterized by a class of drugs that can be
used to treat the shock. Given a health shock, the individual makes a multinomial logit
choice from among the class of drugs and an outside option of not filling a prescription.
Each drug has three characteristics: the (full) price, the out-of-pocket price, and the mean
utility from consumption, which we model with fixed effects. The outside option has utility
normalized to 0. The model is dynamic because purchasing a drug in the initial coverage
region moves an enrollee closer to the coverage gap. We allow for non-rationality in the
form of quasi-hyperbolic discounting (Laibson, 1997; Phelps and Pollak, 1968; Strotz, 1956):
individuals discount their future health shocks in the current week with the factor β, in one
week with the factor βδ, in two weeks with the factor βδ 2 , etc. An individual with β < 1 is
partly myopic regarding future actions: she would make different tradeoffs at time t between
utility at times t + 1 and t + 2 than she would make upon reaching time t + 1. An individual
with either β or δ of 0 does not value any utility in future periods and hence is completely
myopic.
We empirically test for myopia using 2008 Medicare Part D administrative claims data
from a large pharmacy benefit manager. Our empirical strategy is to identify a set of enrollees
who face the same end-of-year prices but different current prices, and examine if they respond
to the current prices. We identify such a group: enrollees who arrive near the donut hole
early in the year. We postulate (and empirically verify) that these individuals will almost
certainly reach the donut hole before the end of the year. Without any discounting, these
individuals should not change their drug purchase behavior upon crossing into the donut
hole, because the Part D insurance is essentially just a fixed subsidy. Rational geometric
discounters (with 0 < δ < 1 but β = 1) will consume less inside the donut hole than before
only because of the time value of money saved. This implies a near-linear progression of
3increases in purchases before the donut hole. Finally, myopic individuals – whom we define
to be those with either β < 1 or δ = 0 – may have more drug purchases before the donut
hole than in the donut hole, but their purchases can be flat in the periods before the donut
hole.
Using the group of enrollees who arrive near the donut hole early in the year, we find that
drug purchases drop significantly and sharply upon reaching the donut hole: mean total drug
expenditures falls by 28%; the number of prescriptions falls by 21%; expensive prescriptions
with a price of over $150 fall by 33%; and branded prescriptions fall by 27%. In contrast,
there is no evidence of expenditures falling in the periods leading up to the donut hole, with
no significant differences between spending in the regions $2,200 to $2,399 and $2,000 to
$2,199. A falsification exercise on enrollees in a plan with a different donut hole reveals no
drop in spending upon reaching $2,510. Thus, our discontinuity-based evidence points to
myopic rather than rational individuals.
Having found evidence of myopia, we structurally estimate our dynamic model using the
same group of enrollees. The parameters of the structural model are fixed effects for each
drug, price elasticity parameters, and the discounting parameters β and δ. We estimate these
parameters via maximum likelihood. An estimation challenge is that we do not observe when
people have health shocks but consume the outside good, and yet substitution to the outside
good in the donut hole is a crucial feature of the data. We develop methods that allow us
to integrate over the number of shocks and time periods of the shocks where the individual
chooses a drug in closed form, thereby making this estimator computationally tractable.4
As with the discontinuity-based evidence, conditional on price elasticity parameters, the
discounting parameters β and δ are identified by the difference in purchase patterns between
the initial coverage region and coverage gap regions. Our price elasticity parameters are
identified by the fact that we have across-drug and across-drug-class variation in prices upon
entry into the donut hole. For instance, some drugs will have many substitutes and we
observe variation in the availability of substitutes for drugs within their drug class and in the
4
The unobserved nature of the health shocks also prevents us from using the computationally advantageous
conditional choice probability estimators initially developed by Hotz and Miller (1993).
4coverage-gap prices relative to the initial coverage region prices, and in substitution based
on these attributes.
Our structural estimation splits our sample into subsamples based on their ex-ante health
risk score. For each of three subsamples, we find that β = 0. We find a substantial price
response that is lower for more expensive drugs. At β = 0, δ is not identified. For the smaller
subsamples, we cannot reject a low β and high δ. However, we can always reject β = 1
with low values of δ. The underlying reason for our results is that the drop in prescriptions
upon reaching the donut hole is too large to be explained with a positive β, given the level of
cross-drug substitution, which identifies the price elasticity. We do not interpret our estimates
as implying that individuals are extremely impatient and not forward-looking. Rather, we
believe that our estimates imply that Medicare Part D enrollees are not making dynamically
sophisticated decisions in their choices of drugs and hence that their behavior is much more
myopic than rational models would typically imply.
Using our structural estimates, we examine counterfactuals as to preferences and policies.
To increase external validity, we use a linear combination of enrollees in our estimation sample
and other enrollees in the same plans, chosen so that the fraction hitting the coverage gap
during the year is 33%, the same as the mean fraction who hit the coverage gap in 2008.
To examine the extent of behavioral hazard, we examine how prescription purchase behavior
would change if individuals were geometric discounters with δ = 0.95 at an annual level.
We find that geometric discounting would cause enrollees to reduce spending by 31%. Much
of this reduction in spending would help them avoid the coverage gap implying that, while
insurers would spend less, the drop in insurer spending from geometric discounting would
be only 4%, with total prescription drug spending dropping by 15%. In contrast, without
moral hazard from insurance, total prescription drug spending would drop 22%, implying
that behavioral hazard is almost as important as moral hazard in this market.
Our policy counterfactuals regard eliminating the donut hole as mandated by the Afford-
able Care Act. We find that eliminating the donut hole would increase total spending by
10% and insurer spending by 31%, implying a substantial cost to the government. Coinsur-
ance would have to increase from an average of 25% to 42% to implement a revenue neutral
5insurance scheme without the donut hole. Providing donut hole coverage for generic drugs
only would increase insurer spending by 6% relative to the baseline and actually decrease
total spending very slightly as consumers would substitute to generics.
Our work is most closely related to the works of Einav et al. (2015) and Abaluck et al.
(2015). Our theoretical model builds on Einav et al., who test for the presence of dynamic
behavior by considering individuals faced with the same current prices but different end-of-
year prices. Our tests are complementary, as we test for the presence of myopic behavior by
considering individuals faced with different current prices but the same end-of-year prices.
Einav et al. also estimates a structural, dynamic model and finds that the weekly discount
factor is δ = 0.96, implying an annualized discount factor of δ = 0.12. Our test also allows us
to distinguish myopia from a low discount factor. Our structural estimation builds on Einav
et al. by developing a modeling framework for drug choices that is more similar to standard
dynamic multinomial choice models and by identifying our parameters using actual price data
and the same sample of enrollees on whom our tests for myopia are based. Abaluck et al.
(2015) use a very different identification strategy of relying on plan stickiness of enrollees
following changes in underlying benefit structures. Similar to our findings, their estimates
indicate substantial myopia. Finally, our structural model of quasi-hyperbolic discounting
builds on Fang and Wang (2013) and Chung et al. (2013).
The paper proceeds as follows. Section 2 provides our model. Section 3 describes our data.
Section 4 presents evidence based on the discontinuity near the donut hole. Section 5 describes
the econometrics of estimating our model. Section 6 provides results and counterfactuals,
and Section 7 concludes.
2 Model
2.1 Overview
We model the decisions of a Medicare Part D enrollee who has reached $2,000 in spending
between the end of March and the end of July of a given year, and hence who has arrived near
6the donut hole of $2,510. By focusing on this group, we can credibly assume that individuals
in our sample know that they will hit the donut hole at some point during the year, which
simplifies our tests and estimation.5 We also assume that people will not leave the donut
hole during the year. This assumption also generally holds in our data,6 but, as we discuss
in Section 2.3, the existence of the catastrophic coverage region will only tend to weaken our
empirical findings.
We consider the decision-making of an individual enrollee,7 starting at the first complete
week where the individual has reached the $2,000 spending level.8 At the start of the week,
the individual is faced with a distribution of health shocks, each of which might benefit from
drug treatment. The number of health shocks is distributed multinomial, with a minimum of
0 and a maximum of N . Each health shock is i.i.d. At any point in time during the week, the
individual knows how far she is from the donut hole as well as how many health shocks she
has already had in the current week, but does not know her future health shock realizations
for the week (or future weeks). The individual can calculate the distribution of future health
shock realizations during the week based on the number that have already occurred. Let
Qn , n = 0, . . . N denote the conditional probability of having another health shock given that
n have already occurred this week. Note that QN = 0.
We now consider an individual who is faced with a health shock. Health shocks can
take on different values, h = 1, . . . , H, each corresponding to a particular drug class (e.g.,
calcium channel blockers). Health shock h occurs with probability Ph . For each health shock
h = 1, . . . , H, there are a set of possible prescription drugs that can be used to treat the
condition j = 1, . . . , Jh , plus the outside option j = 0 which consists of no drug treatment.
The flow utility from any drug treatment j for health shock h is a function of the perceived
fixed utility from treatment, γhj , which is a parameter to estimate; the total price of the drug,
phj ; the out-of-pocket price oophj ; and an unobservable component εhj , which we assume is
distributed type 1 extreme value, i.i.d. across health shock occurrences and individuals. We
5
In reality, 96% of the individuals in this group reach the donut hole during the year.
6
Only 10% of individuals in this group end up in the catastrophic coverage region at the end of the year.
7
Section 5.1 we will discuss estimation of the model which involves aggregation across individuals.
8
We define a week starting on Sunday and ending on Saturday.
7assume that current, but not future values of εhj are known to the individual when making
her choice decision. For individuals not in the donut hole after the cost of the current drug,
the flow utility is γhj − α(oophj ) + εhj , while for individuals in the donut hole before the cost
of the current drug, the flow utility is γhj − α(phj ) + εhj , where α(·) is the function that maps
from price to utility.
In order to flexibly capture the different impact of price on decisions, we allow α(p) to be
a linear spline, with cut points at c1 ≡ $20, c2 = $50, and c3 = $100. We let α ≡ (α1 , . . . , α4 )
denote the four parameters of the spline. E.g., if c1 < p < c2 , then α(p) = α1 c1 + α2 (p − c1 ).
Note that the linear spline nests the simple linear case, which has α1 = α2 = α3 = α4 .
The outside option costs nothing (so ooph0 = ph0 = 0) and has γh0 = 0 so that its flow
utility is εh0 . It is important to model this option because individuals in or near the donut
hole may substitute away from drug purchases.
2.2 Dynamics and Hyperbolic Discounting
The enrollee’s decision problem is dynamic because filling a prescription brings the enrollee
closer to the donut hole state of no insurance, and filling a more expensive prescription
brings the individual relatively closer than filling a cheaper prescription. We develop a
dynamic quasi-hyperbolic discounting model of individual decision-making over the choice
of drug purchases. While there are potentially several different models of time-inconsistency
we could specify, we focus on the hyperbolic model as it is the most common model of
time inconsistency in the literature, it is parsimonious, it lends itself to straightforward
counterfactuals and welfare analysis, and its parameters are identified in our empirical setting.
At any week t, an individual discounts the utility from treatments of a future health shock
in the current week with the factor β and the utility of a health shock at week t + 1 with
the factor βδ. More generally, she discounts health shocks at the week t̂ > t with the factor
βδ t̂−t . A value of β = 1 would fit into the standard geometric discounting model. With either
β or δ substantially less than 1, we would expect the individuals to fill fewer prescriptions
and cheaper ones as they approach the donut hole.
8In our model, an agent at each time period solves for optimal decisions knowing that her
future self will value different time periods differently than in the present. Thus, for example,
the agent knows that she values a dollar at time t + 1 equivalently to 1/δ dollars at time t + 2,
but that, upon reaching time t + 1, her future self will value a time t + 1 dollar equivalently
to a smaller value of 1/βδ at time t + 2. The agent would like to tie her future self to not
spend too much, but cannot do that in our model. The agent thus essentially plays a game
with future versions of herself, optimizing at each point in time taking as given the actions of
her future selves, and with the knowledge that her future selves are choosing actions that are
different than she would currently like them to do. In the hyperbolic discounting literature,
this payoff structure is referred to as “sophisticates” (Baicker et al., 2012), as individuals
accurately perceive that they are hyperbolic discounters.9
Following Fang and Wang (2013), we formalize the behavior of sophisticates using Bellman
equations. We first exposit the state space and use it to define the Bellman equation and
choice decision problem under quasi-hyperbolic discounting. Let m indicate the monetary
distance of the individual from the donut hole at the start of a given purchase decision. Since
the donut hole occurs at $2,510, if the individual has already spent $2,350 then m = 160.
Let n denote the number of health shocks that the individual has already incurred this week.
Note that n ∈ {0, 1, . . . , N }. The state space prior to the realization of a particular health
shock can be written as (m, n). Importantly, because of our assumption that the donut
hole is an absorbing state, we can write our dynamic decision problem as an infinite-horizon
problem, rather than a 52-week problem.10
Let V δ (m, n) denote the value of future payoffs gross of the hyperbolic β term. This value
pertains to an individual with m dollars till the donut hole who has already experienced n
health shocks this week, and before it is known whether another health shock will occur in the
9
We could also model “naifs” who (incorrectly) perceive that they are geometric discounters with discount
factor βδ. For naifs, behavior is governed by βδ and hence one cannot separately identify β from δ. Tests for
naiveté typically consider whether individuals are willing to sign binding contracts to commit future versions
of themselves (DellaVigna, 2009). Such contracts do not exist in our data.
10
Our counterfactuals specify the Bellman equation as a 52-week problem with a catastrophic coverage
region because the assumption that the donut hole is the absorbing state is less accurate at different points
in the year and with counterfactual policies and preferences.
9week or the nature of that shock. Let V (m, n, ~ε, h) be the value at the time of realization of
a health shock, net of the β term, where ~ε refers to the vector (εh0 , . . . , εhJh ). It is necessary
to define V and V δ separately because of the presence of quasi-hyperbolic discounting.
To exposit the agent’s optimal choice, we first define her effective price as:
phj , if 0 ≤ m < oophj
pef (m, phj , oophj ) = oophj + phj − m, if oophj < m ≤ phj (1)
oophj , if m > phj .
Note that pef covers the two cases mentioned above, of being in the donut hole and being
out of the donut hole, as well as the intermediate case where the drug purchase would move
the individual into the donut hole, where the individual pays the out-of-pocket price and the
difference left after reaching the donut hole, if this is less than the full price. We now exposit
the value function V as:
γhj − α(pef (m, phj , oophj )) + βV δ (max{m − phj , 0}, n + 1) + εhj .
V (m, n, h, ~ε) = max
j=0,...Jh
(2)
From (2), the main dynamic effect is that each purchase moves the individual closer to the
donut hole by phj dollars. Given quasi-hyperbolic discounting, the V δ value function must
be further discounted by β in the current decision problem. Also, note that the problem is
only dynamic before the donut hole: when the individual is in the donut hole, m = 0 and
the continuation value is the same across options.
Using (2) we can define market shares using the standard logit formulas as:
exp(γhj − α(pef (m, phj , oophj )) + βV δ (max{m − phj , 0}, n + 1))
s(m, n, h, j) = PJh . (3)
ef δ
k=0 exp (γhk − α(p (m, phk , oophk )) + βV (max{m − phk , 0}, n + 1))
10Finally, we define V δ as:
H
X Jh
X
δ δ
V (m, n) = (1 − Qn )δV (m, 0) + Qn Ph s(m, n, h, j)×
h=1 j=0
γhj − α(pef (m, phj , oophj )) + V δ (max{m − phj , 0}, n + 1) − ln s(m, n, h, j) , (4)
where the − ln s(m, n, h, j) term accounts for the expectation of ~ε conditional on choice.11
From (4), there are two possibilities ex-ante to the health shock realization: either there
are no more health shock in this week (which occurs with probability 1−Qn or there are more
health shocks, in which case we need to sum over the different drug classes. Importantly, we
cannot use the standard logit expression for utility in (4): essentially choices are made with
βδ discounting of the future, but then different periods in the future are discounted only by
δ from each other. Mathematically, then, it is as though the individual is making “wrong”
choices but faced with geometric discounting.
2.3 Testable Implications of the Model
This subsection discusses some properties of our model with regards to enrollee behavior
across different discount factors. These properties in turn form the basis for our evidence
of myopia in Section 4. For simplicity, we specify that there is only one drug class and one
drug in this class, so that H = 1 and J1 = 1, and that p11 = $100.4 and oop11 = $25.1.12 We
do not need to specify the price coefficients, mean utility, or health shock frequency, but we
need to assume that they are in the range where individuals will make some purchases from
inside the donut hole at the end of the year with probability close to 1.
First, we consider the case where β = δ = 1. It is difficult to analyze this case as the value
is infinite since there is no discounting. Hence we modify this case slightly to assume that
the decision process ends at some finite time sufficiently far in the future that the enrollee
will surely be in the donut hole at that point. Since the enrollee knows that she will reach
11
Note that we exclude Euler’s constant from this expression as it does not affect choices.
12
Our example uses these prices as the donut hole start of $2,510 is an even multiple of them.
11the donut hole, consumption of an extra drug in the insured region will still cost her the
full price of the drug. Even though she will only pay the out-of-pocket price at the time of
consumption, this consumption will move her total expenditures up by the full price which
will then push her last previously-insured drug into the donut hole. In this setup, then, the
first 25 drugs consumed are insured and the enrollee receives a 75% per-drug subsidy on them
for a total subsidy of $1,882.5. The choice problem is equivalent to one where the individual
receives a fixed subsidy of $1,882.5 and does not have any drug insurance. This it is then
a static multinomial logit problem with the full price. Thus, consumption behavior will not
change upon crossing into the donut hole.
Now consider the geometric discounting case, where β = 1 but where 0 < δ < 1. We start
by analyzing a time point when the enrollee has already bought 24 drugs, and is deciding
on the last insured purchase. Purchasing the drug at this point costs the enrollee the $25.1
immediately. But, it also moves the next purchase into the donut hole, adding $75.3 to the
cost of the next purchase. Thus, the only increase in mean utility from this 25th purchase
relative to the 26th purchase is that the $75.3 is not paid immediately but instead is paid
at a later date. One can write this difference in mean utility as 75.3(1 − δ t ) where t is the
expected time until payment of this value. Using a standard annual discount factor of 0.95
implies a discounting of 0.001 over one week, implying that this loss in mean utility is small.
Thus, the rational model can only explain sizable variations in purchase before the donut hole
with extremely large price elasticities (which would amplify small mean utility differences in
choice) or very low values of δ.
Moreover, for the same rational case, consider an individual who has previously bought
only 23 drugs and is now at her 24th purchase occasion. As with the 25th purchase occasion,
the only increase in mean utility from this 24th purchase relative to the 26th purchase is that
the $75.3 is not paid immediately but instead is paid at a later date. However, it is now paid
two purchase dates in the future, not one. Thus, the difference in mean utilities between
0
the 24th and 26th purchase occasions would be 75.3(1 − δ t ) where t0 is the expected time
between the 24th and 26th purchase occasions. If t0 is twice t, this implies a mean utility
difference that is close to twice as large between the 24th and 26th purchase occasions than
12between the 25th and 26th purchase occasions. In other words, if the enrollee purchased more
frequently at the 25th purchase occasion than at the 26th purchase occasion then she would
purchase even more frequently at the 24th purchase occasion – roughly as much more often
as between the 25th to the 26th purchase occasion. Essentially then, geometric discounting
predicts that purchase probabilities continue to increase the further away they are from the
donut hole.
Finally, we consider the myopic case of β < 1 or δ = 0. Considering again the 25th
purchase occasions, the individual discounts the future payoff by βδ t . Thus, the difference in
mean utilities between the 25th and 26th purchase occasion is now 75.3(1−βδ t ). Similarly, the
0
difference in mean utilities between the 24th and 26th purchase occasion is now 75.3(1 − δ t ).
If β is much below 1 and δ is very close to 1 then these two values will be very close to each
other but far from 0, implying similar purchase probabilities at the 24th and 25th purchase
occasions that are significantly higher than at the 26th purchase occasion. Note that for the
extreme case of δ = 0, individuals react exclusively to the current price, implying that the
mean utility for the 24th and 25tth purchase occasions would be exactly the same, and again
more than at the 26th purchase occasion. The implication is that myopia can predict that
purchase probabilities from before the donut hole are similar to each other but very different
from within the donut hole.
Figure 1 shows simulated spending for our different models graphically. To construct
this figure, we first solved for the dynamic decisions using the parameters noted above in
combination with a linear price term of α(p11 ) = 0.02p11 , a mean utility of γ11 = 1,13 and
different values of β and δ (as reported in the figure). We then simulated mean spending in
each week enough times so that the simulation variance is negligible and report the mean
spending per week given that the individual has spent $2,008, $2,108.4, $2,208.8, etc., at the
start of the week.
As predicted by theory, spending is flat and the same across values of β and δ within
the donut hole, at about $27 per week. We find that the β = 0 case has the biggest mean
spending per week before the donut hole, at about $62 per week. Also as predicted by theory,
13
These parameters are chosen to roughly calibrate the model to observed spending patterns.
13Figure 1: Mean simulated drug spending on cumulative spending for stylized model
Simulated spending from stylized model
60
Mean spending per week ($)
20 0 40
2000 2200 2400 2600 2800 3000
Cumulative spending at beginning of week ($)
β=0 β=0.5, δ=0.999
β=1, δ=0.96 β=1, δ=0.999
spending before the donut hole is completely flat for this case. With β = 0.5 and δ = 0.999,
mean spending is virtually as flat as with β = 0 before arriving in the donut hole although,
at $46 per week, it is substantially lower than with β = 0. With geometric discounting
and δ = 0.999 (or 0.95 at an annual level), mean spending before and in the donut hole
are approximately the same. Finally, with geometric discounting and a low discount factor
of δ = 0.96 (as in Einav et al. (2015)), mean spending drops almost linearly over the pre-
donut-hole period, from $41 at $2,008 in beginning-of-week spending to $27 at $2,510 in
beginning-of-week spending.
Overall then, we can test for whether βδ is substantially less than 1 by examining whether
there is a substantial change in purchase probability between immediately before the cover-
age gap and immediately after the start of the coverage gap. We can test for whether there
is myopia by examining whether periods immediately before the donut hole have a lower
purchase probability than periods slightly further away from the donut hole. This regression
discontinuity design provides a test of rationality that compares behavior for the same indi-
14vidual at different time periods that are near each other in time. By focusing on the same
individual and at similar time periods, we avoid many issues of selection that potentially
confound other tests of myopia.
These implications of the model are robust to alternative assumptions. First, suppose
that there are multiple drugs with different coinsurance rates. In this case, evaluating the
dynamic choice problem becomes more involved. As an extreme case, suppose we add a new
drug without a copay, so that oop12 = 0. In this case, the enrollee would like to choose
the second drug relatively more often when she is in the initial coverage region. While the
analysis is more involved here, the basic point remains: in our model, the only substantial
reason to change spending behavior upon entering the donut hole is discounting.
Second, one might consider a very simple alternate scenario, where the value of the drug
always lies somewhere between the value of $25.1 and $100.4. In this case, the individual
would rationally purchase the drug only in the initial coverage region and stop purchasing the
drug in the coverage gap. Yet, this scenario does not fit enrollees in our estimation sample
since 96% of enrollees in our estimation sample surpass the coverage gap start (and most
by a substantial amount), implying that individuals in the sample have valuations for some
drugs that are sufficient for purchase even in the absence of insurance. Given that individuals
in the sample know that they will end up purchasing once inside the donut hole, curtailing
a purchase in the initial coverage region will save them the same amount as curtailing a
purchase in the coverage gap region, absent any discounting.14
Third, one might believe that our results are due to enrollees simply being misinformed
regarding the benefits. Yet, because our data are from the third year of the program, it is
unlikely that our results on myopia are driven by a lack of understanding about the presence
of the donut hole and its implications. Because Medicare enrollee drug consumption is
principally tied to the treatment of chronic conditions, those who reach the donut hole in one
year are likely to reach or approach the donut hole in the next year. In addition, as we detail
below in Section 3, enrollees are provided substantial information regarding the structure of
14
Note that in our Figure 1 simulation, the value of the drug is 1 + εit while the value of [$25.1, $100, 4]
is [.052, 2.008]. Thus, the ε term ensures that the value of the drug is not always between the value of $25.1
and $100.4.
15the donut hole and receive regular updates on their spending relative to the donut hole.
Finally, we consider the biases of our tests based on the fact that our model omits the
presence of the catastrophic coverage region. We will find evidence of myopia if individuals
curtail purchases upon reaching the donut hole. One might worry that these results are due
to rational behavior where individuals who reach the donut hole due to unexpected health
shocks recognize that these health shocks increase the probability that they will reach the
catastrophic coverage zone. But, spending should rationally be higher in the catastrophic
region. Since a higher probability of reaching the catastrophic region should increase spend-
ing, the presence of a catastrophic coverage region will bias us towards a finding of no impact
upon entry into the donut hole.
3 Data
For our analysis, we rely on a proprietary claims-level dataset of employer-sponsored Part D
plans in the year 2008, the third year of the program. The data come from the pharmacy
benefits manger Express Scripts, which managed Medicare Part D benefits for approximately
30 different employer-sponsored Medicare Part D plans with a total of 100,000 enrollees.
The plans were offered to eligible employees and retirees as part of their retirement benefits.
Employers receive subsidies from Medicare in exchange for providing these plans to their
employees. Enrollees in employer-sponsored Part D plans have, on average, higher income
than typical Part D enrollees. The employer-sponsored Part D market constituted nearly 7
million enrollees or 15 percent of Part D enrollment in 2008.15
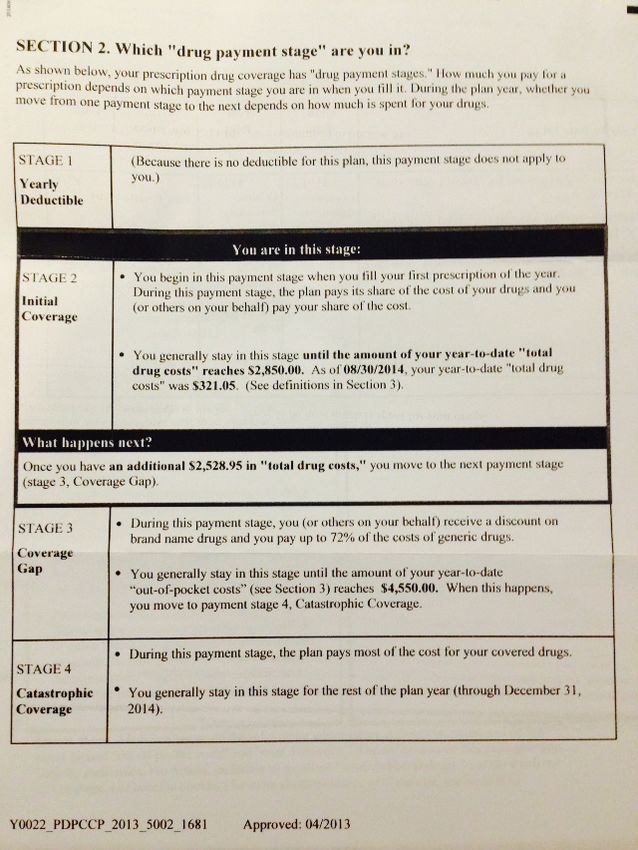
An interesting feature of the Part D program is that enrollees are mailed detailed monthly
information that lists their out-of-pocket and total costs for the month, the cost of their drugs
to the plan as well as the out-of-pocket costs and explains how far they are from the donut
hole. Figure 2 shows an example of the part of the information that pertains to the distance
to the donut hole. In our view, the frequency and detail of the information suggests that
rational enrollees have the opportunity to be informed about the coverage gap.
15
Source: http://www.medpac.gov/documents/reports/mar09 ch04.pdf?sfvrsn=0, p. 282).
16Figure 2: Information provided to Part D enrollees on distance to donut hole
17The data contain all claims made by an enrollee in the year 2008 for each plan. For
each claim, we have plan and patient identifiers, the age (at the fill date) and gender of the
patient, the date the prescription was filled, the total price of the drug, the amount paid by
the patient, the national drug code (a unique identifier for each drug), the pill name, the drug
type (e.g., tablet, cream, etc.), the most common indicator of the drug (e.g., skin conditions,
diabetes, infections, etc.), the dispensed quantity of the drug, and an indicator for whether
the drug is generic or branded. We keep only individuals who are 65 or older at the time
that they fill their first prescription.
Each of the employers offered multiple plans, each with different coverage structures. Our
base analysis uses data from five Express Scripts plans. We chose these plans because (1)
they have a coverage gap that starts at exactly $2,510 in total expenditures and ends at
greater than $4,000 in out-of-pocket expenditures; and (2) the employers that offer these
plans allowed us to use their data. We also include falsification evidence from a sixth plan
with a higher coverage gap phase initiation.
Table 1: Plan characteristics and enrollment
Plan CL1A CL1D CL1E CL2A CL2B CL3A
Employer 1 1 1 2 2 3
% of employees from employer 26 45 9 79 21 46
Deductible ($) 275 100 100 0 200 0
Donut hole start (total $) 2,510 2,510 2,510 2,510 2,510 4,000
Catastrophic start (out-of-pocket $) 4,050 4,050 4,050 4,010 4,010 4,050
Total enrollment 7,541 12,858 2,431 4,062 1,058 35,395
% hitting $2,510 20 13 16 16 13 20
% hitting catastrophic coverage 2 1 1 1 1 0
Estimation sample:
Enrollment 672 717 149 326 52 3,341
% hitting $2,510 96 95 96 97 94 98
% hitting catastrophic 12 8 9 10 12 0
Mean total spending ($) 4,543 4,135 4,082 4,232 3,982 4,150
Mean out-of-pocket ($) 2,398 2,038 2,160 2,032 2,068 1,032
Mean age 74 73 72 75 75 78
Percent female 62 57 54 62 56 64
Mean ACG score 1.07 1.18 1.22 0.94 1.14 0.67
Note: plan CL1A provides generic coverage in deductible region; plan CL3A used for falsification exercise only and also provides
generic coverage in donut hole.
18Table 1 displays the characteristics of the six plans that we consider. The plans represent
three different employers; plan and employer identities are masked. We consider all covered
employees at employer 2 and the majority of covered employees at employer 1 (with the
other employees at this employer choosing plans with different coverage gap regions or some
insurance in the coverage gap). Importantly, the fact that each employer offered similar plans
to all their employees minimizes the selection issues across plans that one might observe in
non-employer-sponsored Part D coverage.
Four of the five plans in our base analysis have a deductible. All deductibles take relatively
low values of $275 or less. Each plan features a tiered drug copayment structure, with
higher copays for brand and specialty drugs, and reduced copays for the use of mail-order
pharmacies. By our inclusion criterion, all five base plans have a donut hole region starting
at $2,510. After an enrollee’s drug spending surpasses $2,510, all plans drop coverage and
the enrollee’s expenses are completely out of pocket. The donut hole region is substantial.
For three of the plans, the donut hole ends when the enrollee reaches $4,050 in out-of-pocket
expenditures (and hence much higher in total expenditures), while the remaining two plans’
donut hole ends after the enrollee reaches $4,010 in out-of-pocket expenditures. Generous
catastrophic coverage resumes after the donut hole for all six plans, with low copays of $2.15
for generic drugs and $5.60 for branded drugs.
Table 1 also lists summary statistics on plan enrollment. The five base plans cover a total
of 27,950 individuals. Our base estimation sample consists of all enrollees who reach the
donut hole between Sunday, March 30 and Saturday, July 26, 2008. We chose these dates to
be in the part of the year where people should perceive that they will end the year in the
donut hole with very high probability. We define a week as starting on a Sunday. Our main
estimation is performed on these enrollees starting at the first complete week of the year that
they start with $2,000 or more in total expenditures and ending in the last complete week
that they start with less than $3,000 in total expenditures.
Our base estimation sample contains 1,916 enrollees distributed across the five plans in
our sample. The mean age across the plans ranges from 72-75 and the mean percent female
ranges from 54-62%. Between 94 and 97 percent of these enrollees hit the coverage gap during
19the year, reflected in mean total spending levels of approximately $4,000 across the plans.
The mean percent hitting the much higher catastrophic coverage region ranges from 8 to
12 percent, reflected in mean out-of-pocket spending levels of approximately $2,200 across
plans, or about 55 percent of the value necessary to hit the start of catastrophic coverage.
The falsification plan CL3A has the coverage gap start at $4,000 in total spending, a much
higher level than for the base plans. Its enrollees are older and disproportionately female
relative to the plans in our base analysis sample. It also provides generic drug coverage
during its coverage gap. Very few of its enrollees hit the catastrophic coverage region, due
to the fact that they will require much higher total spending to reach a given out-of-pocket
spending level.
Using our database of claims, we first drop claims for drugs which we believe are not in
the formulary. Drugs that are not in the formulary are sometimes reported to the insurance
company by the enrollee but do not count towards spending for purposes of determining if
the enrollee is in the coverage gap or catastrophic coverage regions. We assume that any
claim in the initial coverage region for which the total price is $100 or higher and the out-of-
pocket price is the same as the total price reflects a drug that is not in the formulary.16 We
then calculate the dollars until the donut hole (m) for each prescription by tabulating the
spending up to this point during the year.17
We merge our claims data with data on the expected pharmacy claims cost for each
patient, based on their claims from before our sample period. Specifically, we use claims
from Jan. 1, 2008 to Mar. 29, 2008 to construct the Johns Hopkins Adjusted Clinical Group
(ACG) Version 10.0 score for each enrollee. The ACG score is meant to predict the drug
expenditures over the following one-year period. We use the ACG scores to define groups for
the structural analysis and then estimate separate coefficients for each group. ACG scores
have been widely used to predict future health expenditures in the health economics and
health services literature (see, e.g., Handel, 2013; Gowrisankaran et al., 2013). Table 1 also
16
We also drop one claim with a quantity-filled entry of over 1 million.
17
There is some ambiguity of the order of claims if there are multiple claims filled on the same date for a
given enrollee. For such multiple claims, we assume that the claims are filled in increasing order of out-of-
pocket price. For multiple claims for an enrollee on a given date with the same out-of-pocket price, we use
the order specified in the database that we received from Express Scripts.
20provides the mean ACG scores for each plan in our sample. The scores are normalized so
that the population mean score for individuals aged 65 or over is 1. We find that the mean
ACG scores are similar to the population mean and each other across our five base plans,
and lower for the falsification plan CL3A.
Our analysis classifies each drug into a drug class meant to capture the function of the
drug. We define a unique drug class for each pill name, drug type, and most common indi-
cator. We had the drug class coding performed by a research assistant with clinical training
using these three fields and the national drug code. We made this classification on the basis
of drug function rather than as a function of the underlying disease because we believe that
drug function is the relevant attribute for a choice model. Thus, even though both calcium
channel blockers and renin-angiotensin system blockers are used to treat hypertension, we
treat them as separate classifications because their mechanisms are separate. We lump to-
gether drug classes with fewer than 100 prescriptions filled for the estimation sample over
the entire year and in a class called “Other.” We also lump together drugs within a drug
class as “Other” until such point as every drug has at least 50 prescriptions filled over the
entire year.
Table 2 lists the drug classes with the most claims in the dataset. Approximately 9
percent of the claims were for cholesterol-lowering (antihyperlipidemic) drugs. The next
most common categories include renin-angiotensin system blockers, opioids (for pain relief),
and antidepressants. Not shown in the table, there are 70 drug classes when we use our full
sample.
Table 3 provides details on the most common drugs consumed. Nine of the ten most
common drugs are generic. Not surprisingly, these drugs are all cheaper than the anti-
platelet drug Plavix, which is the only branded drug on the list. The total prices of the drugs
range from $8 to $175, with mean out-of-pocket prices in the initial coverage region ranging
from $8 to $41.
21Table 2: Most common drug classes in estimation sample
Indicator Number Rx % of obs. Most common Rx
Cholesterol Lowering 2,201 9.4 Simvastatin
Renin-Angiotensin System Blocker 1,851 7.9 Lisinopril
Beta-Blocker 1,288 5.5 Metoprolol
Opioid 1,233 5.2 Hydrocodon
Antidepressant 1,220 5.2 Sertraline
Diuretic 1,214 5.2 Furosemide
Calcium Channel Blocker 957 4.1 Amlodipine
Insulin Sensitizer 815 3.5 Metformin
Gastroesophageal Reflux & Peptic Ulcer 799 3.4 Omeprazole
Hypothyroidism 798 3.4 Levothyroxine
Table 3: Most common drugs in estimation sample
Drug Indication Bran- Total Out of pocket Number %
name red price ($) price ($) of Rxs of obs.
Lisinopril Renin- N 18.84 9.90 727 3.1
Angiotensin
System Blocker
Metoprolol Beta-Blocker N 30.73 10.27 649 2.8
Simvastatin Cholesterol Low- N 33.52 11.51 640 2.7
ering
Hydrocodon Opioid N 21.48 7.92 625 2.7
Plavix Antiplatelet Y 174.60 41.43 603 2.6
Furosemide Diuretic N 8.23 6.85 589 2.5
Levothyroxine Hypothyroidism N 11.52 9.26 562 2.4
Metformin Insulin Sensitizer N 24.59 9.68 526 2.2
Amlodipine Calcium Channel N 52.35 11.07 508 2.2
Blocker
Warfarin Anticoagulant N 16.20 8.46 346 1.5
Note: reported total prices and out-of-pocket prices derived from authors’ calculations.
224 Evidence from Discontinuity Near Donut Hole
This section presents evidence on whether individuals act in a way that is consistent with
rational forward-looking behavior or with myopia. We base our evidence on the testable
implications of the model developed in Section 2.3.
We perform a series of regression discontinuity analyses that all use our analysis sample of
enrollees who arrived near the donut hole in the middle of the year. The unit of observation
for each regression is an enrollee observed over a week. We allow these enrollees to be in the
estimation sample for the complete weeks after their entry into the donut hole until either
the last complete week of the year or the last week where their expenditures at the beginning
of the week are less than $3,000.
Figure 3: Mean drug spending on cumulative spending: plans in base sample
Spending near coverage gap
80
Total spending per week ($)
20 400 60
2000 2200 2400 2600 2800 3000
Cumulative spending at beginning of week ($)
Mean spending during week Smoothed spending during week
We start with non-parametric kernel smoothed “lowess” regressions of mean total drug
spending on beginning-of-week cumulative spending.18 Figure 3 shows the kernel smoothed
18
We use a bandwidth of 0.3 for these regressions.
23regression results as well as the (non-smoothed) mean total drug spending by $20 increments
of beginning-of-week cumulative spending, both for our base sample. The mean total drug
spending shows little change in spending over the range $2,000-2,380 in beginning-of-week
cumulative spending. Mean spending then drops until the donut hole and remains roughly
constant until the highest cumulative spending level.
Note that week observations that are near the donut hole but not yet in the donut hole
may move the individual into the donut hole, either because of an expensive drug or because
of multiple drugs. This will result in an effective current price that is higher than before
the donut hole but lower than in the donut hole (see equation 1). Thus, the fact that
spending starts to drop slightly before the donut hole does not indicate that individuals are
forward-looking. In contrast, the flat spending in the $2,000-2,380 range and the flat but
lower spending in the donut hole range is a pattern that is consistent with myopia but not
geometric discounting, as in Figure 1.
Figure 4: Mean drug spending on cumulative out-of-pocket spending: falsification plan
Spending near base plan coverage gap: falsification plan
100 80
Total spending per week ($)
20 40 0 60
2000 2200 2400 2600 2800 3000
Cumulative spending at beginning of week ($)
Mean spending during week Smoothed spending during week
Figure 4 examines a falsification exercise on Plan CL3A, which had a coverage gap that
24started at $4,000 in total spending. We run the same kernel smoothed regression on this plan
as on our base sample of five plans, using again enrollees who reach $2,000 in spending early
in the year. We find very different results: there is no drop in spending upon reaching $2,510
in total spending. Thus, this figure supports the conclusion that there is nothing medically
significant regarding $2,510 that would cause drug expenditures to fall upon reaching this
level, but rather that it is due to the coverage gap itself.
Figure 5: Mean drug spending on cumulative spending: plans in base sample
Spending near catastrophic coverage start
1000
Total spending per week ($)
500 0
3500 4000 4500
Cumulative out-of-pocket spending at beginning of week ($)
Mean spending during week Smoothed spending during week
Figure 5 performs the final non-parametric regression. It again examines the base sample,
but now considering the region around $4,030 in total (not out-of-pocket) spending, which is
the mean of the start of catastrophic coverage across our five base plans. For this figure, we
use the sample of enrollees who reach $3,530 in total spending between March 30 and July
26, 2008. The figure shows much weaker but somewhat suggestive evidence that spending
rises until near the catastrophic coverage region and is flat from this point on. Any evidence
here will likely be much weaker due to the much smaller sample size of people reaching the
catastrophic coverage region than reaching the donut hole. Note that this figure shows a
25ramp-up in spending in the pre-catastrophic-coverage period, implying preferences here that
may be consistent with geometric discounting.
As noted above, for Figure 3 to reflect myopia, it must be that individuals expect to end
the year inside the donut hole and not at the boundary between the initial coverage and
coverage gap regions, as would have occurred if valuations for drugs lie strictly in-between
the out-of-pocket and full prices of the drug, for instance. In order to consider this hypothesis
more fully, Figure 6 considers the extent to which there is “bunching” of the end of the year
expenditures around the donut hole. For the full sample of enrollees in the plans we consider,
we find evidence of a small amount of bunching, consistent with both myopia and geometric
discounting.19 In contrast, we see no evidence of bunching for our estimation sample, which
is consistent with the fact that enrollees in the estimation sample almost always end the
year well within the donut hole. The lack of bunching also implies that individuals are not
stockpiling drugs at the end of the year to exhaust the insurance from the initial coverage
region, as has been found in other medical contexts (Cabral, 2013).
Having shown with non-parametric regressions that there is a discontinuity in spending
near the donut hole, we now turn to linear regressions that quantify the spending drops and
examine them in more detail. Our linear regression specifications follow the form:
Yit = F Ei + λ1 1{0 < mit0 ≤ $110} + λ2 1{mit0 = 0} + vit , (5)
where Yit is the dependent variable, F Ei are enrollee fixed effects, λ1 is the coefficient on
an indicator for being above $2,400 in spending (within $110 of the donut hole) and λ2 is
the coefficient on an indicator for being in the donut hole, which implies starting the week
with at least $2,510 in expenditures. We examine a number of different dependent variables,
including total prescription drug expenditures, branded drug expenditures, and number of
prescriptions filled. The λ1 coefficient captures the fact that observations that are near the
donut hole but not yet in the donut hole may move the individual into the donut hole.
By selecting a small region around the donut hole, we are comparing the same individual
19
Einav et al. (2015) also find evidence of end-of-the-year bunching for the set of all Part D enrollees in
their data.
26Figure 6: Histogram of end-of-year drug spending for estimation and full sample
End-of-year spending, full sample
.001
Density
5.0e-04
0
1000 2000 3000 4000
Total spending
End-of-year spending, estimation sample
.001
Density
5.0e-04
0
2000 2500 3000 3500 4000
Total spending
at similar points in the year but faced with different current prices. This minimizes the possi-
bility that factors other than the presence of the donut hole might be influencing our findings.
By including individual fixed effects, we are further controlling for individual differences at
different points in our sample, i.e. the possibility that more severely ill individuals show up
more in the region after the donut hole.
Our first set of linear regression findings are reported in Table 4.20 All our results clus-
ter standard errors at the level of the enrollee. We find sharp drops in every measure of
prescription drug use. Supporting the results in Figure 3, total drug spending dropped by
$18 from a baseline of $62. The number of prescriptions fell by 21% from a baseline mean
of 0.84 per week. Branded prescriptions fell more than generic prescriptions: 27% versus
19%. Similarly, expensive prescription – those with a total price of $150 or more – fell by
27% while inexpensive ones – those under $50 – had no significant drop. The mean total
price of a prescription fell by 12% from a baseline level of $80. All effects, except for those
20
In the interest of brevity, we do not report either the enrollee fixed effects or λ1 values in our tables.
27You can also read