Refrigeration and Air Conditioning Green-house Gas Inventory for the Philippines
←
→
Page content transcription
If your browser does not render page correctly, please read the page content below
Refrigeration and Air Conditioning Green-
house Gas Inventory for the Philippines
As a federally owned enterprise, GIZ supports the German Government in achieving its objectives in the field of international cooperation for sustainable development. Published by: Deutsche Gesellschaft für Internationale Zusammenarbeit (GIZ) GmbH Registered offices Bonn and Eschborn Friedrich-Ebert-Allee 36 + 40 53113 Bonn, Germany T +49 228 44 60 - 0 F +49 228 44 60 - 17 66 Dag-Hammarskjöld-Weg 1–5 65760 Eschborn, Germany T +49 (0) 6196 79 - 4218 F +49 (0) 6196 79 - 804218 proklima@giz.de www.giz.de/proklima Programme/project description: Cool Contributions fighting Climate Change (C4)/ Proklima In cooperation with Department of Energy Department of Environment and Natural Resources Responsible: Philipp Munzinger, C4 Project Manager (GIZ Proklima) Authors and Data Collectors: Regina Karakina, Dr. Simon Mischel (HEAT GmbH) Rolando Abad, Jr., Onofre Escota (DENR-EMB), Ella Deocadiz, Manuel Azucena, Orland Tubola, Jhunearl Getalaga, Fausto Abadines Acknowledgement for Review and Input Maraida Licerio, Philipp Munzinger (GIZ) Photo credits/sources Cover photo: © GIZ Proklima Design: Jeanette Geppert pixelundpunkt kommunikation, Frankfurt URL links: This publication contains links to external websites. Responsibility for the content of the listed external sites a lways lie with their respective publishers. When the links to these sites were first posted, GIZ checked the third-party con- tent to establish whether it could give rise to civil or criminal liability. However, the constant review of the links to external sites cannot reasonably be expected with concrete indication of a violation of rights. If GIZ itself becomes aware or is notified by a third party that an external site it has provided a link to gives rise to civil or criminal liability, it will remove the link to this site immediately. GIZ expressly dissociates itself from such content. Maps: The maps printed here are intended only for information purposes and in no way constitute recognition under international law of boundaries and territories. GIZ accepts no responsibility for these maps being entirely up to date, correct or complete. All liability for any damage, direct or indirect, resulting from their use is excluded. On behalf of The German Federal Ministry for the Environment, Nature Conservation and Nuclear Safety Division KI II 7 International Climate Finance, International Climate Initiative 11055 Berlin, Germany T +49 30 18 305-0 F +49 30 18 305-43 75 GIZ is responsible for the content of this publication. Printed and Distributed by GIZ 2019 Deutsche Gesellschaft für Internationale Zusammenarbeit (GIZ) GmbH Publication Date and Place July 2019, Manila
© trainman32 / fotolia
This publication is a product of the Cool Contributions fighting Climate Change (C4)
Project implemented by GIZ Proklima. It is part of the International Climate Initiative (IKI).
The Federal Ministry for the Environment, Nature Conservation, and Nuclear Safety (BMU)
supports this initiative on the basis of a decision adopted by the German Bundestag. The
project supports an international control for F-gases in combination with increased
energy efficiency in the refrigeration and air conditioning sector. It strengthens cooperation
between various initiatives such as the UNFCCC and the Montreal Protocol by promoting
a coordinated agreement and reducing overlaps. Furthermore, the project advises s elected
partner countries in formulating national GHG mitigation strategies in the refrigeration
and air conditioning sector and thereby advancing their NDCs. The project runs from 2016
until 2021.
3
TABLE OF CONTENTS

    LIST OF FIGURES AND TABLES                                                                 6/7

    ACKNOWLEDGEMENTS                                                                            10

    SUMMARY		                                                                                   11

    1. INTRODUCTION                                                                             14
       1.1 Project framework                                                                    14
       1.2 Importance and benefits of RAC sector inventories                                    14
       1.3 Geography and basic information of the Philippines                                   16
       1.4 Energy production, energy consumption and other factors influencing the growth of
    		     RAC appliances                                                                       16
       1.5 RAC stakeholders                                                                     18
       1.6 Climate and F-gas policies                                                           19

    2. SCOPE OF THE INVENTORY                                                                  20
       2.1 Methodology                                                                         21
       2.2 Data collection process                                                             23
       2.3 Modelling parameters                                                                 24

    3. RESULTS		                                                                               26
       3.1 Subsector sales and stock data analysis                                             26
    		     3.1.1 UAC sales and stock data                                                      26
    		     3.1.2 AC chillers sales and stock data                                              27
    		     3.1.3 Mobile air conditioning                                                       28
    		     3.1.4 Domestic refrigeration                                                        30
    		     3.1.5 Commercial refrigeration                                                      30
       3.2 BAU emissions and projections in the RAC sector                                     32

4   REFRIGERATION AND AIR CONDITIONING GREENHOUSE GAS INVENTORY FOR THE PHILIPPINES
3.3 Total emissions                                                                          33
		    3.3.1 Mitigation scenario emissions for the Philippine RAC sector                        33
		    3.3.2 Energy saving potential                                                            35
		    3.3.3 Use of low-GWP refrigerants                                                        35
		    3.3.4 Reporting to UNFCCC                                                                37
		    3.3.5 Unitary air conditioning emissions                                                 37
		    3.3.6 AC chiller emissions                                                               38
		    3.3.7 Mobile air conditioning emission mitigation potential                              39
		    3.3.8 Domestic refrigeration emission mitigation potential                               40
		    3.3.9 Commercial refrigeration emission mitigation potential                             40

4 REFERENCES                                                                                   42

5 ANNEX		                                                                                      44
  5.1 Contacted companies via questionnaires of unitary air conditioning and
		    domestic refrigeration subsectors                                                        44
  5.2 Subsector definitions                                                                    44
  5.3 Applied modelling parameters and results of model calculations                           47

                   REFRIGERATION AND AIR CONDITIONING GREENHOUSE GAS INVENTORY FOR THE PHILIPPINES   5
LIST OF FIGURES AND TABLES

     Figure 1: Projected Business-as-Usual (BAU) scenario for GHG emissions in the RAC sector until 2050
               and the predicted MIT emissions                                                                   11
     Figure 2: Projected Business-as-Usual (BAU) scenario for GHG emissions with the Kigali amendment
               in the RAC sector until 2050 and the predicted MIT emissions                                      12
     Figure 3: Mitigation potential of the Philippine RAC sector in the year 2050. The grey color of the first
               column shows the unabated emissions. The next columns to the right of the first column
               show the emission mitigation potential of each subsectors both for direct (dark blue) and
               indirect (light blue) emissions                                                                   12
     Figure 4: BAU, the BAU under Kigali and MIT scenarios of HFC consumption and Kigali schedule                13
     Figure 5: Climate chart of Manila. Source: compiled by www.klimadiagramme.de, source:
               National Climatic Data Centre (NCDC)                                                              16
     Figure 6: Total primary energy supply (TPES) for the Philippines for the year 2016, Mtoe =
               Million-tons oil equivalent                                                                       17
     Figure 7: Energy consumption by sector, Mtoe = Million tons oil equivalent                                  17
     Figure 8: Approaches for GHG emission estimates relevant to the RAC&F sector (Munzinger et al., 2016) 21
     Figure 9: Overview RAC refrigerant demand versus RAC total emissions                                        22
     Figure 10: Unitary AC units sold (2010 to 2016)                                                             26
     Figure 11: Unitary AC unit stock historic and forecasted (2010 to 2017; 2018 to 2050)                       27
     Figure 12: Sold units (2010 to 2016, top) and stock units of AC chiller (2010 to 2050, bottom)              28
     Figure 13: Sales 2010 to 2016 in the mobile AC subsector                                                    29
     Figure 14: Stock unit development (2010 to 2050) in the mobile AC subsector                                 29
     Figure 15: Domestic refrigeration unit stock taken from the GCI database (2010-2050) and
                adjusted by expert knowledge                                                                     30
     Figure 16: Stock data (2010-2050 CGI database projections) from the commercial refrigeration sector         30
     Figure 17: Total BAU GHG emission for the Philippine RAC sector by subsectors in 2017                       31
     Figure 18: Direct GHG emissions of the RAC subsectors in 2017                                               31
     Figure 19: Indirect GHG emissions of the RAC subsectors in 2017                                             31
     Figure 20: Projected BAU GHG emissions in the RAC sector for the years 2010-2050                            32
     Figure 21: Total annual emissions from the RAC sector, BAU and mitigation scenario                          33
     Figure 22: Direct and indirect mitigation potential for the year 2030. The grey color of the first
                column shows the unabated emissions. The columns to the right of the first column
                show the emission mitigation potential of each subsectors both for direct (dark blue)
                and indirect (light blue) emissions                                                              34
     Figure 23: Chart showing the direct and indirect mitigation potential for the year 2050. The grey color
                of the first column shows the unabated emissions. The columns to the right of the first
                column show the emission mitigation potential of each subsectors both for direct (dark blue)
                and indirect (light blue) emissions                                                              34

6   REFRIGERATION AND AIR CONDITIONING GREENHOUSE GAS INVENTORY FOR THE PHILIPPINES
Figure 24: Total cumulative energy saving potential (17.9 TWh) of the Philippine RAC sector (2018 to 2030) 35
Figure 25: Total cumulative energy saving potential (214.5 TWh) of the Philippine RAC sector (2018-2050) 35
Figure 26: HFC reduction steps according to UNEP                                                          36
Figure 27: HFC consumption under BAU, BAU-Kigali and mitigation (MIT) scenario and Kigali schedule        37
Figure 28: Projected GHG emissions of the unitary air conditioning subsector for the years 2010 to 2050   38
Figure 29: Projected GHG emissions of the chiller subsector for the years 2010 to 2050                    39
Figure 30: Projected GHG emissions of the mobile air conditioning subsector for the years 2010 to 2050    39
Figure 31: Total emission of the Domestic refrigeration sector for the years 2010 to 2050                 40
Figure 32: Total emission of the commercial refrigeration subsector for the years 2010 to 2050            41

Table 1: Statistical data of the Philippines                                                              17
Table 2: Overview of institutions relevant for the RAC sector and their contribution to the survey        18
Table 3: RAC subsectors and related systems                                                               20
Table 4: Modelling parameters for BAU scenario                                                            24
Table 5: Assumed future growth rates of appliance sales                                                   25
Table 6: Sold units for the AC chiller subsector for the years 2010 to 2015                               27
Table 7: Mobile AC sales data for the years 2010-2015 (calculated from GCI stock estimates)               29
Table 8: List of contacted companies                                                                      44
Table 9: Overview of air conditioning subsectors                                                          44
Table 10: Description of Iran’s special case equipment                                                    45
Table 11: Overview of refrigeration subsectors                                                            46
Table 12: Assumed average energy efficiency ratios in equipment sales for the Business as
          Usual scenario                                                                                  47
Table 13: Refrigerant distribution in sales for Business as Usual and Mitigation scenario                 48
Table 14: Calculated sales                                                                                51
Table 15: Calculated stock                                                                                52
Table 16: Common reporting format (CRF) 2016                                                              54
Table 17: Common reporting format (CRF) 2017                                                              56
Table 18: Common reporting format (CRF) 2018                                                              58

                             REFRIGERATION AND AIR CONDITIONING GREENHOUSE GAS INVENTORY FOR THE PHILIPPINES    7
ABBREVIATIONS

     AC                   Air conditioner
     BAU                  Business-as-Usual
     BMU                  German Federal Ministry for the Environment, Nature Conservation and Nuclear Safety
     C4                   Cool Contributions fighting Climate Change
     CCD                  Cooling Degree Days
     CCU                  Climate Change Unit
     CFC                  Chlorofluorocarbons
     DOE                  Department of Environment
     EEI                  Energy Efficiency Index
     EER                  Energy Efficiency Ratio
     ERTLS                Energy Research and Testing Laboratory Services
     F-GAS                Fluorinated gas
     GCI                  Green Cooling Initiative
     GDP                  Gross Domestic Product
     GEF                  Grid Emission Factor
     GHG                  Greenhouse gas
     GIZ                  Deutsche Gesellschaft für Internationale Zusammenarbeit (GIZ) GmbH
     GWP                  Global warming potential
     HVAC                 Heating, Ventilation and Air Conditioning
     HEAT                 Habitat, Energy Application and Technology GmbH
     HPMP                 HCFC phase-out management plan
     HC                   Hydrocarbon
     HCFC                 Hydrochlorofluorocarbon
     HFC                  Hydrofluorocarbon
     HFO                  Unsaturated HFC or Hydrofluoroolefin
     IEA                  International Energy Agency
     IKI                  International Climate Initiative
     INDC                 Intended Nationally Determined Contribution
     IPCC                 Intergovernmental Panel on Climate Change
     LATL                 Lighting and Appliance Testing Laboratory
     MAC                  Mobile Air Conditioning
     MEPS                 Minimum Energy Performance Standard
     MIT                  Mitigation scenario
     MLF                  Multilateral Fund of the Montreal Protocol

8   REFRIGERATION AND AIR CONDITIONING GREENHOUSE GAS INVENTORY FOR THE PHILIPPINES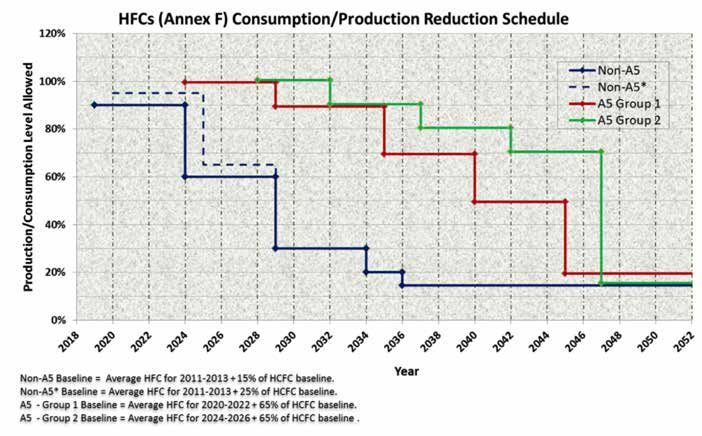
© tmal / pixabay

      MRV          Measuring, Reporting and Verification
      Mtoe         Million tons oil equivalent
      MW           Megawatt
      NAMA         Nationally Appropriate Mitigation Action
      NDC          Nationally Determined Contributions
      NOU          National Ozone Unit
      ODP          Ozone depleting potential
      ODS          Ozone depleting substances
      RAC          Refrigeration and air conditioning
      SATBA        Renewable Energy and Energy Efficiency Organisation
      SEER         Seasonal Energy Efficiency Ratio
      UAC          Unitary Air Conditioning
      UNDP         United Nations Development Program
      UNEP         UN Environment Progamme
      UNIDO        United Nations Industrial Development Organization

                       REFRIGERATION AND AIR CONDITIONING GREENHOUSE GAS INVENTORY FOR THE PHILIPPINES   9
ACKNOWLEDGEMENTS
This report is the result of a comprehensive data collection and assessment process that has been carried out
since September 2017 within the project “Cool Contributions fighting Climate Change” (C4)* implemented by
Deutsche Gesellschaft für Internationale Zusammenarbeit (GIZ) GmbH and funded by the German Federal Ministry
for the Environment, Nature Conservation and Nuclear Safety (BMU) under the International Climate Initiative (IKI).
The project aims to develop a greenhouse gas (GHG) mitigation strategy in the refrigeration and air conditioning
(RAC) sector as part of the Philippines’ Nationally Determined Contributions (NDCs), including establishing
parameters for increased energy efficiency in RAC technology, finding solutions for greener RAC technologies and
fostering their marketability and local manufacturing.
The GHG inventory provides a detailed profile of GHG emissions resulting from refrigeration and air conditioning
(RAC) in the Philippines and may serve as a basis for further development of emission reduction measures in the
RAC sector in contribution to the Philippine climate targets. It shall serve as a basis for further planning of the
Philippines’ NDCs and HFC phase-down schedules in contribution to the Montreal Protocol’s Kigali Amendment.
We would like to express our gratitude for the support of all the institutions, companies and other stakeholders
in the Philippines. The conduct of this inventory was led by the Environmental Management Bureau (EMB) of the
Department of Environment and Natural Resources (DENR). The DENR is the focal agency in the GHG inventory
and mitigation action in the Industrial Processes and Product Use (IPPU) sector of the Philippine inventory system
in line with Executive Order No. 174 in partnership with the Climate Change Commission (CCC) as National
Inventory compiler. We acknowledge the EMB leadership of Director Metodio U. Turbella and former Assistant
Director Jacqueline A. Caancan for their support.
The process was a learning experience for the DENR-EMB working on an integrated approach of ozone and
climate protection. Moreover, it was a new experience to work with other national government agencies given the
cross-cutting nature of the RAC sector compliance and enforcement.
We especially thank the Lighting and Appliance Testing Laboratory (LATL) of the Department of Energy (DOE)
Energy Research and Testing Laboratory Services (ERTLS) whose expertise and collaboration were indispensable
for the realization of this report. The development of a Minimum Energy Performance for RAC appliances is a
starting point in establishing a database for all RAC appliances in the Philippines, which hopefully would be a
valuable tool in succeeding RAC inventories in the near future.
* http://climate.emb.gov.ph/wp-content/uploads/2017/01/EO-174-National-GHG-Inventory.pdf
10 REFRIGERATION AND AIR CONDITIONING GREENHOUSE GAS INVENTORY FOR THE PHILIPPINESSUMMARY
Summary of key findings »»Following the current climate trends, the predicted
temperature rise for the Philippines would be be-
Over the last few years, there has been a tremendous tween 0.8-2.0 °C by 2050 2 , coupled with more frequent
growth in the Philippine RAC industry. The growing pop- occurrence of heat waves and dry spells. Thus, the
ulation and climate warming have led to a continuously need for air conditioning and refrigeration will rise and
rising demand for air conditioning and refrigeration. the annual emissions in the Philippine RAC sector are
expected to increase up to 44.6 Mt CO2eq by the year
»»In 2017, the RAC sector was responsible for 24.7 Mt 2050 (see Figure 1). This amount of GHG emissions
CO 2eq of GHG emissions, constituting 18.0% of the equals approximately what 11.5 coal-fired power plants
Philippines’ overall energy-related emissions of would release in one year of operation 3 . With an ambi-
137 Mt CO2eq1. tious mitigation strategy, the emissions can be reduced
to 29.1 Mt CO2eq by the year 2050 (dotted “mitigation”
MIT curve).
50
45
40
35
30
Mt CO2eq
25
20
15
10
5
0
2010 2015 2020 2025 2030 2035 2040 2045 2050
■ UNITARY AIR CONDITIONING ■ CHILLER ■ MOBILE AIR CONDITIONING ■ DOMESTIC REFRIGERATION ■ COMMERCIAL REFRIGERATION
■ INDUSTRIAL REFRIGERATION ■ TRANSPORT REFRIGERATION ● ● ● TOTAL MIT EMISSIONS
FIGURE 1: PROJECTED BUSINESS-AS-USUAL (BAU) SCENARIO FOR GHG EMISSIONS IN THE RAC SECTOR UNTIL 2050 AND THE PREDICTED
MIT EMISSIONS
1 See https://publications.europa.eu/en/publication-detail/-/publication/41811494-f131-11e8-9982-01aa75ed71a1/language-en
2 Climate Impact Lab, 2018.
2 Assuming a coal power plant emitting ca 3.8 Mt CO2eq per year. https://www.epa.gov/energy/greenhouse-gas-equivalencies-calculator, last accessed 08.02.2019
REFRIGERATION AND AIR CONDITIONING GREENHOUSE GAS INVENTORY FOR THE PHILIPPINES 1150
45
40
35
30
Mt CO2eq
25
20
15
10
5
0
2010 2015 2020 2025 2030 2035 2040 2045 2050
■ UNITARY AIR CONDITIONING ■ CHILLER ■ MOBILE AIR CONDITIONING ■ DOMESTIC REFRIGERATION ■ COMMERCIAL REFRIGERATION
■ INDUSTRIAL REFRIGERATION ■ TRANSPORT REFRIGERATION ● ● ● TOTAL MIT EMISSIONS
FIGURE 2: PROJECTED BUSINESS-AS-USUAL (BAU) SCENARIO FOR GHG EMISSIONS WITH THE KIGALI AMENDMENT IN THE RAC SECTOR UNTIL
2050 AND THE PREDICTED MIT EMISSIONS
The RAC sector has a large GHG mitigation potential »»Compared with the BAU scenario, 15.5 Mt CO 2eq can
with technologically and economically feasible mitigation be prevented by 2050 as shown in Figure 3, where mit-
actions. igation action regarding direct GHG emissions accounts
for 8.3 Mt CO2eq and indirect GHG emissions mitigation
contributes to a reduction of up to 7.2 Mt CO2eq.
50
■ DIRECT EMISSIONS
■ INDIRECT EMISSIONS
45
Total emmissions (Mt CO 2eq)
40
35
30
25
BAU scenario Unitary Air Air Mobile Air Domestic Commercial Industrial Transport
Conditioning Conditioning Conditioning Refrigeration Refrigeration Refrigeration Refrigeration
Chillers
FIGURE 3: MITIGATION POTENTIAL OF THE PHILIPPINE RAC SECTOR IN THE YEAR 2050. THE GREY COLOR OF THE FIRST COLUMN SHOWS THE
UNABATED EMISSIONS. THE NEXT COLUMNS TO THE RIGHT OF THE FIRST COLUMN SHOW THE EMISSION MITIGATION POTENTIAL OF EACH
SUBSECTORS BOTH FOR DIRECT (DARK BLUE) AND INDIRECT (LIGHT BLUE) EMISSIONS
12 REFRIGERATION AND AIR CONDITIONING GREENHOUSE GAS INVENTORY FOR THE PHILIPPINESA large GHG mitigation potential lies in transitioning Figure 4 shows the RAC-related HFC consumption
refrigerants from highly climate-damaging hydro under the BAU scenario, the “freeze” in consumption
chlorofluorocarbons (HCFC) and hydrofluorocarbons and reduction steps under the Kigali Amendment adopted
(HFC) to alternatives with low global warming potential as “BAU-Kigali scenario” as well as the consumption
(GWP) in a timely manner, ahead of the current HFC according to a more ambitious mitigation scenario
phase-down schedule stipulated in the Kigali amendment (MIT), which assumes the application of best available
to the Montreal Protocol (Clark and Wagner, 2016). technologies and use of low-GWP refrigerants. The term
low-GWP refrigerants is applied for refrigerants with
GWP below 10.
10
9
8
7
6
Mt CO2eq
5
4
3
2
1
0
2015 2020 2025 2030 2035 2040 2045 2050
■ BAU ■ BAU-KIGALI ■ KIGALI SCHEDULE ■ MIT
FIGURE 4: BAU, THE BAU UNDER KIGALI AND MIT SCENARIOS OF HFC CONSUMPTION AND KIGALI SCHEDULE
Furthermore, the transition to low-GWP refrigerants This RAC inventory, which demonstrates direct, indirect
can bring other benefits besides the abatement of GHG and total GHG emissions in the RAC sector, is the first of
emissions. Such co-benefits are energy and cost savings its kind in the Philippines. As no data on RAC emissions
through improved energy efficiency as well as the crea- in the country were established prior to the compila-
tion of local employment through local manufacturing of tion of this RAC emission inventory, they are so far not
refrigerants and appliances. A reduced energy use also included in the Philippines’ Intended National Determined
contributes to the Philippines’ national energy security. Contributions (INDCs) to the Paris Agreement submitted
in 2015 4 . With the information provided with this inven-
tory, the Philippines will have a more robust RAC sector
emissions estimate as a basis for mitigation planning
and action as part of the Philippines’ NDCs.
4 https://www4.unfccc.int/sites/submissions/INDC/Published%20Documents/Philippines/1/Philippines%20-%20Final%20INDC%20submission.pdf
REFRIGERATION AND AIR CONDITIONING GREENHOUSE GAS INVENTORY FOR THE PHILIPPINES 131 INTRODUCTION
In this chapter, we will discuss the general context »»BAU scenario considering the Kigali amendment,
of the project and the inventory, specifically address- referred to as “Kigali BAU”;
ing the relevance of the inventory of the RAC sector
to the national strategies on the Paris Agreement and »»potential market penetration of energy-efficient
the M
ontreal Protocol. We will then review the specific appliances using refrigerants with low global warming
climatic and market conditions in the Philippines and potential (GWP);
provide general information on its RAC sector, including
main stakeholders as well as RAC- and energy-related »»potential to mitigate GHG emissions from refrigerant
policies. This will serve as a background for further use and energy consumption in the RAC sector and its
detailed analysis of this sector’s current emissions and subsectors.
mitigation potential.
This report describes the RAC appliances currently avail-
able on the Philippine market, their energy consumption,
1.1 PROJECT FRAMEWORK the refrigerants used and the respective GHG emissions.
Currently used RAC technologies are compared with in-
The C4 project works among others closely with ternational best practice technologies in order to deter-
the following local authorities: the Climate Change mine the related emissions mitigation potential. Future
C ommission (CCC), the Department of Environment trends in each of the RAC subsectors are analysed with
and Natural Resources (DENR) with its Environmental respect to both BAU and mitigation (MIT) scenarios.
Management Bureau (EMB) of the Philippine Govern-
ment, the P hilippine Ozone Desk (POD), the Department
of E
nergy (DOE), the Department of Trade and Industry 1.2 IMPORTANCE AND BENEFITS OF
(DTI) and the Land Transportation Office (LTO). Close RAC SECTOR INVENTORIES
coordination among different entities and authorities
is essential to promote a coherent and sustainable Inventories that are based on an estimation of the stock,
development of the Philippine RAC sector. The full list i.e. the number of installed equipment in different RAC
of entities relevant to the project can be found in the subsectors, as well as average technical parameters
section 1.5. Additionally, Philippine industry associations per subsector provide a sound database and as such a
on heating, ventilation, air conditioning (HVAC), vocation- starting point for all GHG emission reduction activities
al training institutions such as the Technical Education and their monitoring.
and Skills Development A uthority (TESDA), as well as
refrigerant distributors and the petrochemical industry This equipment-based RAC GHG inventory provides the
(for information on possible local production of natural following information:
refrigerants) were involved in the project.
»»Sales and stock per subsector as well as growth rates
The purpose of this inventory is to provide an overview per subsector;
of the current state of GHG emissions of the RAC sector
in the Philippines. The report includes information on the »»technical data on systems, which determines their
following topics: GHG emissions such as average energy efficiency,
refrigerant distribution and leakage rates;
»»BAU GHG emissions resulting from refrigerant and
energy consumption of the RAC sector; »»GHG emissions on RAC unit basis;
14 REFRIGERATION AND AIR CONDITIONING GREENHOUSE GAS INVENTORY FOR THE PHILIPPINES© hpgruesen / pixabay
»»GHG emissions for the whole RAC sector including the Based on these advantages and different purposes, we
distribution between direct and indirect emissions; believe that the following Philippine stakeholders can
benefit from RAC inventories:
»»future projections of RAC-related GHG emissions;
»»The Climate Change Commission of the Philippines can
»»mitigation scenarios based on the introduction of integrate RAC sectoral mitigation targets into their
different technical options. climate mitigation strategies and in the regular climate
communication (National Communications and Biennial
The collected information can be used for the following Update Reports);
purposes:
»»The Department of Environment and Natural Resources
»»To identify key subsectors with the highest GHG (DENR) will be able to control GHG emissions and
emissions as well as the highest emission reduction start mitigation planning as well as UNFCCC reporting
potential based on available technologies; on HFCs. The methodology and information provided
through this inventory can be used to support the
»»to support country-wide GHG emission inventories that F-gas reporting included in the National Communica-
can be used for reporting under the UNFCCC. Based on tions and Biennial Update Report;
the projections, they indicate how GHG emissions will
develop in the future. Sectoral RAC mitigation plans »»The Department of Energy (DOE) will be able to
based on GHG inventories and GHG emission projections develop and track a national product database for
can support the development of NDC targets; continuous monitoring, reviewing and updating RAC
equipment related MEPS and labels.
»»to provide planning tools for mitigation action, such
as the formulation of Minimum Energy Performance »»the RAC industry can gain understanding of the
Standards (MEPS) and labelling or bans on refrigerants national development of the RAC sector regarding its
with high-GWP; carbon footprint in order to develop product and sales
strategies consistent with the required low carbon
»»to give an indication of the impact of legislation on development;
stakeholders in different subsectors;
»»the Department of Trade and Industry (DTI) will benefit
»»to form the basis for a Measuring, Reporting and using this report during development of RAC related
Verification (MRV) system or a product database; testing standards on product safety;
»»to support the development of climate finance project »»the Department of Finance (DOF) including Government
proposals with the aim of reducing GHG emissions in Financial Institutions (GFIs) and private banks can
the RAC sector, such as Nationally Appropriate Mitigation develop financial mechanisms and incentives for the
Actions (NAMAs). transition to low carbon strategies;
»»vocational training institutions (e.g. TESDA) can
integrate low carbon technology practices into their
training plans and training curricula.
REFRIGERATION AND AIR CONDITIONING GREENHOUSE GAS INVENTORY FOR THE PHILIPPINES 151.3 CURRENT CLIMATE AND ECONOMIC Due to the hot temperatures throughout the year, the
STATUS Philippines has a high demand for cooling technologies.
The need for cooling increases during the months of
The Republic of the Philippines is an island country May to November with hot and humid months.
in Southeast Asia, which consists of more than 7,600
islands. It is in the Pacific Ring of Fire and has an area With higher global temperatures, the number of Cooling
of 300,000 km² and a population of 103.3 5 million (as Degree Days (CDDs) in the Asian region will increase be-
of 2016). Most of the mountainous land area is covered tween 30% and nearly 100% by 2100 under the climate
with tropical rainforest, the climate is dominated by a reference scenarios RCP2.5 and RCP8.5, respectively
rainy season and a dry season. The summer monsoon (Hasegawa et al., 2016). With rising temperatures, not
brings heavy rains from May to October. Contrasting only the air conditioning sector will face challenges, but
the winter monsoon, where colder and drier air dom- also the demand for food cooling is expected to rise.
inates from December to February. The mean annual
temperature in Manila is 27.3°C with about 1.800 mm
precipitation (Figure 5). 1.4 ENERGY PRODUCTION, ENERGY
CONSUMPTION AND OTHER FACTORS
INFLUENCING THE GROWTH OF RAC
APPLIANCES
The demand for RAC appliances in the Philippines is
growing continuously with multiple factors driving this
growth (Oppelt, 2013), as listed in Table 1 below. The
growing population and number of households leads
to an increased demand for more appliances on the
market. The high GDP growth rate indicates general
economic growth, which coupled with increasing de-
mand and growing urbanisation increase the sales in the
sector. The current number of households can also give
a realistic general guidance on how many appliances
such as ACs and domestic refrigerators are in use by
the end users. The current total electricity consump-
tion in the country can be compared to the equivalent
consumption in different mitigation scenarios and thus
the potential contribution of the RAC sector to the total
country emissions abatement in case of the introduction
on nationwide programs.
FIGURE 5: CLIMATE CHART OF MANILA.
SOURCE: COMPILED BY WWW.KLIMADIAGRAMME.DE
SOURCE: NATIONAL CLIMATIC DATA CENTRE (NCDC)
5 https://www.iea.org/countries/Philippines/
16 REFRIGERATION AND AIR CONDITIONING GREENHOUSE GAS INVENTORY FOR THE PHILIPPINESTABLE 1: STATISTICAL DATA OF THE PHILIPPINES 6 15.1%
26.1%
STATISTICS OR THE PHILIPPINES VALUE
POPULATION (MILLION) 103.3 17.7%
TOTAL :
POPULATION GROWTH RATE (2010–2015)7 1.72 54.8 Mtoe
HOUSEHOLDS (MILLION)8 22.42 1.3% 18.9%
6.0%
URBANISATION (2015-2020) [%]9 1.99
14.9%
GDP GROWTH RATE10 6.7%
ENERGY PRODUCTION (MTOE) 28.5 ■ COAL ■ CRUDE OIL ■ OIL PRODUCTS ■ NATURAL GAS
■ HYDRO ■ GEOTHERMAL ■ BIOFUELS/WASTE
TOTAL PRIMARY ENERGY SUPPLY
(TPES, MTOE) 54.8
FIGURE 6: TOTAL PRIMARY ENERGY SUPPLY (TPES) FOR THE
PHILIPPINES FOR THE YEAR 2016, MTOE = MILLION-TONS OIL
ELECTRIC CONSUMPTION (TWH) 82.5 EQUIVALENT12
CO2 EMISSIONS (MT CO2)11 137
1.4% 3.6%
Most of the Philippines energy is generated from oil and 24.1%
12.2%
oil products (33.8%), coal (26.1%), geothermal, solar and
other renewables (19%) as well as biofuel and waste
(17.7%). The other energy sources (natural gas and
TOTAL :
hydro) supply 7.3%, being minor contributors to the total 31.6 Mtoe
primary energy supply (TPES, see Figure 6).
36.2%
22.5%
Approximately two third of Philippines’ total energy is
consumed by the industry (25%) and the transport (38%)
sector (Figure 7).
■ INDUSTRY ■ TRANSPORT ■ RESIDENTIAL ■ COMMERCIAL
■ AGRICULTURE/FISHING ■ NON-ENERGY USE
FIGURE 7: ENERGY CONSUMPTION BY SECTOR, MTOE = MILLION
TONS OIL EQUIVALENT12
6 https://webstore.iea.org/download/direct/2291?fileName=Key_World_2018.pdf
7 http://psa.gov.ph/population-and-housing
8 http://www.psa.gov.ph/content/housing-characteristics-philippines-results-2015-census-population
9 https://population.un.org/wup/DataQuery/
10 World Bank
11 See https://publications.europa.eu/en/publication-detail/-/publication/41811494-f131-11e8-9982-01aa75ed71a1/language-en
12 https://www.iea.org/statistics/?country=PHILIPPINE&year=2016&category=Energy%20supply&indicator=TPESbySource&mode=table&dataTable=BALANCES
REFRIGERATION AND AIR CONDITIONING GREENHOUSE GAS INVENTORY FOR THE PHILIPPINES 171.5 RAC STAKEHOLDERS
Table 2 provides an overview of the Philippines’ key
institutions from private and public domains relevant for
the climate and energy conservation policy in the RAC
sector as well as key non-state institutions and stake-
holders in the sector.
TABLE 2: OVERVIEW OF INSTITUTIONS RELEVANT FOR THE RAC SECTOR AND THEIR CONTRIBUTION TO THE SURVEY
INSTITUTION/DEPARTMENT DUTIES/FUNCTIONS/RESPONSIBILITIES
THE CLIMATE CHANGE COMMISSION The Climate Change Commission (CCC) is an independent and autonomous
government body. The CCC is under the Office of the President and is the “sole
policy-making body of the government which shall be tasked to coordinate, monitor
and evaluate the programs and action plans of the government relating to climate
change”. The CCC is the political partner for the implementation of the C4 projects
in the Philippines.
ENVIRONMENTAL MANAGEMENT The DENR with its EMB, which has administrative jurisdiction over the POD
BUREAU/DEPARTMENT OF ENVIRON- (below) and its Climate Change Division (CCD), is responsible for the calculation of
MENT AND NATURAL RESOURCES (EMB/ refrigerant related emissions and their management in the Philippines; As mandated
DENR) under Executive Order 174, the Department of Environment and Natural Resources
(DENR) shall take the lead in the GHG Inventory in the Industrial Processes and
Product Use (IPPU). GHG emissions from RAC&F is a one of the IPPU categories as
defined by the IPCC.
DENR is an implementation partner for the C4 project.
THE PHILIPPINE OZONE DESK (POD) AT The POD is the national coordinating body of the Montreal Protocol for the
DENR Philippines with the mandate to manage chemical refrigerants. It has managed the
chlorofluorocarbon (CFC) phase out plan and is currently managing the hydrochloro-
fluorocarbon (HCFC) phase-out plan. The POD is also in charge in managing issues
related to the management of hydrofluorocarbon (HFC) under the Kigali Amendments,
where the ratification of the Philippines is pending. The POD coordinates policies and
climate strategies coordination related to the GHG management of refrigerants,
including national GHG emissions reporting and related inputs to the NDC.
DEPARTMENT OF FINANCE (DOF)/ • Reporting on imports of regulated substances (so far CFCs and HCFCs)
BUREAU OF CUSTOMS (BOC) • Provided the information on codes for appliances
DEPARTMENT OF AGRICULTURE (DA)/ • Provided information on cold store warehouses
NATIONAL MEAT INSPECTION AUTHORITY
DEPARTMENT OF ENERGY (DOE) • Responsible for ensuring energy security of the Philippines. Implements the
renewable energy act and energy efficiency programs. It is an implementing
partner for the project;
• The Lighting and Appliances Testing Laboratory at the Energy Research and Testing
Laboratory Services (ERTLS) and Energy Utilization Management Bureau (EUMB)
provided information on the unitary air conditioning and refrigeration sector
DEPARTMENT OF TRADE AND • Responsible for developing and promoting standards and certification;
INDUSTRY (DTI)/ BUREAU OF PHILIPPINE • Responsible for import licenses;
STANDARDS (BPS)
• Provided the records related to the issuance of certificates for imported units and
certification marks for locally manufactured RAC-equipment
• Provided the information on codes for appliances
DEPARTMENT OF TRANSPORTATION • Responsible for all land transportation in the Philippines, the implementation of
(DOT)/LAND TRANSPORTATION OFFICE transportation laws, rules and regulations;
(LTO)
• Provided data on registered motor vehicles
• Also acted as partner for data on mobile air conditioning and transport
r efrigeration, with assistance of the Philippine Ozone Desk Multilateral Fund (POD
MLF).
18 REFRIGERATION AND AIR CONDITIONING GREENHOUSE GAS INVENTORY FOR THE PHILIPPINESTABLE 2: OVERVIEW OF INSTITUTIONS RELEVANT FOR THE RAC SECTOR AND THEIR CONTRIBUTION TO THE SURVEY
INSTITUTION/DEPARTMENT DUTIES/FUNCTIONS/RESPONSIBILITIES
PHILIPPINE STATISTICS AUTHORITY Census of Philippine Business and Industry
COLD CHAIN ASSOCIATION OF THE • Establishing formal linkages with the government and delineating the role of the
PHILIPPINES private business sector in the food security and development program;
• Spearheading the formulation, promulgation and enforcement of industry standards
necessary to ensure efficient performance of all activities within the cold chain;
and
• Fostering cooperation and coordination among members in addressing industry
concerns, particularly those that pertain to industry development.
PHILIPPINE ASSOCIATION OF BUILDING Internationally affiliated, accredited and the only recognized Association in the
ADMINISTRATORS Philippine Building Management Industry
PHILIPPINE GREEN BUILDING INITIATIVE Non-profit, voluntary group of professional associations involved with the built-
environment who share a common concern on the impacts of global warming and
climate change.
ASHRAE PHILIPPINE CHAPTER An international organization with mission of advancing heating, ventilation, air
conditioning and refrigeration to serve humanity and promote a sustainable world
through research, standards writing, publishing and continuing education.
PHILIPPINE SOCIETY OF VENTILATION; Non-stock, non-profit organization of engineers, consultants, contractors, suppliers
AIR CONDITIONING AND REFRIGERATION and manufacturers directly involved in air-conditioning, ventilating and refrigerating
ENGINEERS (PSVARE) practices.
REFRIGERATION AND AIR CONDITIONING RACTAP is an organization of refrigeration and air conditioning technicians providing
TECHNICIANS ASSOCIATION OF THE training and support to professional RAC technicians.
PHILIPPINES (RACTAP)
1.6 CLIMATE AND F-GAS POLICIES the annual import quotas for HCFCs consistent with the
phase-out schedule of the Montreal Protocol, approves
Regulatory frameworks are required for the implementation importers, and issues import quotas to registered im-
of most changes towards environment-friendlier technology porters in coordination with the Bureau of Customs.
alternatives in the RAC sector. The Philippines signed the
Montreal Protocol on Substances that Deplete the Ozone Policies targeting the RAC sector so far are mainly
Layer on Sept. 14, 1988 and ratified it on March 21, 1991. driven by ODP management under the HPMP.
So far, the Philippines has been compliant with the
Montreal Protocol. The current NDC, which is still under development with
key stakeholders, includes an economy wide target of a
Stage I of the HCFC phase-out management plan (HPMP) 70% reduction of GHG emissions by 2030 compared to
for the Philippines was approved at the 68th meeting to BAU213 . Whilst the NDC states this as an economy-wide
accomplish the 10 per cent reduction from the baseline target, so far, no specific quantitative targets for the
by 2015 resulting in the phase-out of 45.0 ODP tonnes of RAC sector or its subsectors have been included in the
HCFCs. At the 79th meeting, on behalf of the Government of NDC. Discussions for the NDC update 2020 covered en-
the Philippines, the World Bank, as the designated imple- ergy efficiency measures for home appliances, including
menting agency, submitted a request for funding for stage refrigerators and air conditioners, the transition to low
II of the HPMP. The Environmental Management Bureau GWP refrigerants and the enforcement of the building
(EMB) through the Philippine Ozone Desk (POD) establishes code 14 .
13 https://www4.unfccc.int/sites/submissions/INDC/Published%20Documents/Philippines/1/Philippines%20-%20Final%20INDC%20submission.pdf
14 See http://www.climate.gov.ph/images/NDC/Sofitel/02_PH-NDC_Liza-Andres.pdf last accessed 12.02.2019
REFRIGERATION AND AIR CONDITIONING GREENHOUSE GAS INVENTORY FOR THE PHILIPPINES 192 SCOPE OF THE INVENTORY
The inventory covers GHG emissions from the RAC sector TABLE 3: RAC SUBSECTORS AND RELATED SYSTEMS
based on a stock model covering the major RAC sub
sectors and their appliances. The current and future SUBSECTOR SYSTEMS
stock is derived from historic sales figures, while
historic growth trends and dynamics help to determine
UNITARY AIR Window-type air conditioners
the future stock. The emissions are calculated for each CONDITIONING Split residential air condi-
subsector and appliance type based on critical technical tioners
parameters determining direct and indirect emissions. Split commercial air condi-
tioners
The inventory covers the following elements: Duct split residential air
conditioners
»»The calculated mitigation potential of the RAC sector Commercial ducted splits
of the Philippines using the guidelines of the Inter Rooftop ducted
governmental Panel on Climate Change (IPCC); Multi-splits
CHILLERS Air conditioning chillers
»»for each of the subsectors and their respective
appliance types (Table 3), an inventory of historic and MOBILE AIR Car air conditioning
future unit sales and stock data is established; CONDITIONING Large vehicle air conditioning
»»for each appliance type, the historic, current and DOMESTIC Domestic refrigerators
future energy and refrigerant use and their respective REFRIGERATION
emissions are estimated; COMMERCIAL Stand-alone equipment
REFRIGERATION Condensing units
»»currently deployed RAC technologies are compared Centralized systems for
with international best practice technologies for their supermarkets
potential to mitigate GHG emissions on a unit basis;
»»Future trends of RAC subsectors are analysed both
with respect to BAU and mitigation scenarios. This document presents preliminary results based on
statistical data, questionnaires, interviews, workshop
The RAC subsectors and all appliances covered by the feedback, methodology and assumptions.
inventory are categorized according to key subsectors as
outlined in the RAC NAMA Handbook, Module 1: Inventory Future projections have been included, mostly using
(Heubes and Papst, 2014) and further illustrated in Table growth rates based on expert judgements or economic
25 and Table 26 of the Annex. growth projections.
As outlined in the methodology below, the inventory
is based on actual emissions gathered at the unit or
appliance level. This methodology is also applied for the
calculation of appliance related refrigerant emissions
as opposed to inventory methodologies based on the
bulk refrigerant consumption across different sectors.
The latter approach is usually applied for estimating
emissions as part of ozone depleting substances (ODS)
alternative surveys.
20 REFRIGERATION AND AIR CONDITIONING GREENHOUSE GAS INVENTORY FOR THE PHILIPPINES© FreePhotos / pixabay
2.1 METHODOLOGY
The methodology adopted for the report draws on the
concepts outlined by Heubes et al. (Heubes and Papst,
2014), Penman et al. (2006) and on the IPCC Tier 2 TIER 1 TIER 2
methodology from 2006. It should be noted that the
word ‘system’ is used interchangeably in this report
with the words ‘appliance’, ‘equipment’ or ‘unit’.
Potential emission
i A t emission
Actual
While alternative refrigerant inventories, such as ODS
alternative surveys, are typically based on the Tier 1
methodology, this inventory is based on the IPCC
Tier 2 methodology to cover not only refrigerant-related
emissions and their mitigation options, but also GHG consumption often Activities leading to
emissions from energy use and their mitigation o ption. aggregated on entire emissions disaggregated
country on subsector basis
In addition, the Tier 2 methodology allows for the prepa-
ration of GHG mitigation actions (such as NAMAs) in
relevant RAC subsectors and further NDC development
and review. As Tier 2 inventories are based on unit
appliances, an MRV system of mitigation efforts can be Number of appliances &
established at the unit level. technical parameters
Tier 1 and Tier 2 methodologies have the following basic
differences15:
ODS alternatives UNFCCC Common Reporting
survey under the MP Format - Category 2:
»»Tier 1: emissions are calculated based on an
aggregated sector-based level (Heubes and Papst, Industrial Processes
Reporting under and Product Use:
2014; Penman, 2006).
Article 7 of MP
Refrigeration/AC and Foam
»»Tier 2: emissions are calculated based on a
disaggregated unit-based level (Heubes and Papst,
2014; Penman, 2006). Approaches for Refrigerant
Direct Emissions distribution
The difference between the Tier 1 and Tier 2
methodology are further illustrated in Figure 8. Graphic Key
Mitigation action planning
Approaches in contribution to NDCs
Data used for
for estimates (e.g. NAMA)
Figure 8: Approaches for
GHG emission
estimates relevant indirect direct
to the RAC&F emissions emissions
sector
15 Please note that sector and application here are used in the context of this report, FIGURE 8: APPROACHES FOR GHG EMISSION ESTIMATES RELEVANT
where IPCC 2006 methodology refers to sector as application and application as
sub-application TO THE RAC&F SECTOR (MUNZINGER ET AL., 2016)
REFRIGERATION AND AIR CONDITIONING GREENHOUSE GAS INVENTORY FOR THE PHILIPPINES 21© Sunti / Shutterstock.com
The Tier 2 methodology used in this report accounts for include refrigerant emissions from leakage of refrigerant
direct and indirect emissions at the unit level as illus- gases during manufacture, servicing, operation and at
trated in Figure 9 for the stock of appliances in use, end-of-life of cooling appliances. The Tier 2 methodology
their manufacturing and disposal emissions. Indirect goes beyond the Tier 1 approach, which only focuses on
emissions result from electricity generation for cooling, the demand and use of refrigerants. The Tier 1 approach
considering the annual electricity consumption and the does not include indirect emissions from the energy use
Philippines’ grid emission factor (GEF). Direct emissions of appliances.
Production of
Appliances Stock (= Appliances in Use) -> Bank
(First Fill)
Manufacture In-Use Disposal Energy
Emissions Emissions (Refill) Emissions Consumption
Fill Refill Direct Emissions Indirect Emissions
Demand Total Emissions
FIGURE 9: OVERVIEW RAC REFRIGERANT DEMAND VERSUS RAC TOTAL EMISSIONS
22 REFRIGERATION AND AIR CONDITIONING GREENHOUSE GAS INVENTORY FOR THE PHILIPPINESRefrigerant consumption is accounted for at all stages »»Secondary data was used from Department of Energy -
during the product life of the equipment: Lighting and Appliance Testing Laboratory (DOE-LATL17,
ASEAN-Shine18 , BRG Building Solutions19 and from the
»»Refrigerants that are filled into newly manufactured Department of Environment and Natural Resources -
products Environmental Management Bureau (DENR-EMB) 20
HPMP Baseline Survey. Some data was aggregated from
»»Refrigerants in operating systems (average annual World Air Conditioner Demand by Region Report from
stocks) The Japan Refrigeration and Air Conditioning Industry
Association (JRAIA, 2018)21. Data for the mobile AC
»»Refrigerants remaining in products at decommissioning subsector was taken from the Land Transportation Of-
fice (LTO) 22 . The data was compared and updated with
data from the Philippines Room Air Conditioner Market
2.2 DATA COLLECTION PROCESS Assessment and Policy Options report (CLASP, 2019)23 .
The following steps were taken to complete the inventory: »»Tertiary data was used to fill gaps, where other data
was not available. The stock number of the domestic
Step 1. National kick-off workshop with relevant stake- and the commercial subsector (e.g. stand-alone units,
holders on 27th of September 2016. condensing units and centralized systems for super-
markets were inserted based on estimates carried out
Step 2. Preparation of questionnaires and list of stake- in the GCI Database 24 (‘Green Cooling Initiative’, 2013).
holders for selected subsectors. Detailed questionnaires
were prepared for manufacturers in the sub-sectors AC The following challenges were encountered during data
and domestic refrigeration. collection for this inventory from primary data resources:
Step 3. Sending questionnaires to stakeholders. »»Reluctance to provide information or willingness
to provide only partial information due to the
Step 4. Face-to-face interviews with stakeholders to confidentiality policy of the companies.
explain the required data.
»»Difficulties with filling out questionnaires on the part
Step 5. Validation checks of primary data and gathering of the companies; questionnaires had to be explained
of complementary information from secondary and ter- during personal visits to get information.
tiary data, call-backs and compilation of data received
through questionnaires into the master sheets from data »»No customs data on imported equipment or car
entry forms. registration records could be collected.
Step 6. Verification of data during a national inventory »»Despite multiple feedback loops, the attribution of
workshop in Manila on the 29th of May 2018. collected equipment data to the appliance groups
defined in the inventory was difficult. Some appliance
»»For primary data, a survey was conducted among groups such as self-contained AC were left empty. It
manufacturers of unitary AC and domestic refrigeration is assumed that those categories are included in other
equipment such as Kolin, LG, Concepcion Carrier and groups, but this could not be verified.
Daikin. Manufacturers were contacted individually or
through associations, four of them provided data16 . The Due to those difficulties, the primary data collected
domestic refrigeration subsector was supplemented by was found incomplete and estimates from s takeholders
data from the GCI Database (‘Green Cooling Initiative’, were often used instead of the collected data. The assump-
2013). tions are presented in detail in the following chapters.
16 A complete list of approached and responding companies is provided in the Annex
17 https://www.doe.gov.ph/ertls
18 https://storage.googleapis.com/clasp-siteattachments/ASEAN_SHINE_AC_Regional_Roadmap__Report_Final-new-2.pdf
19 http://www.brgbuildingsolutions.com/industry-sectors/air-conditioning-heating-ventilation-market-research-reports-data
20 https://emb.gov.ph/
21 https://www.jraia.or.jp/english/World_AC_Demand.pdf
22 http://www.lto.gov.ph/
23 https://clasp.ngo/publications/philippines-rac-market-assessment-and-policy-options-analysis-2019
24 http://www.green-cooling-initiative.org/
REFRIGERATION AND AIR CONDITIONING GREENHOUSE GAS INVENTORY FOR THE PHILIPPINES 232.3 MODELLING PARAMETERS and information from interviews where possible. Gaps
were filled with default values obtained from the Green
For the analysis of this inventory the modelling Cooling database. The major stakeholders consented to
parameters derived from primary and secondary data the preliminary data, but it is important to note that
collection as shown in Table 4 were applied. The this is mainly due to the lack of comparison data in the
modelling parameters are derived from questionnaires Philippines.
TABLE 4: MODELLING PARAMETERS FOR BAU SCENARIO
EQUIPMENT TYPE LIFETIME MAIN INITIAL EER SERVICE DISPOSAL
[YEARS] REFRIGERANTS CHARGE (IC) (2017) EMISSION EMISSION
[KG] FACTOR25 FACTOR
[% OF IC] [% OF IC]
WINDOW TYPE AC 8 R410A, R22, 0.8 3.29 10% 95%
R32
SPLIT RESIDENTIAL AC 8 R410A, R22, 0.65 3.5 10% 95%
R32
SPLIT COMMERCIAL AC 10 R410A, R22 2.9 3.15 10% 80%
ROOFTOP DUCTED 10 R22, R407C, 2 3.38 5% 75%
R410A
MULTI-SPLITS 15 R22, R407C, 3.325 3.27 10% 80%
R410A
AIR CONDITIONING CHILLERS 20 R134a, R123 35 2.79 22% 95%
CAR AIR CONDITIONING 15 R134a 0.6 2.71 20% 100%
LARGE VEHICLE AIR CONDITIONING 15 R134a 8 2.71 30% 80%
DOMESTIC REFRIGERATION 20 R134a, R600a 0.175 1.42 2% 80%
STAND-ALONE EQUIPMENT 15 R134a 0.8 1.42 3% 80%
CONDENSING UNITS 20 R134a 4 2.21 30% 85%
CENTRALIZED SYSTEMS FOR 20 R22, R134a 230 1.73 38% 90%
SUPERMARKETS
The grid emission factor (GEF) is a measure of CO 2 No substantial indications from industry representatives
emission intensity per unit of electricity generation in were provided for the future growth rates of appliances.
the total grid system. In the presented study the GEF of Therefore, growth rates are derived from the historic
0.63 26 has been used. As there are no future predictions growth rates and trends were conservatively applied for
of a potential GEF, which can be implemented in the modelling future unit sales in the respective subsectors
model, the data presented in this report uses the same as listed in Table 5.
GEF for the BAU and the MIT scenario.
25 Values taken from http://www.green-cooling-initiative.org and modified according stakeholder/industry consultation
26 https://pub.iges.or.jp/pub/list-grid-emission-factor
24 REFRIGERATION AND AIR CONDITIONING GREENHOUSE GAS INVENTORY FOR THE PHILIPPINES© GIZ / Proklima
TABLE 5: ASSUMED FUTURE GROWTH RATES OF APPLIANCE SALES
SUBSECTORS APPLIANCE TYPES 2016-2020 2021-2030 2031-2050
UNITARY AIR CONDITIONING Window-type air conditioners 4.5% 2.3% 0.6%
UNITARY AIR CONDITIONING Split residential air 7.5% 5.0% 3.3%
conditioners
UNITARY AIR CONDITIONING Split commercial air 7.5% 2.5% 0.6%
conditioners
UNITARY AIR CONDITIONING Rooftop ducted 7.5% 2.5% 0.6%
UNITARY AIR CONDITIONING Multi-splits 4.5% 1.5% 0.3%
CHILLERS Air conditioning chillers 1.7% 0.6% 0.1%
MOBILE AIR CONDITIONING Car air conditioning 2.5% 0.8% 0.2%
MOBILE AIR CONDITIONING Large vehicle air conditioning 1.2% 0.4% 0.1%
DOMESTIC REFRIGERATION Domestic refrigeration27 2% 2% 2%
COMMERCIAL REFRIGERATION Stand-alone equipment 1.7% 0.6% 0.1%
COMMERCIAL REFRIGERATION Condensing units 1.7% 0.6% 0.1%
COMMERCIAL REFRIGERATION Centralized systems for 1% 0.3% 0.1%
supermarkets
COMMERCIAL REFRIGERATION Centralised supermarket units 3.2% 0.4% 0.1%
Growth is estimated using CAGR between 2018 and 2050
27
REFRIGERATION AND AIR CONDITIONING GREENHOUSE GAS INVENTORY FOR THE PHILIPPINES 253 RESULTS
3.1 SUBSECTOR SALES AND 3.1.1 UAC sales and stock data
STOCK DATA ANALYSIS
The total sales of unitary air conditioning appliances
The data was acquired and analysed by subsectors have been steady, with a rising trend in the last years
according to the classification presented in section 2.2; and current amounts of over 800,000 units a year. The
the results are presented and described below. biggest sales share are window type air conditioners,
followed by split residential air conditioners. In the near
The process of secondary data collection and review future it is assumed that the split air conditioners will
targeted both locally manufactured and imported be the technology of choice in the Philippines.
equipment. The sales and stock development in the
key subsectors were examined. The stock analysis
considers the phase-in of new equipment driven by the
sales d
evelopment and the phase-out of old equipment
considering standardised assumptions for the lifetime
of the equipment.
900.000
800.000
700.000
600.000
Sold units
500.000
400.000
300.000
200.000
100.000
0
2010 2012 2014 2016
■ WINDOW-TYPE AIR CONDITIONERS ■ SPLIT RESIDENTIAL AIR CONDITIONERS ■ SPLIT COMMERCIAL AIR CONDITIONERS
■ ROOFTOP DUCTED ■ MULTI-SPLITS
FIGURE 10: UNITARY AC UNITS SOLD (2010 TO 2016)
26 REFRIGERATION AND AIR CONDITIONING GREENHOUSE GAS INVENTORY FOR THE PHILIPPINES© terimakasih0 / pixabay
16
14
12
Stock units (millions)
10
8
6
4
2
0
2010 2015 2020 2055 2030 2035 2040 2045 2050
■ WINDOW-TYPE AIR CONDITIONERS ■ SPLIT RESIDENTIAL AIR CONDITIONERS ■ SPLIT COMMERCIAL AIR CONDITIONERS
■ COMMERCIAL DUCTED SPLITS ■ ROOFTOP DUCTED ■ MULTI-SPLITS
FIGURE 11: UNITARY AC UNIT STOCK HISTORIC AND FORECASTED (2010 TO 2017; 2018 TO 2050)
The stock model shows that there are currently around 3.1.2 AC chillers sales and stock data
7 million appliances on the Philippine market and rapid
growth of the stock is expected starting from year 2025, According to the acquired data, a significant increase in
assumedly due to the phase-in of new appliances and the numbers of chillers has been observed in the last 3
increase in local production/manufacturing. The current years.
breakdown by appliances
■ WINDOW-TYPE is shown ■inSPLIT
AIR CONDITIONERS Figure 11. AIR CONDITIONERS ■ SPLIT COMMERCIAL AIR CONDITIONERS
RESIDENTIAL
■ COMMERCIAL DUCTED SPLITS ■ ROOFTOP DUCTED ■ MULTI-SPLITS
TABLE 6: SOLD UNITS FOR THE AC CHILLER SUBSECTOR FOR THE YEARS 2010 TO 2015
SUBSECTOR 2010 2011 2012 2013 2014 2015 2016
AC CHILLERS 290 330 310 340 370 400 450
REFRIGERATION AND AIR CONDITIONING GREENHOUSE GAS INVENTORY FOR THE PHILIPPINES 27You can also read