Frequency Sharing for Radio Local Area Networks in the 6 GHz Band January 2018 Version 3 - Amazon S3
←
→
Page content transcription
If your browser does not render page correctly, please read the page content below
Frequency Sharing for Radio Local Area Networks
                           in the 6 GHz Band
                              January 2018
                                 Version 3

Prepared by:
RKF Engineering Solutions, LLC
7500 Old Georgetown Road
Bethesda, MD

Prepared for:
Apple Inc., Broadcom Limited, Cisco Systems, Inc., Facebook Inc., Google LLC,
Hewlett-Packard Enterprise, Intel Corporation, Microsoft Corporation, MediaTek
Inc., and QUALCOMM Incorporated

                                       1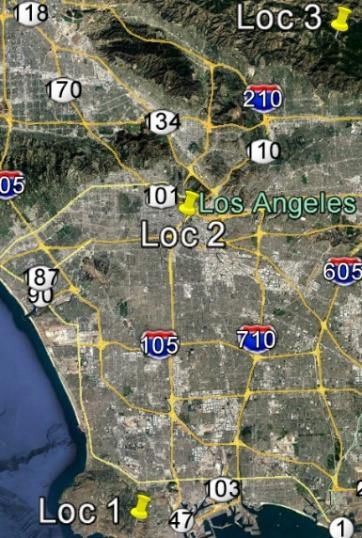
Table of Contents
Table of Contents ............................................................................................................................ 2
Change History ............................................................................................................................... 4
1.0       Executive Summary ............................................................................................................. 5
   Fixed Satellite Service .............................................................................................................. 5
   Fixed Service ............................................................................................................................. 6
   Mobile Service ........................................................................................................................... 8
2.0 Introduction ............................................................................................................................. 10
   2.1 Background ......................................................................................................................... 10
   2.2        Objectives ....................................................................................................................... 10
   2.3        Approach ........................................................................................................................ 10
3.0       RLAN Deployment and Operating Assumptions .............................................................. 13
   3.1        RLAN Deployment Assumptions .................................................................................. 13
      3.1.1        Number of Active RLANs and Deployment Distribution ....................................... 13
      3.1.2        Population Density ................................................................................................... 17
   3.2        RLAN Operating Assumptions ...................................................................................... 17
      3.2.1        Distribution of Source RLAN Power Levels ........................................................... 18
      3.2.2        Bandwidth and Channel Distribution....................................................................... 25
      3.2.3        Distribution of RLAN heights ................................................................................. 25
   3.2.4 RLAN Operating Mitigations ........................................................................................ 27
   3.2.5 Interference Protection Criteria and Further Considerations ......................................... 28
      3.2.5.1 Conservative Interference Threshold ....................................................................... 28
      3.2.5.2 Typical Parameters and Effects that Reduce Interference Not Included in this
      Analysis 29
4.0       Propagation Models ........................................................................................................... 32
   4.1        RLAN to FSS Propagation Models (Earth to Space) ..................................................... 32
   4.2        RLAN to Terrestrial FS or MS Propagation Models ..................................................... 33
      4.2.1        Selection of Propagation Models up to 1 km ........................................................... 34
      4.2.2        Selection of Propagation Models beyond 1 km ....................................................... 35
5.0       Sharing Results .................................................................................................................. 37
   5.1        FSS Uplink Sharing........................................................................................................ 37
      5.1.1        FSS Uplink Typical Performance Parameters ......................................................... 37
      5.1.2        Existing FS Interference to FSS Satellites ............................................................... 40
      5.1.3        RLAN Interference to the FSS Satellite................................................................... 42
      5.1.4        RLAN FSS Sharing Results ..................................................................................... 43

                                                                        2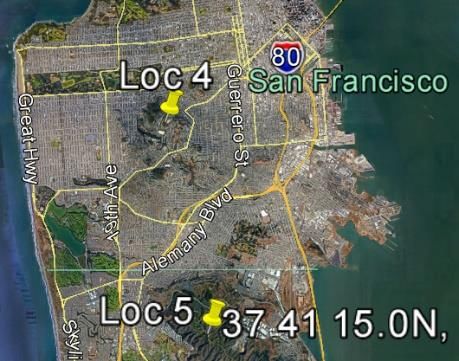
5.2       FS Sharing ...................................................................................................................... 45
    5.2.1        ULS Database Review ............................................................................................. 45
    5.2.2        CONUS Wide FS Aggregate Interference Simulation ............................................ 46
    5.2.3        FS Link Availability Without RLAN Interference .................................................. 48
    5.2.4        FS Link Availability with RLAN Interference ........................................................ 52
    5.2.5        Overload and RLAN Out of Band Emissions Requirements................................... 53
    5.2.6        FS Sharing Conclusions ........................................................................................... 54
  5.3       MS Sharing..................................................................................................................... 55
    5.3.1        MS Usage Studied.................................................................................................... 55
    5.3.2        MS Simulation ......................................................................................................... 55
    5.3.3        MS Sharing Results.................................................................................................. 58
    5.3.4        MS Sharing Conclusions.......................................................................................... 60
Appendix A – ITU, FCC CFR, and IBFS Information ................................................................. 62

                                                                      3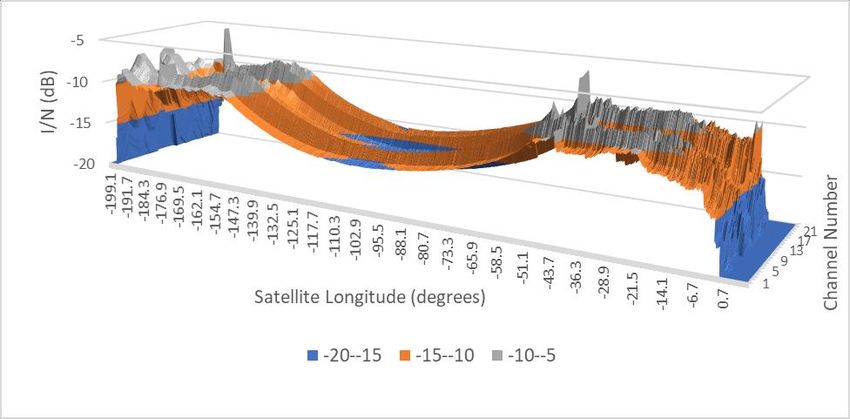
Change History

Date        Version Description                                        Author
            Number
24 Jan 2018         Initial Release                                    T Pinney
13 Feb 2018    2    Corrected minor typo in Section 3.2.5.1. changed   T Pinney
                    “6dB” to “-6dB” in 3rd paragraph
22 Mar 2018    3    Minor edits to Section 4.1 and 4.2                 T Pinney

                                          4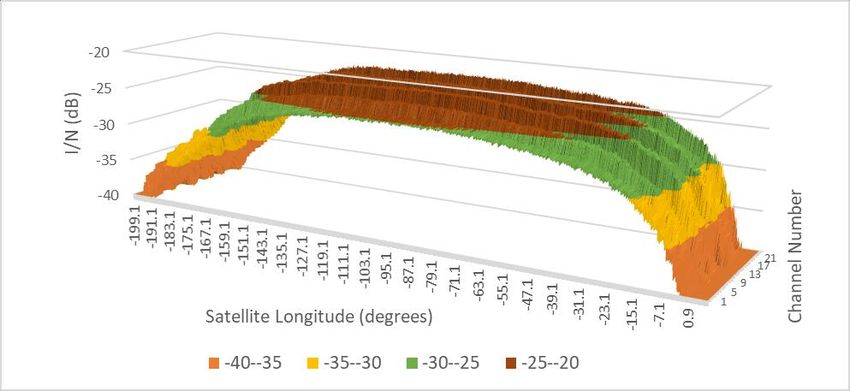
1.0     Executive Summary
In the United States, the 5.925 to 7.125 GHz band (6 GHz band) is shared primarily by two
services: Fixed Satellite Service (FSS) uplinks1 and fixed microwave (Fixed Service or FS) links.
Portions of this band are also used by the Mobile Service (MS) for public safety and electronic
news gathering applications such as TV Broadcast Auxiliary and Cable Relay Services. In light
of recent regulatory developments,2 RKF Engineering Solutions, LLC (RKF), analyzed the
potential impact of unlicensed Radio Local Area Network (RLAN)3 devices on existing 6 GHz
FSS, FS, and MS operations in the 48 contiguous United States (CONUS).
The results of this analysis show that a national deployment of RLAN devices (RLANs) in the 6
GHz band, using established RLAN mitigation techniques and regulatory constraints similar to
those applied in the neighboring 5 GHz band,4 will be complementary in spectrum utilization to
these primary services and will not cause harmful interference.
Fixed Satellite Service
In the 5.925-6.425 GHz uplink band, RKF analyzed the interference from all registered FS
stations to establish an interference baseline for subsequent RLAN analysis. Our study shows
that the worst-case scenario for potential aggregate FS-to-FSS interference occurs toward the
horizon, and only on those satellites located well to the east and west of CONUS. We then
modeled a national deployment of RLANs and found that the maximum interference to noise
ratio (I/N) into FSS receivers was -21.9 dB, well below the applicable interference protection
criteria (IPC) and significantly less than the interference FSS presently receives from existing FS
microwave transmissions.

1
  Paired with FSS downlinks in 3.4-4.2 GHz band.
2
  In the Matter of Expanding Flexible Use in Mid-Band Spectrum Between 3.7 and 24 GHz, Notice of Inquiry, 32
FCC Rcd. 6373 (2017) (NOI).
3
  RLAN is a generic term used to describe a device that provides local area network connections between various
electronic devices. While Wi-Fi is one type of RLAN, this study applies to other RLANs with Unlicensed National
Information Infrastructure (U-NII) operating characteristics.
4
  47 C.F.R. § 15.407(a)(1).

                                                       5
Figure 1-1 - I/N Due to FS and RLAN Transmitters in 5.925-6.425 GHz to FSS Satellites with Visibility to CONUS

We also noted a stark contrast when comparing the results of RLAN interference into FSS versus
FS interference into FSS: the highest levels of RLAN interference into FSS were in the orbital
locations with the lower levels of FS-to-FSS interference, and the orbital locations with the
highest levels of FS-to-FSS interference had the lowest levels of interference from RLANs. This
indicates that RLAN and FS interference are relatively independent of each other, which
significantly reduces the overall RLAN interference potential to FSS. In light of these analyses,
we conclude that a national deployment of RLAN devices in the 6 GHz band can share the
spectrum without harmful interference to existing FSS services.
Fixed Service
To assess FS protection, we analyzed the potential impact a national RLAN deployment would
have on the more than 91,000 FS links operating in CONUS. Because these links include critical
infrastructure, public safety, and other important services, they are designed to maintain a high
level of availability. As such, the key criterion we evaluated was the impact RLAN devices
would have on the availability of FS links. The first step was to characterize aggregate potential
interference into FS receivers from a nationwide deployment of RLANs. Ten CONUS-wide
simulations were performed corresponding to more than 910,000 different RLAN-to-FS
interference morphologies and time instances. These simulations demonstrated that
approximately 99.8% of the FS stations within CONUS had aggregate interference levels from
RLAN operations below the target interference-to-noise (I/N) criteria of -6 dB.5 For the
remaining 2/10ths of 1% (165 FS links), where the threshold was above the target, the results

5
  To avoid interference to FS receivers in the 6 GHz band, the I/N threshold should not exceed -6 dB. See, e.g, In
the Matter of Higher Ground LLC Application for Blanket Earth Station License, Order and Authorization, 32 FCC
Rcd. 728, ¶ 16 (2017).

                                                            6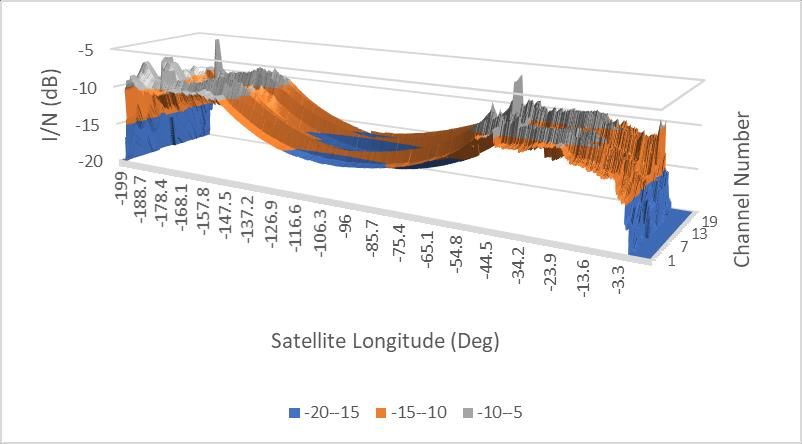
showed the affected sites to be highly random and caused by a single or small number of
dominant interferers proximate to, or operating in the main beam of, the FS receiver.

          Figure 1-2 - Distribution of RLAN-to-FS Interference across 910,000 Morphologies & Time Instances

To account for the temporal variation of RLAN transmissions within the 165 FS links, we
performed 1,000 additional RLAN interference simulations. Even for this set of worst-case
geometry simulations, which corresponded to 165,000 RLAN-to-FS interference morphologies
and time instances, an I/N greater than -6 dB occurred just 1,052 times (or 0.64%) with 1,025 of
those instances caused by single entry interference. Thus, RLAN devices do not pose any
substantial aggregate interference risk to FS receivers.
To evaluate the dominant single interferers and calculate their impact on FS link unavailability, a
distribution was generated for each of the 165 FS links. Links designed to 99.999% availability
(i.e., approximately 315 seconds of downtime per year), incurred approximately 8 seconds of
additional downtime per year, and links designed to 99.9999% availability (i.e., approximately
31.6 seconds of downtime per year) incurred approximately 0.8 seconds of additional downtime
per year. Even for these worst-case scenarios, the resulting impact on FS availability and quality
of service delivered over these FS links from the introduction of RLAN devices falls within the
existing availability design margin and does not cause harmful interference.

                                                         7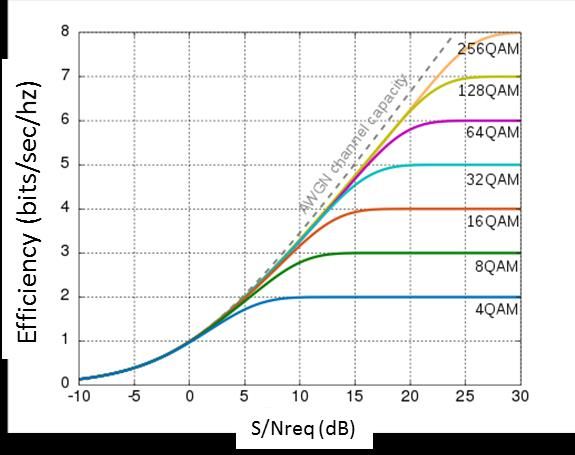
Figure 1-3 - Link Unavailability for Worst-case Links Without (Fade+Uncorr Rain) and
                                With RLAN Interference (Fade+Uncorr Rain+RLAN)

This study also demonstrates that individual RLANs situated on high floors, at close range,
through a window, or other corner case geometries do not pose a harmful interference risk to FS
receivers. We find that the rate of occurrence of such geometries is extremely low—on the
order of two-tenths of one percent. Further, we show that the cumulative statistical effect of such
occurrences does not cause any FS links in CONUS to fall below its availability design target.
Mobile Service
Finally, RKF determined that the worst-case mobile links would involve trucks communicating
to base stations located on towers, buildings, or mountains. In these scenarios, the base station is
pointing toward the ground and it is possible for the RLANs to be in the base station main beam.
For the simulation, several Broadcast Auxiliary Service (BAS) base stations were selected in San
Francisco and Los Angeles to reflect this worst-case geometry.

                                                        8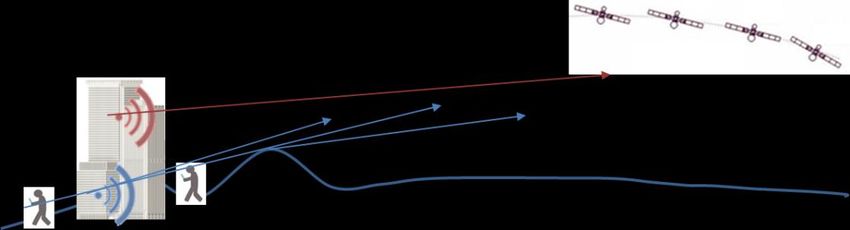
Figure 1-4 - Probability of Aggregate RLANs I/N Exceeding an I/N Level (x-axis) for TP1, TP2, TP3, TP4 and TP5

A simulation was performed 10,000 times to determine the aggregate interference from RLANs
to the MS base station receivers. For each iteration of the simulation, RLANs were randomly
deployed, with weighting according to population density. Then the simulation was run with the
vehicular MS transmitter randomly deployed within the base station operating radius. The
modeled RLAN operations did not cause a degradation in service approximately 99% of the
time. In the remaining 1%, an improvement in fade margin could be achieved in a manner
consistent with current operational practices (e.g., by optimizing the transmitter location,
reducing the data rate, using adaptive coding, and modulation). Further, by its very nature, MS
operating conditions within a desired coverage area are highly variable and additional RLAN
interference does not cause a material impact on MS performance.

                                                           9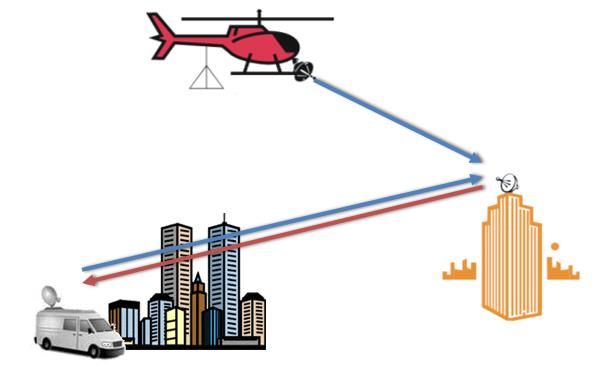
2.0 Introduction
2.1 Background
On August 3, 2017, the Federal Communications Commission (FCC or Commission) released an
NOI to study mid-band frequencies for wireless broadband use.6 The Commission believes that
exploring options to expand spectrum access opportunities in mid-band frequencies could further
its goal of establishing comprehensive, sound, and flexible policies that enable innovations and
investment to keep pace with technological advances, and maintain U.S. leadership in
deployment of next-generation wireless broadband services.
Over the next four years, U.S. wireless data services are expected to increase 500%, the number
of connected devices is predicted to more than double to one billion, and demand for unlicensed
spectrum is expected to grow significantly. As an example of unlicensed demand, more than
half of all internet traffic is predicted to be carried over RLAN networks by 2021.7 To address
this critical need for expanded spectrum access, a broad-based coalition of mobile operating
system providers, semiconductor manufacturers, content providers, and access point equipment
manufacturers, including Apple, Broadcom, Cisco, Facebook, Google, Hewlett-Packard
Enterprise, Intel, MediaTek, Microsoft, and Qualcomm, retained RKF to perform an independent
assessment of a nationwide deployment of RLANs in the 6 GHz band.
RKF has a long history of performing these types of technical analyses in support of FCC
initiatives, specifically in spectrum sharing studies that involve fixed and mobile wireless
services delivered through terrestrial and satellite links, including in the 6 GHz band. Using
publicly available FCC licensing data for terrestrial and satellite systems, including performance
parameters for fixed and mobile wireless services, RKF simulated nationwide deployments of
RLANs and analyzed the feasibility of RLAN sharing within the 6 GHz band with existing
wireless services.
2.2     Objectives
This report evaluates sharing possibilities of RLANs with existing services in the 6 GHz band.
2.3     Approach
Current services and uses of the 6 GHz band are considered. Consistent with the FCC’s Table of
Frequency Allocations,8 incumbent services with primary allocation within the 6 GHz band are
indicated in Figure 2-1.

6
  32 FCC Rcd. 6373 (2017).
7
  ITI, Broad-Based Coalition Applauds FCC for New Mid-Band Spectrum Notice of Inquiry, Aug. 3, 2017,
https://www.itic.org/news-events/news-releases/broad-based-coalition-applauds-fcc-for-new-mid-band-spectrum-
notice-of-inquiry.
8
  FCC Online Table of Frequency Allocations, Dec. 13, 2017, https://transition.fcc.gov/oet/spectrum/table/
fcctable.pdf.

                                                      10
Figure 2-1 – Incumbent Services with Primary Allocation Within 5.925-7.125 GHz
Because most spectrum within CONUS in the 6 GHz band is allocated to FSS uplink, FS, and
MS, this report focuses only on these sharing scenarios.9
A detailed CONUS-wide simulation of the interference environment was developed and RKF
ensured its simulation was a conservative representation of the interference environment by:
1) Including the maximum number of incumbent stations listed in FCC databases and
deriving all operating data from publicly available records. Such FCC databases include:
the International Bureau Filing System (IBFS) and FSS filings as of May 31, 2017); the
Universal Licensing System (ULS) and FS and certain MS terrestrial systems as of
March 21, 2017;10 and the Cable Operations and Licensing System (COALS) for mobile
Cable Television Relay Service (CARS) terrestrial systems as of July 19, 2017. We note,
however, that using all stations found in the FCC’s IBFS, ULS, and COALS databases
likely overstates actual incumbent operations because a number of registered facilities are
out of service;
2) Using US Census Bureau (USCB) 2020 estimated population density maps and
definitions of urban, suburban, and rural areas. As described in Section 3.1.2, urban and
suburban areas comprise only 5% of CONUS land area but contain over 80% of the
population, implying that interference will be concentrated predominately in these areas.
Including rural areas, 90% of the population is in urban, suburban, or rural CONUS,
occupying 10% of the geography. The remaining 10% of the population is widely spread
9
Radio Astronomy and Earth Exploration Satellite Services (EESS)/Space Research Service (SRS) sharing
scenarios are not considered in this report.
10
For instances where records were incomplete, we used representative data based on the means within the FCC’s
ULS database.
11out in “barren” areas that were excluded from the simulation for two main reasons: the
extremely low population density and the continued use of legacy RLANs that do not
operate at 6 GHz. The low population density implies a very low probability of
congested spectrum and therefore users would not need to expand out of legacy bands;
3) Using realistic but conservative RLAN operating and deployment assumptions as
described in Section 3.0. These were based on existing and projected market data, usage,
and performance and include:
a) Full CONUS simulation of an RLAN deployment;
b) Approximately 1 billion 6 GHz capable RLAN devices;
c) A very high installed base of 6 GHz capable RLAN devices (45%) assumed in
2025, which is more likely to be a 2035 projection;
d) A higher average Equivalent Isotropic Radiated Power (EIRP) than ITU-R
WP5A document (see Section 3.2.1);
e) Significantly higher EIRP above 30° elevation of 1 watt (30 dBm) as
compared with U-NII-1 rules which limit maximum EIRP to 125 mW (21 dBm);
f) A conservative assumption of the number of thermally efficient buildings
(affecting penetration loss) of 20% vs 30% used in WP5A;
g) Doubling published market research on outdoor RLAN equipment shipments
to estimate more rapid growth scenarios; and
h) Conservative propagation and clutter models for various environments as
described in Section 4;
4) Diversity and/or Multiple-Input-Multiple-Output (MIMO) processing gains were not
considered for FS;
5) Using worst case scenarios to represent possible situations;
6) Executing numerous different scenarios with a wide variation of propagation paths
and RLAN deployment configurations to ensure statistically significant results. USCB
definitions are used to partition the CONUS into urban, suburban, and rural areas and a
USCB 2020 projected CONUS population density was used to randomly deploy RLANs
for each simulation iteration;
7) An I/N of -6 dB was used as a comparison threshold in this study with the
understanding that the analysis in this report is very conservative and did not take into
account many factors that would lower the aggregate I/N (see Section 3.2.5.2).
Simulation results are presented and analyzed in Section 5. FSS uplinks are reviewed in Section
5.1, FS links are covered in Section 5.2, and MS link results are described in Section 5.3.
123.0 RLAN Deployment and Operating Assumptions
This section describes the analysis and methodology for assigning source quantities to the
proposed 6 GHz band RLANs and their operating parameters.
3.1 RLAN Deployment Assumptions
3.1.1 Number of Active RLANs and Deployment Distribution
Table 3-1 depicts the parameters and calculations used to develop the numbers of active RLANs.
As noted above, this study applies to all RLANs that comply with U-NII operating
characteristics, including but not limited to Wi-Fi Access Points (AP) and stations.
At a first level, the deployment of RLANs is assumed to be closely associated with population
density, and therefore geographically allocated according to the population distribution in
CONUS. The basis of the active device analysis is an estimated US population of 347 million in
2025. As described in Section 3.1.2, we used USCB population thresholds that define urban,
suburban, and rural areas, to determine population density across CONUS.
TOTAL URBAN SUBURBAN RURAL
Population (%) 90% 70% 10% 10%
User Type All Corp Public Home Corp Public Home Corp Public Home
Type (%) All 10% 5% 85% 5% 5% 90% 2% 1% 97%
Device Population 958,062,017 74,515,935 37,257,967 633,385,445 5,322,567 5,322,567 95,806,202 2,129,027 1,064,513 103,257,795
High Activity Device 10% 10% 10% 10% 10% 10% 10% 10% 10%
Population (% of Total)
Data/device/hour,
(MBytes) 1000 500 2000 1000 500 2000 1000 500 2000
Device Rate (Mbps) 2.22 1.11 4.44 2.22 1.11 4.44 2.22 1.11 4.44
Link Speed (Mbps) 1000 1000 1000 1000 1000 1000 1000 1000 1000
Duty Cycle per Device 0.22% 0.11% 0.44% 0.22% 0.11% 0.44% 0.22% 0.11% 0.44%
Instantaneous Number
of Transmitting 6 GHz 393,042 16,559 4,140 281,505 1,183 591 42,581 473 118 45,892
Devices (Subtotal, High
Activity)
Low Activity Device 90% 90% 90% 90% 90% 90% 90% 90% 90%
Population (% of Total)
Data/device/hour,
(Mbytes) 1 1 1 1 1 1 1 1 1
Device Rate (Mbps) 0.0022 0.0022 0.0022 0.0022 0.0022 0.0022 0.0022 0.0022 0.0022
Link Speed (Mbps) 1000 1000 1000 1000 1000 1000 1000 1000 1000
Duty Cycle per Device 0.00022% 0.00022% 0.00022% 0.00022% 0.00022% 0.00022% 0.00022% 0.00022% 0.00022%
Instantaneous Number
1,916 149 75 1,267 11 11 192 4 2 207
of Transmitting 6 GHz
Devices (Subtotal, Low
Activity)
Instantaneous Number 394,958 16,708 4,214 282,771 1,193 602 42,772 477 120 46,099
of Transmitting 6 GHz
Devices (total)
Table 3-1 - RLAN Active Device Distribution
In Figure 3-1, the data show that 90% of the U.S. population is included in the rural, urban, and
suburban demographic areas and the remaining 10% of the population in barren areas. While the
interference potential in barren areas is very low, such areas were excluded from consideration in
13this report since the people who live in these areas are likely to rely on legacy RLANs that
provide sufficient capacity and speeds for their internet access, if they have access at all.
Figure 3-1 - Census Bureau 2020 Population Distribution
Assuming an average RLAN device count of 10 per person, the total RLANs in operation over
CONUS is estimated to be 3.47 billion in 2025 and the market penetration of 6 GHz capable
RLANs is assumed to be 45%. Because 6 GHz capable RLANs are expected to also operate in
the 2.4 and 5 GHz bands, and assuming spectrum loading will be even across all the
contemplated channels in the unlicensed bands, 68% of 6 GHz enabled RLANs are estimated to
be using the 6 GHz band. As shown in the following equation, the resulting number of RLANs
connected to a 6 GHz network, excluding barren areas, is 958 million:
Total 6 GHz Attached Devices = Total Population (people) x Devices per Person x Market
Penetration x (target 6 GHz Spectrum) / (total 2.4 + 5 + 6 GHz Spectrum) x 90% (3-1)
Total 6 GHz Attached Devices = (346,953 x 10 x 0.45 x 1200/1760) x 0.9 = 958 Million (3-2)
To estimate indoor versus outdoor deployments, we used Figure 3-2 which depicts the ratio of
indoor vs outdoor Wi-Fi AP shipments from 2011 to 2021, including both historical actual
shipment figures for Wi-Fi APs through 2016 as well as a forecast for future years. Outdoor unit
shipments in 2021 are estimated at 0.6% of all Wi-Fi APs.
14100%
99%
98%
97%
96%
Outdoor 95%
(%)
94%
Indoor (%)
93%
92%
91%
90%
Figure 3-2 – Worldwide Indoor vs Outdoor Wi-Fi Shipments.
Source: Dell’Oro Group July 2017 Wireless LAN report (thousands)
While this study considers RLANs generally, a conservative model for outdoor 6 GHz RLANs
may consider both Wi-Fi and 3GPP based technologies such as Licensed Assisted Access (LAA)
because many small cell deployments are expected to be outdoors. Table 3-2 depicts data from
the Small Cell Forum and shows a forecast of 1.5 million outdoor small cells deployed in 2021.
Applying the same 45% market penetration for outdoor small cells that are LAA and 6 GHz-
capable, yields figures slightly lower than the outdoor Wi-Fi AP market. The combined forecast
of Wi-Fi and small cell outdoor shipments is approximately 1% of total units in 2021. Doubling
this figure yields a conservative ratio for indoor vs. outdoor RLANs in all sub-markets of 98%
and 2% respectively.11
2014 2015 2016 2017 2018 2019 2020 2021 CAGR
Indoor 176 310 794 1,080 1,901 2,946 3,420 3,239 52%
Outdoor 47 78 251 441 937 1,387 1,466 1,596 66%
Total 223 388 1,045 1,521 2,838 4,333 4,886 4,835 55%
Table 3-2 – Small Cell Forum Forecast for Outdoor Small Cell Shipments (thousands)
For the peak usage analysis (busy hour), an activity level was assigned to represent the amount
of data consumed wirelessly. For this analysis, the activity on these RLANs was distributed
around two primary modes (i.e., bi-modal):
- “High activity” mode – Typical of RLANs in active use by a person. For this simulation
we assumed one device per person, a more conservative model than typical assumptions.
- “Low activity” mode – Typical of RLANs making periodic or intermittent transfers of
data, such as RLANs connected to the network but not in direct use (idle), or RLANs that
make small data transfers typical of “Internet of Things” (IoT) connected devices.
11
5G Americas and Small Cell Forum, Multi-operator and Neutral Host Small Cells: Drivers, Architectures,
Planning and Regulation, Dec. 2016, http://www.5gamericas.org/files/4914/8193/1104/SCF191_Multi-
operator_neutral_host_small_cells.pdf.
15To determine the worst-case time of interference into incumbent systems, busy hours for
corporate, public, and home usage were studied. Results showed that home usage was the
heaviest and therefore busy hours were assumed to be 7:00 pm – 11:00 pm local time.12 That
resulted in a busy hour across CONUS of 7:00 pm – 8:00 pm Pacific Time. It was assumed that
on average every person in the CONUS is actively using one RLAN during the busy hour while
owning an average of nine other RLANs that were not being actively used. As a result, the
percentage of devices in the High activity mode was assumed to be 10% and 90% were assumed
to be in the Low activity mode. 13,14
For devices in the High activity mode, usage was modeled to be 2.0 Gbytes/hour (4.44 Mbps) for
the home user, 1 Gbytes/hour (2.22 Mbps) for the corporate user, and 500 Mbytes/hour (1.11
Mbps) for public (hotspot connected) users. For devices in the Low activity mode, usage was
modeled to be 1 Mbyte/hour (2.2 kbps).
As a final step in this derivation, the efficiency of high bitrate modulation techniques offered by
modern unlicensed wireless technologies is considered. It is expected that new, 6 GHz
technology will deliver an average application layer throughput rate of 1 Gbps as achieved in
current 5 GHz technology. It is also expected that this capability will be deployed for the types
of 6 GHz devices in use during the busy hour for applications like video streaming. Based on the
available over-the-air rate of the AP, the data required per device per hour and the required duty
cycle can be assigned per device as follows:
Device Duty Cycle (% of available airtime) = Data per Device per Hour (Mbytes) x (8 bits / 3600
secs) / Average Rate (Mbps) (3-3)
For example, for the Home Market active device model
Device Duty Cycle = 2000 MBytes x (8/3600) / 1000 Mbps = 0.44 % (3-4)
The number of instantaneously active devices included in the model over all of CONUS is the
sum of the low and high activity mode devices for all markets (urban, suburban, rural) and
environments (corporate, public, home) as follows:
Instantaneous Transmitting Devices = Total Devices Using 6 GHz x Duty Cycle (3-5)
Note that the device duty cycle is calculated and assigned for all RLANs in each of the above
market types and environments and for both low and high activity mode devices. Table 3-1
12
Chitik, Hour-by-Hour Examination: Smartphone, Tablet, and Desktop Usage Rates, Mar. 26, 2013,
https://chitika.com/browsing-activity-by-hour.
13
ITU document Revision 1 to 5A/TEMP/236, Sharing and compatibility studies of WAS/RLAN in the 5 150-5 250
MHz frequency range, Section 5.1.1.4.2.5, stated busy hour demographic factor was 71%, 64%, and 47% for urban
suburban, and rural populations. This simulation assumed 90%.
14
While the ITU-R Working Party 5A concludes that busy hour participation is 62.7%, this simulation uses 90%.
ITU-R, Annex 22 to Working Party 5A Chairman’s Report: Use of Aggregate RLAN Measurements from Airborne
and Terrestrial Platforms to Support Studies Under WRC-19 Agenda Item 1.16 (Nov. 16, 2017) at 3, available at
https://www.itu.int/md/R15-WP5A/new/en (ITU-R 5A/650 (Annex 22)-E).
16shows the resulting input quantities of instantaneous transmitting devices for each of these
markets and environments.
3.1.2 Population Density
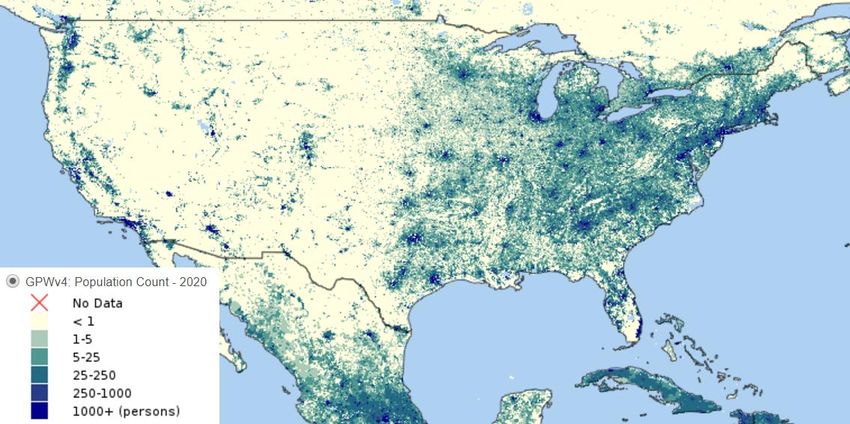
The sharing analysis for this report used an estimated 2020 population density, based on USCB
projections, to randomly distribute the active RLANs estimated in Section 3.1.1. 15Population
density thresholds, based on USCB 2010 definitions, were used to divide the country into urban,
suburban, rural, and barren areas.
Figure 3-3 - 60 Arcsecond Resolution of Census Bureau Population Count Map
The resulting population and area percentages shown in Table 3-3 were used in the simulations
to randomly distribute the number of RLANs estimated in Section 3.1.1 for sharing analysis with
the existing FSS, FS, and MS services in the 6 GHz band.
As can be seen, approximately 95% of CONUS is either rural or barren, which implies that
interference will be predominately concentrated in urban and suburban areas.
Pop (%) Area (%)
Urban 71.2% 2.8%
Suburban 9.5% 2.2%
Rural 9.3% 5%
Barren 10% 90%
Table 3-3 - Population Distribution
3.2 RLAN Operating Assumptions
To perform a thorough simulation of RLAN sharing of the 6 GHz band, reasonable statistical
operating assumptions were developed to account for the myriad possibilities of RLAN use
15
Socioeconomic Data and Applications Center, Gridded Population of the World (GPW), v4, available at
http://sedac.ciesin.columbia.edu/data/collection/gpw-v4/maps/gallery/search?facets=theme:population.
17given the deployment models in Section 3.1. As described in that section, we are considering
rural, suburban, and urban environments with corporate, public, and home submarkets. Within
each of these nine submarkets, key operating parameters that affect the received interference
level include RLAN source EIRP, bandwidth and channel usage, and installed height. Because
these operating parameters can vary, statistical assumptions must be derived before they can be
used in the simulations.
3.2.1 Distribution of Source RLAN Power Levels
To develop the statistical RLAN source power, or EIRP, we looked at typical use cases, RLAN
peak power, and busy hour usage weights. Since RLAN locations and antenna orientations tend
to be random and RLANs generally have a wide range of available output power and operating
characteristics, randomization of the RLAN source EIRP values is a valid approach for the broad
statistical analysis of this report.
As stated in Section 3.1, both indoor and outdoor RLAN installations were randomized based on
population density and therefore can be installed anywhere relative to a victim receiving
location. In each installation, the orientation of the RLAN antenna is in general not fixed.
Therefore, in the analysis we assumed an equal weight assigned to all values in the E-plane
pattern. Outdoor RLAN antennas most likely will be oriented such that the omnidirectional
pattern is horizontal with respect to the ground at the installation site and, as shown in Figures 3-
4 through 3-9, will be designed to limit maximum EIRP to 1 Watt above 30o in elevation (9 dB
higher than currently allowed in U-NII-1 rules). Even though indoor RLAN antennas have
similar elevation patterns (E-plane) as outdoor RLANs, an isotropic radiating pattern for all
indoor RLANs was used in the simulations to define a worst-case scenario.
Given these basic assumptions, the expected RLAN power levels can be represented by a
distribution of power levels typical of RLANs operating in frequency bands where the current
regulatory limit is a conducted transmit power of 1 Watt plus a 6 dBi omnidirectional antenna
gain. To derive the RLAN source EIRP in the submarkets described in Section 3.1.1, seven
typical use cases were used.
- Indoor Enterprise AP, Indoor Consumer AP, and Indoor High-Performance AP
- Indoor/Outdoor Client
- Outdoor High-Power AP, Outdoor Low Power AP
Table 3-4 provides the peak power of these use cases in the elevation patterns (E-plane) depicted
in Figure 3-4 through 3-9. For this analysis, the horizontal patterns (H-plane) were assumed to
be omnidirectional.
18Indoor Indoor Indoor Indoor/Outdoor Outdoor Outdoor
Enterprise Consumer High High Power Low Power
AP AP Performance Client AP AP
Gaming Router
Figure 3-4 Figure 3-5 Figure 3-6 Figure 3-7 Figure 3-8 Figure 3-9
Conducted
Power (dBm) 13.5 12.5 24 12 27 14
Peak Antenna
Gain (dBi) 4.1 5.3 5.3 3.5 5.3 5.3
MIMO Gain
(dB) 6.0 6.0 6.0 3.0 3.0 4.8
Total Peak
EIRP (dBm) 23.6 23.8 35.3 18.5 35.3 24.1
Table 3-4 - Peak Power (EIRP) of Typical RLAN Use Cases
19Indoor Enterprise Access
Point EIRP Probability based
on E-Plane Directivity
36 dBm ≤ 30 dBm 0.00%
< 30 dBm ≤ 24 dBm 0.00%
< 24 dBm ≤ 20 dBm 40.17%
< 20 dBm ≤ 17 dBm 34.07%
< 17 dBm ≤ 11 dBm 22.16%
< 11 dBm ≤ 0 dBm 3.32%
< 0 dBm 0.28%
Total 100.00%
Figure 3-4 - Indoor Enterprise Access Point, Typical Pattern (EIRP)
Indoor Consumer Access
Point EIRP Probability based
on E-Plane Directivity
36 dBm ≤ 30 dBm 0.00%
< 30 dBm ≤ 24 dBm 0.00%
< 24 dBm ≤ 20 dBm 11.19%
< 20 dBm ≤ 17 dBm 4.16%
< 17 dBm ≤ 11 dBm 16.90%
< 11 dBm ≤ 0 dBm 58.73%
< 0 dBm 8.31%
Total 100.00%
Figure 3-5 - Indoor Consumer Access Point, Typical Pattern (EIRP)
20Indoor High-Performance
Gaming Router Access Point
EIRP Probability based on E-
Plane Directivity
36 dBm ≤ 30 dBm 14.13%
< 30 dBm ≤ 24 dBm 8.86%
< 24 dBm ≤ 20 dBm 30.19%
< 20 dBm ≤ 17 dBm 21.33%
< 17 dBm ≤ 11 dBm 17.45%
< 11 dBm ≤ 0 dBm 7.20%
< 0 dBm 0.83%
Total 100.00%
Figure 3-6 - Indoor High-Performance Gaming Router, Typical Pattern (EIRP)
Indoor and Outdoor Client
EIRP Probability based on E-
Plane Directivity
36 dBm ≤ 30 dBm 0.00%
< 30 dBm ≤ 24 dBm 0.00%
< 24 dBm ≤ 20 dBm 0.00%
< 20 dBm ≤ 17 dBm 6.93%
< 17 dBm ≤ 11 dBm 45.71%
< 11 dBm ≤ 0 dBm 47.37%
< 0 dBm 0.00%
Total 100.00%
Figure 3-7 - Indoor and Outdoor Client, Typical Pattern (EIRP)
21Outdoor High-Power Access
Point EIRP Probability based
on E-Plane Directivity
36 dBm ≤ 30 dBm 14.13%
< 30 dBm ≤ 24 dBm 8.86%
< 24 dBm ≤ 20 dBm 30.19%
< 20 dBm ≤ 17 dBm 21.05%
< 17 dBm ≤ 11 dBm 17.73%
< 11 dBm ≤ 0 dBm 7.20%
< 0 dBm 0.83%
Total 100.00%
Figure 3-8 - Outdoor High-Power Access Point, Typical Pattern (EIRP)
Outdoor Low Power Access
Point EIRP Probability based
on E-Plane Directivity
36 dBm ≤ 30 dBm 0.00%
< 30 dBm ≤ 24 dBm 0.83%
< 24 dBm ≤ 20 dBm 11.36%
< 20 dBm ≤ 17 dBm 4.43%
< 17 dBm ≤ 11 dBm 19.11%
< 11 dBm ≤ 0 dBm 56.23%
< 0 dBm 8.03%
Total 100.00%
Figure 3-9 - Outdoor Low-Power Access Point, Typical Pattern (EIRP)
22The mix of indoor and outdoor RLANs is conservatively estimated at 98% and 2%, respectively
(Section 3.1.1). Table 3-5 provides busy hour weights for indoor use cases. Note that device
weights correspond to a 1:1 ratio of downlink to uplink traffic for corporate and public users, and
a 2.3:1 ratio for home users.
User Type URBAN SUBURBAN RURAL BARREN
Client 50% 50% 25% 50% 50% 25% 50% 50% 25% 50% 50% 25%
Enterprise AP 50% 50% 0% 50% 50% 0% 50% 50% 0% 50% 50% 0%
Consumer AP 0% 0% 70% 0% 0% 70% 0% 0% 70% 0% 0% 70%
High-
Performance 0% 0% 5% 0% 0% 5% 0% 0% 5% 0% 0% 5%
Gaming Router
Total (Indoor) 100 100 100 100 100 100 100 100 100 100 100 100
Table 3-5 – Busy Hour Weights Assigned to Use Cases, Indoor Environments (by submarket)
Since outdoor RLAN usage is not expected to vary significantly by submarkets, all use cases
were assigned the same weights in all submarkets (Table 3-6) and, for all outdoor scenarios, a
1:1 ratio of downlink to uplink traffic was used.
The combination of the use case busy hour weights of Tables 3-5 and 3-6, with the E-plane
patterns shown in Figures 3-4 through 3-9, results in a power distribution for the source RLANs
as shown in Table 3-7 for indoor RLANs and Table 3-8 for outdoor RLANs. This results in
weighted average EIRPs for indoor RLANs of 19.167 dBm, outdoor RLANs of 22.73 dBm, and
combined indoor/outdoor of 19.28 dBm are used in the simulations. It is noted that although
these weighted average EIRP values were independently derived by the methods described
above, the resulting values are consistent and slightly conservative compared to EIRP values
used for previous RLAN sharing studies.16,17,18
URBAN SUBURBAN RURAL
Outdoor High-Power AP (Figure 3-8) 20% 20% 20%
Outdoor Low Power AP (Figure 3-9) 30% 30% 30%
Outdoor Client (Figure 3-7) 50% 50% 50%
Total (Indoor) 100% 100% 100%
Table 3-6 - Busy Hour Weights Assigned to Use Cases, Outdoor Environment (all sub-markets)
The distributions in Tables 3-7 and 3-8 represent the probability of the specified EIRP occurring
in any random direction from an active RLAN. For the purposes of simulation, the continuous
16
ITU document Revision 1 to 5A/TEMP/236, Sharing and compatibility studies of WAS/RLAN in the 5 150-5 250
MHz frequency range, Section 5.1.1.4.2.1, average EIRP is 18.9 dBm for indoor RLANs, 21.2 dBm for outdoor
RLANs, and 19 dBm for indoor and outdoor.
17
ITU document Revision 1 to 5A/TEMP/236, Sharing and compatibility studies of WAS/RLAN in the 5 150-5 250
MHz frequency range, Appendix 2, Section 5.1.4.2.1, states average power used in the analysis was 19 dB with
average.
18
The ITU-R concludes that a mean EIRP of 19 dBm should be used for 5 GHz RLAN studies. ITU-R 5A/650
(Annex 22)-E at 3.
23values in between each breakpoint shown in the tables are represented as the maximum value.
For example, the probability of a 250 mW EIRP from Table 3-7 for indoor RLANs of 10.39% is
inclusive of all continuous EIRP probabilities greater than 100 mW, up to and including 250
mW, and were then included in the simulation as 250 mW sources with a 10.39% probability of
occurrence. Because the distributions of Tables 3-7 and 3-8 already assume the RLAN antenna
orientation to the victim receive locations are random, no further adjustment is provided in the
analysis for directivity effects of the RLAN sources. This is equivalent to stating that the above
EIRP values are treated isotropically (radiate equally in all directions) once seeded into the
model for a given source location. EIRP values above 1W up to and including 4W are modeled
as isotropic for indoor use cases, but limited (truncated) to 1W at elevation angles above 30° for
outdoor RLANs as described above.
Weighted EIRP Distribution (mW)
Indoor Use Case Weight 4000 1000 250 100 50 13 1 Total
Client 26.32% 0.00% 0.00% 0.00% 1.82% 12.03% 12.47% 0.00% 26.32%
Enterprise AP 2.63% 0.00% 0.00% 1.06% 0.90% 0.58% 0.09% 0.01% 2.63%
Consumer AP 66.31% 0.00% 0.00% 7.90% 2.76% 11.20% 38.94% 5.51% 66.31%
High-Performance
Gaming Router 4.74% 0.67% 0.42% 1.43% 1.01% 0.83% 0.34% 0.04% 4.74%
Sub-Total 100.00% 0.67% 0.42% 10.39% 6.49% 24.64% 51.84% 5.56% 100.00%
Table 3-7 - Indoor RLAN Source EIRP Distribution (mW)
The weights shown in Table 3-7 were obtained by combining the use cases of Table 3-5 with the
active device populations shown in Table 3-1. For example, the indoor client weight of 26.32%
is obtained as the weighted sum of the active devices inclusive of all submarkets as derived in
the equation below.
Indoor Client Weight = {Table 3-5 [Urban (Corporate, Public, Home)] x Table 3-1 Device
Population [Urban (Corporate, Public, Home)] + Table 3-5 [Suburban (Corporate, Public,
Home)] x Table 3-1 Device Population [Suburban (Corporate, Public, Home)] + Table 3-5
[Rural (Corporate, Public, Home)] x Table 3-1 Device Population [Rural (Corporate, Public,
Home)]} / {Table 3-1 [Total Active Devices]} (3-6)
The weights shown in Table 3-8 are the same as Table 3-6 for all outdoor devices because there
is no variation assumed in the proportion of active devices for each use case across the sub-
markets.
Weighted EIRP Distribution (mW)
Outdoor Use
Case Weight 4000 1000 250 100 50 13 1 Total
High Power AP 20% 2.83% 1.77% 6.04% 4.21% 3.55% 1.44% 0.17% 20.00%
Low Power AP 30% 0.00% 0.25% 3.41% 1.33% 5.73% 16.87% 2.41% 30.00%
Client 50% 0.00% 0.00% 0.00% 3.46% 22.85% 23.68% 0.00% 50.00%
Sub-Total 100.00% 2.83% 2.02% 9.45% 9.00% 32.13% 41.99% 2.58% 100%
Table 3-8 - Outdoor RLAN Source EIRP Distribution (mW)
For the simulation, interference results are presented as the aggregate interference from a
deployment of all RLAN device types.
243.2.2 Bandwidth and Channel Distribution
RLANs modeled in this report, such as those developed in compliance with IEEE 802.11, are
assumed to operate in 20 MHz, 40 MHz, 80 MHz, and 160 MHz bandwidth channels. To
determine the number of channels, and how those channels may overlap with FSS, FS, and MS
receivers, the following channel plan outlined in Figure 3-10 was assumed.
Figure 3-10 - Proposed RLAN Channel Plan
The bandwidth distribution in Table 3-9 is based on the assumption that RLAN systems will
operate with larger channel sizes to maximize airtime efficiency, resulting in lower latency and
higher throughput.
Bandwidth 20 MHz 40 MHz 80 MHz 160 MHz
Percentage 10% 10% 50% 30%
Table 3-9 - RLAN Bandwidth Distribution
3.2.3 Distribution of RLAN heights
To assign a RLAN transmit source height, a height distribution was separately prepared for each
of the following indoor environments: urban, suburban, and rural. In addition, a common
outdoor height distribution was used for all environments. The starting point of the height
distribution is the building construction type probability for each environment, shown in Table 3-
10. 19
Within multi-story buildings, the distribution of RLANs is assumed to have an equal probability
of occurring on any floor up to ten stories. A height of ten stories was selected as the maximum
because the probability of RLANs on higher floors diminishes significantly even when taller
buildings are considered. Stated differently, studying taller buildings does not impact the
analysis in any significant way. This is due to the assumed equal spreading of RLANs on all
floors of a tall building, which results in the combined distribution being heavily weighted
toward lower floors.
For example, the 28.5m height assumed for RLANs on the 10th floor of a ten-story building
comprises only 0.02% of all RLANs in the Urban environment. It is noted that the inclusion of
the 10-story building in the analysis, while placing 0.02% of RLANs at this height, increases
19
U.S. Energy Info. Admin., 2012 Commercial Buildings Energy Consumption Survey: Building Questionnaire -
Form EIA-871A, https://www.eia.gov/consumption/commercial/data/2012/pdf/questionnaire.pdf; NAHB, The
Number of Stores in Single-Family Homes Varies Across the Country, Aug. 5, 2016,
http://eyeonhousing.org/2016/08/the-number-of-stories-in-single-family-homes-varies-across-the-country/.
25Urban Indoor Suburban Indoor Rural Indoor Outdoor
Building Height
Corp Public Home Corp* Public Home Corp Public Home
Story (m)
1 1.5 69.0% 69.0% 60.0% 69.0% 69.0% 60.0% 70% 70% 70% 95%
2 4.5 21.0% 21.0% 30.0% 21.0% 21.0% 30.0% 25% 25% 25% 2%
3 7.5 7.0% 7.0% 7.0% 7.0% 7.0% 5% 5% 5% 5% 2%
4 10.5 0.7% 0.7% 0.7% 0.7% 0.7% 5% 0% 0% 0% 0.5%
5 13.5 0.58% 0.6% 0.6% 0.58% 0.6% 0% 0% 0% 0% 0%
6 16.5 0.50% 0.5% 0.5% 0.50% 0.5% 0% 0% 0% 0% 0%
7 19.5 0.43% 0.4% 0.4% 0.43% 0.4% 0% 0% 0% 0% 0%
8 22.5 0.35% 0.4% 0.4% 0.35% 0.4% 0% 0% 0% 0% 0%
9 25.5 0.28% 0.3% 0.3% 0.28% 0.3% 0% 0% 0% 0% 0%
10 28.5 0.2% 0.2% 0.2% 0.2% 0.2% 0% 0% 0% 0% 0.5%
Total 100.00 100.00 100.00 100.00 100.00 100.00 100.00 100.00 100.00 100.00
Table 3-10 - Building Construction Type Probability by Environment
the probability of RLANs at heights on floors one through nine by 10% of the ten-story building
type probability. For example, the likelihood that an RLAN will be on the first floor in an urban
environment is the sum as follows:
RLAN on 1st Floor Probability = 1 Story Building Probability + 2 Story Building Probability/2
Floors … +10 Story Building Probability/10 Floors (3-7)
As such, including buildings of taller heights provides limited additional insight into the question
of aggregated RLAN interference because each additional building height of n stories that is
included provides only a 1/n contribution to the distribution of RLANs at that height, while the
rest are distributed as 1/n to each of the lower floors.
Using the above described method based on the building construction type probability and equal
assignment of RLANs to each floor of a multi-story building results in the distribution of source
heights shown in Table 3-11.
26Urban Indoor Suburban Indoor Rural Indoor Outdoor
Building Height
Corp Public Home Corp* Public Home Corp Public Home
Story (m)
1 1.5 82.35% 82.35% 77.85% 82.35% 82.35% 77.92% 84.17% 84.17% 84.17% 95.00%
2 4.5 13.35% 13.35% 17.85% 13.35% 13.35% 17.92% 14.17% 14.17% 14.17% 2.00%
3 7.5 2.85% 2.85% 2.85% 2.85% 2.85% 2.92% 1.67% 1.67% 1.67% 2.00%
4 10.5 0.52% 0.52% 0.52% 0.52% 0.52% 1.25% 0.00% 0.00% 0.00% 0.50%
5 13.5 0.36% 0.36% 0.36% 0.36% 0.36% 0.00% 0.00% 0.00% 0.00% 0.00%
6 16.5 0.24% 0.24% 0.24% 0.24% 0.24% 0.00% 0.00% 0.00% 0.00% 0.00%
7 19.5 0.16% 0.16% 0.16% 0.16% 0.16% 0.00% 0.00% 0.00% 0.00% 0.00%
8 22.5 0.09% 0.09% 0.09% 0.09% 0.09% 0.00% 0.00% 0.00% 0.00% 0.00%
9 25.5 0.05% 0.05% 0.05% 0.05% 0.05% 0.00% 0.00% 0.00% 0.00% 0.00%
10 28.5 0.02% 0.02% 0.02% 0.02% 0.02% 0.00% 0.00% 0.00% 0.00% 0.50%
Total 100.00 100.00 100.00 100.00 100.00 100.00 100.00 100.00 100.00 100.00
Table 3-11 - RLAN Source Height Distributions
3.2.4 RLAN Operating Mitigations
Spectrum sharing is not new; the orderly sharing of spectrum has been the primary consideration
of spectrum management since the beginning of the practical use of radio. From their inception,
RLAN devices have been designed to operate in interference environments. As the standards
evolve, systems are able to make better use of temporal and spatial variations in the environment
to share with themselves and with other systems. The 5 GHz bands are an example of an
advanced RLAN environment with billions of device-years of operating experience.20 Major
mitigation methods currently employed by various national spectrum regulators for controlling
the interference level to co-channel systems (licensed or unlicensed) in the 5GHz band are given
below.
Transmit power limit:
Limiting transmit power is the most common sharing method used not only in the 5 GHz band
but across the whole RF spectrum. By limiting the transmit power for devices, interference can
be reduced or prevented, and such limits can be defined as conducted and/or radiated powers,
and on total power and/or power spectral density.
Antenna gain limit:
Limiting antenna gain helps reduce the transmitted energy concentrated in a given direction to
reduce potential interference to incumbents located in that direction. Furthermore, antenna gain
limits help prevent users from acquiring and using high-gain antennas to increase EIRP. 5 GHz
band rules have different limits for point-to-multi-point and point-to-point systems.
20
Wi-Fi Alliance, Wi-Fi Alliance® Publishes 2018 Wi-Fi® Predictions: Advances in Home Wi-Fi, Enhanced
Capabilities, and Next Generation Connectivity Coming Soon, Jan. 5, 2018, https://globenewswire.com/news-
release/2018/01/05/1284169/0/en/Wi-Fi-Alliance-publishes-2018-Wi-Fi-predictions.html.
27Minimum bandwidth:
Setting minimum bandwidth requirements helps prevent interference by limiting power spectral
density of narrowband signals. In the U-NII-3 band, for example, the minimum 6 dB bandwidth
of digitally modulated signals is limited to 500 kHz.
Dynamic Frequency Selection (DFS):
In some parts of the 5 GHz band, DFS is needed to prevent interference to the incumbent radar
systems. DFS dynamically detects signals from other systems and avoids co-channel operation
with these systems. Since DFS is generally associated with radar systems, it can be considered
as a special case of detect and avoid mechanisms.
Transmit Power Control (TPC):
TCP enables 5 GHz band devices to dynamically switch between several transmission power
levels and is used to prevent unnecessarily high transmission power when not needed. Devices
operating in the U-NII-2 band are required to have TPC capability.
Elevation mask:
An elevation mask limits the amount of radiated power above a certain elevation angle and is
used to limit emissions toward satellites in U-NII-1 band where EIRP above 30° from horizon is
reduced by 15 dB.
Indoor restriction:
In the initial U-NII-1 rules, the possibility of interference to satellite systems was addressed by
limiting devices to indoor use only. However, later rule changes lifted this restriction. Other
regulatory domains continue to employ this mitigation in the 5.15 – 5.35 GHz bands.
3.2.5 Interference Protection Criteria and Further Considerations
In the process of writing this report, we chose some parameters that were more conservative than
what could have been used and noted that a number of typical parameters and effects that reduce
interference were not included in this analysis.
3.2.5.1 Conservative Interference Threshold
In considering the interference threshold for this analysis, we noted that the performance of FS
links is generally defined in terms of availability objectives. In the 6 GHz band, the typical per
hop availability objective is set at 99.999%. Correspondingly, the FS link IPC is based on the
overall degradation allowance. The ITU defines this degradation allowance in terms of I/N
whereas the TIA TSB 10 criteria is based on a carrier-to-interference (C/I) ratio. The I/N criteria
approach is more general and, therefore, is better suited for the purpose of this analysis. Further,
for the FS links, the interference criteria are segregated into long-and short-term interfering
signal criteria. According to ITU-R Recommendation F.758-6, long-term interference degrades
the error performance and availability of a system by reducing the fade margin available to
protect the FS system against fading.21 In sharing and compatibility studies, long-term
21
ITU-R Recommendation F. 758-6, System Parameters and Considerations in the Development of Criteria for
Sharing or Compatibility Between Digital Fixed Wireless Systems in the Fixed Service and Systems in Other
28interference is usually characterized as the interference power that is exceeded 20% of the time,
at the victim receiver input. Short-term interference requires separate consideration because the
interference power may be high enough to produce degradation even when the desired signal is
unfaded. Such interference must occur rarely enough and in events of short duration for the
interference to be acceptable. A short-term interference criterion is based on the interference
power necessary to cause a particular error performance defect (such as an errored second) when
the desired signal is unfaded.
Since RLAN transmissions are low-duty cycle, it is appropriate to analyze the interference
caused by RLANs to the FS receiver as short-term. In the case of FS in the 6 GHz band, ITU-R
publications provide various short-term interference objectives such as I/N greater than +20 dB
(see, e.g., for example ITU-R SF.1650, ITU-R F.1108). Recognizing secondary status of the
RLAN operations in the band, we have selected a much more conservative I/N value of -6dB.
3.2.5.2 Typical Parameters and Effects that Reduce Interference Not Included in this Analysis
FS link performance is dominated by multipath-related microwave fading. However, multipath
fading generally occurs during the period midnight to 8:00 am, when RLAN activity is lowest
and “some relaxation of the long-term IPC may be possible.”22 In analyzing the impact of
RLAN interference to FS link availability, interference and multipath fading were assumed to be
independent. Since the RLAN busy hour is before midnight, and multipath occurs primarily
after midnight, there should be a relaxation of the IPC and a significant portion of the link fade
margin can be used to relax, dB-for-dB, the IPC.
Although a large percentage of the FS links in the FCC’s ULS database use antenna diversity to
improve link availability, antenna diversity was not modeled. Instead, this report over estimates
the unavailability impact of the RLAN interference for all FS links that use antenna diversity.
The established IPC for the FS are generally based on long-haul performance, whereas the 6
GHz band includes a large percentage of links that are short-haul (35% of ULS links are less
than 20 km). Interfering signal levels 1-10 dB or more above accepted long-haul performance
requirements are usually acceptable on shorter digital paths since long-term performance is not
adversely affected.23
While other studies have assumed a polarization mismatch of 3dB, polarization mismatch was
not included in this report.24
ITU-R Rec. F.1245 (F.1245) was used to model the FS antenna sidelobe performance. As shown
in Figure 3-11, the newer commercial antennas, portrayed by the red line in the figure,
Services and Other Sources of Interference (Sept. 2015), available at https://www.itu.int/dms_pubrec/itu-r/rec/f/R-
REC-F.758-6-201509-I!!PDF-E.pdf (ITU-R Rec. F.758-6).
22
Nat’l Telecom. & Info. Admin., Interference Protection Criteria Phase 1 - Compilation from Existing Sources,
NTIA 05-432, Oct. 1, 2005, https://www.ntia.doc.gov/files/ntia/publications/ipc_phase_1_report.pdf (NTIA 05-
432).
23
Id. at 4-8 and 4-9.
24
ITU document Revision 1 to 5A/TEMP/236, Sharing and compatibility studies of WAS/RLAN in the 5 150-5 250
MHz frequency range, Appendix 2, Section 5.1.6.7, “Polarization mismatch, a value of 3 dB is considered according
to what have been supported by France in during TG-5.1 (see Doc TG-5.1/104).”
29significantly outperform F.1245, as described by FCC A and ETSI Class 4 antenna masks.
Based on data provided by Comsearch,25 as of 2011, over 83% of antennas deployed in 5.925-
6.425 GHz band in the United States exceeded Category A requirements, and over 52% of the
antennas were classified as high performance or ultra-high performance, which greatly exceed
Category A requirements. These higher-performing antennas provide up to 27.5 dB more
attenuation from the side lobes than what was modeled.
0
FCCCat
FCC CatAA
UHX6-59
UHX6-59
-10
-10
ITU-1245
ITU-1245
-20
-20
-30
-30
(dB)(dB)
-40
-40
GainGain
-50
-50
-60
-60
-70
-70
-80
-150
-150 -100
-100 -50
-50 0 50 100
100 150
150
Angle (deg)
Angle (deg)
Figure 3-11 – Comparison of ITU-R 1245, FCC Category A, and Ultra High-Performance Antenna (UHX6-59) Radiation
Patterns
The FS interference analyses in this report assumed the minimum Noise Figure26 in ITU-R Rec.
F.758-6 and represents a conservative assumption. Other analyses have used a Noise Figure of 5
dB, which would reduce the I/N values by 1 dB.
The factors that were not considered in this report are summarized in Table 3-12. They represent
a significant reduction in aggregate interference from RLANs that can also be budgeted as a
reduction in IPC.
25
See Letter from Christopher R. Hardy, Vice President, Comsearch, to Marlene H. Dortch, Secretary, FCC, in WT
Docket Nos. 10-153, 09-106 and 07-121, (filed Apr. 4, 2011).
26
The ITU-R recommends a maximum Noise Figure of 5 dB while TIA recommends a default FS Noise Figure of 5
dB. ITU-R Rec. F.758-6; available at https://global.ihs.com/doc_detail.cfm?document_name=TIA%20TSB-10.
30You can also read