WATER AVAILABILITY CHALLENGES IN MOZAMBIQUE - IMPLICATIONS TO THE NEXUS - DIVA
←
→
Page content transcription
If your browser does not render page correctly, please read the page content below
Water availability challenges in
Mozambique – implications to the
             Nexus

                   Author: Ylva Nordström
                  Supervisor: Eunice Ramos
                Examiner: Prof. Mark Howells
        Registration number: TRITA-ITM-EX 2019:14

                        January 2019
                  Master of Science Thesis
     KTH School of Industrial Engineering and Management
             Division of Energy Systems Analysis
                   SE – 100 44 Stockholm

                                                           1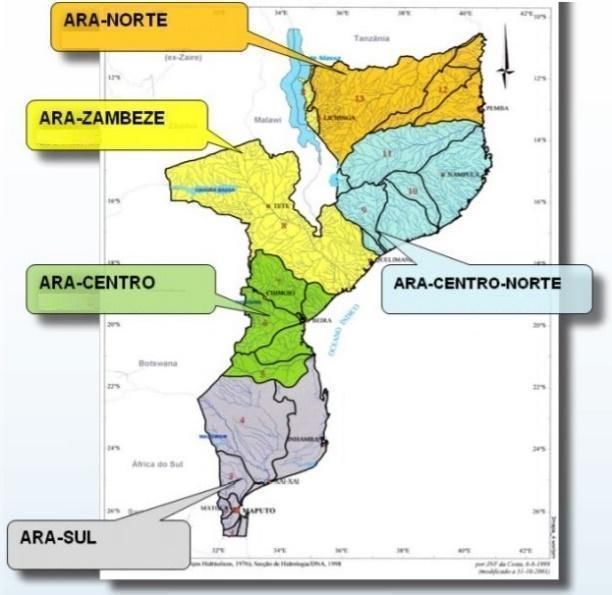
Sammanfattning
Den här rapporten undersöker möjliga framtider för vattentillgångarna och
vattenkonsumptionen i området kring Pungwefloden i Mozambique med hänsyn till den
naturliga miljön och vattenanvändningen. De vanligaste landklasserna i området är olika typer
av skog. De vanligaste ekonomiska aktiviteterna, jordbruk, boskap och fiske äger rum i den
nedre delen av flodområdet kring Pungwe.
Studien gjordes genom att utföra en kvalitativ analys of vatteninnehållet och andra resurssystem
vilket ledde till identifieringen av tre utmaningar; tillgång till dicksvatten; klimatförändringar
och tillgång till vatten för bevattning. Det följdes av en kvantifieringsanalys centrerad kring
utvecklingen av en vattensystemmodell för området kring Pungwe som gjordes med
modellverktyget Water Evaluation and Planning (WEAP).
Ett scenario skapades för varje utmaning för att undersöka den inverkan de har på
vattentillgången. I det första scenariot har hela populationen i flodområdet kring Pungwe
tillgång till rent dricksvatten vid 2030. Det är i linje med den första delen av det sjätte
hållbarhetsmålet satt av FN. I det andra scenariot är klimatet i området varmare och torrare än
i referensscenariot. Klimatet är modellerat efter den torraste körningen av Representative
Concentration Pathway 6.0 (RCP6.0). I det tredje scenariot är den odlade området större, precis
som den bevattnade andelen av den odlade marken.
Det andra scenariot är en fortsättning av det första och det tredje är en fortsättning av det andra.
Det betyder att 100% av populationen har tillgång till rent dricksvatten 2030 i alla scenarier och
att de sista två har klimatdata från RCP6.
WEAP-modelleringen indikerade att ytvattentillgången inte är ett problem för 100%
vattentillgång i det övre och nedre avrinningsområdet med avseende på vattenkvantitet fram till
2050 i alla scenarier. I det mellersta avrinningsområdet däremot brister vattentillgången redan
i referensscenariot. Bristen sker under den torra säsongen. För varje scenario börjar underskottet
tidigare och tidigare, fler månader påverkas och allvaret i det ouppfyllda behovet ökar. I
bevattningsscenariot är januari den enda månaden som inte påverkas av vattenunderskott.
Flödet i floden påverkas mycket av klimatförändringscenariot. Vid lågt flöde är påverkan
mindre men under perioder med högt flöde är det inte ens hälften av vad det var tidigare.
Efter analysering av resultaten och besvaring av forskningsfrågorna står det klart att vattnet i
Pungwefloden inte är en tillräcklig vattenkälla för att tillmötesgå det ökande vattenbehovet i
flodområdet, framförallt inte om bevattningen ökar. Möjliga lösningar för att handskas med
vattenunderskottet som presenteras i rapporten är regnskörd, vattenbehandling, avsaltning i
nedre avrinningsområdet och reglerad vattenförbrukning.

                                                                                                  2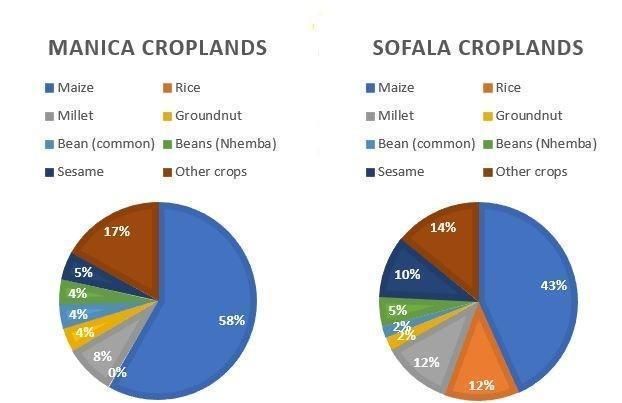
Abstract
This report investigates futures for water supply and consumption in the Pungwe River basin in
Mozambique taking into consideration the natural environment and water uses. The most
common land classes in the basin are forest and woodland. The major economic activities of
agriculture, live-stock production and fishing take place in the lower part of the Pungwe River
basin.
The study was made by doing a qualitative analysis of the water contents and other resource
systems which then led to the identification of three challenges; access to drinking water;
climate change and access to water for irrigation. This was followed by a quantification analysis
that had its center in the development of a water systems model for the River basin using the
Water Evaluation and Planning (WEAP) modelling tool.
A scenario was formed for each challenge to investigate the impact they all have on the water
availability. In the first scenario, the entire population in the Pungwe River basin has access to
clean drinking water by 2030. This is in line with the first target of Sustainable Development
Goal 6. In the second scenario, the climate in the basin will be warmer and drier than in the
baseline scenario. The climate is modeled after the driest climate model run of the
Representative Concentration Pathway 6.0 (RCP6.0). In the third scenario, the cultivated area
of the basin is increased as well as the irrigated share of the cultivated area.
The second scenario is a continuation of the first and the third is a continuation of the second.
This means that the all three scenarios have 100% access to drinking water by 2030 and the last
two both have RCP6.0. climate data.
The WEAP modelling indicated that surface water availability is not a limitation for the
achievement of 100% water access in the upper and lower catchments, in terms of water
quantity, every year until 2050 in all the scenarios. In the middle catchment, however, there is
a deficit in water access already in the reference scenario towards the century. The deficit occurs
in the dry season. For each scenario, the deficit starts years earlier, more months are affected
and the severity of the unmet demand increases. In the irrigation scenario, only January is
unaffected by insufficient water access. The streamflow in the river is greatly affected in the
climate change scenario. During low flow there is not much difference but in high flow the
streamflow is not even half of what it was earlier.
After analyzing the results and answering the research questions it is clear that the surface water
in the Pungwe River will not be a sufficient water source to accommodate the increasing water
demand in the basin, in particular if the use of irrigation is expanded. Possible solutions to cope
with the water deficit presented are rain harvest, water treatment, desalination in the lower
catchment and regulated water consumption.

                                                                                                 3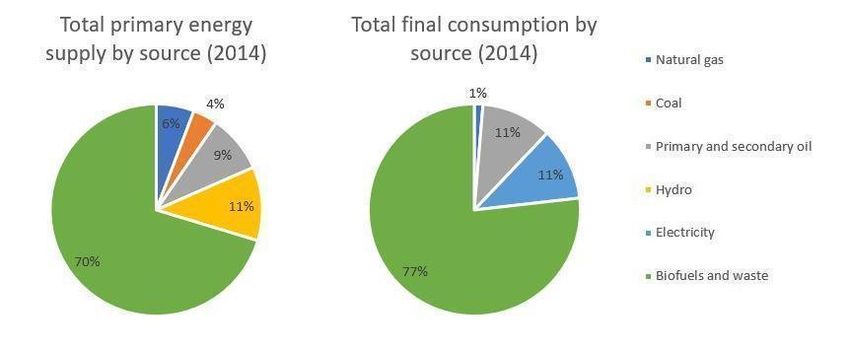
Table of Contents
Sammanfattning                                                                      2
Abstract                                                                            3
Table of Contents                                                                   4
Table of Tables                                                                     7
Acronyms and abbreviations                                                          8
Introduction                                                                        9
Background                                                                         11
  National context                                                                 11
    Socio-economic trends                                                          11
    Overview of the status of the nexus systems                                    12
       Climate – national                                                          12
       Land – national                                                             12
       Energy – National                                                           13
       Water – National                                                            15
  Pungwe River basin context                                                       15
    Socio-economic trends                                                          17
    Characterization of nexus systems                                              17
       Climate                                                                     17
       Land                                                                        17
       Energy                                                                      18
       Water                                                                       18
    Overview of the status of the nexus systems                                    18
    Climate                                                                        20
  Identification of water challenges in the Pungwe river basin                     20
  Review of studies focused on analyzing water resources availability and use in
  Mozambique/Pungwe                                                                21
  Water governance                                                                 21
    National level                                                                 21
    Basin level                                                                    21
Methodology                                                                        22
  Overview of methodology                                                          23
  WEAP model development                                                           23
    Model structure                                                                25
    Model calibration                                                              26
                                                                                    4
Scenarios for Pungwe River basin                                                   28
       Reference scenario – description and main assumptions                       29
         Population:                                                               29
         Water                                                                     30
         Irrigation                                                                30
         Land use                                                                  31
         Climate                                                                   32
       Water access scenario                                                       32
       Climate change scenario                                                     32
       Irrigation scenario                                                         33
Results and Discussion                                                             33
    Reference scenario                                                             33
    The water access scenario, SDG6, compared to the reference scenario            35
    The climate change scenario, CC, compared to the water access scenario, SDG6   38
    The irrigation scenario, IRR, compared to the climate change scenario, CC      40
Conclusions and implications to policy design/planning                             42
    Answers to research questions                                                  42
    Limitations                                                                    43
    Future work                                                                    44
References                                                                         45

                                                                                    5
Table of figures
Figure 1: Mozambique highlighted on a map of Africa (JCDecaux, n.d.). 11
Figure 2: Pie chart showing the share of energy sources for total primary energy supply and
total final energy consumption (IEA, 2018). 14
Figure 3: Pungwe river basin outlined on a map of Mozambique. 16
Figure 4: Pungwe River basin outlined on Manica and Sofala. Manica is the province to the
left and Sofala is to the right. 16
Figure 5: Pie charts showing the crop shares in the Sofala and Manica provinces (MASA,
2015). 18
Figure 6: The water agencies in Mozambique (NEPAD, 2013). 22
Figure 7: Diagram over the methodology. 23
Figure 8: Schematic of the Pungwe River basin in WEAP. 25
Figure 9: Streamflow comparison at the Bue Maria stream gauge. 27
Figure 10: Percentage of time exceeded at the Bue Maria stream gauge. 27
Figure 11: Streamflow comparison at the E.N. 102 stream gauge. 28
Figure 12: Percentage of time exceeded at the E.N. 102 stream gauge. 28
Figure 13: Diagram of the land classes each catchment of the basin. 31
Figure 14:Graph showing the annual total supply requirement (including loss, reuse and
DSM) for the catchments in the reference scenario. 33
Figure 15: Graph showing the supply requirement of the different water consumers in each
catchment. 33
Figure 16: Coverage in the upper catchment.
Error! Bookmark not defined.Figure 18: Coverage in the middle catchment. 34
Figure 19: Monthly average of coverage in the middle catchment. 34
Figure 20: Streamflow in the Pungwe River basin. The 6th reach is after the upper catchments
demand return, 12th is after the middle catchments demand return and 18th is after the lower
catchments demand return. 35
Figure 21: The supply requirements for each catchment in the SDG6 scenario relative to the
reference scenario. 35
Figure 22: Supply requirement for the water consumers in the different catchments in the
SDG6 scenario. 36
Figure 23: Coverage in the basin’s middle catchment. 36
Figure 24: The monthly average of the coverage in the middle catchment for the reference and
SDG6 scenarios. 37
Figure 25: The streamflow of the different catchments in the SDG6 scenario relative to the
reference scenario. The 6th reach is after the upper catchments demand return, 12th is after the
middle catchments demand return and 18th is after the lower catchments demand return. 37
Figure 26: Coverage in the middle catchment in the CC and SDG6 scenarios. 38
Figure 27: Monthly average of the coverage in the CC and SDG6 scenarios. 38
Figure 28: Streamflow in the upper catchment in the CC and SDG6 scenarios. 39
Figure 29: Streamflow in the middle catchment in the CC and SDG6 scenarios. 40
Figure 30: Streamflow in the lower catchment in the CC and SDG6 scenarios. 40
6Figure 31: The supply requirement in the irrigation scenario relative to the climate change
scenario. 41
Figure 32: The supply requirement in the irrigation scenario divided into water consumer and
catchment. 41
Figure 33: Coverage of the middle catchment in the irrigation and climate change scenarios.
42
Figure 34: Monthly average of the coverage of the middle catchment in the irrigation and
climate change scenario. 42
Table of Tables
Table 1: Electricity generated by fuel in 2014 (IEA, 2018) 14
Table 2: The existing hydropower plants, largest to smallest (IHA, 2016). 14
Table 3: Population and area of the Pungwe basin in Mozambique and Zimbabwe (SWECO,
2004). 16
Table 4: Linkages between the water sector and the land and energy sectors. The third column
provides an overview of interactions between the water and climate systems (and not sectors).
19
Table 5: Sources for the data used in the geospatial analysis 24
Table 5: Description of the three scenarios. 29
Table 6: People in the Pungwe catchments. 29
Table 7: The different land classes for the catchments. 31
7Acronyms and abbreviations
ARA Adminisração Regional de Águas
BAU Business As Usual
CLEW Climate, Land, Energy and Water
GHG Greenhouse gases
GDP Gross Domestic Product
GIS Geographic Information System
GNP Gross National Product
GRDC Global Runoff Database
HCB Hidroeléctrica de Cahora Bassa
IAEA International Atomic Energy Agency
IHA International Hydropower Association
INE Instituto Nacional de Estatística
KNMI Koninklijk Nederlands Meteorologisch Instituut (Royal Dutch Meteorological
Institute)
Lppd Liters per person per day
MASA Ministério de Agricultura e Segruanca Alimentar
MNR Mozambique National Resistance
MRI Meteorological Research Institute
NGO Non-Governmental Organization
RCP Representative Concentration Pathway
SADC Southern African Development Community
SAPP Southern African Power Pool
SDG Sustainable Development Goal
SMHI Swedish Meteorological and Hydrological Institute
UNDP United Nations Development Program
USD US Dollar
WASH Water, Sanitation and Hygiene
WEAP Water, Evaluation and Planning
WSP Water and Sanitation Program
8Introduction
The aim of this study was to investigate different futures of water availability and use in the
Pungwe River basin in Mozambique.
Mozambique is an African country, located in the south eastern part of the continent. It is a part
of the Southern African Development Community (SADC) along with all the African countries
below Democratic Republic of Congo. The aim of the community is to improve the quality of
living in Southern Africa by promoting self-sustaining development, peace and security,
achieve economic growth and optimize utilization of resources among other objectives. Most
rivers, lakes and aquifers within the SADC are transboundary which means that the
management must be transboundary as well (SADC, 2012).
In Mozambique, 73% of the water consumed is used for agricultural purposes. The municipal
sector consumes 25% and the remaining 2% is used for industry. It is hard to find exact numbers
for the water consumption in the Pungwe River basin (FAO, 2016). Mozambique is not a water
scarce country but there is a lack of significant infrastructure to get the water to where it is
needed (FAO, 2016). An important challenge related to water is reassuring access to clean
drinking water for the population. Currently the access to basic drinking water in Mozambique
is 45%, 78% in urban areas and 30% in rural (World Bank, 2018). The access to water also
affects agriculture in Mozambique. Agriculture is the most common occupation but only 2% of
the potential area for irrigation is irrigated. This causes the yield of crops to be highly dependent
on precipitation and therefore also unpredictable.
The Pungwe River basin is located in the center of Mozambique. The basin spans over the
provinces Manica and Sofala and a small part of it, about 8%, is located in Zimbabwe. The
Pungwe basin was chosen greatly due to data availability. The development of a water model
requires flow data for calibration of the model results. Data from two stream gauges were
available in the Pungwe River that allowed for the split of the basin in three sub-catchments of
relative similar size. Additionally, in Mozambique most of the river basins are transboundary
and the Pungwe is one of the main basins that is mostly located in the country. During the civil
war (1977-1992) the guerilla had a stronghold in Sofala, in the Gorongosa mountains, and many
battles were fought there (Mlambo, n.d.). This led to the infrastructure used for irrigation being
abandoned. In 2015, around 1,524,800 people lived in the basin area in the Mozambican part.
The largest part of the population in this basin is rural, around 70%, and about 460,000 people
live in the only large city in the basin, Beira (INE, 2018). The main activity in the Pungwe basin
is agriculture. Other than crop cultivation, other agricultural activities include livestock
production, forestry and fisheries. There is also some gold mining and eco-tourism (Sida, 2008).
A potential threat to the Pungwe river basin is climate change. Studies made on the climate in
the Pungwe basin shows that the temperature is expected to rise by 1.5 to 2 °C the precipitation
reduce by 10%, and the rainy season delayed in one month.
One of the objectives of the study was to model the water resources in the Pungwe River basin
in order to investigate the water access in it if the demand for water is increased. To test if the
Pungwe River can provide enough water to meet the supply requirement of water for drinking
and irrigation in a future where the demand for both is increased. Another objective was to look
at how the streamflow of the Pungwe River is affected by climate change causing it to get
9warmer and drier in the basin and how this can have consequences for the supply requirement
for drinking water and irrigation.
With these objectives and water challenges Pungwe in mind, three research questions were
formulated:
● Is there enough surface water to ensure 100% water access?
● Could climate change compromise the achievement of water access targets in the
Pungwe River basin?
● How does the expansion of irrigation under dry climate future affect water access in the
Pungwe river basin?
In this report a nexus approach in regard to the water challenges was investigated. The nexus
approach takes into consideration how different systems, such as Climate, Land, Energy and
Water, interact (Howells, et al., 2013). The incorporation of the nexus approach in their
planning decisions is not a common practice in SADC countries, which is the case for
Mozambique (Mabhaudhi, et al., 2016).
The study began with a literature review over Mozambique and the Pungwe River basin. Data
regarding climate and water consumption was collected and a geospatial analysis was made
using ArcGIS to calculate population, area, land classes and define the boundaries of the system
and decide on three catchments.
From the literature review the water challenges the basin faces were identified and from that
three scenarios were designed. The basin was the modeled in WEAP with the data collected
and calculated in ArcGIS. With the results from WEAP the scenarios could be compared, and
conclusions could be drawn.
Three scenarios, other than the baseline, were modeled in this thesis. These scenarios result
from a sequential combination of assumptions. The first scenario is related to the water access
and considers the partial achievement of Sustainable Development Goal 6 (SDG6), “By 2030,
achieve universal and equitable access to safe and affordable drinking water for all”. The second
scenario explores the potential implications to water access of climate change, considering the
Representative Concentration Pathway (RCP) 6.0, inheriting assumptions from the SDG6
scenario. The third scenario investigates potential changes to water resources availability due
to the expanded use of irrigation, in a context of climate change under RCP6.0 and taking into
consideration SDG6.
In this case the impact of the increased water uses by different sectors, domestic water supply
and agriculture, is analyzed under historical climate conditions, in the case of the SDG6
analysis; and a climate change scenario. Understanding how water resources may change, both
in terms of natural changes induced by climate and human interventions, could assist the
planning process related to water towards the more sustainable management of resources. When
expected water levels are known it is easier for the administrations, in this case ARA-Centro,
to decide on what policies to implicate in order to tackle the challenges concerning water use
in the area.
10Background
This chapter provides an overview of the current socio-economic conditions of Mozambique
and the Pungwe River basin, as well as information on the status of the sectors that directly
relate to the nexus systems of climate, land, energy and water. Firstly, the socio-economic
context for both the country and the basin are introduced.
National context
Socio-economic trends
Mozambique is a country located in the southeast of Africa that covers an area of 801,590 km2.
Neighboring countries are Tanzania, Malawi, Zambia, Zimbabwe, South Africa and Swaziland.
The eastern border is a coast towards the Indian Ocean, as seen Figure 1. Maputo is the capital
and it is situated in the far south (UNDP, 2018). In 2016 the population was 28.8 million people,
of these around 45% are under the age of 15 (World Bank, 2018).
Figure 1: Mozambique highlighted on a map of Africa (JCDecaux, n.d.).
In 1975 Mozambique became independent after 500 years of Portuguese colonialization. In
1977 a civil war broke out between the government and the guerilla movement Mozambique
National Resistance (MNR) who also had support from white minorities from South Africa and
Zimbabwe. The war ended in 1992 when MNR and the government signed the General Peace
Agreement for Mozambique (UNDP, 2018).
Since the war ended Mozambique has made an astonishing recovery by rebuilding the
infrastructure and starting to cultivate abandoned lands again, however, it is still an extremely
poor country. In 2014, 46.1% of the population were below the poverty line (World Bank,
2018). According to UNDP, in 2016, Mozambique ranked at 181 out of 188 countries on the
11Human Development Index1 and the rank for Gender Inequality Index2 was 139 out of 188
countries. On the Multidimensional Poverty Index3 (MPI) Mozambique scored 0.39. (UNDP,
2016).
In 2016 the GDP was 11 billion USD. In the last 10 years the annual GDP growth has varied
between 3 and 7% (World Bank, 2018). The sectors that contribute to the GDP are agriculture
(22%), industry (33%) and services (45%) (World Bank, 2018). Of the workforce in
Mozambique 75% works in agriculture, 21% in services and only 4% in industry. In 2014, the
labor force participation rate of the population in Mozambique aged between 15-65 was 76%.
Droughts and floods both have significant impact on the agricultural sector which in turn affect
the GDP (World Bank, 2018).
Overview of the status of the nexus systems
The Climate, Land4, Energy and Water (CLEW)s approach recognizes the importance of cross-
sectoral interlinkages. This means that actions taken in one system of the nexus affect another
(Howells, et al., 2013). The land, energy and water sectors affect each other and in turn the
functioning of all systems affects the climate, and vice-versa (IAEA, n.d.). Often when policies
are designed in sectoral silos they do not take into consideration effects on other sectors. A
problem with transboundary basins is that neighboring countries can be affected by the
implemented policies in riparian nations. Sometimes the effects on other sectors can have dire
consequences (UNECE, 2015). For an example, over exploitation of rivers and lakes can affect
the ecosystem and cause trouble with the water reliability in neighboring countries sharing basin
(UN WATER, n.d.) .
Climate – national
There are two main seasons in Mozambique: The rainy season begins in December and ends in
March. During these months there is a high flow in the rivers. The rain during the rainy season
stands for 60-80% of the annual rainfall (World Bank Group, 2018). The annual rainfall is
different in various parts of the country. In the north the annual rainfall can exceed 1000 mm,
and, in the south, it is usually around 500 mm (The World Bank Group, 2007).
Land – national
In rural Mozambique most people farm their own land making agriculture the most common
occupation in the country (The World Bank Group, 2007). Of the country’s total area, 62% is
agricultural land most of which is permanent meadows and pasture, and 7% of total agricultural
area is cultivated (FAO, 2016). In 2005, 24.6% of Mozambique’s area was forest. Mozambique
lost about 3.8% of its forest between 1990 and 2005 due to deforestation (Mongabay, 2006).
1
HDI is a measurement of achievements in human development. The dimensions included in the HDI are life
expectancy, education and standard of living (UNDP, 2018).
2
GII is a measurement of how equal countries are. All countries are ranked and being at the top of the list means
being the most equal country. The dimensions included in the GII are health, empowerment and labor market
(UNDP, 2018).
3
MPI is a measurement of poverty that goes beyond income. The considered dimensions of poverty are health,
education and standard of living. A country can score between 0.001 and 0.584. The higher the score the poorer
the country is. The MPI covers 77% of the global population (UNDP, 2018).
4
Land includes the food system.
12The majority of crop cultivation is rain-fed and there is very little irrigation (FAO, 2010). In
2010, 118,120 ha of the agricultural lands were equipped for irrigation but only 62,000 ha were
actually irrigated. Irrigation infrastructure is obsolete as most dates from the pre-independence
period. After independence, most landowners fled and abandoned their lands. The new owners
did not have the knowledge to keep the irrigation systems going. Another reason for the
decreased irrigation is that some irrigation schemes were destroyed and submerged by floods
in 2000 and 2001 (FAO, 2010). The potential for irrigation is 3,072 thousand ha, which means
that the actual irrigated area corresponds to only is 2% of the potential. Most of the potential
for cultivation is in the north and the middle of the country. The south has a much less favorable
climate; however, it is where the demand for agricultural goods is the greatest as it is where the
capital Maputo is located, where 38% of the country’s population live. The irrigated land is
owned by commercial farmers and the rest is used by farmer families and smallholders (FAO,
2010).
Of the working irrigation schemes, more than half is used for sugarcane and the remaining is
used for rice and vegetables (FAO, 2010). The main crops cultivated by the small farmers in
Mozambique are the food crops maize, sorghum, millet, rice, cereals, beans, groundnuts and
cassava and the cash crops tobacco and cotton. Livestock in Mozambique are cattle, goats and
sheep. The condition to keep livestock is excellent in the south but due to the tsetse fly it is
difficult to keep livestock in the north and the center of Mozambique. Many people have pigs
and poultry in their own back yard (FAO, 2010).
In 2015, 80% of the population could not afford an adequate diet. 24% of the population was
chronically food insecure and 25% suffer from malnutrition (WFP, 2018).
Energy – National
In 2014, the total primary energy supply (TPES) in Mozambique was 13,151 ktoe and the total
final consumption (TFC) was 10,414 ktoe (IEA, 2018). Figure 2 shows the shares of how much
energy the different energy sources contribute with. Biofuels and waste have the biggest shares
in both TPES and TFC and is mostly used for cooking, 98% of the population in rural area use
it and 69% of the total population (Hivos, 2009).
13Figure 2: Pie chart showing the share of energy sources for total primary energy supply and total final energy consumption
(IEA, 2018).
In 2014, the access to electricity in Mozambique was 21.87%. In rural areas only 4.45% had
access to electricity, while in urban areas access was 58.95% (The World Bank Group, 2014).
Table 1 shows electricity generation by fuel type.
Table 1: Electricity generated by fuel in 2014 (IEA, 2018)
Fuel Generated [GWh] %
Gas 2,554 12.8
Coal 0 0
Oil 152 0.8
Hydro 17,207 86.4
Total 19,913 100
Hydropower is the largest source of electricity in Mozambique. There are currently six main
hydropower plants. Five of them, Mavuzi, Chicamba, Corumana, Cuamba and Lichinga, are
operated by Electricidade de Moçambique (EDM, 2018). The largest, Cahora Bassa, is located
in the Zambezi valley and is operated by an independent power producer, Hidroeléctrictrica de
Cahora Bassa (HCB) (HCB, 2009). Most of the generated electricity from Cahora Bassa is
exported via the Southern African Power Pool (SAPP) (IHA, 2016). In addition to this there are
ten micro hydro power plants. The largest of micro plant has a capacity of 75 kW and the other
have a capacity of around 20 kW each (SCIELO, 2013). Table 3 shows how much capacity the
existing power plants have.
Table 2: The existing hydropower plants, largest to smallest (IHA, 2016).
Power plant Installed capacity [MW]
Cahora Bassa 2 075
Mavuzi 52
Chicamba 38.4
Corumana 16.6
Cuamba 1.9
Lichinga 0.730
Honde 0.075
14Chitofu 0.030
Ngwarai 0.025
Chihururu 0.022
Lino 0.022
Nquarai 0.022
Ndiriri 0.020
Jimy 0.018
Tendayi 0.014
Tendayi Zvemapowa 0.001
Total 2 184. 9
According to the International Hydropower Association (IHA) there is potential for 12 500 MW
hydropower in Mozambique. Over 80% of the capacity is in the Zambezi valley. The production
of electricity from hydropower is expected to increase (IHA, 2016). There are plans to expand
the Cahora Bassa plant with 1 245 MW and a new hydroelectric dam, Mphanda Nkuwa, with a
capacity of 1,500 MW (Club of Mozambique, 2018). The new plant will be on the Zambezi
river but there is no indication on what year it will be finished, or the construction initiated.
Water – National
Mozambique has abundant water resources. There are 13 main rivers running through the
country and two main lakes, Lake Nyasa and Lake Chiura. Yet, most Mozambican river basins
are sub-basins of transboundary river basins, which drain to the Indian Ocean in Mozambique.
The Zambezi River is the fourth largest river on the African continent and its basin holds the
majority of the potential for both irrigation and hydropower (NEPAD, 2013).
The wastewater treatment in Mozambique is extremely under developed and up until 2012,
Maputo was the only area connected to a central sewage system for domestic sewage. This
wastewater treatment plant is out of function causing the water to go untreated straight to the
Indian Ocean (FAO, 2016). Wastewater from industries is not treated either and is discharged
directly into the ocean or the nearest water course (FAO, 2016).
The agricultural sector has the highest water demand of all sectors. Of the 1,473 million m3
withdrawn water in 2015, 73% went to irrigation, forestry and livestock. 25% of the water was
used for the municipal sector and the remaining 2% for industry (FAO, 2016). ¨
In 2014, the share of the population that had access to basic sanitation services was 22.76%,
46.29% in urban areas and 11.42% in rural areas. The access to basic water services was
45.54%. In urban areas it was 77.74% and in rural areas 30.43% (World Bank, 2018).
Pungwe River basin context
The Pungwe river basin is located in the center of Mozambique. The western half is in the
Manica province and the eastern part in the Sofala province and a small part is in Zimbabwe.
Figure 3 shows the Pungwe basin outlined on a map and Figure 4 shows the Pungwe basin area
relative to the provinces of Manica and Sofala.
15Figure 3: Pungwe river basin outlined on a map of Mozambique.
Figure 4: Pungwe River basin outlined on Manica and Sofala. Manica is the province to the left and Sofala is to the right.
The Pungwe River originates in the Zimbabwe Highveld on an altitude over 1,000 m above sea
level and has its estuary near the city of Beira. It is 359 km long and covers an area of 31,000
km2 (SWECO, 2004). About 92% of the basin area is located in Mozambique. Table 3 shows
population and area distribution in the Pungwe basin in the two countries.
Table 3: Population and area of the Pungwe basin in Mozambique and Zimbabwe (SWECO, 2004).
Mozambique Zimbabwe
Population in basin (inhabitants) 1,103,698 95,869
Population (%) 95.3 4.7
Area of the basin (km2) 28,520 2,480
Area of the basin (%) 92.0 8.0
16The population in Pungwe is predominantly rural. Most of the urban population lives in the city
Beira by the river’s estuary.
Socio-economic trends
There are a few urban centers and one big city in the Mozambican part of the basin. Just like in
the rest of the country, most of the rural population works in agriculture and other agro-based
activities such as livestock production and fisheries. Other occupations include goldmining and
eco-tourism (Sida, 2008).
The education level in the Mozambican part of the basin is lower than the Zimbabwean. In
Mozambique most pupils only complete the first level of primary school and in the Zimbabwean
part most pupils proceed to the secondary level (Sida, 2008). Poverty is widespread in the rural
areas of the Pungwe River basin and income is lower than the level of basic needs (Sida, 2008).
Characterization of nexus systems
Climate
The climate in the northern and eastern part of the basin is tropical savannah and in the rest the
climate is humid and subtropical. The mean annual precipitation in the basin is 1,100 mm and
the mean annual runoff is 115 mm. The average annual flow is 6,600 mm3 the highest flow is
in February and the lowest is in October (Diop, et al., 2016). Pungwe experiences recurring
floods and drought due to its annual variation in precipitation. It is hard to control the impacts
of floods and droughts since the Pungwe River basin does not have any reservoirs that can assist
in flow regulation (Sida, 2008).
Land
The land classes in Pungwe are mostly different types of forest and woodland. A very small
part of the area is used for cultivated crops.
In this study the most important land class is cropland. Water for crops was identified as one of
the challenges in this report and the water demand for cropland increasing is one of the tested
scenarios. Specific information regarding the types of crops, and respective land shares,
cultivated in the Pungwe River basin were proven difficult to find in the literature. Thus, it was
assumed the cropland profile of the basin is similar to the provinces of Sofala and Manica. The
types of crops grown in the provinces are similar to the crops in the rest of the country, the
difference being that sesame is more common instead of sorghum and cassava. In the Manica
province the total cultivated area is 340,389 ha and in Sofala it is 262,286 ha (MASA, 2015).
Figure 5 shows the area share of each crop in the Sofala and Manica Provinces.
17Figure 5: Pie charts showing the crop shares in the Sofala and Manica provinces (MASA, 2015).
Energy
In the Mozambican part of the Pungwe river basin there is one operational micro-hydro power
plant (75 kW) in Honde Valley in the Manica province. It was constructed by the Provincial
Government of Manica with support from the German Development Agency (Jonker Klunne,
2013). It is used to electrify 200 households in a village near the valley as well as their health
center, school, a few shops and two maize mills. In 2013, there were no plans to build more
power plants in Pungwe river basin and no more recent reports state otherwise (Jonker Klunne,
2013). In the Zimbabwean part there are three hydro power plants, Pungwe A with a capacity
of 2.7 MW, Pungwe B with a capacity of 15 MW and Pungwe C with a capacity of 3.75 MW,
21.45 MW in total. Here are no immediate plans to expand the hydro power in the Pungwe
basin in Zimbabwe (IHA, 2016).
Water
The main source of water in the Pungwe River basin is surface water, and there is no
information regarding groundwater being additionally used. The Pungwe River and its
tributaries are the only sources of water (Sida, 2008). The water consumers in the basin are the
agricultural sector, municipal sector and industry and tourism. Agriculture and especially
irrigation consume the most, 86.5% of total water demand. Municipalities use 10.5% and
industry and tourism only 3% (Sida, 2008).
Overview of the status of the nexus systems
For this study the focus in on the water sector in the Pungwe River basin. In Table 4 most
important linkages related to the water sector are presented. Interlinkages in the nexus are not
always direct. For example, events in the land sector, such as increased agricultural area, can
18affect the water sector as the demand for irrigation increases. That in turn, can affect the
electricity sector as electricity is used to pump water. (Laspidou, 2017).
Table 4: Linkages between the water sector and the land and energy sectors. The third column provides an overview of
interactions between the water and climate systems (and not sectors).
Water used for Land Water used for Energy Water to Climate
● Water used for irrigation. ● Water is used in ● Water consumed might
● Water (as precipitation) hydropower plants to not return to the river
is linked to agriculture produce electricity. which can lead to water
productivity; shortage downstream.
● Water required for
domestic supply in
cities/villages, livestock
(agriculture).
Land used for Water Energy used for Water Climate to Water
● The use of land is linked ● Electricity is required for ● Precipitation amounts
to the water balance: it pumping water, both for affect how much water
affects how much water domestic water supply, will accumulate in the
is absorbed in the soil other supply, and river.
and infiltrates as irrigation. ● Temperature can
groundwater; it also ● Electricity is required to determine how much
affects how much water power water systems water evaporates to the
runs off to rivers and (includes pumping), and atmosphere.
streams, and how much for water treatment before ● Changed precipitation
water evaporates to the the water is distributed; patterns can cause more
atmosphere. Thus, land electricity is also required extreme floods and
cover affects the water in the treatment of droughts.
balance in a particular wastewater.
area. .
● Infrastructure (i.e.
industry) located on a
specific area can also
affect water availability,
depending on its water
footprint of production.
The challenges in the region affect the interactions between the nexus sectors. For example, the
need for more drinking water implies a requirement of increased electricity supply to pump and
treat the water. Climate change can cause a decreased water supply which in turn can affect the
agricultural production, part of the land system. Increased water demand for both domestic and
agricultural uses causes larger water abstraction from the river which affect the ecosystems and
the river flow downstream. This can cause the climate downstream to get drier which can have
severe impact in the region, especially during low flow or dry years when the water availability
will be decreased.
19Most of these challenges are not particularly threatening in their present state but as
urbanization and populations increase the pressure on all sectors increase and the challenges
get tougher. The current most prominent is the impact climate has on water. The region is
already affected by floods and droughts and a change in climate could have a negative impact
on the severity of these events.
Climate
According to studies made by SMHI (Swedish Meteorological and Hydrological Institute), in
collaboration with ARA-Centro and UNDP, the temperature is expected to increase by 2°C in
the dry season and by 1.5 °C in the rainy season. The precipitation is expected to decrease by
10% over all sub-basins and the rainy season will be delayed by one month (SMHI, 2006). In
this study, three scenarios were designed as combinations of two different global models, the
ECHAM4 and CCSM3, and two IPCC emission scenarios from the Special Report on
Emissions Scenarios (SRES) (Nakicenovic et al, 2000): A2, in which the global population
increases, Gross National Product (GNP) grows moderately and high emissions of greenhouse
gases (GHG); and B2, in which the GNP is the same as in A2, slower population increase and
lower GHG emissions. The timeframe was from 2006-2050.
Identification of water challenges in the Pungwe river basin
Even though Mozambique is not a water scarce country it faces many water challenges. One
challenge is that it shares most of its water resources with the neighboring countries and that it
is downstream from the other countries on all major rivers except Rovuma. This makes
Mozambique vulnerable from a water security perspective, if the upstream countries consume
too much water upstream and affect the flow downstream (The World Bank, 2007).
The infrastructure used for water in Mozambique is not sufficient to fulfill the water demand in
the country. There is limited storage for water which is unfortunate since there is high variation
in rainfall, 60-80% of the annual precipitation occurs in 4 months of the year, between
December and March. There is also large variation from year to year. Mozambique experiences
frequent floods and droughts and is not equipped with enough flood control infrastructure and
mechanisms (The World Bank Group, 2007). There is not enough infrastructure to provide the
entire population with water and sanitation. In 2015, 47% of the population had access to clean
drinking water and 23.5% had access to at least basic sanitation services (World Bank, 2018).
There is also not enough infrastructure to irrigate the cultivated land. Agriculture is the most
common occupation and a large contributor to the GDP. Expanding the irrigation schemes
would help with making sure more people had access to food and reduce poverty levels (The
World Bank Group, 2007).
Another challenge is to adapt to the climate change mentioned previously. Decreased
precipitation and higher temperatures are likely to cause reduction in water availability and
consequently affect water supply. The latter would exacerbate the other challenges mentioned
above.
20Review of studies focused on analyzing water resources availability and use in
Mozambique/Pungwe
Most studies with focus on the basin are led by non-Mozambican institutions although national-
level institutions are frequently involved. Of the studies used as sources in this report, many
were made by Swedish institutions in collaboration with Mozambican institutions and other
international organizations.
In 2004, SWECO made a thorough report on the basin in collaboration with Dutch and
Mozambican companies. The aim of the report was to find development strategies for the
Pungwe region. The conclusion reached was that to increase the social and economic benefits
for the population. Presented development options were to secure the water supply during dry
periods and control floods and pollution from for example gold mining. A suggestion to this
was to build both small and large dams and other hydraulic infrastructures. Another report from
the same consortium was released in 2005 stating the current water demand in the Pungwe
River basin in 2005 and predictions for the demand in 2025. They state that it is hard to make
projections for Pungwe since Mozambique does not have long-term plans related to water.
SMHI made a study with ARA-Centro to investigate the impact of climate change at basin
level for different climate futures. This report is referenced in several studies made on the
climate in Pungwe.
A report with focus on water resources and challenges related to economic development in
Mozambique was published by the World Bank in 2007. It states that in addition to the
population’s well-being, the economy in Mozambique is linked to water availability. Floods
and droughts have impact on the agriculture which in turn has impact on the GDP. It also brings
up the problem with shared water resources Mozambique. This study identified important areas
to improve that will need financial aid from the government and private actors. The
recommended priority areas were: development and management of water resources in the
Incomati, Umbeluzi and Zambezi basins; development of small scale water resources; risk
reduction and disaster management; development of policies in the water sector and
strengthening the institutions; as well as support in water and sanitation.
Water governance
National level
Law Nr. 16/91 is the law that regulates water use in Mozambique. It covers all inland waters,
surface waters, groundwaters and all hydraulic works, equipment and dependencies. The water
use is divided into common and private use. The common water use is free and used for
domestic purposes, small-scale agriculture and cattle. For private use an authorization is
required that can be given by law, license or concession. In the event of water scarcity, the law
states that all common use and water used for environmental conservation has priority over all
private uses (Sida, 2008).
Basin level
There are five regional water agencies responsible for the management of water resources’ use
on a local level. The location of rivers and basins decide which agency they belong to. The
21Pungwe basin belongs to ARA-Centro (NEPAD, 2013). Figure 6 shows the spatial scope of
action of the different water agencies.
Figure 6: The water agencies in Mozambique (NEPAD, 2013).
The strategic plans are mostly organizations wanting the Mozambican government to make
Water, Sanitation and Hygiene (WASH) programs a higher priority (WaterAid Mozambique,
2016). There are several Non-Governmental Organizations (NGOS) operating in the water
access and sanitation challenges in Mozambique. WaterAid Mozambique’s strategy to ensure
that access to increase Water, Sanitation and Hygiene (WASH) services, is to mobilize
communities and make them claim their rights. They also want to put pressure on the
government to make WASH a higher priority when implementing policies, and make other
sectors care more about and bring attention to WASH services (WaterAid Mozambique, 2016).
UNICEF is investing in WASH programs in schools and small towns in Manica, Inhambane
and Tete. The goal is to reduce the gap in access to WASH services between urban and rural
areas (UNICEF, 2014).
Methodology
For the first part of the project an extensive literature review was performed for an
understanding of the status of nexus systems and of the socio-economic situation in
Mozambique, with emphasis on the Pungwe River basin and its water resources. The main
sources of the literature review include the World Bank Group, FAO, UNDP and SWECO, as
well as the Mozambican institutions such as the Ministry of Agriculture (Ministério de
Agricultura e Seguranca Alimentar, MASA), and the National Institute of Statistics, (Instituto
Nacional de Estatística, INE). With the information from the literature review the river basin
could be identified and the water challenges in the basin could be defined. The Pungwe River
basin was chosen because of the amount of available data. It was one of the basins with the
most stream gauge data. Unlike all other river basins, the largest part of the basin is located in
Mozambique. Because of this the same water agency is in charge of most of the basin which
makes it easier to gather information about it.
22Next step was to model the basin in the Water Evaluation and Planning (WEAP) software.
WEAP is a modelling tool for water systems management developed by SEI (WEAP, 2018).
For the modeling to be possible, a geospatial analysis was made with ArcGIS to calculate land-
use related parameters, define the physical boundaries of the system, and also for population
analysis. The location of stream gauges was used to define the number of sub-catchments in
ArcGIS. These calculations were then used to develop a water system model the Pungwe basin
in WEAP. The three catchments had one demand site each, used to represent use of water by
urban and rural population as well as agriculture demand for irrigation.
When the reference scenario was modeled three new scenarios where developed, based on the
water challenges identified for the Pungwe river basin. Scenarios are discussed in the chapter
“Scenarios for Pungwe River basin” in the report.
Overview of methodology
Figure 7 shows a diagram over the methodology. The diagram shows what tasks were done and
in what order. It starts in the top left corner with literature review. The next steps was the
geospatial analysis, data collection and the identification of challenges. The rounded parts show
what kind of data was collected from the data and calculated with geospatial analysis. Data
from the geospatial analysis and data collection were entered in WEAP to model the river basin
and a reference scenario. Following the identification of challenges new scenarios to be tested
were developed and they could also be modeled in WEAP. When the modeling was finished
the results were analyzed and conclusions were drawn.
Figure 7: Diagram of the main methodological steps followed in this study for the analysis of water challenges in the Pungwe
River basin.
WEAP model development
For the modelling a tool for Water Evaluation and Planning, WEAP, was used.
The purpose of WEAP is to help in supporting decisions concerning integrated water resources
and policies. The calculations are based on rainfall, base flow and groundwater recharge. It can
be used to calculate, for example, water demand, supply, runoff, streamflow, storage and
discharge.
23But before the WEAP modeling could start, a geospatial analysis was made with ArcGIS, a
geospatial analysis tool, publicly available datasets were retrieved from different websites and
imported to ArcGIS. The boundaries of the system were defined by the Pungwe River basin
and the time frame for which the model should count for was set up until 2050.
For this report rasters and shapefiles containing information on topography and information on
land use for Mozambique and Zimbabwe were added as well as run off stations along Pungwe
River. To calculate the flow direction and river accumulation, rasters and tif files from different
areas had to be mosaicked to get a complete picture of the basin. After that the tools used in the
program is called flow accumulation and flow direction. In order to calculate the catchments,
pour points were placed on the run off stations and the tool snap was used. The tool tabulate
area was used to calculate the land use for the Pungwe basin and for the catchments inside.
The sources and respective datasets used in the geospatial analysis, performed using ArcGIS,
are presented in Table 5.
Table 5: Sources for the data used in the geospatial analysis.
Data Year Source URL
Population data 2000 Worldpop http://www.worldpop.org.uk/data/summary/?doi=10.
5258/SOTON/WP00178
Administrative 2013 GADM https://gadm.org/download_country.html
boundaries
Transmission 2015 Geofabrik http://kunden.geofabrik.de/5b0549d1678781b49910
lines e0d875210452/
Rivers and Geoserver http://geoportal.rcmrd.org/geoserver/wfs?format_opt
streams ions=charset%3AUTF-
8&typename=servir%3Amozambique_rivers_and_st
reams&outputFormat=SHAPE-
ZIP&version=1.0.0&service=WFS&request=GetFea
ture
Land use Forobs http://forobs.jrc.ec.europa.eu/products/historical_pro
ducts.php
Roads Geo server http://geoportal.rcmrd.org/geoserver/wfs?format_opt
ions=charset%3AUTF-
8&typename=servir%3Amozambique_roads&output
Format=SHAPE-
ZIP&version=1.0.0&service=WFS&request=GetFea
ture
Stream gauges 1981 GRDC http://www.bafg.de/GRDC/EN/Home/homepage_no
(Global de.html;jsessionid=EA67EEED8E9C3060B233A31
Runoff A20077DE4.live21302
Database)
Climate data 2000 KNMI https://climexp.knmi.nl/start.cgi?id=someone@some
Climate where
explorer
Digital 2003 CGIAR http://srtm.csi.cgiar.org/
elevation maps
24SRTM 90m
(1km)
When the geospatial analysis was done, the first step of the WEAP model was to create the
schematics of the basin and respective catchments ot be modeled. The schematic includes the
representation of the river and the catchments, demand sites of the basin as well as the
transmission links and return flows of the catchments and demand sites and the location of
stream gauges on the river. An analysis of the past flows was made using historic data from
stream gauges and climate stations.
The next step was to create the reference scenario, REF, where current data was entered and
future trends were defined, based on historic trends and assumptions in line with a continuation
of the recent development, without major changes. The needed data can depend on what
calculations are made and, in this case, the necessary data is water demand for agriculture and
municipalities, precipitation, runoff, groundwater resources. In the reference scenario the future
of the basin was predicted as if trends continue as they always have with current policies in
order. After that a set of other scenarios were created, based on the REF scenario, but some
variables were changed in order to see how they affect the outcome. The new scenarios were
an access to water scenario, a climate change scenario and an irrigation scenario, and are
explored in more detail in the scenario section. After all scenarios were finished, the last step
was to analyze and compare results across scenarios and derive insights from the findings.
Model structure
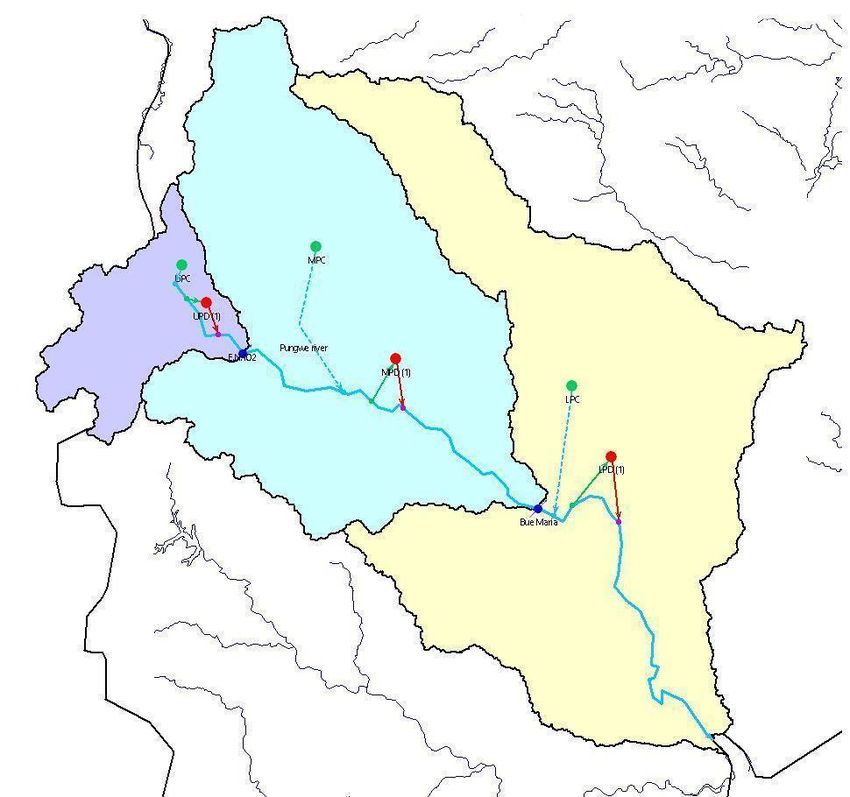
The boundaries of the Pungwe river basin and catchments considered in the analysis are shown
in Figure 8. The river starts in the north west and flows to the south east where it meets the
ocean. The basin was split in 3 catchments identified as “Upper”, “Middle” and “Lower”
following an upstream to downstream representation. The catchment in purple is Upper
Pungwe, Middle Pungwe is represented in blue, and the yellow is Lower Pungwe. The green
dots describe the catchments and the red dots represent demand sites. The blue dots in between
the catchments, and placed over the river, identify the stream gauges. Each catchment has its
run-off accumulation point in a stream gauge (except for the lower which drains into the ocean),
therefore, the number of stream gauges provide an indication of how many catchments to
consider in the analysis, as the data from the flow measurements can be used for calibration of
the modelled flow. Between the Upper and Middle Pungwe is the stream gauge E.N. 102 and
between Middle and Lower is the stream gauge Bue Maria. From every green dot is a blue
dotted line that represents the run off to the river. To every red dot there is a green line that
represents a transmission link to the demand sites and from the red dots there is a red line that
represents the return to the river.
In the catchments the data entered is the area, climate and land classes of each catchment. It is
defined under land classes how big the share of each land class is and what their kc5 is. The soil
5
Kc, crop coefficient, is a property that predicts a plants evapotranspiration. The Kc is different during the different
phases of the plant. Starting with initial kc_ini the beginning of the season. During the crop development the kc
increases. When it reaches its peak, in the beginning of the mid-season kc_mid is used. In the end of the mid-
season the kc starts to decrease during the late season, the kc in the end of the cycle is kc_end.
25moisture method is used for the water balance in the catchments. The soil moisture method is a
two dimensional “bucket” scheme. The first bucket is closest to the surface and is called the
soil water capacity and the second bucket is the deep water capacity (WEAP, n.d.).
Water users are represented in the demand sites. In this model the two water consumers
considered are population, split in urban and rural, and agriculture. Activity levels define how
much population lives in each catchment; and in water use, annual consumption per person per
day multiplied by the number of days in one year, to estimate the total annual consumption per
person. In agriculture, the irrigated area of each catchment is entered as well as the annual water
consumption per km2. Irrigated areas in the demand sites and in the catchments are equivalent.
Stream gauge data is entered under supply and resources.
Figure 8: Schematic of the Pungwe River basin in WEAP.
Model calibration
The development of a water model (not only a WEAP model), which aims at replicating the
natural availability of water resources, requires the calibration of the results to make sure the
model is producing results which are coherent with the actual flow of the river. This ensures
the model can be used to evaluate future scenarios of water supply and demand. The measured
26stream flows in the stream gauges (obtained from GRDC) are compared to the stream flows
produced by the model, for the reaches before the gauges. Measured stream flows for the Bue
Maria stream gauge cover the period of 1954-1981 and measured stream flows for E.N.102,
1954-1980. Therefore, the calibration period was 1954 - 1980. When comparing the stream
flows obtained with the model and the stream gauges data, it is verified that the peaks on the
graph should align and they should be similar in height. Figure 9 shows the streamflow’s for
the Bue Maria stream gauge, between the middle and lower catchment. The peaks are aligned
as they should. It is often hard to make a perfect calibration for both high and low flows. At
Bue Maria the low flows are better calibrated than the high. This can be seen in Figure 10 which
shows the percentage of time exceeded at different flows. The two lines should be as close to
each other as possible.
Figure 9: Streamflow comparison at the Bue Maria stream gauge. The red line represents historical data and the blue line
represents the stream flow obtained by the model.
Figure 10: Percentage of time exceeded at the Bue Maria stream gauge. The red line represents historical data and the blue
line represents the stream flow obtained by the model.
At the E.N. 102 stream gauge, between the upper and middle catchments, the peaks are also
aligned with some peaks corresponding very well to each other and some that don’t correspond
that well as can be seen in Figure 11. For this stream flow the calibration worked better for the
high flows than the low. Figure 12 shows the percent of time exceeded and it can be seen that
the two lines are close to each other.
27You can also read