Using Twitter to Understand Public Interest in Climate Change: The Case of Qatar - AAAI
←
→
Page content transcription
If your browser does not render page correctly, please read the page content below
The Workshops of the Tenth International AAAI Conference on Web and Social Media
                               Social Web for Environmental and Ecological Monitoring: Technical Report WS-16-20

                                    Using Twitter to Understand Public
                              Interest in Climate Change: The Case of Qatar
            Sofiane Abbar† , Tahar Zanouda† , Laure Berti-Equille† , Javier Borge-Holthoefer‡
                                †
                                 Qatar Computing Research Institute, Hamad Bin Khalifa University
                                                        PO 5825, Doha, Qatar
                         ‡
                           Internet Interdisciplinary Institute (IN3-UOC), Universitat Oberta de Catalunya
                                                  08018 Barcelona, Catalonia, Spain
                                {sabbar, tzanouda, lberti}@qf.org.qa, borge.holthoefer@gmail.com

                            Abstract                                       such as the United Nations are working more than ever on
                                                                           raising and maintaining public awareness toward this issue.
  Climate change has received an extensive attention from pub-
  lic opinion in the last couple of years, after being considered          While sensing the engagement of governments to mitigate
  for decades as an exclusive scientific debate. Governments                the causes of climate changes such as dioxide carbon emis-
  and world-wide organizations such as the United Nations are              sions is relatively straightforward by looking at the interna-
  working more than ever on raising and maintaining public                 tional treaties and protocols ratified, it is not clear how to
  awareness toward this global issue. In the present study,                achieve the same objective at citizens’ scale, who are part of
  we examine and analyze Climate Change conversations in                   the causes and consequences of this shared problem. Tradi-
  Qatar’s Twittersphere, and sense public awareness towards                tional surveys such as field interviews are costly and do not
  this global and shared problem in general, and its various re-           scale for obvious reasons. To address this concern, we build
  lated topics in particular. Such topics include but are not lim-         on our experience in analyzing Twitter’s content (Abbar,
  ited to politics, economy, disasters, energy and sandstorms.
                                                                           Mejova, and Weber 2015) to sense the awareness of people
  To address this concern, we collect and analyze a large dataset
  of 109 million tweets posted by 98K distinct users living in             toward climate change and investigate their interest toward
  Qatar – one of the largest emitters of co2 worldwide. We use             its multiple topics. The recent multiplication of hazardous
  a taxonomy of climate change topics created as part of the               natural disasters around the world and the news coverage
  United Nations Pulse project to capture the climate change               they received have helped disseminate awareness among in-
  discourse in more than 36K tweets. We also examine which                 dividuals about the consequences of climate change prob-
  topics people refer to when they discuss climate change, and             lems, which happens to be amplified by social network plat-
  perform different analysis to understand the temporal dynam-             forms.
  ics of public interest toward these topics.

                                                                           Main contributions. In this study, we are interested in
                        Introduction                                       sensing the public interest in climate change of people liv-
In 2011, the state of Qatar was designated by the World Bank               ing in Qatar. This is achieved by analyzing a large collection
as the highest per-capita emitters of CO2 in the world with                of tweets posted between 2011 and 2016. Unlike previous
more than 44.02 metric tons per person (WB 2015). This                     studies that focused either on a limited set of climate change
surprisingly high rank is actually due to Qatar’s massive en-              related keywords or on a set of geo-coded tweets (represent-
ergy sector and relatively small population. With a popula-                ing only 2% of twitter traffic), our approach aims at captur-
tion of only 2.4 million in 2015 (1.8 million in 2011), Qatar              ing most of the discourse related to climate change under
was in 2013 the world’s fourth-largest dry natural gas pro-                its different aspects ranging from politics and economy to
ducer, and world’s first liquefied natural gas (LNG) exporter                energy and disasters. Our main contributions include: (i)
in 2014 (QNB 2015). Given the serious implications that                    We identified of 117K users (5% of the entire population)
such high emissions of greenhouse gases may have on popu-                  claiming they live in Qatar and collected all their climate
lation’s health and wellbeing and on the national eco-system               change related tweets using a rich taxonomy of topics de-
and biodiversity equilibrium, the government of Qatar has                  veloped by the United Nations; (ii) We propose to use net-
taken many steps toward limiting the country’s ecological                  work backbones analysis to better understand relationships
footprint (Alhorr, Eliskandarani, and Elsarrag 2014). For in-              between hashtags in co-occurrence graphs; (iii) We analyze
stance, Qatar hosted in 2012 the Conference of the Parties                 different time series of different topics and infer the most
(COP18) of the United Nations Framework Convention on                      driving topics discussed in the context of climate change.
Climate Change where an agreement was signed to extend
the life of Kyoto protocol till 2020 (UNFCCC 2012).
   Qatar’s mission to limit the country’s carbon footprint                 Challenges. The main challenge we encountered in this
is part of a global movement to act on the urgent warn-                    study was identifying a relevant and accurate taxonomy of
ings emanating from the scientific communities about Cli-                   terms to use in order to retrieve climate change related posts.
mate Change. Governments and world-wide organizations                      Many studies have focused on the usage of a single word,

                                                                     168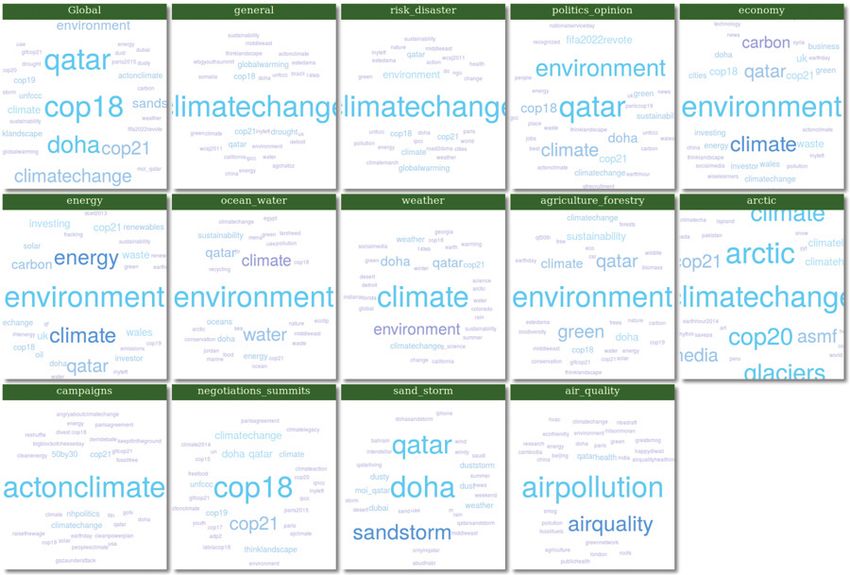
i.e., climate in (Cody et al. 2015), climate change in (Kir-            high correlation with particle pollution levels, which makes
ilenko and Stepchenkova 2014), and some of them added                   the use of social media data valuable to augment existing air
a handful of other terms to it such as global warming in                pollution surveillance data, especially perception.
(Jang and Hart 2015; Veltri and Atanasova 2015). We finally                 Alternatively, other studies have demonstrated the util-
decided to use a taxonomy developed by a United Nations                 ity of social media data sources to analyze public aware-
work group including climate change experts and social sci-             ness about climate change, and the influence of mass me-
entists (ung 2014). The taxonomy is composed by a set of                dia to interpret global climate problems from the differ-
topics, each one is defined by a set of keywords or hashtags             ent angles (causes and remedies) (Hart and Feldman 2014).
that should co-occur in a particular way. The experts have              While Veltri and Atanasova (Veltri and Atanasova 2015)
tried as much as possible to keep the set of terms that define           highlighted the potential opportunity of using social media
topics disjoint. The other challenge was to identify correctly          to analyze and understand public opinion dynamics. Oltre-
users living in Qatar and crawl all their tweets. We have               anu et al. (Olteanu et al. 2015) compared the coverage of
provided a heuristic based on following relationship and a              climate change in both, social media and mainstream news.
gazetteer of locations to find relevant users. Parsing a collec-         This comparison uncovered significant differences between
tion of 109 million tweets to extract climate change related            triggers, actions, and news values of events covered in both
ones, and working to keep the level of noise to its minimum             types of media. For instance, mainstream news sources fre-
possible level was a challenging task as many manual check-             quently feature extreme weather events framed as being a
ing was required.                                                       consequence of climate change, as well as high-profile gov-
                                                                        ernment publications and meetings. In contrast, actions by
Context of the study. In this study, we focus on Twitter                individuals, legal actions involving governments, and inves-
conversations related to environmental issues posted by peo-            tigative journalism feature frequently as viral events in social
ple living in Qatar. Qatar is a small peninsula in the Arabian          media (Kwak et al. 2010; Olteanu et al. 2015).
Gulf. It is the home of a native population of approximately               As most of people have no deep scientific understanding
300,000 Qataris, who live among a total population of 2.4               on climate change, their perceptions are most likely influ-
million (Snoj 2013). Internet penetration is high in Qatar;             enced by framing strategies (Weber and Stern 2011) , which
85% of the population has Internet access. In addition, so-             leads the research community to question public opinions
cial media are popular and widely used among the native                 over time and location, along with the role that mass me-
population –65% of Qataris have an Instagram account, 44%               dia played. Cody et al. (Cody et al. 2015) studied user
are on Facebook, and 46% use Twitter (Radcliffe 2015).                  sentiment toward climate change by analyzing environment-
                                                                        related tweets posted between 2008 and 2014. The study
Roadmap. The rest of the paper is organized as follows.                 shed a light on how climate news, events, and disasters af-
We start by providing a literature review on related work.              fects people’s sentiment. An et al. (An et al. 2014) also con-
Then, we define the methods used for the analysis. Next, we              duct an opinion analysis of climate change related tweets.
describe the datasets we collected. Then, follows a section             Authors aimed at understanding whether Twitter data min-
that presents and discusses our findings. Finally, we con-               ing can complement and supplement insights about climate
clude the paper with some insights.                                     change perceptions, especially how such perceptions may
                                                                        change over time upon exposure to climate related hazards.
                     Literature Review                                  A combination of techniques drawn from text mining, hier-
                                                                        archical sentiment analysis and time series methods is em-
Climate change is a major challenge facing the world, with              ployed for this purpose. At a large scale, Jang and Hart (Jang
myriad causes and consequences. One of the leading con-                 and Hart 2015) investigated how people incorporate climate
tributors to the rising levels of CO2 emissions is the activity         change into everyday conversation by the stream of Twitter
of humans in urban places, as a consequence, the unmanage-              over two years. Their study shows geographical differences
able rising of CO2 emissions altered global climatic condi-             in the use of frames and terms concerning climate change,
tions and indirectly harms the environmental ecosystem 1 .              and how certain frames that promote skepticism about cli-
In order to strategically raise public awareness on climate             mate change are widely circulated by users within specific
change issues, and protect the world’s shared natural en-               regional and political contexts.
vironment for sustainable and spiritual benefit, researchers
have analyzed public opinions to identify public awareness,                In this paper, we analyze climate change conversations
                                                                        and air quality trends in Qatar through the lens of social
examine this trend on the social media sphere and investi-
                                                                        media data, and investigate the ability of measuring public
gate lasting public awareness plans.
                                                                        awareness, along with the impact of environmental factors
   As most people have limited resources to get accurate data
                                                                        on public conversations.
on air pollution and climate change, Wang and Paul (Wang,
Paul, and Dredze 2015) have investigated the value of so-
cial media as a sensor of air quality and public response.
Authors analyzed more than 93 million messages from Sina                                          Methods
Weibo, China’s largest microblogging service and found a
                                                                        We describe in this section the methods we used in this
   1
       http://www.un.org/climatechange/                                 study.

                                                                  169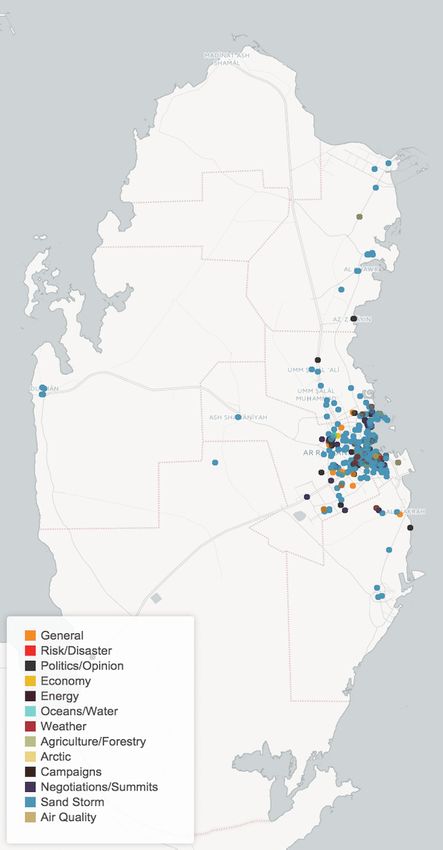
Building the Network of Co-occurrences
The relationship between different concepts in the dataset
can be suitably represented as a network. Nodes in the net-
work represent concepts, and a link from node i to node j
implies that the corresponding concepts of the two nodes
co-occur in the same tweet. More importantly, each node
bears an associated quantity a that stands for the proportion
of tweets in which it appears. On the other hand, each link
from i to j has an associated weight (i, j, w), which states
the fraction of tweets in which these two nodes co-occur.

Network backbone extraction
Networks can be described from different levels of analy-
sis. At the micro level, the focus lies on single nodes and
their specific positions within the overall structure; this level
can be described in terms of node degree, strength or clus-
tering coefficient, among other metrics. At the macro level,                           (a) Tweets             (b) Census 2010
the focus shifts to the aggregation of those metrics and the
properties of their distribution. Between these two extremes,
we have a third level of analysis, the mesoscale, which aims                                 Figure 1: Qatar Maps
at accounting for the complexity of networks between the
position of individual nodes and the relational properties of
the collectives they form. It is at this level where reduction           actual and natural responses to users toward different envi-
techniques like backbone extraction operate.                             ronmental topics as they get exposed to them through news
   Network backbone extraction refers to the filtering tech-              media or witness them happening during natural disasters,
niques aimed at uncovering relevant information; in general,             heavy rains, drought, etc. Underground Weather is used
such techniques aim at pruning the links of a network, keep-             to collect daily weather conditions in Doha, the capital of
ing only those which are statistically relevant. Ideally, the            Qatar. It is worth noticing that Qatar is a relatively small
reduced structure is computationally more tractable while it             country (area: 11,586 km2 ) with more than 80% of its pop-
retains most of the interesting features of the original one.            ulation based in the city of Doha. Thus, the weather does
We apply the state of the art backbone extraction algorithm              not vary that much from a location to another in the coun-
proposed in (Serrano, Boguná, and Vespignani 2009) to the               try. We explain in the following the processes by which we
network of hashtag co-occurrences. In their work, Serrano                collected and curated the different datasets.
et al. exploit the empirical trend by which link weights are
heavily fluctuating, i.e., only few links carry the largest pro-
portion of the node’s strength.                                          Identifying users of Qatar
Linear Correlation
                                                                         First, we created a gazetteer of locations in Qatar including
We use Pearson product-moment coefficient to measure the                  the names of main cities and districts in both English and
linear correlation between different pairs of variables (en-             Arabic, and under different spellings. We matched this list to
vironment topics and weather conditions) of interest in this             a 45 day sample of the Twitter Decahose (a sample of 10% of
study. Pearson correlation score ranges in [−1, 1] where 1               all Twitter traffic.) For each user whose tweet was captured,
(resp. -1) means the existence of total positive (resp. nega-            we requested the list of their followers based on the intuition
tive) correlation and 0 means no correlation at all. Pearson             that for an average user, followers are more likely to be from
formula between two time series X and Y is given below:                  the same country.
                      E[(X − μX )(Y − μY )]                                 Then, we requested the profiles of the followers and filter
              ρX,Y =                                     (1)             out those users who did not mention a location correspond-
                                σX σY
                                                                         ing to Qatar’s gazetteer. The same process was iteratively
   where: μX , μY are the means of X, Y respectively, and                executed on the list of newly added users; i.e., find their fol-
σX , σY are the standard deviations of the two corresponding             lower IDs, then follower profiles, then filter out followers
time series.                                                             with irrelevant locations, until no new users are identified.
                                                                         To expand the list of users even further, a social analytics
                          Datasets                                       tool (FollowerWonk.com) was used to obtain lists of users
To conduct this study, we need to combine data from two                  who mention a location associated with our gazetteer. This
different sources: Twitter and Weather Underground.                      list was then merged with the list obtained earlier from Dec-
   We use Twitter to collect user generated content about                ahose and Twitter API. The resulting list consists of over
environment related topics. As there is not solicitation for             117K users who claim to be living in Qatar in their Twitter
users to post on Twitter, we claim that this data reflects the            profiles.

                                                                   170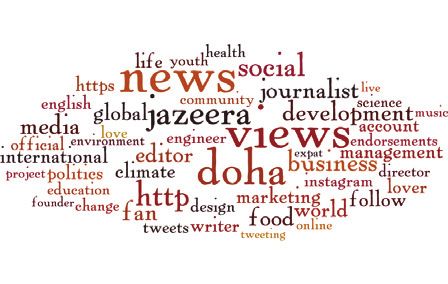
Collecting user tweets                                                  instance, a tweet is about Politics&Opinions if and only if
                                    2
We use Twitter Historical API to collect up to 3,200 tweets             it CONTAINS ANY {climate, enviro, environment, carbon}
posted (the maximum allowed by Twitter API) for each of                 AND NOT CONTAINS ANY {monoxide, fork, copy, fiber}
the users of Qatar identified in the previous step. This col-            AND CONTAINS ANY {politics, group of eight, . . . }.
lection has been conducted twice. The first time was in July                The dusty construction sites in the middle of the city, and
2014 and the second time was in February 2016. Hence,                   the flat dusty landscape stretching out of the capital’s bor-
we could obtain for each user up to 6,400 tweets he posted              ders, both contribute to complicated air quality conditions.
over a period of nine years (from 2007 to 2016). This col-              We added Air Quality topic separately to captures conver-
lection generated a total of 109.6 million tweets posted by             sations around air quality and sense how people talk about
more than 98,066 different users. The remaining missing                 the air they breath by tracking words that refer to air and
users have either a disabled or protected account. As Twitter           air pollution (e.g., air quality, air pollution ). Like Coun-
was launched in 2006 only, the activity of the users of Qatar           tries in the region, Qatar has built cities in the middle of the
was very marginal before 2011. Thus, we focus in this study             desert. Heavy sandstorms hit the country regularly, and keep
on the time period spanning from January 1rst, 2011 to Jan-             fine dust hanging in the air for days. Thus we added Sand-
uary 1rst, 2016.                                                        storm topic composed of terms such as duststorm, dusty, and
                                                                        sand storm. A full list of topics with their respective defini-
Weather data                                                            tions, terms, and matching conditions can be downloaded
We use Weather Underground (WU) API (Underground                        from (Zanouda and Abbar 2016).
2016) to collect data about daily weather conditions in Qatar           Data Curation
for the same time period. Out of the sixty different measure-
ments WU API returns, we were particularly interested in                Next, we started doing a qualitative analysis on our dataset
the ones that are more likely to sprinkle climate change re-            to determine content that might not be relevant in our analy-
lated tweets, these measurements include: temperature (◦ C),            sis. We have noticed that some irrelevant keywords such as
humidity (%), wind speed (km/h), visibility (km), and pre-              Syria, California, Colorado, etc. were appearing to the top
cipitation (mm) (including: rain, snow, etc.)                           of co-occurrence lists. The manual inspection allowed us
                                                                        to identify some bots that were re-tweeting all tweets about
Extracting environment and climate change tweets                        Syria with by appending US state names as hashtags.
                                                                           At the end of this process, we obtained a clean set of
In order to identify the climate change related content, we
                                                                        36,612 environment relevant tweets posted by 8,470 differ-
use a taxonomy of keywords grouped into topics on interest.
                                                                        ent users (also known as tweeps).
Previous studies have used simple keywords to filter climate
                                                                           Figure 1 shows the geo-coded tweets related to environ-
change tweets. Cody and Reagan for instance used only one
                                                                        ment that we have gathered, and a population census from
word climate (Cody et al. 2015). Veltri and Atanasova used
                                                                        2010 for comparison. The most populated area is definitely
two keywords climate change and global warming (Vel-
                                                                        around the capital city of Doha, with beaches and main roads
tri and Atanasova 2015) while Andrei and Svetlana added
                                                                        being other popular posting sites. A shallow visual inspec-
translations of the aforementioned words in German, Por-
                                                                        tion reveals that posting proficiency is correlated with popu-
tuguese, Russian and Spanish (Kirilenko and Stepchenkova
                                                                        lation density in general.
2014). Jang and Har also used the keywords climate change
and global warming paired with some specific terms related               Table 1: Description of the final set of topics related to envi-
to different frames (Jang and Hart 2015).                               ronment and climate changes with some basic statistics.
   We use in this paper a taxonomy of climate change top-
ics(ung 2014) developed by the UN Global Pulse team. The                       Category           #Tweets    #Users    T/U       %T
taxonomy consists of set of topics, each of which is defined                     General             3828      1293     2.96     10%
with a list of terms and hashtags that should co-occur in a                  Risk/Disaster          320       129      2.48      8%
particular way. According to René Clausen Nielsen – data                  Politics/Opinion        11124      3192     3.48     30%
innovation specialist in UN Global Pulse – the taxonomy is                     Economy              2615      1038     2.51     07%
created by climate change experts as follows: (1) find a list             Negotiations/Summits       7576      1080     7.01     20%
of relevant words. (2) find synonyms, plurals, and abbre-                        Energy              1716      722      2.37      4%
viations by searching Twitter and dictionaries. (3) Group                 Agriculture/Forestry      1119      659      1.69      3%
words into distinct topics. (4) Create negative filters to get                Ocean/Water            458       289      1.58      1%
rid of occurring noise (Nielsen 2016).                                        Campaigns             470       159      2.95      1%
   An important feature of the used taxonomy is the fact                        Arctic              132       112      1.17     0.3%
that topics are carefully defined not to allow overlap-                        Air quality            69        41      1.68     0.1%
ping. These topics are: General, Risk&Disaster ,Poli-                         Sandstorm            13124      5605     2.34     30%
tics&Opinion, Economy, Energy, Oceans&Water ,Weather                           Weather              1139      793      1.43    0.03%
,Agriculture&Forestry, Arctic , Campaigns , Negotia-
tions&Summits. For a tweet to be labeled as belonging to                   Table 1 illustrates the final set of topics related to envi-
a particular topic, it should satisfy a list of conditions. For         ronment and climate changes with some basic statistics in
                                                                        terms of number of tweets, number of users, ratio of tweets
   2
       https://dev.twitter.com/, last accessed on Feb,2016              per user and percentage of tweets related to each category.

                                                                  171
Results
In this section, we present the results of different analy-
sis performed on the set of environment-related tweets de-
scribed in the previous section. First, we show the temporal
trends of people reactions to different environmental topics.
We show also the most prominent hashtags associated with
different topics. Then, we look at the co-occurrence graph of
these hashtags to unveil different hashtag relationships and
graph topologies. Finally, we analyze user profiles to check
whether users posting about environment demonstrate any
specific characteristics.
Temporal dynamics
Figure 2 shows the trends of the monthly total number of
tweets (a) and unique users (b) observed in the Qatar “twee-
tosphere”. The blue curves represent the trends of all the
tweets posted while the green curves represent environment
related tweets only. To ease the reading, the y-axis is plotted
in log scale. The first striking observation is that even in log
scale, users’ activity around environmental topics fluctuates
a lot compared to the smooth general discussions on Twitter.
Most of the spikes observed in Fig 2(a) can be explained by Figure 2: Monthly volume of the total number of tweets
looking at the tweets posted around the spike period. For in- and unique users in log scale in Qatar from January 2011
stance, one of the most noticeable burst, the one happening to January 2016. We see that climate change curves present
in November-December 2012 is a response to the Confer- a noticeable variance over time unlike the general smoother
ence of the Parties (COP18) that took place at Qatar late in Twitter pattern.
2012. That conference to which more than 50 presidents
from around the world took part received a large news cov-
erage locally and internationally. Yet, people living in the Twitter by the people of Qatar as this has a direct and imme-
small peninsula of Qatar have extensively experienced the diate impact on their lives. The figure shows also that when
conference as it has directly impacted their everyday life in the people of Qatar discuss about environment on Twitter, it
terms of commute deviations, security enforcement, and ac- is mostly about Politics&Opiniom, Negotiations&Summits,
cess limitations to some hotels. All this has generated an and climate change in general. The less covered topics in-
unprecedented excitement on Twitter for the event. This ob- clude Oceans&Water, Arctic and surprisingly Air Quality.
servation is corroborated by Fig 2(b) in which it is easy to Second, one can easily see that topic time series follow dif-
see the important burst of the number of unique users who ferent trends. Indeed, while some topics such as Economic
took part of discussions and debates around COP18 con- and Energy maintain a decent level of activity throughout
ference. The second sharper spike that takes place around the years, other topics such as Negotiations&Summits and
March 2015 is due to a sudden strong sandstorm that hap- Arctic are sparse and only acquire users’ attention when a
pened in Qatar in that same period, causing schools and in- related event happens.
stitutions to close doors on that day as it was almost impos-
sible to drive. As an example, the below-mentioned tweet Content Analysis
is posted by Qatar’s Ministry of Interior on 1st April 2015
3
: “Visibility is almost zero in all roads inside and on high- In order to visually inspect the content of tweets in differ-
ways. Motorists are requested to follow safety instructions. ent topics, we plot Figure 4 in for each topic, we gener-
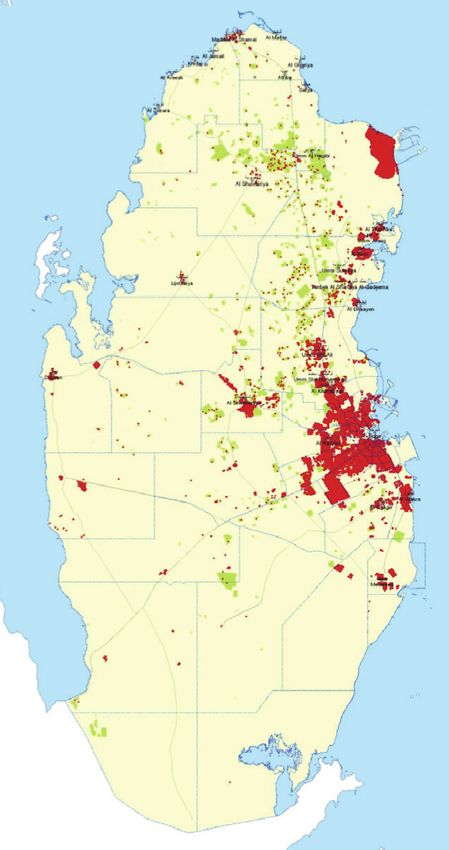
#MoI Qatar.” ate its word cloud of the most frequent hashtags mentioned
Continuing further with the temporal analysis of our set in the corresponding tweets. The font size of hashtags is
of tweets, we plot in Figure 3 the breakdown of this trend proportional to their frequencies in different topics. These
into different topics by providing the daily time series of word clouds reveal for instance that the hashtag #COP18
the number of tweets associated with each topic. The first is dominating in our dataset of tweets (global word cloud)
figure to the left (Global) plots the daily time series of all and is obviously dominating in tweets belonging to Nego-
environment-related tweets. Some observations can be done tiations&Summits. We also found the hashtags #environ-
here. First, the different topics vary a lot in terms of volume ment, #climate, and #carbon to be dominating in Economy
and trends. As highlighted in Table 1, the sandstorm topic and Energy as #carbon is relevant to both topics (the carbon
seems to overtake all other topics. It is clear that this topic economy). #environment dominates also Ocean&Water and
constitute the most discussed environment related topic on Agriculture&Forestry, #climate dominates in Weather, #ac-
tonclimate dominates in Campaigns, #climatechange domi-
3
https://twitter.com/MOI QatarEn/status/- nates in Arctic, and #airpollution dominates in Air Quality.
583359974278967296, last accessed on Feb,2016 To further analyze the content, we focused on the relation-
172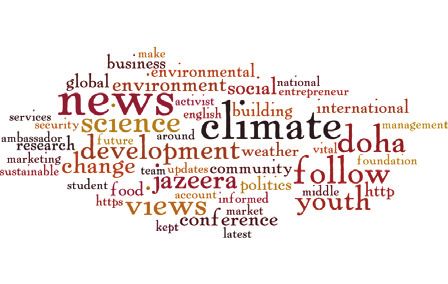
Figure 3: Daily distributions of the total number of tweets for different climate change related topics ordered by volume from
top left to bottom right. Notice that y-axises are not normalized across the figures.

ships between hashtags within topics and we built the co-             one around #drought containing hashtags such as: Califor-
occurrence networks of hashtags for the tweets of each topic.         nia, Haiti, Somelia, rain, and water. All these hashtags
Because the generated networks were dense, it was not pos-            are related in a way or another to drought. The absence
sible to perform any kind of visual observations on them.             of rain and water are the main causes of drought, and the
Thus, we apply the backbone extraction algorithm explained            mentioned countries and cities are the ones that are strug-
in the method section on all generated graphs. The algorithm          gling with ongoing drought. Negotiations&Summits net-
removes all noisy edges from the input graph and retains              work is also very informative. The modularity detection
only relevant once. Figure 6 plots the backbone networks              algorithm used was able to partition the network into four
of each topic. We use Gephi4 tool to draw the graphs. Col-            main communities: #cop17, #cop18, #cop19, and #cop21,
ors in the graphs correspond to the different communities of          with a high polarization around #cop18 (Doha) and #cop21
hashtags identified by Gephi’s internal modularity detection           (Paris) which are both associated with some distinctive hash-
algorithms. The first graph (Global) is generated using all            tags. Interestingly one can easily see that COP17 (Dur-
the climate change related hashtags. We clearly see the ex-           ban, South Africa), COP19 (Warsaw, Poland) and COP20
istence of four big communities of hashtags around: #envi-            (Lima, Peru) did not attract as much attention as COP18
ronment, #climatechange, #qatar. Interestingly, we see that           (Doha, Qatar) and COP21 (Paris, France) if not at all. While
the #climatechange community includes two heavy nodes:                COP18 is heavily covered for obvious reasons, we believe
#cop18 and #cop21. While #cop18 is heavily connected to               that the Paris’ COP21 local attention is mainly due to the
the community around #qatar just as the other hashtag #doha           fact that Paris was already catching the worldwide attention
(the capital), #cop21 (which happened this year in Paris)             for the sad Paris attacks event that happened two weeks be-
does not seem to be connected to Qatar. As the other COP              fore the start of COP21 5 , thus benefiting from a large in-
editions didn’t attract media’s attentions comparing to the           ternational media coverage that was already in place. It is
above-mentioned ones, our study dataset reflects the same              also interesting to see that both conferences are associated
pattern.                                                              with distinctive sets of hashtags. For instance, COP18 is as-
   The backbone network corresponding to general topic is             sociated with hashtags such as #climatelegacy, #kyoto, #no-
nicely clustered too. In fact, it has a giant component of            justicenodeal, #ethiopia, and #philippines whereas COP21
hashtags around #climatechange and a small yet accurate
                                                                          5
                                                                            November 2015 Paris attacks, last accessed on Feb, 2016:
   4
       http://gephi.org, last accessed on Feb, 2016                   https://en.wikipedia.org/wiki/November 2015 Paris attacks

                                                                173
(a) Top 1% most prolific (b) Top 5% most prolific
users. users.
Figure 4: Word clouds of hashtags corresponding to differ-
ent environment-related topics. The first word cloud to the
left is generated from all environment-related tweets.
(c) All users. (d) Complementary cumula-
tive distribution function.
is associated with hashtags such as #climatejustice, #car-
bon, # renewables, #climatefinance, #energy, #morocco, and Figure 5: Results for users analysis. (a) through (c) rep-
#china. Interestingly, the hashtag #Aljazeera which refers to resent word clouds of terms found in user biographies re-
the name of the famous Qatar-based media network appears trieved from Twitter. We see that the more a user tweets
on the COP21 side. Politics&Opinion backbone network about climate change, the more likely she is to have climate
presents an interesting topology with a strong emphasize on change related terms in her profile. (d) shows the skewed
#environment which is linked to three smaller communities: distribution of number of climate change related posts per
#qatar, #climate, and #waste (represented in blue). The re- users, with more than half users posting only once.
maining graphs are self-explanatory. However, it is worth
notice that the relatively small networks of Oceans&Water
and Risk&Disaster have only one community. Arctic and aljazeera (which is one of the biggest news groups in the
Air Quality networks are not represented here because the world). When all the users are taken together, all signals re-
former returned an empty backbone graph whereas the latter ferring to climate change fade out. In fact, at scale, we found
had only two nodes, namely: #airpollution and #health. that more than half of user users (51.08%) have tweeted only
once about climate change in a course of 5 years (2011 -
Environment-aware users 2015). These users tend to mention broader topics in their
After our content-centered analysis, we work on analyzing biographies such as: love, life, world, etc. Notice that the
users. We use Users endpoint of Twitter API to request the word Qatar has been removed from all three word clouds
profiles of 8K users who posted at least one tweet about en- as it dominated all of them. Figure 5(d) plots the comple-
vironment. Each user profile comes with basic information mentary cumulative distribution function for the probabil-
such as id, screen name, full name, bio and some statistics ity (y-axis, log scale) that a random user would post more
about the number of posts, followers, and friends. We an- than a given number of tweets (x-axis). The figure shows a
alyze the profiles of users, particularly their self-identified rapidly decreasing trends with most users posting only one
biographies. Notice that while not all users provide a biogra- tweet, and very few (p=0.005) who posted a hundred tweets
phy in their profiles, 83.05% of them do. Our objective is to or more.
get insights into the interests of users who tweet about envi-
ronment and climate change. Thus, we merged all users’ bi- Correlations
ographies into one file and perform some cleaning tasks such The correlation analysis performed on the 18 variables (11
as the removal of Arabic and English stop words. We show UN climate change topics, 2 Qatar specific topics, and 5
in Figure 5 the most frequent 50 terms found in the biogra- weather measurements) revealed the existence of a signif-
phies of top 1% (a), top 5% (b) most tweeting users, and that icant dependency between some of them. Figure 6 shows
of all users (c). Unsurprisingly, the more users who tweets the Pearson correlation score computed over the daily time
about climate change, the more likely they mention a climate series of all the pairs.
change related term in their biographies. In other words, this Looking solely at correlations between climate change
means that prolific users in our dataset (top 1%) are defi- topics, we find that Politics&Opinion and Negotia-
nitely environmental activists who identify themselves with tions&Summits achieve the highest correlation score of ρ =
words such as: climate, change, development, environment 0.73. This definitely makes sense as many political activities
and sustainable. The second tier of users (top 5%), present and “pourparlers” take place during the negotiations. The
a media and news oriented profiles. These users mention second and third highest correlation scores are achieved be-
in their biographies words such as: news, views, journalist, tween Politics&Opinion and Economy (ρ = 0.62) and Poli-
174arkansas arizona
inteq
forum poland glfcop19
lima
wtf
warsaw rain
almaty post2015
adp2015
peru
ajclimate brazil
ccs
indcs adp
virginia
washington
agchatoz california somaliland
1o5c auspol
climatefinance beijing
aljazeera
roadtoparis d12 smog
ohio
cfcc15 coal france
action2015
ar5 alabama oklahoma
climatejusticegocop21
british_columbiag7summit yearinspace climatemarch
colorado
earthtoparisindc
cop21paris
parisagreement cop19
iphone5 ion egypt
alaska
somalia global
sanantonio sif15 adp2 greenbuilding animals
stealthranger co2 energyefficiencybiogas cop15
changeclimatechange
lpaa cop20
oceans
worldenvironmentday
wastemanagement
birds
unep social
alamo
forestssb42
peace
environmental europe
electronics famine
thinklandscape
paris2015
fracking africa drought
canada
50by30 finance fact
social iran gogreen marine
air
freefood
globalwarming
nova_scoti nhpolitics glfcop21 cop21 adaptation
china
jo
recycling
cleantech
ecotip awareness
innovation
garbage fact
gotv
climateaction ipcc summit fossilfuel
emissions investor uk haiti water
bigblockofcheeseday inyteft
foodsecurity
worldbank
thepearlqatar
human
specialist wastes
opportunities ecology socialmedia climate
fitn climate2014 cdnpoli mitigation wales omantransport
tennessee
pakistan sdgs jordan
mena science
investing
pollution
cities recycle
doha iran
actonclimate paris
antarcticresilience india unfao economy
renewables
carbon
waste trees
development
wed2015 asmf
change cop18 qatar
environment weather
publichealth
renewableenergy
ecosystems democrats
agriculture
oil
csr eco
conservation
biomasshealthy
do
green environment
14feb durban
wbgyouthsummit
solarenergy
warming renewable plastic
wildlifesustainabledevelopment georgia health
wef world
renewableenergy unfccc cop21
climatechange
indonesia power lifestyle
globalwarmingsolar
estedama
climate sustainability
doha
cop17 unfccc bags
kp follow syria nowreading
global
energy sustainable day organic mena
road2doha
education
food
research
qatarfoundation
job morocco inyteft thinklandscape
bangladesh us earthday earth
estedama protect
palestine wbgyouthsummit
climate
montana planet ag myqatar love nature save animal
saopaulo
poverty
levant arab dohaoasis business delaware
emissions us deforestation
hunger
water ministry_of_environment
biodiversity
clean
fossilfuel ifnotusthenwho paris
nebraska
australia
sotu arctic
wcsj2011
obama climat
change
un green
youth middleeast
sustainability
building
community
future hunger jordan pollution
islamic
instagramqatar
tree
qu estedamaqatar connecticut food glfcop21
famine ifnotusthenwho
icymi fog do instagram life florida icymiun
redd
obalwarming
health islam quran
cop18
brazil ngo action
qatar
gcc sea
agt
haiti drought bahrain
conference
winter earthhour pennsylvania
energy earthhour youth pakistan
georgia
philippines climatelegacy
qf
entrepreneurs
sport yourpower cop19 wcsj2011 paris2015
climatechange
agchatoz oregon
california
qgbc
tarsheed
charity
usa
philippines
place roadtoparis
qatar
uae
somaliland papersmart roadtodoha
cmp8 undp
kuwait
featured
cop20 ipcc planetlevant
doha
instaqatar
colorado bolivia latviacop18
dmkr cop18 rain
qfrecruitment
moi_qatar
qatarsandstorm
weather car
corniche
peopleworking news
best foodsecurity cop2
somalia lossanddamage
eu airpollution safety
qncc jobs duststorm desert
recognized
kahramaa new_jersey cities renewable
sand alsadd ksa women hotnews obama agriculture oil
partofthesolution
education partofthesolution
ronment
cop18volunteers
climatechange
florida lca qnfspqatar morning summer interstellar low events
winddohasandstorm saudi new_mexico
advancedglobaltrading dtff12
cop18photo seemydoha
duststorm aspire eid
dubai
sandstorms
qeeri
economy cop21paris ecosystems
qscience
countmein kccwg westbay
qatarliving hot
sandstorm
work street expo2015 beauty world
comedyhour
kyoto
qnfsp sky dusty abudhabi
alkhor friday smokefree cdnpoli islamic indonesia
south_carolina
doha2012
dohagreenup ayicc beautiful hmc
renewables india sotu
nojusticenodeal
help coy8 live
crazy
zchizzerz arctic csr australia
rhode_island qfradio afternoon
desertlivingtraffic
windy sandy
poverty ag
arab earth
redd weekend drive
youngo
dohadisaster bad
aycm instapic
gulf
riyadh indiana
actonclimate france
ohio
oklahoma
united
climatechangeconference me
instadoha
heat
fb
hell
photo
city
zerovisibility
illinois
givesyouwings
nowreading
followantarctic nhpolitics
wef green
africa sdgs
healthy_tips
dohaexhibitioncenter hawaii samsung
drivesafely
dohanews
carbon
action2015
middleeast resilience cities
ngo democrats
dust_storm
view iphone
ipad
cop17 china
climateaction
idaho gameinsight
ipadgames bahrain estedama
(a) Global (b) General (c) Risk&Disaster
nhpolitics
fsdl
cleanenergy 50by30 ajclimate
foodsecurity
finance ajclimate
warsaw
glfcop19 comedyhour
dohaexhibitionce earthday glfcop21
cdnpoliglobalobama
inteq united qf latviacop18 actonclimate cop19partofthesolution
climatechang
post2015
poland cmp8 ayicc climatechangeco inyteft
warming finance unfao
india
wind
roadtodoha qnfspqatar live thinklandscape worldbank colorado
fitn sb42 agriculture coy8 california
coy8 dmkr summit qnfspqatar
peru dohagreenup redd nojusticenodeal paris2015
ar5 agreement us
qscience
gcc adp2 socialmedia
lima climatelegacy kccwg weather
cop19 women youth youngo
parisagreement
cop21 oil climatelegacy
asmf
adp kuwait paris
lossanddamage qnfsp indc ipcc world
cop20
sustainability
change
kyoto ethiopia
water
cop18 politics climate
cop18
food
science
recycling
investing
eco
ecotip
bigblockofch
work talkdirtyqa cleantech
unfccc conference lca dtff12 globalwarming water uk wales development
partofthesolution china waste
qatar qncc lifestyle
actonclimate
climateaction arab eu florida climatechangecarbonsolar
beautiful building energyefficiency
road2doha emissions middleeast investor
sb42 climate doha
dohadisaster doha2012 green do georgia
change
peace innovation
parisagreement un aycm cop ngo
action unfccc
dohaenergy green life africa oceans
obama environment cop18photo countmein un csr oman
india adp2 climat action cdm sustainability day
arab
sdgs renewables youth tree recycle
paris climatechange
bags
environment
help qscience renewables sustainable
gccmyqatar jordan
cdnpoli d12 action2015 solar cop18volunteers qatarfoundation qf instagram conference mena
cop21paris morocco papersmart earth economy plastic
protectlove
research awareness greenbuilding
cop21
illinois
inyteft
climatejustice
carbon
forests
france
lpaa
ipcc
ngo
philippines
0by30 demdeb indiana
qeeri
qatar
instagramqatar
future opportunities
estedamaqatar
qatarfoundation health
morocco
healthy
specialist thepearlqatar wastemanagement
trees
animalscities
electronics
pollution
klandscape 1o5c earth conservation
50by30 china climate2014 ministry_of_environment do save sustainabledevelopment
gogreen garbage
nhpolitics freefood events dcef2013 community nature wed2015
globalwarming cop15 wildlife worldenvironmentday
renewable business biodiversity dubai education job environmental
glfcop21 cities cop17 entrepreneurs egypt
climatefinance
cop21
earthhour
estedama islam
paris2015 coal indcs aljazeera sport jobs
qfrecruitment
climatemarch sif15
auspol
gocop21
energy
ar5
kp gotv qgbc
earthday
uae
peopleplace tarsheed
hotnews
featured
adp2015 actonclimate
world indc durban climate best
fog
recognized
mangroves news
(d) Summits&Negotiations (e) campaigns (f) Politics&Opinion
inyteft thinklandscape
cop21
renewable food finance
dohanews solar
cop19
zerovisibility zchizzerz wbgyouthsummit unfccc
drive
drivesafely abudhabi ipad cop21 change
iphone
riyadh
middleeast uae samsung ksa
dubai
green
climatechange
middleeast
climate cop18
givesyouwings saudi news investor
qf doha
sandstorm alkhor friday investing
arab
energy
renewables
doha
change paris2015
susdev
dubai
gcc waste uae
seemydoha rain india agt
weekend dohasandstorm uk
duststorm interstellar moi_qat
water solar climate cities qatar
sustainability
qf
ummer
windy dusty wind
desert
qatar health
biomass environment
wales
research qatar cdnpoli
edglobaltrading
climatechange
pollution
energy
green featured
sandy sand
view storm sandstorms oil business news
dust fracking
weather aspire
environment
dcef2013 investor
street
doha
qatarliving
alsadd
car
qatarsandstorm
conservation
sustainability
europe emissions
carbon
cop18
uk
waste
wales
hotnews
instadoha healthy_tips power investing biogas
carbon
hot bad water oil
morning nature
bahrain transport
hell dust_storm economy
health iphone5
gulf ion
westbay
mena
desertliving china
stealthranger
co2
(g) Sandstorm (h) Energy (i) Economy
csr
wildlife
oceans
ecology
eco islam sea
arab
doha nature
biodiversity
water
sustainability green
enewables
environment
save biomass
middleeast
nature
environment
middlee qatar
environment
climatech
change
conservation sustainability
green carbon
qatar cop21 doha
air
qatar energy energ weather
trees
tree doha climate
climatechange
climate solar
stainability water ummer
winter
qf
cop21 green arctic global
cop18 climate warming
(j) Agriculture&Forestry (k) Oceans&Water (l) Weather
Figure 6: Graphs representing hashtag co-occurrence backbones of different climate change topics (b) through (l). (a) is the
global backbone graph computed from the whole set of climate change related tweets.
tics&Opinion and Energy (ρ = 0.61). This is also expected correlation is observed between Negotiations&Summits and
as politics is tightly related to the two aforementioned topics. mean temperature (ρ = −0.1) which is simply explained
Overall, one could easily see that the topics General, Negoti- by the fact that the most important summits captured in our
ations&Summits, Politics&Opinion, Economy, and Energy collection (COP18, COP21) took place in winter time.
constitute a well correlated group. Expending our analysis to
include the weather variables, we find that Sandstorm topic Conclusions and Future Work
showed some significant positive dependencies with mean In our study, we start by monitoring, collecting, filtering, and
wind speed (ρ = 0.21) and a negative correlation with visi- analyzing a large dataset of 109 millions tweets posted by
bility (ρ = −0.14). Thus, the lower the visibility, the more 98K distinct users, in a course of 9 years in order to capture
likely a sandstorm is going on, which means more people are the public interest in climate change. We use a taxonomy of
tweeting about it. The other low yet statistically significant climate change to classify a significant amount of relevant
175Factors in Computing Systems, CHI ’15, 3197–3206. New
York, NY, USA: ACM.
Alhorr, Y.; Eliskandarani, E.; and Elsarrag, E. 2014. Ap-
proaches to reducing carbon dioxide emissions in the built
environment: Low carbon cities. International Journal of
Sustainable Built Environment 3(2):167 – 178.
An, X.; Ganguly, A. R.; Fang, Y.; Scyphers, S. B.; Hunter,
A. M.; and Dy, J. G. 2014. Tracking climate change opinions
from twitter data. In Workshop on Data Science for Social
Good.
Cody, E. M.; Reagan, A. J.; Mitchell, L.; Dodds, P. S.;
and Danforth, C. M. 2015. Climate change sentiment
on twitter: An unsolicited public opinion poll. PloS one
10(8):e0136092.
Hart, P. S., and Feldman, L. 2014. Threat without efficacy?
climate change on us network news. Science Communica-
tion 36(3):325–351.
Figure 7: Matrix of pairwise correlations between different Jang, S. M., and Hart, P. S. 2015. Polarized frames on
climate change and weather variables. The highest p-value climate change and global warming across countries and
score observed in this matrix is 4.64e − 07 which means that states: Evidence from twitter big data. Global Environmen-
all reported correlations are statistically significant. tal Change 32:11–17.
Kirilenko, A. P., and Stepchenkova, S. O. 2014. Public mi-
croblogging on climate change: One year of twitter world-
tweets into different topics covering a wide range of issues wide. Global Environmental Change 26:171 – 182.
such as politics, economy, and air quality. We perform dif- Kwak, H.; Lee, C.; Park, H.; and Moon, S. 2010. What is
ferent types of analysis to understand and reveal the timely twitter, a social network or a news media? In Proceedings of
distribution of public interest toward different topics. the 19th international conference on World wide web, 591–
In our examination of the relevant sub set of tweets, the 600. ACM.
results revealed that people’s interest is mainly driven by
Nielsen, R. C. 2016. RE:UN global pulse taxonomy. Mes-
widely covered events (e.g., Paris COP21), or local events
sage to author. 22 Feb, 2016. [Email].
that have a direct impact on users’ daily life (e.g., sand-
storms, Doha COP18). The number of users who engage Olteanu, A.; Castillo, C.; Diakopoulos, N.; and Aberer, K.
in climate change discourse does not seem to be on a in- 2015. Comparing events coverage in online news and so-
creasing trend. Our analysis revealed that the burst in users’ cial media: The case of climate change. In Proceedings of
activity observed during COP18 has quickly fade out after the Ninth International AAAI Conference on Web and Social
the conference, suggesting that organizing big events is not Media.
enough to raise any lasting public awareness toward climate QNB. 2015. Qatar National Bank, Qatar Economic Insight
change. The backbone graph analysis on the other side, has (p 12). http://www.qnb.com/cs/Satellite?blobcol=urldata
shown that hashtag co-occurrence is not random and leads &blobheader=application%2Fpdf&blobkey=id
in most of the cases to meaningful connected communities &blobtable=MungoBlobs&blobwhere=1355526969220
(clusters of hashtags). &ssbinary=true. [Online; accessed 15-Feb-2016].
The findings of this paper did not just highlight interesting Radcliffe, D. 2015. Social Media in
answers on public’s opinion about climate change in Qatar, the Middle East: The Story of 2014.
but also raise questions for future research to explore. First, https://damianradcliffe.files.wordpress.com/2015/01/-
we would like to alleviate the limitation of keyword based damianradcliffe-social-
filtering by designing a better classifier that accounts for se- media-in-the-middle-east-the-story-of-2014.pdf. [Online;
mantics of tweets. Second, we aspire to complement this accessed 15-Aug-2016].
work with a longitudinal analysis of causality between dif- Serrano, M. Á.; Boguná, M.; and Vespignani, A. 2009. Ex-
ferent climate change topics using transfer of entropy tech- tracting the multiscale backbone of complex weighted net-
nique. Finally, we would like to extend this study to other works. National academy of sciences 106(16):6483–6488.
countries in the region and examine the geographical influ-
ences on public’s opinion about climate change. Snoj, J. 2013. Qatar’s Population - by
Nationality. BQ Magazine. https://www.bq-
magazine.com/economy/2013/12/population-qatar. [On-
References line; accessed 15-Feb-2016].
Abbar, S.; Mejova, Y.; and Weber, I. 2015. You tweet what Underground, W. 2016. History API.
you eat: Studying food consumption through twitter. In Pro- http://www.wunderground.com/weather/api/. [Online;
ceedings of the 33rd Annual ACM Conference on Human accessed 15-Feb-2016].
176UNFCCC. 2012. United Nations Frame-
work Convention on Climate Change, 2012.
http://unfccc.int/2860.php#decisions. [Online; accessed
15-Feb-2016].
2014. United Nations Global Pulse Taxonomy for climate
change. unglobalpulse.net/climate/taxonomy/.
Veltri, G. A., and Atanasova, D. 2015. Climate
change on twitter: Content, media ecology and informa-
tion sharing behaviour. Public Understanding of Science
0963662515613702.
Wang, S.; Paul, M. J.; and Dredze, M. 2015. Social media as
a sensor of air quality and public response in china. Journal
of medical Internet research 17(3).
WB. 2015. CO2 emissions (metric tons per capita).
http://data.worldbank.org/indicator/EN.ATM.CO2E.PC?
order=wbapi data value 2011+wbapi data value+
wbapi data value-first&sort=desc. [Online; accessed 15-
Feb-2016].
Weber, E. U., and Stern, P. C. 2011. Public understanding of
climate change in the united states. American Psychologist
66(4):315.
Zanouda, T., and Abbar, S. 2016. Qatar Environment Tax-
onomy. http://scdev5.qcri.org/qenv/taxonomy/. [Online; ac-
cessed 15-Feb-2016].
177You can also read