User Experience in Mobile Augmented Reality: Emotions, Challenges, Opportunities and Best Practices - MDPI
←
→
Page content transcription
If your browser does not render page correctly, please read the page content below
computers
Article
User Experience in Mobile Augmented Reality:
Emotions, Challenges, Opportunities and
Best Practices
Amir Dirin 1 and Teemu H. Laine 2, *         ID

 1   Business Information Technology, Haaga-Helia University of Applied Sciences, 00520 Helsinki, Finland;
     amir.dirin@haaga-helia.fi
 2   Department of Computer Science, Electrical and Space Engineering, Luleå University of Technology,
     93187 Skellefteå, Sweden; teemu@ubilife.net
 *   Correspondence: teemu@ubilife.net; Tel.: +46-(0)910-585717

 Received: 20 April 2018; Accepted: 18 May 2018; Published: 21 May 2018

 Abstract: Mobile Augmented Reality (MAR) is gaining a strong momentum to become a major
 interactive technology that can be applied across domains and purposes. The rapid proliferation of
 MAR applications in global mobile application markets has been fueled by a range of freely-available
 MAR software development kits and content development tools, some of which enable the creation of
 MAR applications even without programming skills. Despite the recent advances of MAR technology
 and tools, there are still many challenges associated with MAR from the User Experience (UX) design
 perspective. In this study, we first define UX as the emotions that the user encounters while using a
 service, a product or an application and then explore the recent research on the topic. We present
 two case studies, a commercial MAR experience and our own Virtual Campus Tour MAR application,
 and evaluate them from the UX perspective, with a focus on emotions. Next, we synthesize the
 findings from previous research and the results of the case study evaluations to form sets of challenges,
 opportunities and best practices related to UX design of MAR applications. Based on the identified
 best practices, we finally present an updated version of the Virtual Campus Tour. The results can be
 used for improving UX design of future MAR applications, thus making them emotionally engaging.

 Keywords: mobile; augmented reality; user experience; design; emotions; case study; challenges;
 opportunities; guidelines

1. Introduction
     The rapid evolution of technology has brought new opportunities for developing new applications
and for interacting with them. Augmented Reality (AR) has become an alternative way to engage
users with applications more efficiently [1]. Kipper and Rampolla [2] define Augmented Reality (AR)
as a blending of real-world and digital information. This combination of the real world and the virtual
world has been harnessed for various purposes, such as marketing, education, entertainment and
health care. For example, AR has been used for educational and training purposes across subject
areas both in formal and informal settings [3–8], and it has been shown to possess a multitude of
affordances for learning and training scenarios [7–11]. Despite these success stories, AR (and mobile
AR in particular) has not yet fulfilled a previously made prediction of becoming the eighth mass
media [12]. There is a significant body of research on AR capabilities in different sectors [13], and the
challenges and limitations of AR have been discussed [7,14].
     Aligned with the popularity of smart phones and tablets, Mobile Augmented Reality (MAR) has
emerged as a mainstream technology and is currently a hot topic among researchers across fields.
As in our earlier work [3], MAR is defined here as “a type of AR where a mobile device (smartphone or

Computers 2018, 7, 33; doi:10.3390/computers7020033                         www.mdpi.com/journal/computers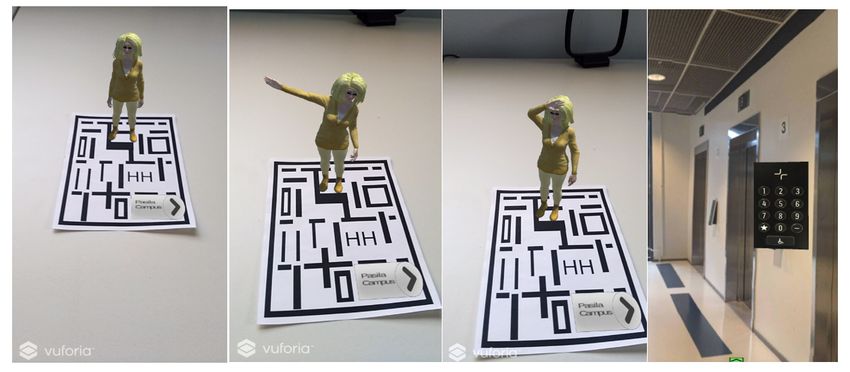
Computers 2018, 7, 33                                                                                2 of 18

tablet) is used to display and interact with virtual content that are overlaid on top of a real-time camera
feed of the real world”. Virtual content in MAR applications can be context-sensitive and take various
forms including, but not limited to three-dimensional (3D) models, animations, annotations and
videos. Recently, popular mobile applications with AR features, such as Pokémon Go and Snapchat,
have changed the developers’ and users’ perceptions of AR. These applications brought MAR to
people’s smartphones in earnest, especially targeting kids and youth. Moreover, the increase in the
number of toolkits for creating MAR applications has enabled even non-technical individuals to
create their own MAR content [3], thus further strengthening the position of MAR as a mainstream
interaction technology.
     Although Pokémon Go has been associated with many benefits, such as making people exercise
more [15] and helping those who have withdrawn from social life [16], little attention has been put on
investigation of User Experience (UX) factors that contribute to positive reception of MAR applications.
Following our earlier work [17], UX is defined here as the emotions that the user encounters while
using a service, a product or an application. An example of this is the negative emotions experienced
by some Pokémon Go players when the AR feature of the game drains the smartphone battery and
makes their smartphones slow [18,19].
     Although UX of MAR applications have received some attention from researchers (e.g., [20,21]),
there is a need for a study that focuses on MAR UX from the perspective of emotions. To address
this need, the main objectives of this study are to assess the UX of two MAR applications and to
draw conclusions as to what challenges, opportunities and best practices are associated with MAR
application development from the UX perspective.
     The rest of the paper is organized as follows. We start with an overview of previous research on
mobile user experience and its relation to mobile augmented reality. Then, after presenting the research
design, we describe two MAR applications—a commercial AR experience and our own Virtual Campus
Tour application—that are used as case studies in this paper. In the Results Section, we present the
results of mixed-method evaluations of the two case studies and then describe challenges, opportunities
and best practices associated with mobile augmented reality user experience. The identified best
practices are then utilized to improve the second case study. Before concluding the study, we provide
discussion on the findings.

2. Background

2.1. Defining Mobile User Experience
      Despite a more than a decade’s worth of research on UX, the concept still suffers from vague and
broad definitions, which is reflected in the 27 definitions of UX reported as the result of the Dagstuhl
Seminar of Demarcating User Experience [22]. UX is a multidimensional phenomenon [23] in which
many factors influence success, and it has been around for many years [17]. Carlos et al. [24] identify
users, context, interaction and artifacts as the key elements of UX. Moreover, Hassenzahl [25] refers
to UX as the “quality of interactive technology”, focusing on the human and not on the product.
Hassenzahl and Tractinsky [26] believe that with the advancement of technology, interactive products
and services become not only useful and usable, but also trendy and fashionable. In this study, UX is
defined as the emotions that the user encounters while using a service, a product or an application [17].
This definition is a consequence of the recent development of design thinking, which recognizes
emotional engagement as a key factor in enabling sustainable use of mobile applications.
      In mobile applications, UX requires special attention due to limitations of mobile devices
(e.g., screen size) and the context-awareness afforded by the embedded sensors. Various attempts have
been made to promote mobile UX through evaluation metrics and design approaches in recent years.
Yong [27] recommends UX evaluation methods for mobile devices and proposes that these methods
should measure the emotional responses of users on visceral, behavioral and reflective dimensions.
Väätäjä and Roto [28] recommend mobile questionnaires for mobile UX evaluation, but point out that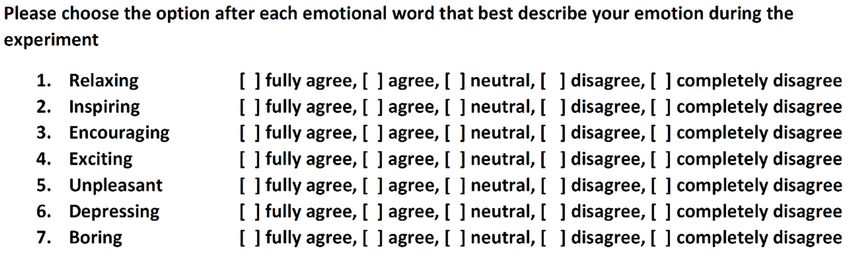
Computers 2018, 7, 33                                                                              3 of 18

in the design of the questionnaires, one must pay special attention to the clarity and simplicity of the
structure including questions, icons, items and scales. Pelet and Taieb [29] focus on mobile application
design to promote UX, with recommendations on how color contrast can be used to impact the positive
effects on behavioral intentions. Furthermore, Dirin and Nieminen [30] propose a usability and UX
framework for mobile learning applications. The framework has been proven to promote UX in a
mobile-based application by making the application adjustable, delightful and reliable, all of which
are factors contributing to the emotional dimension of UX.
      The existing mobile UX measurement and design approaches may also be to some extent applied
to MAR applications. However, MAR UX design is not the same as mobile UX design. Although
emotional engagement, personalization and reliability are important in all applications and services,
in MAR UX, users are engaged both mentally and physically in the application. The mental engagement
in this context means that users fully concentrate on the application, and short- and long-term memory
are engaged in the application. Physical engagement means that users often need both hands, eyes,
ears and even the rest of their bodies to be involved with the application.

2.2. Mobile Augmented Reality and User Experience
     Previous studies on MAR from the UX perspective are vague, and there is certainly room for
further research [31]. The main reasons for the lack of MAR UX research and design guidelines is
the recentness of MAR as a mainstream technology. Major advancements in the development of
MAR happened during the last decade [32]. The main breakthrough occurred with the emergence of
smartphones equipped with advanced technologies [33]. Yet, there are some researchers who have
investigated the area of MAR UX, as we briefly explain in the following.
     Irshad et al. [31] conducted a review on MAR UX research published in 2005–2014 and presented
a categorization of the MAR UX domain, including aspects such as UX as a phenomenon, UX
as a field of study and UX as a practice. Furthermore, they promoted User-Centered Design
(UCD) as a recommended method for MAR application development. When we reviewed previous
research on MAR UX, we discovered that MAR applications, where UX was specifically considered,
were developed and researched either through case study evaluations or through MAR application
development frameworks. In both cases, the user of the application is typically at the center of the
design and development, thus confirming the results of Irshad et al. For example, Rashidi et al. [34]
proposed a framework based on UCD for developing MAR tourism applications. In another example,
Olsson et al. [21] and Olsson and Väänänen-Vainio-Mattila [35] elaborated through a case study MAR
application and came to the conclusion that MAR applications’ acceptance by potential users requires
that designers learn about users and their essential needs in advance. This is not unlike most UCD
frameworks that involve end-users early in the design process.
     Furthermore, usability (i.e., effectiveness, efficiency, satisfaction), which is an important factor
in positive UX, has traditionally been associated with mobile application design and development.
Aligned with this, Ritsos et al. [20] advocated the importance of usability as a key factor for the
adoption of MAR applications by users, whereas Jung et al. [36] focused on the satisfaction attribute of
usability while conducting a study on a marker-based MAR application for tourists. The findings of
Jung et al. indicated that content, personalized service and system quality affect users’ satisfaction.
     To promote MAR usability and UX, some researchers have focused on framework development.
For example, Kim [37] proposed a framework for context immersion in MAR applications.
The framework is constructed of three contexts: time- and location-based context, object-based context
and user-based context. Understanding users’ needs in these contexts is a crucial part of UX design in
MAR applications. Aligned with this, Irshad and Awang Rambli [38] proposed a multi-layered MAR
framework for achieving positive UX. Their framework is divided into various dimensions of a MAR
application, such as product, time, specific context and UX.
     Our literature review revealed that MAR UX is attracting interest among researchers, with most
of the related publications having been published in recent years. Previous studies indicated that the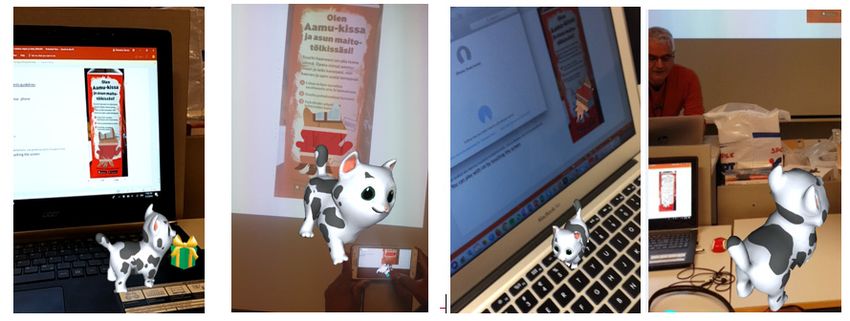
Computers 2018, 7, 33                                                                                    4 of 18

focus has been on UX and usability evaluation of MAR applications, but we still lack information
on how users perceive MAR applications emotionally and what are the best practices for MAR UX
designers. Important questions to answer include: “What kinds of emotions arise among users of
MAR applications?” and “What concerns do users have when they deal with MAR applications?”
The aim of this paper is to answer these questions through evaluations of two MAR case studies.

3. Research Design
    The following sections describe the research questions, participants and methods used in the
evaluation of the two case study applications, which are described in Section 4.

3.1. Research Questions
     It is evident that UX of a mobile application is different from that of a MAR application [39].
To investigate the role of UX in the development and evaluation of MAR applications, this study aims
to answer the following research questions through two case studies (see Section 4):
1.      How do users perceive two MAR case study applications emotionally?
2.      What are the major opportunities and challenges associated with MAR UX?
3.      What are the best practices for MAR UX?
     We chose to analyze the case studies by a mixed-method approach comprising qualitative
and quantitative methods. We explain these methods in the following sections after describing
the study participants.

3.2. Participants
      The case study evaluations were conducted at the Haaga-Helia University of Applied Sciences
in March 2018. Table 1 summarizes the demographics of the participants for both case studies.
The participants were recruited on a voluntary basis from a user experience design course at
Haaga-Helia. No rewards were given to the participants. All collected data were anonymized so
that the participants cannot be identified from the results presented in this study.

                                   Table 1. Participants of the two case studies.

     Case Study                      Participants                      N     Males   Females   Age (Average)
     Case Study 1              Haaga-Helia students                    22      13      9         18–31 (23)
     Case Study 2   Haaga-Helia students (4) and other students (2)    6        2      4         20–34 (25)

      The participants were experts in using information technology, thus no technology training was
provided to them before the experiments. Many participants used Android smartphones, and a few
owned iPhones. The experiments were conducted in English because the participants were from
different countries.
      It is noteworthy that although the sample sizes are relatively small, and we therefore cannot draw
statistically-significant conclusions, the quantitative and qualitative results together indicate useful
information on the UX of the two case studies. The number of recommended test users for usability
experiments varies between three and five. For example, Nielsen [40] states that with five test users, one
almost gets close to the maximum benefit-cost ratio in usability testing. Nielsen [40] further promotes
qualitative user research for collecting insights to drive the design, not the number of involved people.

3.3. Research Methods: Case Study 1

3.3.1. Data Collection
     In Case Study 1, we asked the participants to experiment with a commercial MAR application
featuring an interactive cat (described in Section 4.1) and then administered a questionnaire based
Computers 2018, 7, 33 5 of 18
on [41] about emotions that the participants felt during the experiment. The questionnaire consisted
of basic
Computers information,
2018, 7, x such as gender, age and previous experiences with MAR. Additionally, 5 of 18
the questionnaire had Likert-scale questions about the participant’s emotions during and after the
experiment.
experiment. Figure
Figure 1 presents
1 presents samples
samples of of
thethe Likert
Likert statements
statements used
used forfor collecting
collecting data
data onon thethe
participants’ emotions.
participants’ emotions.
Figure 1. Samples
Figure of Likert-scale
1. Samples statements
of Likert-scale in in
statements thethe
questionnaire of of
questionnaire Case Study
Case 1. 1.
Study
We also conducted short interviews with selected participants about their experiences with the
We also conducted short interviews with selected participants about their experiences with the
application. We randomly selected nine participants (n = 9, females: 5, males: 4) for interviews among
application. We randomly selected nine participants (n = 9, females: 5, males: 4) for interviews among
those who finished the experiment in 3–5 min (n = 4), in 6–10 min (n = 3) and in more than 10 min (n
those who finished the experiment in 3–5 min (n = 4), in 6–10 min (n = 3) and in more than 10 min
= 2). The interviews were recorded as audio and transcribed later. The following questions were
(n = 2). The interviews were recorded as audio and transcribed later. The following questions were
asked in the interview:
asked in the interview:
Question #1: What was your first impression when you saw the cat?
• Question #1: What was your first impression when you saw the cat?
Question #2: Did you find it difficult to test the application and bring the cat to the screen?
• Question #2: Did you find it difficult to test the application and bring the cat to the screen?
Question #3: Would you like to have this type of application in your daily life?
• Question
Question #4:#3:
HowWouldwould youyoulikechange
to havethisthisapplication?
type of application in your daily life?
• Question #4: How would you change this application?
The experiment was conducted in a classroom with the following procedure. The participants
were givenThe experiment
smartphones was(Samsung
conductedGalaxyin a classroom
S6) andwith weretheinstructed
following procedure.
to download Thethe
participants
Arilyn
were given smartphones (Samsung Galaxy S6) and were instructed to
application from Google Play. The participants were then asked to scan the cat picture on a milk download the Arilyn application
from Google
package (we hadPlay. The participants
two empty packages ofwere milk then
in theasked to scan
classroom) orthe cat picture
through on a milk
a cat picture, package
which, for
the(wesakehad two empty packages
of accessibility, was presented of milk in the
to the classroom)
participants or through
through a cat picture,
a PowerPoint slide. Thewhich, for the
duration
of sake of accessibility,
the experiment variedwas presented
between 3 and to 15
themin
participants
among the through a PowerPoint
participants. slide. The
The participants duration
were given of
the experiment
freedom to explore varied between 3 and
the functionality 15 min
of the MAR among the participants.
application; therefore, The participants
no specific were given
instructions or
freedom
tasks were to explore
given. The the functionality
researchers of thethe
observed MAR application;
participants duringtherefore, no specific
the experiment and instructions
took notes or
tasks wereAfter
accordingly. given. theThe researchers
participants observed
finished the the participants
experiment, theyduring the experiment
were asked and took notes
to fill in a questionnaire
accordingly.
that was delivered Afterasthe participants
a hardcopy. finished
After the experiment,
the experiment, they were
a researcher asked tointerviews
conducted fill in a questionnaire
with the
that was delivered
selected participants. as a hardcopy. After the experiment, a researcher conducted interviews with the
selected participants.
3.3.2. Data Analysis
3.3.2. Data Analysis
In Case Study 1, we applied statistical tools to the collected quantitative data to assess how the
In Case
participants feltStudy
about1,the
weMAR applied statisticalThe
application. tools to the collected
collected quantitative
questionnaire data on data to assess
emotions was how
basedthe
onparticipants
a Likert-scale; feltthus,
abouta the
simpleMAR application.analysis
proportional The collected questionnaireanswers
of the participants’ data on wasemotions was based
considered to
on a Likert-scale; thus, a simple proportional analysis of the participants’
be an appropriate approach to represent the users’ emotional states towards the tested MAR answers was considered to be
an appropriate
application. approach
To analyze thetoquestionnaire
represent the users’ emotional
data, we used the states towards
ToolPak the tested
add-in MAR application.
for Microsoft Excel,
To analyze the questionnaire data, we used the ToolPak add-in
which provides various data analysis tools for statistical and engineering analysis. for Microsoft Excel, which provides
various
After data analysis the
transcribing toolsinterview
for statistical
data,and theengineering
participants’analysis.
answers and researchers’ observations
After transcribing
were analyzed the interview
to learn more about the data, the participants’
participants’ answersand
perceptions andreactions
researchers’ observations
towards the MAR were
analyzed to learn more about the participants’ perceptions and reactions
application. The analysis was conducted by applying the method of coding [42] in a word processor towards the MAR application.
The analysis
whereby keywordswas conducted
were assigned by applying the methoddata
to the qualitative of coding [42] These
excerpts. in a word processor
keywords whereby
were, for
example, emotional words that the participants mentioned or the emotional expressions that were
extracted by observing. The frequencies of the keywords are not reported in this study due to the
relatively small sample size.
3.4. Research Methods: Case Study 2Computers 2018, 7, 33 6 of 18
keywords were assigned to the qualitative data excerpts. These keywords were, for example, emotional
words that the participants mentioned or the emotional expressions that were extracted by observing.
The frequencies of the keywords are not reported in this study due to the relatively small sample size.
3.4. Research Methods: Case Study 2
3.4.1. Data Collection
In Case Study 2, the participants used a Virtual Campus Tour application that was designed
and developed at the Haaga-Helia University of Applied Sciences (see more details in Section 4.2).
We conducted a usability and UX evaluation in a usability lab at the Haaga-Helia University of
Applied Sciences. The usability evaluation focused on the performance of a set of predefined tasks to
measure the efficiency of the application. The UX evaluation, which was based on observations and
post-experiment interviews of the participants, focused on how the participants felt about the MAR
application. The aim of this case study was to investigate the emotions that the participants felt about
the application and to find out whether the participants found the application easy and efficient to use
and whether it fulfilled their essential needs. Table 2 presents the details of the test plan.
Table 2. Case Study 2 test plan.
Plan category Details
Equipment: Mobile phone (Samsung Galaxy A8, Android), test instructions
Observations: Notes of the user’s actions and the time it takes for the user to complete the tasks.
Pre-test: Introduction and application orientation
Go to Riitta’s room on the 6th floor.
Tasks: Proceed to the library and be welcomed by the guide
Go to the 1st floor lobby entrance/ exit door
Test Method: Facilitator instructs the users of the tasks.
Data Collection: Video and audio recording, written notes, think-aloud, interviews
Comments about the hardware
Comments about the app. What would they change? Negative and positive aspects?
Interview questions: Comments about how users felt while accomplishing the tasks. Emotions?
Is it fun to use, interesting, anything surprising?
Other comments
Introduction: 5 min
Test Tasks: 4–15 min (Usability and UX)
Debriefing: 5–10 min
Reporting 120 min
15–30 min per user
Total:
1.5–3 h for 6 users
In the usability assessment, which was video-recorded, we applied the think-aloud method to learn
about the participants’ ways of performing the given tasks. In the think-aloud method, which is rooted
in psychology [43], the participants are advised to say what they think while performing a given task.
In our experiment, the objective of using the think-aloud method was to give us feedback on whether the
interface is logically designed and whether the participants find the components in expected places.
There were two people conducting the Case Study 2 experiment: the facilitator and the observer.
The facilitator briefly introduced the application prototype and the purpose of the test to the
participants and answered any questions that the participants had about the experiment. During the
experiment, the facilitator assisted the participants if they had problems, but without guiding them
to solve the tasks independently. Finally, the facilitator interviewed the participants. The observerComputers 2018, 7, 33 7 of 18
silently recorded the times of the tasks and observed the verbal language and facial expressions of the
participants. The observer also took notes on the participants’ actions, comments, procedural errors
Computers 2018, 7, x 7 of 18
and problems and assisted the facilitator in writing down the participants’ interview answers.
3.4.2.
3.4.2.Data
DataAnalysis
Analysis
To
To analyze the
analyze data collected
the data collected in
inCase
CaseStudy
Study2,2,we
weapplied
appliedusability
usability evaluation
evaluation metrics,
metrics, such
such as
as the
the
timetime
spentspent on performing
on performing the the predefined
predefined tasks
tasks andand the number
the number of tasks
of tasks performed
performed in a given
in a given time,
time, to measure the application’s efficiency. Furthermore, the qualitative dataset
to measure the application’s efficiency. Furthermore, the qualitative dataset comprised transcribed comprised
transcribed
think-aloudthink-aloud videos, and
videos, observations observations
interview and interview
recordings. As inrecordings.
Case StudyAs in Case
1, we Study
applied coding1, we
[42]
applied
in a wordcoding [42] into
processor a word processor
identify to identify
emotional emotional
reactions reactions
and usability andraised
issues usability
by issues raised by
the participants
the participants
during during the
the experiment. Theexperiment.
frequenciesThe frequencies
of the keywordsofare thenot
keywords
reportedare not study
in this reporteddueintothis
the
study due to the relatively
relatively small sample size. small sample size.
4.4.Case
CaseStudies
Studies
4.1.
4.1.Case
CaseStudy
Study1:1:Aamu
AamuCat
Cat
The
Thefirst
firstcase
casestudy
studyisis aa commercial
commercial advertisement
advertisementMAR MARapplication
applicationby byaaScandinavian
Scandinaviandairy dairy
corporation (Arla), which was in the market during a promotional period
corporation (Arla), which was in the market during a promotional period (in 2018) in Finland. (in 2018) in Finland. The
customers were were
The customers advised to download
advised to downloadthe application (Arilyn)
the application to their
(Arilyn) phones
to their and scan
phones and ascan
picture of a
a picture
cat
of aembedded
cat embedded in a milk
in a package, thereby
milk package, activating
thereby the AR
activating content.
the The AR
AR content. Thecontent features
AR content a cat,
features
called
a cat, Aamu (morning
called Aamu in Finnish),
(morning that jumps
in Finnish), to the to
that jumps phone screen screen
the phone out of out
the of
milk
thepackage, thus
milk package,
granting the user
thus granting theuser
the opportunity to play and
the opportunity interact
to play andwith the cat
interact with(e.g.,
thestroking).
cat (e.g.,Instroking).
this application,
In this
the Aamu catthe
application, first wanders
Aamu around,
cat first and around,
wanders by swipingandtheby screen,
swipingthe theuser can the
screen, trigger
userthe
cancat to perform
trigger the cat
different tricks,
to perform such as
different jumping.
tricks, such Figure 2 presents
as jumping. Figure screenshots
2 presentsof the Arilyn of
screenshots application
the Arilynwith Aamu.
application
Awith
detailed
Aamu. description of the application
A detailed description and theand
of the application integrated AR AR
the integrated solution areare
solution available
availableatat
https://www.arla.fi/aamukissa/.
https://www.arla.fi/aamukissa/.
Figure
Figure2.2.Sample
Samplescreens
screensofofthe
theArilyn
Arilynapplication
applicationwith
withthe
theAamu
Aamucat.
cat.
4.2.
4.2.Case
CaseStudy
Study2:2:Virtual
VirtualCampus
CampusTour
Tour
The
The second casestudy
second case study waswas designed
designed and and developed
developed by twoby two students
students at the Haaga-Helia
at the Haaga-Helia University
University
of Appliedof AppliedThe
Sciences. Sciences. The MAR
aim of this aim ofapplication
this MAR is application
to provideisa virtual
to providetouraofvirtual tourcampus
the Pasila of the
Pasila campus to those students who received admission to the Business
to those students who received admission to the Business Information Technology (BITE) degreeInformation Technology
(BITE)
program degree program
for the forsemester.
fall 2018 the fall 2018
Thesemester. The concept
concept design design and implementation
and implementation processes areprocesses
out of the
are out of the scope
scope of this paper. of this paper.
Figure
Figure 33 presents
presentsthe the screenshots
screenshots of Virtual
of the the Virtual
Campus Campus Tour application.
Tour application. In this MARIn application,
this MAR
application,
an avatar ofanthe avatar
BITEofstudy
the BITE study
advisor, advisor,
Riitta, Riitta,
orients new orients newtostudents
students the Pasilato the Pasila including
campus, campus,
including
information on facilities, lecture rooms, the library and key people. The application helpshelps
information on facilities, lecture rooms, the library and key people. The application new
new students
students to navigate
to navigate in the
in the first,
first, third
third andsixth
and sixthfloors
floorswhere
where the
the classrooms,
classrooms, library
libraryand
andteachers’
teachers’
and
andadvisors’
advisors’offices
officesare
arelocated.
located.The Theavatar
avatarhelps
helpsthe
thestudent
studentselect
selectthe
thecorrect
correctfloor
floorbased
basedon onthe
the
place where they want to visit. For the implementation, we used Unity 3D, 3D
place where they want to visit. For the implementation, we used Unity 3D, 3D videos and Vuforia AR. videos and Vuforia
AR. The Android-based application scans a marker, thus causing the avatar to appear. The student
starts to move with the smartphone to get to the door of the elevator where more virtual content is
shown. The avatar appears in the front of the elevator next to the buttons, and at the same time, a
virtual button panel is displayed. The student is then advised to pick the floor where they want to
visit.Computers 2018, 7, 33 8 of 18
The Android-based application scans a marker, thus causing the avatar to appear. The student starts
to move with the smartphone to get to the door of the elevator where more virtual content is shown.
The avatar appears in the front of the elevator next to the buttons, and at the same time, a virtual
button
Computerspanel isxdisplayed. The student is then advised to pick the floor where they want to visit.8 of 18
2018, 7,
Figure 3.
Figure 3. Screenshots
Screenshots of
of the
the Virtual
Virtual Campus
Campus Tour
Tour Mobile
Mobile AR
AR (MAR)
(MAR) application
application that
that introduces
introduces the
the
Pasila campus to new students.
Pasila campus to new students.
5. Results
5. Results
In the following, we present the results of two case study evaluations based on the methods
In the following, we present the results of two case study evaluations based on the methods
described in Section 3. Then, we collectively summarize the emotions that were identified from the
described in Section 3. Then, we collectively summarize the emotions that were identified from the
case studies.
case studies.
5.1. Case
5.1. Case Study
Study 1:
1: Aamu
Aamu Cat
Cat
5.1.1. Questionnaire Results
The demographics
demographics section
sectionofofthe thequestionnaire
questionnaire indicated
indicatedthatthat
15 15
out out
of 22
of participants
22 participants had
previous
had experience
previous with with
experience MAR,MAR, whereas sevenseven
whereas participants were were
participants inexperienced with with
inexperienced MAR,MAR, thus
suggesting
thus that MAR
suggesting as a technology
that MAR has reached
as a technology a relatively
has reached high degree
a relatively of awareness
high degree amongamong
of awareness young
adults.adults.
young
Figure 4 shows what types of emotions the participants felt towards the Aamu Cat MAR
application. The
The results
results indicate that positive emotions (relaxing, inspiring, encouraging, exciting)
were experienced by most of the the participants.
participants. Among all participants, a majority (59%) agreed that
the MAR application made them relaxed, whereas whereas 14%14% did
did not find the MAR application
application relaxing.
relaxing.
Similarly,a amajority
Similarly, majority experienced
experienced alsoalso
otherother
positivepositive
emotions,emotions,
as 73%, as87%73%, 87% ofand
and 73% the 73% of the
participants
participants
agreed agreed
that the MARthat the MARwas
application application
inspiring,was inspiring, and
encouraging encouraging and exciting,with
exciting, respectively, respectively,
very few
with veryresponses.
negative few negative responses.
Compared to positive emotions, negative emotions gained much much less
less agreements.
agreements. Among all
participants, 87%, 86% and 77% disagreed that the MAR application was unpleasant, depressing and
boring, respectively.
boring, respectively.OnlyOnly 9–14%
9–14% of participants
of the the participants felt neutral
felt neutral about theabout the emotion
negative negative emotion
statements.
statements.low
Although Although low in proportions,
in proportions, it is noteworthy
it is noteworthy that 5% and that
9%5% andparticipants
of the 9% of the participants feltMAR
felt that the that
the MAR experiment
experiment was unpleasant
was unpleasant and boring, and boring, respectively.
respectively.Computers 2018, 7, 33 9 of 18
Computers 2018, 7, x 9 of 18
Figure 4. The participants’ feedback on emotions after the Case Study 1 experiment.
Figure 4. The participants’ feedback on emotions after the Case Study 1 experiment.
5.1.2. Interview Results
5.1.2. Interview Results
In the following,
In the wewe
following, present
presentthetheresults
resultsrelated
related to the four
to the fourinterview
interviewquestions
questions that
that were
were asked
asked
from the the
from selected participants
selected (9).
participants (9).
Question #1: #1:
Question What was
What your
was yourfirst
firstimpression
impressionwhen
when you saw
saw the
thecat?
cat?
TheThe
participants considered
participants consideredtheir
theirMAR
MARexperiment withthe
experiment with themilk
milkpackage
package and
and thethe Aamu
Aamu CatCat
to to
be interesting
be interesting andand expected
expected toto seesimilar
see similarapplications
applications of MAR
MAR more
moreininpublic
publicplaces, forfor
places, example:
example:
“I really like its simple interactions. Cannot wait for it to kick off in everyday public places.”
“I really like its simple interactions. Cannot wait for it to kick off in everyday public places.”
(Outi, 18, Female)
(Outi, 18, Female)
Some participants identified the MAR application to be intuitive, thus giving more control to the
Some
user on participants
how to utilizeidentified the MAR
the interactions application
in the to for
application, be example:
intuitive, thus giving more control to the
user on how to utilize the interactions in the application, for example:
“The interaction was engaging and with fun, I almost knew how I should play with the
cat.”
“The (Outi, 18,was
interaction Female)
engaging and with fun, I almost knew how I should play with the cat.”
(Outi, 18, Female)
Several participants considered that the application engaged them emotionally, which, as per
our definition, is the essence of positive user experiences:
Several participants considered that the application engaged them emotionally, which, as per our
“It is
definition, wastheemotionally
essence ofinteresting andexperiences:
positive user delightful, and having a real connection with the object,
through getting it working took a while.” (Timo, 27, Male)
“It was emotionally interesting and delightful, and having a real connection with the object,
“Getting the cat out of the box for the first time was cool […] and its fun for a short time.”
through getting
(Anastasia, 28,itFemale)
working took a while.” (Timo, 27, Male)
“Getting thejumping
“The cat cat out out
of the boxbox
of the forwas
the surprising.”
first time was cool21,
(Joan, [ .Female)
. . ] and its fun for a short time.”
(Anastasia, 28, Female)
The participants’ emotional engagement in the application was also visible in the following
terms that frequently appeared in the participants’ comments as their first impressions: unexpected,
“The cat jumping out of the box was surprising.” (Joan, 21, Female)
surprised, liked it, fun, friendly and interactive. In addition to emotional engagement, some
participants considered
The participants’ that theyengagement
emotional became involved with
in the AR and thewas
application objects
alsowithin:
visible in the following
terms that
“ARfrequently appearedand
is more interactive, in the participants’
I feel comments
involved.” (Mia, as their first impressions: unexpected,
26, Female)
surprised, liked it, fun, friendly and interactive. In addition to emotional engagement, some
“AR is about feeling the objects.” (Timo, 27, Male)
participants considered that they became involved with AR and the objects within:
Question #2: Did you find it difficult to test the application and bring the cat to the screen?
“AR is more interactive, and I feel involved.” (Mia, 26, Female)
“AR is about feeling the objects.” (Timo, 27, Male)Computers 2018, 7, 33 10 of 18
Question #2: Did you find it difficult to test the application and bring the cat to the screen?
All students managed to perform the experiment successfully despite no detailed instructions given by
researchers. Therefore, all students answered “no” to this question. The main concerns that emerged during
the experiment were getting the application to work and that interacting with the cat was time consuming.
Question #3: Would you like to have this type of application in your daily life?
Some participants considered that MAR is suited well to advertisements, buying and selling.
The applicability of MAR as a learning technology, however, received more skepticism, for example:
“I’ve tried AR in a language learning application, but I dropped the language course [where
the AR learning application was used], so I cannot say whether it is helpful. I prefer the
normal two-dimensional (2D) view when it comes to language learning. MAR drains battery
way faster.” (Janne, 24, Male)
The following comment from a participant shows that the perceived benefit for the invested time
may depend on the user’s age:
“Maybe kids want to play with cats for minutes if not hours, I do not like to spend time with
a virtual pet in my phone.” (Alexey, 21, Male)
Question #4: How would you change this application?
The changes that almost all participants recommended were having more functionalities in the
application, such as: communication with the cat, performing more tricks with the cat and selecting
different avatars (e.g., a dog). Furthermore, some participants suggested that the cat’s avatar should
be more versatile and realistic and that users should have a choice of personalizing the avatar, as
indicated in these comments:
“Choose the figure.” (Sara, 21, Female)
“Different animal, more colorful surroundings.” (Mia, 26, Female)
“More entertainment actions.” (Outi, 18, Female)
“I guess some alert that it would popup is good to have.” (Timo, 27, Male)
“Feel like this is a beta version, I want to have a more realistic figure. Seems that the cat
moves very slow.” (Ivan, 21, Male)
Furthermore, we discovered that the cat avatar promoted positive UX and may even compensate
some factors that contributed to negative UX:
“My first AR experience wasn’t surprising because the app lagged a bit but the cat on class
today was really nice.” (Sara, 21, Female)
5.2. Case Study 2: Virtual Campus Tour
In the usability evaluation, we measured the efficiency of the Virtual Campus Tour application
usage, i.e., how well and fast the participants find the locations defined in the tasks with the Virtual
Campus Tour application. The loading time of the application was around 0.5–3 s from launching
until the participant could start interacting with it. It took on average around 10 min (minimum:
5 min, maximum: 15 min) for the participants to complete the predefined tasks. The participants were
generally satisfied with the application’s user interface and the way of interacting with the application.
When prompted in the interviews what the participants would like to change in the application,
all of them said that the application should have more instructions of where they should go, the namesComputers 2018, 7, 33 11 of 18
and locations of places/areas and special places, such as laboratory and computer rooms. Moreover,
some participants suggested that the application should also have a map or a list of places in the
beginning, so users would know what they can learn from the navigation and where they are in
relation to the whole school map. Finally, the navigation could be more playful and interesting by
applying a game concept, such as missions to find different areas in the school, and including more
interactable objects, as well as background music, to make the tour more relaxing and exciting.
The participants’ main objections concerned the application’s graphics and insufficient control
over the application’s performance. For example, the augmented elevator panel did not work properly,
as the participants needed to touch a specific area on the floor number to activate it. Although
non-active keys were dimmed, some participants still attempted to click them. Moreover, it was not
possible to cancel a selected key.
In the UX part, we assessed how the participants felt during and after the experiment. In general,
the participants found the application concept to be appealing, especially due to the simple and
straightforward interaction and intuitive and obvious movement. The emotions experienced by the
participants are listed in Section 5.3.
5.3. Positive Emotions Experienced in the Case Studies
Table 3 summarizes the positive emotions that the participants experienced in our case studies.
These emotions were extracted from the data collected by observations, questionnaire (Case Study 1),
interviews and the think-aloud method (Case Study 2). It is noteworthy that the diversity of emotions
that MAR applications can evoke in users is far beyond those that emerged in this study.
Table 3. Positive emotions that the participants experienced in the case studies.
Emotional Impact Case Studies
The cat made the participants feel relaxed while they interacted with the application.
Relaxing Aligned with this, Riitta’s avatar in Case Study 2 provided a friendly and relaxing
environment to the participants.
The cat avatar and the augmented objects inspired the participants to explore more the
Inspiring functionalities of the application. This is one reason why it is recommended to use avatars
to engage users emotionally.
The participants were encouraged to try and explore further interaction with the cat or
wait to see what the cat avatar does next. Similarly, in the second case study, the avatar
Encouraging
helped the participants feel that somebody was there to help, thus encouraging them to
explore further and not being afraid of making mistakes or being lost.
The participants found the MAR applications exciting. The excitement in the first case
Exciting study was on the user expectation as to what the cat avatar might do next. The excitement
in the second case study was based on the avatar’s behavior and interaction with users.
The evaluation results demonstrate that a well-designed interactive avatar and virtual
Delightful
objects made the participants delighted.
In the first case study, almost all participants (except one) pointed out the fact that they
Fun
had fun working with the application because of the cat.
Surprising The participants were surprised by MAR and the virtual objects (e.g., Aamu cat).
6. Challenges, Opportunities and Best Practices for MAR UX
The following sections present the challenges, the opportunities and the best practices for MAR
UX that emerged from our collective analysis and interpretation of literature and case study findings,
as well as from our experiences in developing the Virtual Campus Tour application. Then, we apply
some of the identified best practices to create an updated version of the Virtual Campus Tour.Computers 2018, 7, 33 12 of 18
6.1. Challenges of MAR UX
There are many challenges associated with UX design that are specific to MAR applications.
Table 4 summarizes some of the challenges that we learned in this study.
Table 4. Challenges associated with user experience of MAR applications.
Challenges Description
Often, almost the whole body needs to be involved while interacting with a MAR application. Users
Physical need to interact and communicate with the application by clicking, tapping, moving, gesturing or
giving voice commands. In non-MAR applications, tapping or gestures are typically used.
New MAR applications often require that the user installs them first and possibly require special
glasses. For example, in the first case study, the participants had to install Arilyn before they were
able to scan the cat. Installing new and possibly unknown applications requires extra effort and
Mental trust from users. The user should be convinced of the necessity of installing the application.
Another mental challenge is the cognitive load caused by the bridging of the virtual and the real
world via rich multimedia content. Moreover, the new way of thinking about content and
interacting with it can also be mentally exhausting.
Technologies for supporting MAR application design are still in an early phase despite recent
Prototyping developments. For example, we still lack rapid prototyping tools to design low- and
high-fidelity prototypes.
There still are many technical challenges associated with MAR UX that may affect the emotions
experienced by the user, including, but not limited to battery drain, required processing power
Technical
(i.e., how to make it available on low-end devices), screen size and the type of tracking
(e.g., marker-based, markerless).
Designers have already managed to construct user interface and interaction metaphors for non-AR
mobile applications. All mobile application design metaphors are not necessarily applicable to MAR
User interface
applications; hence, new interface and interaction metaphors specific for MAR applications
are needed.
To develop a robust MAR application, application developers must utilize multiple integrated
Development development environments. For example, in the second case study, we worked with Unity 3D,
Vuforia AR and Visual Studio.
The mindset change from mobile application to MAR concept design is associated with some
challenges. Designers are required to adjust their design approaches, which are based on 2D
sketching of non-AR objects using a pen and paper or mock-up tools, towards sketching of 3D
UX design
scenes and objects that are viewed through a 2D perspective (i.e., the camera). Connected to this, as
mentioned above, MAR UX designers lack robust prototyping tools to create prototypes for MAR
objects and interaction.
The experiment demonstrated that the participants get frustrated if MAR objects take too much of
Timing their time, especially when the application’s purpose is to entertain the user. The optimal
presentation time needs to be carefully assigned depending on the context and the target user group.
6.2. Opportunities of MAR UX
Despite many challenges, there are significant opportunities that MAR applications bring to UX
design. Some of these opportunities, as identified through the case studies, are listed in Table 5.
Table 5. Opportunities associated with user experience of MAR applications.
Opportunity Description
MAR creates a unique opportunity for practitioners to promote products and services.
Applying MAR in product advertisements helps users perceive the product better.
Furthermore, it helps users become attached to and involved more closely with the
Marketing
product. For example, the cat avatar aims to establish emotional engagement towards the
Potential
milk brand. Traditionally, this type of emotional engagement with tangible products has
been feasible to achieve through video advertisements. MAR can enable this emotional
engagement through richer, two-directional interaction (e.g., eyes, ears, hands).Computers 2018, 7, 33 13 of 18
Table 5. Cont.
Opportunity Description
Emotional engagement, as mentioned above, is a key deliverable that MAR can bring to
Emotional the user. Emotional engagement was also evident in our evaluation results. For example,
Engagement some participants in the first case study were observed to be holding an empty milk
package with smiles on their faces.
MAR provides unique opportunities to create novel user interfaces. Voice commands and
User Interface touching MAR objects (e.g., virtual buttons) are examples of novel UI components that can
be associated with MAR applications.
AR enables unique interaction experiences for mobile applications that previously were
Interaction not feasible, such as voice commands, natural communication with an avatar and rich
visualization of UI instead of having text-only labels and 2D graphics to guide the user.
MAR enables designers to create context-sensitive illusions that ease the cognitive process
Experience
for complex tasks, such as when an interior designer is fitting furniture in a room or when
Development
an architect is illustrating architectural models on top of a real-world view of a vacant plot.
6.3. Best Practices for MAR UX Design
As MAR applications seek to create a bridge between the real world and a virtual world, UX
designers need to pay attention to the special requirements that arise from the interplay between the
two worlds. To alleviate this challenge, we have devised a set of best UX design practices for MAR
applications based on the analysis of the case studies. These practices are listed in Table 6, together
with descriptions and examples. By following these practices, UX designers can increase the likelihood
of users becoming emotionally attached to the target MAR application. It is noteworthy that this list is
intended to complement, not replace, existing mobile UX design guidelines.
Table 6. Best MAR UX design practices.
Best Practice Description Examples
MAR object dimensions and location should In Case Study 2, the MAR panel dimensions
Spatial
match the intended target used on top of the and locations were inaccurate, thus causing
correspondence
real world. inconvenience to the participants.
MAR objects should be tolerant to camera In Case Study 1, the cat avatar was sensitive
Tolerance to movement. For example, if the marker goes to movement, as it disappeared from the
movement out of the camera view, the MAR object screen when the participants slightly
should remain visible for a period of time. moved their smartphones.
The avatar in Case Study 2 was a 2D
The details of MAR objects should be cartoon object. The cat avatar in Case Study
sufficiently high (within the limits of the 1 occupied the screen properly, which
Object detail
target hardware) to make them recognizable makes the impression to the participants
and appealing. that the cat is the only interactive object in
the screen.
Establishing a correspondence between a
The avatar in Case Study 2 had very little
Object MAR object and a real-world object creates a
resemblance to Riitta, the academic advisor
correspondence metaphorical link that increases familiarity
at Haaga-Helia.
and might also lower the learning curve.
The interaction in the first and second case
Allow users to interact with MAR content by
Natural studies was based on a touch-based user
multiple natural methods (e.g., speech,
interaction interface, which is a typical approach in
touch, gestures), thus promoting realism.
MAR applications [3].Computers 2018, 7, 33 14 of 18
Table 6. Cont.
Best Practice Description Examples
Both case studies provided a
Making the MAR experience personal to
one-size-fits-all experience to all users.
each user increases the likelihood for
The participants were not able to change
emotional engagement. This can be done, for
Personalized preferences or otherwise customize the
example, by allowing the user to customize
experience content. In Case Study 1, some participants
the application or automatically adapting
suggested to add a personalization feature,
the application based on the user’s context
such as choosing a dog avatar instead of a
and preferences.
cat avatar.
It is recommended to include an avatar in
The cat in the first case study was found to
MAR applications to make interaction with
Computers 2018, 7, x be appealing and was able to evoke 14 of 18
the application more natural. Moreover, the
Emotion-evoking emotions among the participants. In Case
avatar should have emotion-evoking
avatar Study 2, the Riitta avatar did not achieve
properties,
properties, such
suchasaspleasing
pleasingappearance
appearance and
and this, possibly due to the avatar design and
this, possibly due to the avatar design and
body
body languagethat
language thatsignal
signalhow
howthe
theavatar lack of interaction.
interaction.
lack of
avatar feels.
feels.
6.4. Applying Best Practices to Virtual Campus Tour
Tour
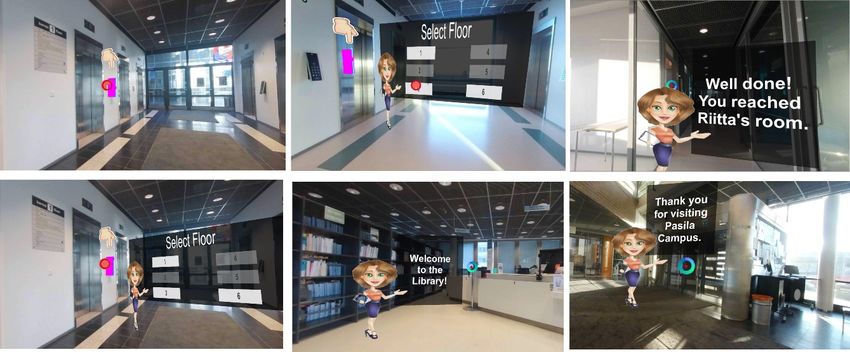
Figure 55presents
presentsananupdated
updatedversion
version of the Case
of the Study
Case 2 application
Study (Virtual
2 application Campus
(Virtual Tour) based
Campus Tour)
on some
based on of the of
some best
thepractices presented
best practices above.
presented First,First,
above. we designed a new
we designed avatar
a new for Riitta,
avatar whom
for Riitta, the
whom
freshmen meet when they arrive at the university for the first time. We designed the
the freshmen meet when they arrive at the university for the first time. We designed the avatar to beavatar to be as
realistic as as
as realistic possible,
possible, thus providing
thus providinga atrue
truereality-virtuality
reality-virtualityobject
objectcorrespondence
correspondenceandand object
object detail
to new students. It It is
is not
not merely a design transformation
transformation from a 2D to 3D object; the MAR object
actually represents
represents a real-world
real-world entity,
entity,in
in this
this case
case aa person.
person. Hence, we used an existing and expected
metaphor for MAR content representation.
representation.
Updated Virtual
Figure 5. Updated
Figure Virtual Campus Tour.
Tour.
Furthermore, to
Furthermore, to make
make MAR
MAR objects
objects more
more realistic,
realistic, all
all of
of them
them were
were resized
resized to match their
to match their real
real
sizes. To further improve spatial correspondence, we ensured that the locations of
sizes. To further improve spatial correspondence, we ensured that the locations of MAR objects wereMAR objects were
aligned with
aligned with their
their real-world
real-world counterparts,
counterparts, where applicable. This
where applicable. This isis unlike
unlike in
in the original Virtual
the original Virtual
Campus Tour, where the virtual panel size and location were far from those of
Campus Tour, where the virtual panel size and location were far from those of the actual panel.the actual panel.
Furthermore, totoengage
Furthermore, engage users
users emotionally
emotionally with
with the MAR theapplication
MAR application through
through natural natural
interaction,
interaction, we enabled voice commands. The student can start to communicate
we enabled voice commands. The student can start to communicate with the avatar by saying “Hello” with the avatar by
saying “Hello” as soon as the avatar appears. The avatar responds, and then the
as soon as the avatar appears. The avatar responds, and then the student may ask, for example: student may ask, for
example:
“Who “Who The
are you?” are avatar
you?” first
The introduces
avatar firstherself,
introduces herself,
and then, she and then,about
explains she explains about
the different the
floors,
different floors, classrooms and offices. Finally, after the tour ends, the avatar wishes the
classrooms and offices. Finally, after the tour ends, the avatar wishes the student all the best. A future student all
the best. A future study is needed to measure whether the added voice commands and other changes
to the avatar make it more emotion-evoking and natural.
7. Discussion
With the advancement of smart device technologies and the popularity of smartphones, users’
expectations have exceeded mere usability of mobile applications. In contemporary applicationYou can also read