Progress and Challenges of Demand-Led Co-Produced Sub-Seasonal-to-Seasonal (S2S) Climate Forecasts in Nigeria - Frontiers
←
→
Page content transcription
If your browser does not render page correctly, please read the page content below
ORIGINAL RESEARCH
                                                                                                                                          published: 08 September 2021
                                                                                                                                         doi: 10.3389/fclim.2021.712502

                                             Progress and Challenges of
                                             Demand-Led Co-Produced
                                             Sub-Seasonal-to-Seasonal (S2S)
                                             Climate Forecasts in Nigeria
                                             Kamoru A. Lawal 1,2*, Eniola Olaniyan 2 , Ibrahim Ishiyaku 2 , Linda C. Hirons 3 ,
                                             Elisabeth Thompson 3 , Joshua Talib 4 , Victoria L. Boult 3 , Stephen Bunmi Ogungbenro 5 ,
                                             Imoleayo Ezekiel Gbode 5 , Vincent Olanrewaju Ajayi 5 , Emmanuel Chilekwu Okogbue 5 ,
                                             Elijah A. Adefisan 5,6 , Victor S. Indasi 6 , Lorraine Youds 7 , Elias Nkiaka 8 , Dáithí A. Stone 9 ,
                                             Richard Nzekwu 10 , Olusegun Folorunso 11 , John A. Oyedepo 12 , Mark G. New 1 and
                                             Steve J. Woolnough 3
                                             1
                                               African Climate and Development Initiative, University of Cape Town, Cape Town, South Africa, 2 Numerical Weather
                             Edited by:      Prediction Unit, Nigerian Meteorological Agency, Abuja, Nigeria, 3 National Centre of Atmospheric Science (NCAS), University
                          Vimal Mishra,      of Reading, Reading, United Kingdom, 4 U.K. Centre for Ecology and Hydrology, Wallingford, United Kingdom, 5 Department
         Indian Institute of Technology      of Meteorology and Climate Science, Federal University of Technology, Akure, Nigeria, 6 African Centre of Meteorological
                    Gandhinagar, India       Applications for Development (ACMAD), Niamey, Niger, 7 National Centre of Atmospheric Science (NCAS), University of
                        Reviewed by:         Leeds, Leeds, United Kingdom, 8 Department of Geography, University of Sheffield, Sheffield, United Kingdom, 9 National
                           Udit Bhatia,      Institute of Water and Atmospheric Research, Wellington, New Zealand, 10 International Fund for Agricultural Development,
        Indian Institute of Technology       Climate Change Adaptation and Agribusiness Support Programme, Katsina, Nigeria, 11 Department of Computer Science,
                    Gandhinagar, India       Federal University of Agriculture, Abeokuta, Nigeria, 12 Institute of Food Security, Environmental Resources and Agricultural
                  Johnna Maria Infanti,      Research, Federal University of Agriculture, Abeokuta, Nigeria
   Climate Prediction Center, National
            Oceanic and Atmospheric
 Administration (NOAA), United States
                                             This paper identifies fundamental issues which prevent the effective uptake of climate
                  *Correspondence:
                                             information services in Nigeria. We propose solutions which involve the extension of
                    Kamoru A. Lawal          short-range (1 to 5 days) forecasts beyond that of medium-range (7 to 15 days)
                lawal@csag.uct.ac.za
                                             timescales through the operational use of current forecast data as well as improve
     orcid.org/0000-0002-8198-8844
                                             collaboration and communication with forecast users. Using newly available data to
                    Specialty section:       provide seamless operational forecasts from short-term to sub-seasonal timescales, we
          This article was submitted to      examine evidence to determine if effective demand-led sub-seasonal-to-seasonal (S2S)
                       Climate Services,
                a section of the journal     climate forecasts can be co-produced. This evidence involves: itemization of forecast
                     Frontiers in Climate    products delivered to stakeholders, with their development methodology; enumeration of
             Received: 20 May 2021           inferences of forecast products and their influences on decisions taken by stakeholders;
         Accepted: 19 August 2021
                                             user-focused discussions of improvements on co-produced products; and the methods
      Published: 08 September 2021
                                             of evaluating the performance of the forecast products.
                              Citation:
      Lawal KA, Olaniyan E, Ishiyaku I,         We find that extending the production pipeline of short-range forecast timescales
      Hirons LC, Thompson E, Talib J,        beyond the medium-range, such that the medium-range forecast timescales can be fed
 Boult VL, Ogungbenro SB, Gbode IE,
  Ajayi VO, Okogbue EC, Adefisan EA,
                                             into existing tools for applying short-range forecasts, assisted in mitigating the risks of
         Indasi VS, Youds L, Nkiaka E,       sub-seasonal climate variability on socio-economic activities in Nigeria. We also find that
   Stone DA, Nzekwu R, Folorunso O,
                                             enhancing of collaboration and communication channels between the producers and the
            Oyedepo JA, New MG and
  Woolnough SJ (2021) Progress and           forecast product users helps to: enhance the development of user-tailored impact-based
           Challenges of Demand-Led          forecasts; increases users’ trusts in the forecasts; and, seamlessly improves forecast
                          Co-Produced
     Sub-Seasonal-to-Seasonal (S2S)
                                             evaluations. In general, these measures lead to more smooth delivery and increase in
          Climate Forecasts in Nigeria.      uptake of climate information services in Nigeria.
                Front. Clim. 3:712502.
      doi: 10.3389/fclim.2021.712502         Keywords: climate, co-production, forecast, Nigeria, S2S

Frontiers in Climate | www.frontiersin.org                                          1                                        September 2021 | Volume 3 | Article 712502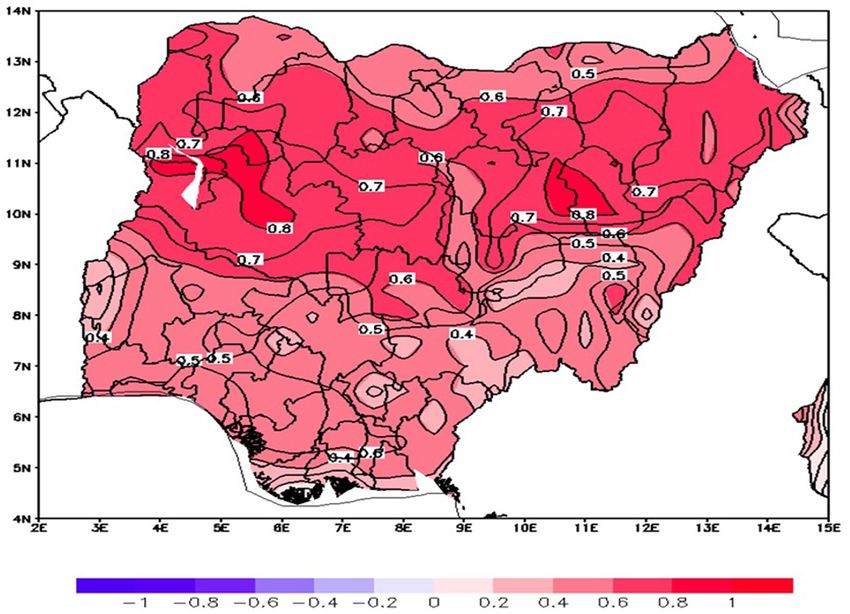
Lawal et al.                                                                                                     Examining S2S Forecasts in Nigeria

INTRODUCTION                                                               faced by climate information services in Nigeria, the subsequent
                                                                           sub-sections briefly describe the climate-induced problems in
Climate Information Services and                                           Nigeria (section Climatic problems in Nigeria), activities of
Challenges in Nigeria                                                      the Global Challenges Research Fund African Science Weather
The delivery of climate information services in Nigeria has come           Information for Forecasting Techniques (GCRF African-SWIFT;
of age. Climate services evolve around the timely transfer of              https://africanswift.org/) project as it relates to the concept
meteorological data and forecast products to users in several              of this paper (section The GCRF African-SWIFT project),
socio-economic sectors. There has been increasing growth of                and the S2S datasets that are utilized to jointly produce new
population and economy, as well as urbanization in the country.            forecast products that are operationally being issued to end-users
This has consequently resulted in an increase in the activities            (section Real-time state-of-the-art S2S climate forecast datasets).
of different climate-sensitive sectors, such as agriculture and            Analysis of demand-led co-produced forecast products analyses
food security, construction, energy, health, water resources and           the demand-led co-produced forecast products in terms of the
transport. Though, these changes are largely driving the uptake            decisions taken by the stakeholders, improvement in the forecast
of climate information services in Nigeria, there are, however,            products from the stakeholders’ perspectives, feedbacks from
two major challenges that have been preventing the appropriate             stakeholders and the performance evaluation of the forecast
uptake of climate information services in the country.                     products. The section will also discuss the development of a
    Currently and operationally, weather forecasts in Nigeria are          range of prototype products in response to the users’ needs.
limited to two days in advance. Outlooks cover up to 5 days                Some of the decisions taken by the users based on these
at most. Medium-range (7 to 15 days) weather and or climate                forecasts and the outcomes of those decisions will be discussed
forecasts are therefore not covered (Olaniyan et al., 2018), thereby       in sub-section decisions taken by the stakeholders based on
making short-range (1 to 5 days) weather forecasts operationally           the co-produced forecast products. While the refinement of the
predominant. While these short-range forecasts are useful for              forecasts and the development of new forecasts based on the
reactive decisions, they are less effective for long-term planning         feedback from users are discussed in sub-section improvement
and action toward disaster risk reduction particularly in key areas        in the forecast products from the stakeholders’ perspectives,
such as health, food security, environment, and water resources            sub-section performance evaluation of the forecast product(s)
(Omotosho and Abiodun, 2007).                                              discusses the process of evaluation of the forecasts. Conclusions
    Additionally, collaborations between the country’s                     from the progress so far, identification of remaining challenges
meteorological and hydrological agency and key stakeholders                and recommendations are presented in section conclusions.
(i.e., forecast end-users) is weak. There have been no jointly
developed user-tailored impact-based forecasts (Nkiaka et al.,             Climatic Problems in Nigeria
2020). The end-users contribute in no way to the forecaster’s              The majority of the population in Nigeria consists of small-holder
operational algorithms. The outcome of the poor relationship               farmers whose economy and livelihood depend on small-scale,
is the end-users’ inability to interpret and consume the services          rain-fed agriculture. The country is therefore highly vulnerable
offered by the forecasters.                                                to large variations in diurnal, monthly, seasonal and inter-
    In view of the aforementioned challenges facing the delivery           annual weather and climate events (Gbobaniyi et al., 2013).
of climate information services in Nigeria, timely and reliable            These often include extreme events such as severe and squally
sub-seasonal-to-seasonal (S2S) climate forecast algorithms that            thunderstorms (Omotosho and Abiodun, 2007; Oguntunde et al.,
will extend the short-range forecast timescales beyond that of             2014), boreal spring / summer heat waves (Ragatoa et al., 2018;
medium-range timescales becomes necessary for operational                  Lawal et al., 2019), boreal winter dust storms that dangerously
purposes. At the same time, scientists and forecasters need                impair horizontal and vertical visibilities (Marais et al., 2014),
to develop a platform that opens and utilizes communication                excessive dryness and drought (Kasei et al., 2010; Oguntunde
channels with forecast end-users.                                          et al., 2014; Ayanlade et al., 2018; Gbode et al., 2019; Ajayi and
    The deployment of this S2S climate forecast algorithm, that            Ilori, 2020), and heavy rainfall and urban flooding (Adekola and
extends the short-range forecast timescales beyond that of                 Lamond, 2018). All these extreme climatic events are projected
medium-range timescales, may help in mitigating the risks of               to occur more frequently in future due to global warming
sub-seasonal climate variability on socio-economic activities in           (IPCC (Inter-governmental Panel on Climate Change)., 2014;
Nigeria. Stakeholders’ platform for collaboration will enhance             Zhao et al., 2017; Klutse et al., 2018). The frequent occurrences
the joint development of user-tailored impact-based forecasts;             of extreme weather events are likely to lead to more losses
increase users’ trusts in the forecasts; and, seamlessly help in the       in agriculture, which is the mainstay of the nation’s economy.
evaluation of the performance of the forecasts. This paper aims            Therefore, a combination of reliable and timely S2S climate
to document the process of co-producing new forecast products              forecasts tailored toward stakeholders’ demand would go a long
to improve the resilience of climate-sensitive sectors in Nigeria.         way to mitigate the impacts of climate-induced problems on
The purpose is to outline this process and identify outstanding            socio-economic activities.
challenges in order to guide future efforts in climate service
development in West Africa in general.                                     The GCRF African-SWIFT Project
    This study comprises of three sections. While this section             The GCRF African-SWIFT project has been funding and
introduces the concept of the paper by highlighting the challenges         hosting a series of operational weather forecasting “testbeds”

Frontiers in Climate | www.frontiersin.org                             2                                 September 2021 | Volume 3 | Article 712502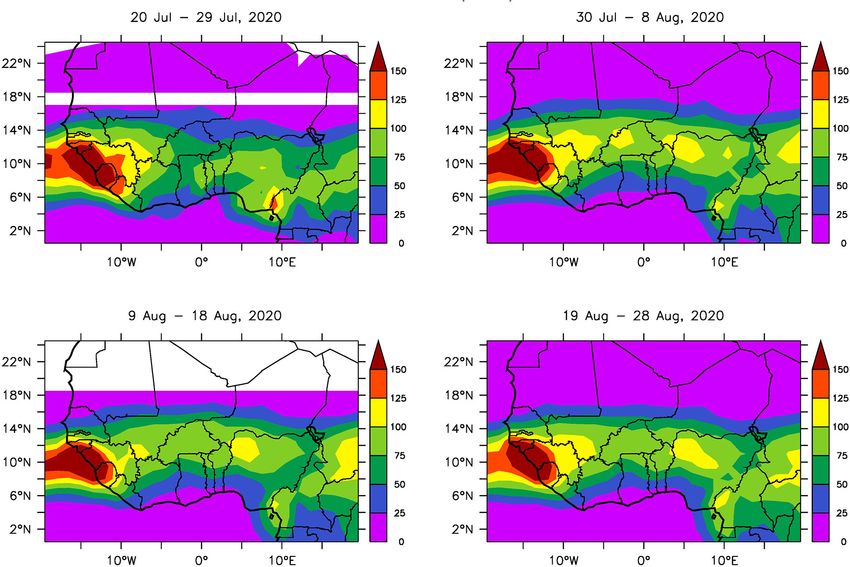
Lawal et al.                                                                                                    Examining S2S Forecasts in Nigeria

in Africa. Four countries, Senegal, Ghana, Nigeria, and                  the ECMWF-S2S model are more skillful than those from
Kenya, are participating in this project through their national          other models, especially in the first two weeks. de Andrade
meteorological establishments and academic institutions. The             et al. (2021) also found that the ECMWF-S2S model’s forecast
testbeds have been bringing together researchers and forecasters,        quality is linked to the strength of climate drivers, vis-à-vis
as well as forecast users from these participating African               teleconnections such as Indian Ocean dipole, El Niño—Southern
countries (Roberts et al., 2021). Operational forecasters work in        Oscillation, and the Madden–Julian oscillation. ECMWF-S2S
tandem with stakeholders at the testbeds and the reports of their        dataset has 51 ensemble members thereby allowing analyses of
work are documented and archived internally.                             the range of possible climate events, uncertainties in climate
   Forecasters and stakeholders utilize real-time predictions            events and probabilities of occurrence of climate events across
from state-of-the-art forecasting models to co-produce new               all meteorological variables. Operationally, availability of the
and user-tailored sub-seasonal climate forecast products. These          ECMWF-S2S forecast data offers new opportunities to enhance
products are designed to aid decision-making in sectors such as          the delivery of weather and climate services in Nigeria.
health, food security, agriculture, environment, water resources,            In the spirit of the testbeds, the real-time ECMWF-S2S
disaster risk reduction and energy. The testbeds mimic similar           forecast datasets are being routinely analyzed to develop some
successful testbeds that have been held in the United States of          sub-seasonal climate forecast products in conjunction with some
America in the past (Ralph et al., 2013). The only difference            sub-set of forecast users, i.e., the stakeholders. These stakeholders
here is that pilot products are continually being used, feedbacks        are from weather-sensitive economic sectors for whom sub-
from users encouraged, and forecast performances evaluated in            seasonal climate information would aid there planning and
real time to improve their practical application for decision-           decisions. The co-produced forecast products are then utilized
making (Carter et al., 2019; Hirons et al., 2021). The testbeds          by stakeholders to take numerous decisions that prevent
therefore have become avenues for real-time sub-seasonal climate         losses, both materially and financially, in various sectors of
forecast products.                                                       the economy. Timely provision of these sub-seasonal climate
                                                                         forecasts constitute parts of early warning systems that afford
                                                                         Nigerians sufficient time to mitigate against severe weather events
Real-Time State-Of-The-Art S2S Climate                                   that normally hinder socio-economic activities (Nkiaka et al.,
Forecast Datasets                                                        2019, 2020).
The GCRF African-SWIFT project, being one of the 16                          It is appropriate to note that these co-produced sub-
projects taking part in the World Meteorological Organization            seasonal climate forecast products are not daily forecasts, but an
(WMO) S2S Prediction Project Real-time Pilot Initiative (http://         average over arrays of days, e.g., weekly, dekadal, etc., that will
s2sprediction.net/), provides some real-time S2S climate forecast        seemingly extend and improve the existing short-range forecast
datasets to national meteorological services of the participating        timescales. For clarity, the co-produced sub-seasonal climate
countries. The S2S Prediction Project is a joint initiative of the       forecast products will indicate if an extremely wet or dry period
World Weather Research Programme (WWRP) and the World                    (week or dekad) is coming but not exactly how much rain
Climate Research Research Programme (WCRP).                              will fall on a particular day. The forecasts will also be able to
    Accessing and utilizing the S2S climate forecast datasets is         indicate the anticipation of extremely hot or cold periods but
as a follow up to the spirit of the testbeds as agreed by the            not the exact magnitude of hotness or coldness of a particular
participating countries. Nigerian Meteorological Agency (NiMet;          coming day.
www.nimet.gov.ng) is one of the participants and beneficiaries.
    These S2S climate forecast datasets, used in this study, are
from the state-of-the-art generations of models from (though not         ANALYSIS OF DEMAND-LED
limited or restricted to) the European Centre for Medium-range           CO-PRODUCED FORECAST PRODUCTS
Weather Forecasts (ECMWF) seasonal forecasts System 4 (Vitart
et al., 2012). On weekly temporal scale, GCRF African-SWIFT              Mimicking series of testbeds involving the forecast producers
project provides daily forecasts from the ECMWF for 1 to 46              and the stakeholders, of which the modus-operandi and the
days in advance (Vitart et al., 2017). General configurations of         applications of their reports have been documented by Nkiaka
the ECMWF-S2S forecast datasets have been described by Vitart            et al. (2020) and Roberts et al. (2021), this section discusses the
et al. (2017).                                                           user demand for forecast information on sub-seasonal timescales
    Performances of the ECMWF-S2S, over Nigeria, have been               to inform decision making in a range of sectors. The section also
evaluated by Olaniyan et al. (2018, 2019). In addition, Vellinga         discusses the development of a range of prototype products in
et al. (2013) and Batté et al. (2018) have also shown that the           response to the users’ needs. Here, all the direct and derived sub-
ECMWF-S2S climate forecast has skill in representing weather             seasonal climate products that were operationally given out in
and sub-seasonal climate forecasts over Nigeria’s neighboring            the form of forecasts to stakeholders are presented on Table 1.
countries. Furthermore, de Andrade et al. (2021) who utilized            There are statistical descriptions as well as statistical metric of
several verification metrics to assess the ECMWF-S2S’ weekly             each forecast product. The reason(s) each product were issued
precipitation forecast quality at lead times of one to four weeks        to stakeholders are also displayed on the table. Periods within the
ahead (weeks 1–4) during different seasons over Africa, and              year, in terms of months, peculiar to each forecast product are
in comparison to other models, found that predictions from               also included.

Frontiers in Climate | www.frontiersin.org                           3                                  September 2021 | Volume 3 | Article 712502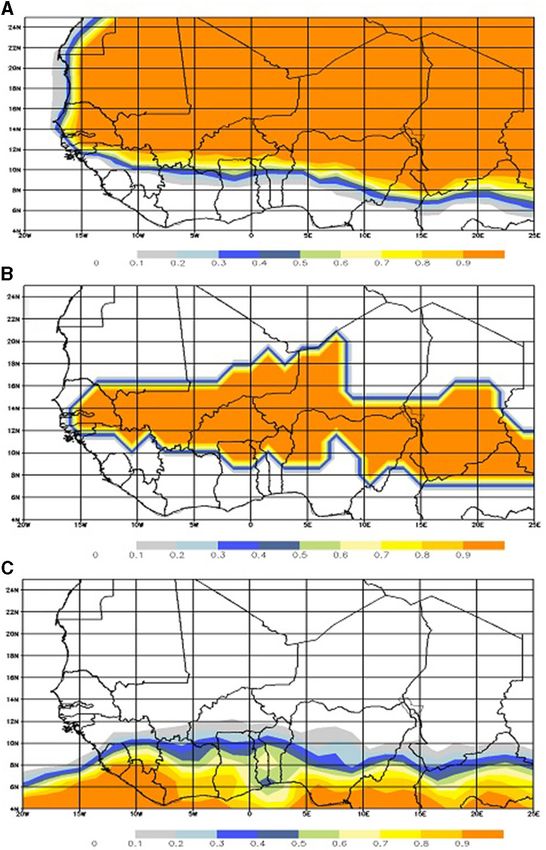
TABLE 1 | List of direct and derived co-produced S2S climate forecast products that were operationally issued to stakeholders.
Frontiers in Climate | www.frontiersin.org
Lawal et al.
Issued forecast Statistical description of products Reason for issuance Unit
products
Probability of surface On a grid-point by grid-point basis, probabilities are To depict regions of low moisture availability (extreme dryness). Issued December to March. %
relative humidity ≤ 30% expressed as the ratio of the number of ensemble
members that satisfy a required threshold and or
condition to the total number of ensemble members
(usually 51) and are expressed as a percentage (%).
Probability of wind To depict regions of low-level strong winds. To determine source regions of dust and the possible direction of %
speed at 925 hPa level propagation. Issued December to March.
≥ 20 Knots (i.e., 10
ms−1 )
Probability of To depict regions of low near-surface minimum temperature (extreme coldness / cold waves). Issued December to %
near-surface minimum February.
temperature ≤ 15◦ C
Probability of To depict regions of high near-surface maximum temperature (extreme heat / heat waves). Issued March to June %
near-surface maximum and October to November.
◦
temperature ≥ 38 C
Probability of dekadal To depict, on a dekadal scale, regions where rainfall is likely to commence (issued February to May) or cease %
rainfall accumulation ≥ (issued September to November).
5 mm but < 10 mm
Probability of dekadal To depict regions with moderate amount of rainfall accumulation within a dekad. Issued April to October to %
rainfall accumulation ≥ determine stability of rainfall commencement and to monitor rainfall performance.
25 mm but < 50 mm
4
Probability of dekadal To depict regions that may experience heavy amount of rainfall accumulation within a dekad. A flood alert is %
rainfall accumulation ≥ released if this persist for more than two dekads over a region. Issued June to September.
50 mm but < 100 mm
Probability of dekadal To depict regions that may experience heavier amount of rainfall accumulation within a dekad. A flood alert is %
rainfall accumulation ≥ released if this persist for more than a dekad over a region. Issued June to September.
100 mm
Cumulative dekadal Total amount of rainfall within a dekad, i.e., total amount To depict total amount of rainfall, that may be experienced over a region, for each 10 days of the forecast periods, mm
rainfall for each 10 days in each month or for each 10 days of or specifically for each 10 days of a month. This assists farmers to make irrigation decision based on their
the forecast periods. determined thresholds. Issued throughout the rainy seasons (April to October) to monitor rainfall performance.
Precipitation anomaly Variability of a climatic parameter defined as its To depict regions projected to have normal, below normal or above normal amount of rainfall. Persistence of mm
deviations from its long-term average for a specified certain category helps to determine areas that are likely to experience business as usual, drought or flood,
period of time, i.e., anomaly of a climatic parameter = respectively, depending on the degrees of deviations from the climatology. Issued throughout the rainy seasons
September 2021 | Volume 3 | Article 712502
projected amount of a climatic parameter during the (April to October).
specified period minus the climatology of that climatic
parameter for the specified period.
Examining S2S Forecasts in Nigeria
o
Temperature anomaly To depict regions projected to have normal, below normal or above normal near-surface temperatures. C
for maximum and Persistence of certain category helps to determine areas that are likely to experience business as usual, cold or
minimum near-surface heat waves, respectively, depending on the degrees of deviations from the climatology. Issued throughout the year.
temperatures
Top 20 cm soil moisture To depict regions projected to have normal, below normal or above normal moisture within the top 20 cm of the Kgm−3
anomaly surface soil. Persistence of certain category helps to determine areas that are likely to experience business as or %
usual, dryness or wetness, respectively, depending on the degrees of deviations from the climatology. This also
assists farmers in monitoring drought impacts on agriculture and crop production hence make irrigation decision
based on their determined thresholds. Issued throughout the year to monitor the moisture conditions at the top
20 cm of the surface soil.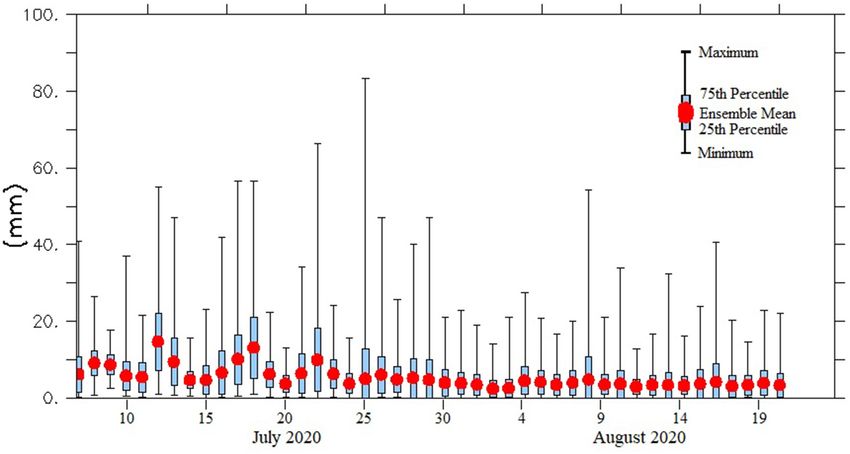
Lawal et al. Examining S2S Forecasts in Nigeria
Stakeholders are given the opportunity to describe their
idea of meteorological parameters that would aid or suit their
operational algorithms at weekly meetings between the forecast
producers and users. Forecasters will then try to turn these ideas
into tangible localized forecast products, as presented in Table 1,
using available datasets. This method allows forecast users to
contribute effectively to the forecasters’ operational algorithms,
thereby finding it easier to interpret and consume the services
offered by the forecasters.
NiMet has a forecasting mandate, conferred on it by the
WMO, to support other West African nations (e.g., Liberia,
Sierra Leone). To give credence to this claim an extract from
sub-section decisions taken by the stakeholders based on the
co-produced forecast products of WMO report on “Request for
WMO Expert Assistance to Improve NWP at NiMet” reference
number 01918/2019-DRA-AFLDC is quoted below:
“Following a quick tour de table introduction, the Director General
of NiMet and also the Permanent Representative (PR) of Nigeria
with WMO welcomed the team to Abuja. He expressed, in the
following terms, the reasons why he requested the assistance of
WMO to assist with the assessment of the NiMet NWP program:
there is a strong desire to modernize and improve the capacity of
the NWP program, not only for the provision of better services to
Nigerians, but also to neighboring countries which require some
assistance in the area of training and forecasting services, like Sierra
Leone and Liberia which are currently supported by the NiMet”.
This explains the reasons some figures, for instance Figures 1–3,
are plotted over West Africa, and not over Nigeria alone.
Decisions Taken by the Stakeholders
Based on the Co-Produced Forecast
Products
Based on the reports from the testbed meetings we found that FIGURE 1 | Samples of co-produced probabilities (x100%) of (A) surface
◦
relative humidity ≤ 30%; (B) near-surface maximum temperature ≥ 38 C; and,
numerous decisions were taken by stakeholders based on the (C) dekadal rainfall accumulation ≥ 25 mm but < 50 mm, produced from the
co-produced forecast products. On a general note, the forecast ECMWF-S2S base forecast of March 16, 2020 and valid from April 5, 2020 to
products were utilized to plan and take decisions that prevent April 14, 2020. Probability of, for instance, 0.8 on the scale = 80%.
losses in terms of lives, property, and finances. Some of the
instances relating to some Nigerian socio-economic sectors are
discussed here.
but deadly disease caused by protozoan parasites that are spread
Health Sector through anopheles mosquitoes’ bites: Sachs and Malaney, 2002;
Health workers normally look out for areas where low surface Klutse et al., 2014); etc. Warnings and advisories are sent out
relative humidity (≤ 30%; Figure 1A) coincides with high near- to members of the public the moment health-threatening (user-
surface temperature (≥ 38◦ C; Figure 1B). They use this to defined) thresholds are detected. Preparations for health-related
determine the likely areas of meningitis epidemics (Molesworth, emergencies then commence.
2003; Mera et al., 2014). Areas of high near-surface temperature
(≥ 38◦ C) are also used as an indicator for the migration of tsetse Natural Disaster and Humanitarian Sector
flies. These flies are notoriously known for blood sucking and Natural disaster and humanitarian emergency managers utilize
transmission of African trypanosomiasis, commonly referred to rainfall thresholds such as the probability of dekadal rainfall
as sleeping sickness, across the country (Ford and Katondo, 1977; accumulation ≥ 50 mm but < 100 mm (e.g., Figure 1C) to
Rogers et al., 1996). Health sector stakeholders are interested in warn valley dwellers of the possibility of flooding (Adekola and
these specific diseases, as well as other health-related issues that Lamond, 2018). With such forecasts, humanitarian managers
are traceable to high near-surface temperatures, e.g., dehydration will be prompted to relocate the would-be-affected people to
that stresses the human vascular systems (Flynn et al., 2005; higher dry lands or reinforce shelters and riverbanks. Usually this
Thornton, 2010; Lim et al., 2015); malaria epidemics (common requires coordination with health workers, as well as make food
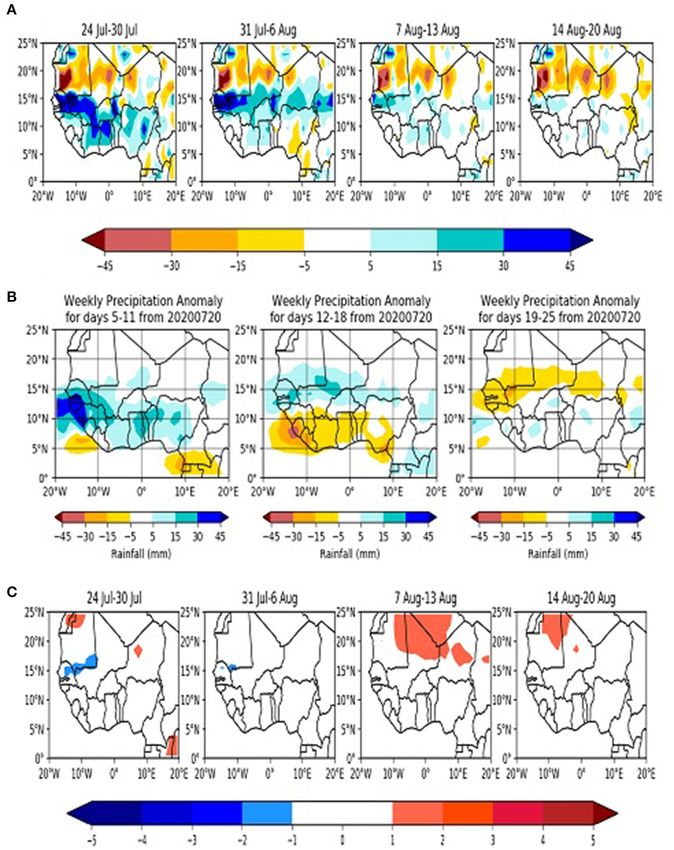
Frontiers in Climate | www.frontiersin.org 5 September 2021 | Volume 3 | Article 712502Lawal et al. Examining S2S Forecasts in Nigeria FIGURE 2 | Samples of weekly anomalies of (A) top 20 cm soil moisture (kgm−3 ); (B) precipitation (mm); and, (C) near-surface maximum temperature (◦ C) produced from the ECMWF-S2S base forecast of July 20, 2020. available in order to mitigate all the negative effects that will come out”, and that “the probability of rainfall exceeding 50 mm was with the anticipated flood. 100%. This was expected to be about 15 mm above normal, coupled One example of the successes of such warnings was a flood with the anticipation of excessive soil moisture that would likely event that occurred in July 2020 on the outskirts of Abuja, aid run-off.” Specifically, the forecast declared that Abuja should the capital of Nigeria (https://africanswift.org/2020/10/19/the- expect rainfall accumulation of about 75–100 mm within 20–29 science-behind-abujas-summer-flood/). One of the S2S climate July 2020, the last dekad in July 2020. However, some damages to forecasts released in July 2020 made a statement that “widespread lives and property were still recorded despite the forecast being flooding is possible and should be expected, especially over the s-ent to an appropriate stakeholder to warn people ahead of time. northwestern, central and the Niger Delta areas. Agricultural and Another example is in August 2020, timely release of a human losses, over the low lands and river basins, are not ruled similar forecast saved numerous lives and property worth billions Frontiers in Climate | www.frontiersin.org 6 September 2021 | Volume 3 | Article 712502
Lawal et al.                                                                                                                Examining S2S Forecasts in Nigeria

 FIGURE 3 | Sample of a co-produced anticipated cumulative dekadal rainfall amount (mm) produced from the ECMWF-S2S base forecast of July 20, 2020.

of dollars in Bama, a city in the northeastern part of the                       Farmers thereby design various ways of harvesting and storing
country (https://reliefweb.int/disaster/fl-2020-000196-nga).                     water for future uses and purposes [FAO (Food Agricultural
                                                                                 Organization of the United Nations)., 2016].
Agricultural Sector
While livestock farmers are interested in the absolute values of                 General Public and Insurance
surface relative humidity and temperatures to determine and                      Insurance companies benefit from the co-produced forecasts
avert the negative effects of heat stress and thermal discomfort                 as it assists them in the operational task of preparing for
indices (Sylla et al., 2018); crop farmers are more interested                   major pay-outs. This is true for individual members of the
in the anomalies of soil moisture, rainfall accumulation and                     public, as well as corporate socio-economic sectors, as they are
near-surface temperature (Figures 2A–C). Crop farmers use                        beginning to embrace weather-index-based insurance. Weather-
the combinations of these three anomalies to quantify various                    index-based insurance provides a safety net to the exposed
degrees of agricultural drought (Luo et al., 2017; Ayanlade                      individuals, as well as fragile weather dependent socio-economic
et al., 2018). Crop farmers without irrigation infrastructures                   sectors (Collier et al., 2009). Weather-index-based insurance is
take decisions to expand their farmlands if rainfall deficits are                gradually becoming essential as a risk mitigation strategy that
projected to occur repeatedly. This helps them to compensate                     individuals and weather dependent socio-economic sectors may
for loss in production (Zaveri et al., 2020). Crop farmers utilize               use to mitigate adverse climate shocks and natural disasters
absolute values of soil moisture to determine, based on threshold,               encountered during social and economic operations (Fonta et al.,
the water intake rate of the topsoil and/or saturation, which                    2018).
may consequently lead to excessive run-off, thereby resulting in
flood and top-soil erosion (Abdulfatai et al., 2014). They also                  Water Resources and Construction Sectors
utilize rainfall accumulation forecasts (Figure 3) to take decisions             Dam, power and construction managers utilize rainfall
relating to water supply, flood control, and potential evaporation.              accumulation forecasts (Figure 3) to take decisions relating
With rainfall being the only source of free water input into                     to water supply, electricity generation, flood control, recreation,
agricultural operations, and that its future changes remain likely               irrigation, etc. Rainfall accumulation forecasts are used to
uncertain (Monerie et al., 2017), farmers are concerned about the                compute runoff / streamflow as a proxy for water availability
likely future increase in potential evaporation due primarily to                 because runoff is closely related to changes in precipitation
an enhanced warming of the climate (Zougmoré et al., 2016).                      (Roudier et al., 2014). Runoff is harvested and stored as water

Frontiers in Climate | www.frontiersin.org                                   7                                     September 2021 | Volume 3 | Article 712502
Lawal et al. Examining S2S Forecasts in Nigeria
in dams. In Nigeria, availability of power supply has been stakeholders are yet to fully grasp what information an S2S
linked to water level in dams because a greater percentage of model can accurately produce. Current S2S forecasts are able
electricity is generated from hydro-power, when compared to to reliably forecast the state of the atmosphere averaged over
other sources of power generation. Construction managers rely a period of days, e.g., weekly, dekadal, etc. and are currently
on rainfall accumulation forecasts to decide whether to move not capable of determining exact daily rainfall totals over a
heavy equipment to muddy sites. very specific local region. This mismatch between S2S forecast
capability and specific user needs will require significant resource
and communication to overcome effectively.
Improvement in the Forecast Products On the last standpoint of further improvement, stakeholders
From the Stakeholders’ Perspectives would like some new forecast products to be included.
Continuous interactions with several stakeholders indicate that Specifically, health sector stakeholders require maps of likely
improvement in the co-produced forecast products, from the areas of meningitis and malaria outbreaks. Livestock farmers are
stakeholders’ points of view, are of four standpoints. 1. graphics interested in the graphics that will depict heat stress and thermal
of presentation of the forecast products; 2. understanding discomfort indices. Crop farmers will appreciate information that
and simplicity of language of presentation; 3. local / point directly contain drought and flood prone areas, and potential
specific (instead of spatial) presentation of forecast products evapotranspiration. Though, production of these parameters are
on daily timescale; and 4. the inclusion of specific tailored likely to take some liabilities off the shoulders of the stakeholders,
forecast products. it will however require significant resource from the forecast
Stakeholders are continuously requesting for forecast producers to do these, as well as over-concentrate productions
products to be graphically presented in a simplified and in the hands of forecast producers. In this case, increase in
comprehensive manner. These requests are, however, complex computational resource and training of skilled forecast producers
in nature. This is because there is no consensus among the needs to be considered by the forecast producers. As forecasts are
stakeholders on the specificity of the graphic design of the only useful if they are reliable, therefore, performance evaluation
forecast products. Forecast producers (in this case NiMet, of these new products is required and may also delay the reliable
inspired by the WMO’s guidelines on graphical presentations production and roll-out of these much-needed parameters.
of public weather services products—https://library.wmo.int/
doc_num.php?explnum_id=9190), therefore, have to group
stakeholders according to similarity in their presentation Performance Evaluation of the Forecast
preferences due to resource constraints. Product(S)
Nigeria is a diverse nation with more than 250 ethnic Performance evaluations of the forecast products are carried
groups, each having their dominant languages spoken out using the following four strategies-−1. monitoring of
within their territories (https://www.britannica.com/place/ extreme weather events reported by electronics and print media
Nigeria/Languages). Fortunately, a substantial fraction of in the country; 2. eye-witness narrations of extreme weather
the stakeholders are highly literate; however, the majority of events; 3. comparisons of the forecast products to weather
them, especially the privately owned socio-economic quarters, observation reports from NiMet’s weather observatories; and 4.
would prefer that forecast products be presented in certain utilization of some quantitative statistical metrics documented by
local languages, instead of in English which is the nationally research outputs.
spoken language. Furthermore, stakeholders prefer that forecast Extreme weather events reported by electronics and print
presentations should be devoid of scientific terminologies media in Nigeria (from January 2020 to September 2020) were
which may be difficult for them to understand, regardless of the collected, compiled, and collated. Enumerations of the events as
language used. Forecasters are therefore undergoing training, reported by the media houses indicate that the model (i.e., the
designed by NiMet, in “operational” writing for the benefits forecast products) captured about 80% of severe weather events
of non-scientists. As with graphical presentation, resource over the country. While there was some damage to lives and
constraints impose a strong limit how much the linguistic property, the media houses also reported that many lives and
preferences can be satisfied. properties were saved by the timely release of the forecasts.
Stakeholders tend to prefer that forecast products are Eye-witness reports are another way of evaluating the
presented on a daily timescale for a local or specific coordinate performance of the co-produced forecast products. They are in
(e.g., Figure 4), instead of spatial, weekly or dekadal presentation. the form of feedbacks from the forecast product users. Official
They reason that this will afford them the opportunity to be aware letters of acknowledgment and appreciation, sent to NiMet,
of the likelihood of some events well in advance and thus be by some stakeholders also formed parts of the performance
prepared. However, this can be unwieldy. For example, there are evaluation. Eye-witness reports could also be in the form of news
774 autonomous local councils in Nigeria. Assuming that we have and publications from either the print or electronic media, as
say 20 stakeholders in each local council and we are to produce they typically report any extreme weather event, which has been
a sample of, say, Figure 4 for about 10 meteorological variables, predicted some days or weeks earlier, as it affects people and or
per stakeholder each for a different locality, this will generate certain communities, along with the trails of devastations it leaves
more than 1,50,000 graphics of different images altogether. behind. Two examples of such events (e.g., https://africanswift.
Unfortunately, such demands have come to show that some org/2020/10/19/the-science-behind-abujas-summer-flood/ and
Frontiers in Climate | www.frontiersin.org 8 September 2021 | Volume 3 | Article 712502Lawal et al. Examining S2S Forecasts in Nigeria FIGURE 4 | A sample of likely anticipated daily precipitation amount (mm) over Ibadan (latitude 7.38◦ N, longitude 3.95◦ E; days from July 7 to August, 2020), produced from the ECMWF-S2S base forecast of July 6, 2020. Ibadan is a city that normally experience the famous little dry season (i.e., August-break; Olaniyan et al., 2018) from end of July through August every year. Top and bottom of the bars indicate the likely maximum and minimum precipitation as predicted, respectively, by at least one ensemble member in each case. FIGURE 5 | Spatio-temporal correlation between daily near-surface mean temperature values from the ECMWF-S2S forecasts and the gridded observations over Nigeria. Frontiers in Climate | www.frontiersin.org 9 September 2021 | Volume 3 | Article 712502
Lawal et al.                                                                                                        Examining S2S Forecasts in Nigeria

https://reliefweb.int/disaster/fl-2020-000196-nga) were earlier              Africa, vis-à-vis, Nigeria. This huge gap has been filled to some
mentioned in sub-section natural disaster and humanitarian                   extent, by an operational weather forecasting ‘testbeds’ as part of
sector of this paper.                                                        the GCRF African-SWIFT project. The testbeds saw previously
    Furthermore, some works have documented the skill and                    unestablished collaborations between forecast producers and
reliability of the ECMWF-S2S forecasts, e.g., Tompkins and                   forecast users developing. By developing a joint understanding
Feudale (2010), Vellinga et al. (2013), Batté et al. (2018), Olaniyan        both were able to work in tandem for the benefits of the socio-
et al. (2018, 2019), de Andrade et al. (2021), etc. They found               economic sectors of their respective countries. Though, the
that ECMWF-S2S climate forecast data has skill in representing               intervention provided by the GCRF African-SWIFT project has
weather and sub-seasonal climate simulations and forecasts over              been able to cut down some effects of the challenges; some issues,
Nigeria, and where applicable over West Africa. de Andrade                   such as communication, however, remain unresolved.
et al. (2021), using several verification metrics, found that                    Communication remains a considerable challenge. For
predictions from the ECMWF-S2S model are more skillful than                  example, forecast users request products in “operational” writing
those from other models, especially in the first two weeks. They             devoid of scientific terminologies which may be difficult for the
also found that the model’s forecast quality is linked to the                stakeholders to understand. However, further effort is required to
strength of climate drivers, vis-à-vis teleconnections such as               better train forecast producers in the art of “operational” writing,
Indian Ocean dipole, El Niño—Southern Oscillation, and the                   something which will take time and resource. The challenge does
Madden–Julian oscillation.                                                   not end there, the very fact that forecasts are required to be
    It is also found that the forecast products contain reliable             interpreted into more than 200 local languages presents an almost
information when the forecast products are compared to                       unsurmountable communication challenge.
weather observations over the country, using some quantitative                   Furthermore, the mismatch that has become apparent
statistical metrics. For example, there is moderately positive               between what some users request (e.g., daily rainfall totals
linear association between the near-surface temperature forecasts            weeks in advance in a specific location), and what S2S forecast
and the real-time observations. The spatio-temporal correlation              models are capable of accurately producing (e.g., weekly averaged
between daily near-surface mean temperature values from                      likelihood of wet/dry conditions over a region) also highlights
ECMWF-S2S forecasts and the gridded observations, over                       the need for better communication. In agreement with existing
Nigeria, yielded values that are generally > 0.5 (Figure 5).                 studies (e.g., Lemos et al., 2018), it is clear from the evidence
Also, for a particular precipitation threshold, ensemble                     presented here that there is considerable merit in applying
spread, and skill were determined using the fractions skill                  resource to understanding and improving the co-production
score (FSS; Skok and Roberts, 2016). Here, FSS is able                       “process”, as well as it’s intended “products” or “outcomes”.
to give a direct measure of the error in the placement of                        It is believed that the barriers preventing the smooth delivery
the precipitation (figure not shown). FSS over the country                   of climate information services in Nigeria will be surmounted,
is able to indicate that the ECMWF-S2S precipitation                         by continuous adherence to steps analyzed in this paper. The
forecasts are potentially useful by returning values that are                end result will be that of mutual benefits to both the forecast
> 0.5.                                                                       producers, and the forecast users. Forecast users will continue to
                                                                             have access to timely and reliable climate services in their desired
                                                                             formats while forecast producers will continue to understand the
CONCLUSIONS                                                                  applications of atmospheric science as it evolves round numerous
                                                                             socio-economic sectors.
Under the status quo in Nigeria, decision-makers in weather-                     Two things have been achieved here: one, short-range
sensitive sectors only had short-term weather and climate                    forecast timescales have been extended beyond the medium-
information available to them. This resulted in a void of                    range forecast timescales by over 40 days; and, two, collaboration
information for timely, longer-term planning decisions or early              and communication channels have been opened between the
warning of extreme weather and climate events. Having timely,                forecast producers and the forecast users.
reliable and useful information on these longer timescales                       Socio-economic planning and productions in health, food
would go toward building a more resilient society and                        security, agriculture, environment, water resources, etc. have
economy in Nigeria. Through the GCRF African-SWIFT S2S                       become more effective than before as weather forecasts and
forecasting testbed, new S2S climate forecast products have                  outlooks become more reliably extended. Users now contribute
been co-developed with forecast users and forecast producers                 effectively to the forecasters’ operational algorithms, thereby
in Nigeria in a way not seen before. This paper has                          finding it easier to interpret and consume the services
examined the steps taken to achieve this and some of the                     offered by the forecasters. The first achievement helps in
challenges encountered.                                                      mitigating the risks of sub-seasonal climate variability on socio-
    Dike et al. (2018) itemized some challenges facing African               economic activities in Nigeria. The second achievement helps
climate scientists. These challenges, by extension, also affect              to enhance the development of user-tailored impact-based
the operational capabilities of some African meteorological                  forecasts; increase users’ trusts in the forecasts; and, seamlessly
institutions. Operationally, there is a disconnection between the            help in the evaluation of the performance of the forecasts.
forecast producers and the users of forecast products. This has              Overall, smooth delivery of climate information service has been
been having negative effects on climate information services in              substantially enhanced.

Frontiers in Climate | www.frontiersin.org                              10                                  September 2021 | Volume 3 | Article 712502
Lawal et al. Examining S2S Forecasts in Nigeria
DATA AVAILABILITY STATEMENT validation, resources, formal analysis, writing (review & editing),
visualization, funding acquisition, project administration.
The raw data supporting the conclusions of this
article will be made available by the authors, without ACKNOWLEDGMENTS
undue reservation.
This work was supported with grants from the following
AUTHOR CONTRIBUTIONS projects: U.K. Research and Innovation as part of the
GCRF African-SWIFT (work packages R2, R5 and
All authors have approved this work for publication listed R6) program—grant number NE/P021077/1; BNP Attribution
having made a substantial direct and intellectual contribution Project of the African Climate and Development Initiative
to the work in the order of activities listed against their (ACDI: www.acdi.uct.ac.za) of the University of Cape Town,
names as follow: KL conceptualization, investigation, South Africa; and, the 2019 National Research Fund Intervention
methodology, validation, resources, writing (original draft, (TETFund/DR&D/CE/NRF/STI/73/VOL.1) of the Tertiary
review & editing), visualization, supervision, software, formal Education Trust Fund (TETFUND) of Nigeria. The real-
analysis, data processing. EO methodology, software, formal time data used in this study has been provided through the
analysis, resources, data processing, visualization. II, SO, VA, S2S Prediction Project Real-time Pilot. The S2S Prediction
ECO, VI, RN, and OF investigation. LH conceptualization, Project is a joint initiative of the WWRP and the WCRP.
investigation, methodology, resources, writing (review & The authors gratefully acknowledges the computational,
editing), project administration. ET and VB investigation, technical and infrastructural supports provided by the Climate
resources. JT, IG, and DS conceptualization, investigation, Sciences Analysis Group (CSAG: www.csag.uct.ac.za),
methodology, writing (review & editing). EA and JO University of Cape Town. DAS was supported by the
investigation, funding acquisition. LY investigation, resources, Whakahura programme of the New Zealand Ministry of
funding acquisition. EN conceptualization, investigation, Business, Innovation, and Employment. We also thank all
resources. MN investigation, resources, supervision, funding reviewers whose comments helped to improve the quality of
acquisition. SW conceptualization, investigation, methodology, this manuscript.
REFERENCES global level. Available online at: http://www.fao.org/3/a-i5976e.pdf (accessed
on January 6, 2021).
Abdulfatai, I. A., Okunlola, I. A., Akande, W. G., Momoh, L. O., and Ibrahim, Flynn, A., McGreevy, C., and Mulkerrin, E. C. (2005). Why do older patients die in
K. O. (2014). Review of gully erosion in nigeria: causes, impacts and possible a heatwave? QJM 98, 227–229. doi: 10.1093/qjmed/hci025
solutions. J. Geosci. Geomatics 2, 125–129. doi: 10.12691/jgg-2-3-8 Fonta, W. M., Sanfo, S., Kedir, A. M., and Thiam, D. R. (2018). Estimating farmers’
Adekola, O., and Lamond, J. (2018). A media framing analysis of urban flooding willingness to pay for weather index-based crop insurance uptake in West
in Nigeria: current narratives and implications for policy. Reg. Environ. Change Africa: insight from a pilot initiative in Southwestern Burkina Faso. Agric. Food
18, 1145–1159. doi: 10.1007/s10113-017-1253-y Econ. 6:11. doi: 10.1186/s40100-018-0104-6
Ajayi, V. O., and Ilori, O. W. (2020). Projected drought events over West Ford, J., and Katondo, K. M. (1977). The Distribution of Tsetse Flies in Africa.
Africa using RCA4 regional climate model. Earth Syst. Environ. 4, 329–348. London: Hammond and Kell.
doi: 10.1007/s41748-020-00153-x Gbobaniyi, E., Sarr, A., Sylla, M. B., Diallo, I., Lennard, C., Dosio, A., et al.
Ayanlade, A., Radeny, M., Morton, J. F., and Muchaba, T. (2018). Rainfall (2013). Climatology, annual cycle and interannual variability of precipitation
variability and drought characteristics in two agro-climatic zones: an and temperature in CORDEX simulations over West Africa. Int. J. Climatol.
assessment of climate change challenges in Africa. Sci. Total Environ. 630, 34, 2241–2257. doi: 10.1002/joc.3834
728–737. doi: 10.1016/j.scitotenv.2018.02.196 Gbode, I. E., Adeyeri, O. E., Menang, K. P., Intsiful, J. D., Ajayi, V. O., Omotosho,
Batté, L., Ardilouze, C., and Déqué, M. (2018). Forecasting West African heat J. A., et al. (2019). Observed changes in climate extremes in Nigeria. Meteorol.
waves at subseasonal and seasonal time scales. Mon. Weather Rev. 146, 889–907. Appl. 26, 642–654. doi: 10.1002/met.1791
doi: 10.1175/MWR-D-17-0211.1 Hirons, L. C., Thompson, E., Dione, C., Indasi, V. S., Kilavi, M., Nkiaka, E., et al.
Carter, S., Steynor, A., Waagsaether, K., Vincent, K., and Visman, E. (2019). Co- (2021). Using co-production to improve the appropriate use of sub-seasonal
Production of African Weather and Climate Services. Manual, Cape Town: forecasts in Africa. Climate Serv.
Future Climate for Africa and Weather and Climate Information Services IPCC (Inter-governmental Panel on Climate Change). (2014). Climate Change
for Africa. Available online at: https://futureclimateafrica.org/coproduction- 2014: Synthesis report and summary for policymakers, Intergovernmental Panel
manual (accessed on April 27, 2021). on Climate Change. Available online at: http://www.ipcc.ch/pdf/assessment-
Collier, B., Skees, J., and Barnett, B. (2009). Weather index insurance and climate report/ar5/syr/AR5_SYR_FINAL_SPM.pdf (accessed on January 6, 2021)
change: opportunities and challenges in lower income countries. Geneva Papers Kasei, R., Diekkrüger, B., and Leemhuis, C. (2010). Drought frequency in the
34, 401–424. doi: 10.1057/gpp.2009.11 Volta Basin of West Africa. Sustain. Sci. 5, 89–97. doi: 10.1007/s11625-009-
de Andrade, F. M., Young, M. P., MacLeod, D., Hirons, L. C., Woolnough, 0101-5
S. J., and Black, E. (2021). Sub-seasonal precipitation prediction for Africa: Klutse, N. A. B., Aboagye-Antwi, F., Owusu, K., and Ntiamoa-Baidu, Y.
forecast evaluation and sources of predictability. Weather Forecast. 36, 265–284. (2014). Assessment of patterns of climate variables and malaria cases in two
doi: 10.1175/WAF-D-20-0054.1 ecological zones of Ghana. Open J. Ecol. 4, 764–775. doi: 10.4236/oje.2014.4
Dike, V. N., Addi, M., Andang’o, H. A., Attig, B. F., Barimalala, R., Diasso, U. 12065
J., et al. (2018). Obstacles facing Africa’s young climate scientists. Nat. Clim. Klutse, N. A. B., Ajayi, V. O., Gbobaniyi, E. O., Egbebiyi, T. S., Kouadio,
Change 8, 447–449. doi: 10.1038/s41558-018-0178-x K., Nkrumah, F., et al. (2018). Potential impact of 1.5◦ C and 2◦ C
FAO (Food and Agricultural Organization of the United Nations). (2016). warming on extreme rainfall over West Africa. Environ. Res. Lett. 13:055013.
Strengthening agricultural water efficiency and productivity on the African and doi: 10.1088/1748-9326/aab37b
Frontiers in Climate | www.frontiersin.org 11 September 2021 | Volume 3 | Article 712502Lawal et al. Examining S2S Forecasts in Nigeria
Lawal, K. A., Abiodun, B. J., Stone, D. A., Olaniyan, E., and Wehner, M. F. meteorological satellite data. Ann. Trop. Med. Parasitol. 90, 225–241.
(2019). Capability of CAM5.1 in simulating maximum air temperature anomaly doi: 10.1080/00034983.1996.11813049
patterns over West Africa during boreal spring. Model. Earth Syst. Environ. 5, Roudier, P., Ducharne, A., and Feyen, L. (2014). Climate change impacts on
1815–1838. doi: 10.1007/s40808-019-00639-2 runoff inWest Africa: a review. Hydrol. Earth Syst. Sci. 18, 2789–2801.
Lemos, M. C., Arnott, J. C., Ardoin, N. M., Baja, K., Bednarek, A. T., Dewulf, A., doi: 10.5194/hess-18-2789-2014
et al. (2018). To co-produce or not to co-produce. Nat. Sustain., 1, 722–724. Sachs, J., and Malaney, P. (2002). The economic and social burden of malaria.
doi: 10.1038/s41893-018-0191-0 Nature 415, 680–685. doi: 10.1038/415680a
Lim, Y.-H., Park, M.-S., Kim, Y., Kim, H., and Hong, Y.-C. (2015). Effects of cold Skok, G., and Roberts, N. (2016). Analysis of Fractions Skill Score properties for
and hot temperature on dehydration: a mechanism of cardiovascular burden. random precipitation fields and ECMWF forecasts. Q. J. R. Meteorol. Soc. 142,
Int. J. Biometeorol. 59, 1035–1043. doi: 10.1007/s00484-014-0917-2 2599–2610. doi: 10.1002/qj.2849
Luo, L., Apps, D., Arcand, S., Xu, H., Pan, M., and Hoerling, M. (2017). Sylla, M. B., Faye, A., Giorgi, F., Diedhiou, A., and Kunstmann, H. (2018).
Contribution of temperature and precipitation anomalies to the Projected heat stress under 1.5◦ C and 2◦ C global warming scenarios creates
California drought during 2012–2015. Geophys. Res. Lett. 44, 3184–3192. unprecedented discomfort for humans in West Africa. Earth’s Future 6,
doi: 10.1002/2016GL072027 1029–1044. doi: 10.1029/2018EF000873
Marais, E., Jacob, D., Wecht, K., Lerot, C., Zhang, L., Yu, K., et al. (2014). Thornton, S. N. (2010). Thirst and hydration: physiology and consequences of
Anthropogenic emissions in Nigeria and implications for atmospheric dysfunction. Physiol. Behav. 100, 15–21. doi: 10.1016/j.physbeh.2010.02.026
ozone pollution: a view from space. Atmos. Environ. 99, 32–40. Tompkins, A. M., and Feudale, L. (2010). West Africa monsoon seasonal
doi: 10.1016/j.atmosenv.2014.09.055 precipitation forecasts in ECMWF System 3 with a focus on the AMMA SOP.
Mera, R., Laing, A. G., and Semazzi, F. (2014). Moisture variability and multiscale J. Apll. Meteor. Climatol. 25, 768–788. doi: 10.1175/2009WAF2222236.1
interactions during spring in West Africa. Mon. Weather Rev. 142, 3178–3198. Vellinga, M., Arribas, A., and Graham, R. (2013). Seasonal forecasts for
doi: 10.1175/MWR-D-13-00175.1 regional onset of the West African monsoon. Clim. Dyn. 40, 3047–3070.
Molesworth, A. M. (2003). Environmental risk and meningitis epidemics in Africa. doi: 10.1007/s00382-012-1520-z
Res. Emerg. Infect. Dis. 9, 1287–1293. doi: 10.3201/eid0910.030182 Vitart, F., Ardilouze, C., Bonet, A., Brookshaw, A., Chen, M., Codorean, C., et al.
Monerie, P. A., Sanchez-Gomez, E., Pohl, B., Robson, J., and Dong, B. (2017). (2017). The sub-seasonal to seasonal (S2S) prediction project database. BAMS
Impact of internal variability on projections of Sahel precipitation change. 98, 163–173. doi: 10.1175/BAMS-D-16-0017.1
Environ. Res. Lett. 12:14003. doi: 10.1088/1748-9326/aa8cda Vitart, F., Robertson, A. W., and Anderson, D. T. (2012). Sub-seasonal to Seasonal
Nkiaka, E., Taylor, A., Dougill, A., Antwi-Agyei, P., Fournier, N., Bosire, E., Prediction Project: bridging the gap between weather and climate. WMO Bull.
et al. (2019). Identifying user needs for weather and climate services to 61, 23–28.
enhance resilience to climate shocks in sub-Saharan Africa. Environ. Res. Lett. Zaveri, E., Russ, J., and Damania, R. (2020). Rainfall anomalies are a significant
14:123003. doi: 10.1088/1748-9326/ab4dfe driver of cropland expansion. Proc. Natl. Acad. Sci. 117, 10225–10233.
Nkiaka, E., Taylor, A., Dougill, A. J., Antwi-Agyei, P., Adefisan, E. A., Ahiataku, M. doi: 10.1073/pnas.1910719117
A., et al. (2020). Exploring the need for developing impact-based forecasting in Zhao, C., Liu, B., Piao, S., Wang, X., Lobell, D. B., Huang, Y., et al. (2017).
West Africa. Front. Clim. 2:565500. doi: 10.3389/fclim.2020.565500 Temperature increase reduces global yields of major crops in four independent
Oguntunde, P. G., Lischeid, G., Abiodun, B. J., and Dietrich, O. (2014). estimates. Proc. Natl. Acad. Sci. 114, 9326–9331. doi: 10.1073/pnas.1701762114
Analysis of spatial and temporal patterns in onset, cessation and Zougmoré, R., Partey, S., Ouédraogo, M., Omitoyin, B., Thomas, T. S., Ayantunde,
length of growing season in Nigeria. Agric. For. Meteorol. 194, 77–87. A., et al. (2016). Toward climate-smart agriculture in West Africa: a review
doi: 10.1016/j.agrformet.2014.03.017 of climate change impacts, adaptation strategies and policy developments for
Olaniyan, E., Adefisan, E. A., Balogun, A. A., and Lawal, K. A. (2019). the livestock, fishery and crop production sectors. Agric. Food Secur. 5:26.
The influence of global climate drivers on monsoon onset variability doi: 10.1186/s40066-016-0075-3
in Nigeria using S2S models. Model. Earth Syst. Environ. 5, 1405–1428.
doi: 10.1007/s40808-019-00606-x Conflict of Interest: The authors declare that the research was conducted in the
Olaniyan, E., Adefisan, E. A., Oni, F., Afiesimama, E., Balogun, A., and Lawal, K. absence of any commercial or financial relationships that could be construed as a
A. (2018). Evaluation of the ECMWF sub-seasonal to seasonal precipitation potential conflict of interest.
forecasts during the peak of West Africa monsoon in Nigeria. Front. Environ.
Sci. 6:4. doi: 10.3389/fenvs.2018.00004 Publisher’s Note: All claims expressed in this article are solely those of the authors
Omotosho, J. B., and Abiodun, B. J. (2007). A numerical study of moisture build-up and do not necessarily represent those of their affiliated organizations, or those of
and rainfall over West Africa. Meteorol. Appl. 14, 209–225. doi: 10.1002/met.11
the publisher, the editors and the reviewers. Any product that may be evaluated in
Ragatoa, D. S., Ogunjobi, K. O., Okhimamhe, A. A., Browne-Klutse, N. A., and
this article, or claim that may be made by its manufacturer, is not guaranteed or
Lamptey, B. (2018). A predictive study of heat wave characteristics and their
spatiotemporal trends in climatic zones of Nigeria. Model. Earth Syst. Environ. endorsed by the publisher.
4, 1125–1151. doi: 10.1007/s40808-018-0480-7
Ralph, F. M., Intrieri, J., Andra, D. Jr., Atlas, R., Boukabara, S., Bright, Copyright © 2021 Lawal, Olaniyan, Ishiyaku, Hirons, Thompson, Talib, Boult,
S., et al. (2013). The emergence of weather-related test beds linking Ogungbenro, Gbode, Ajayi, Okogbue, Adefisan, Indasi, Youds, Nkiaka, Stone,
research and forecasting operations. Bull. Am. Meteorol. Soc., 94, 1187–1211. Nzekwu, Folorunso, Oyedepo, New and Woolnough. This is an open-access article
doi: 10.1175/BAMS-D-12-00080.1 distributed under the terms of the Creative Commons Attribution License (CC BY).
Roberts, A. J., Fletcher, J. K., Groves, J., Marsham, J. H., Parker, D. J., Blyth, A. M., The use, distribution or reproduction in other forums is permitted, provided the
et al. (2021). Nowcasting for Africa: advances, potential and value. Weather 99. original author(s) and the copyright owner(s) are credited and that the original
doi: 10.1002/wea.3936 publication in this journal is cited, in accordance with accepted academic practice.
Rogers, D. J., Hay, S. I., and Packer, M. J. (1996). Predicting the distribution No use, distribution or reproduction is permitted which does not comply with these
of tsetse flies in West Africa using temporal Fourier processed terms.
Frontiers in Climate | www.frontiersin.org 12 September 2021 | Volume 3 | Article 712502You can also read