TAMSAT-ALERT v1: a new framework for agricultural decision support - GMD
←
→
Page content transcription
If your browser does not render page correctly, please read the page content below
Geosci. Model Dev., 11, 2353–2371, 2018
https://doi.org/10.5194/gmd-11-2353-2018
© Author(s) 2018. This work is distributed under
the Creative Commons Attribution 4.0 License.

TAMSAT-ALERT v1: a new framework for agricultural
decision support
Dagmawi Asfaw1 , Emily Black1 , Matthew Brown2 , Kathryn Jane Nicklin3 , Frederick Otu-Larbi4 , Ewan Pinnington1 ,
Andrew Challinor3 , Ross Maidment1 , and Tristan Quaife1
1 Department  of Meteorology, University of Reading, Reading, UK
2 Department  of Atmospheric, Oceanic and Planetary Physics, University of Oxford, Oxford, UK
3 School of Earth and Environment, University of Leeds, Leeds, UK
4 Ghana Meteorological Agency, Accra, Ghana

Correspondence: Dagmawi Asfaw (d.t.asfaw@pgr.reading.ac.uk)

Received: 19 December 2017 – Discussion started: 6 February 2018
Revised: 28 May 2018 – Accepted: 8 June 2018 – Published: 19 June 2018

Abstract. Early warning of weather-related hazards en-            sessed. A secondary application of TAMSAT-ALERT is thus
ables farmers, policy makers and aid agencies to mitigate         an evaluation of the usefulness of meteorological forecast
their exposure to risk. We present a new operational frame-       products for impact assessment. Here, we show that in north-
work, Tropical Applications of Meteorology using SATellite        ern Ghana (Tamale), the tercile seasonal forecasts of seasonal
data and ground based measurements-AgricuLtural EaRly             cumulative rainfall and mean temperature, which are rou-
warning sysTem (TAMSAT-ALERT), which aims to pro-                 tinely issued to farmers, are of limited value because regional
vide early warning for meteorological risk to agriculture.        and seasonal temperature and rainfall are poorly correlated
TAMSAT-ALERT combines information on land-surface                 with yield. This finding speaks to the pressing need for me-
properties, seasonal forecasts and historical weather to quan-    teorological forecast products that are tailored for individual
titatively assess the likelihood of adverse weather-related       user applications.
outcomes, such as low yield. This article describes the mod-
ular TAMSAT-ALERT framework and demonstrates its ap-
plication to risk assessment for low maize yield in northern
Ghana (Tamale). The modular design of TAMSAT-ALERT
                                                                  1   Introduction
enables it to accommodate any impact or land-surface model
driven with meteorological data. The implementation de-
                                                                  Many African people depend on rain-fed agriculture and are
scribed here uses the well-established General Large Area
                                                                  thus vulnerable to drought and other weather-related hazards
Model (GLAM) for annual crops to provide probabilistic as-
                                                                  exacerbated by climate change (Muller et al., 2011). Antic-
sessments of the meteorological hazard for maize yield in
                                                                  ipation of hazard enables farmers and aid agencies to plan
northern Ghana (Tamale) throughout the growing season.
                                                                  ahead, averting disaster (Boyd et al., 2013). Here, we present
The results show that climatic risk to yield is poorly con-
                                                                  a new framework for early warning of high meteorological
strained in the beginning of the season, but as the season pro-
                                                                  risk to agriculture, the Tropical Applications of Meteorol-
gresses, the uncertainty is rapidly reduced. Based on the as-
                                                                  ogy using SATellite data and ground based measurements-
sessment for the period 2002–2011, we show that TAMSAT-
                                                                  AgricuLtural EaRly warning sysTem (TAMSAT-ALERT).
ALERT can estimate the meteorological risk on maize yield
                                                                  TAMSAT-ALERT integrates an assessment of climatological
6 to 8 weeks in advance of harvest. The TAMSAT-ALERT
                                                                  weather-related risk with forecasts and real-time monitoring
methodology implicitly weights forecast and observational
                                                                  of environmental conditions. The framework is intended to
inputs according to their relevance to the metric being as-
                                                                  be a decision support system, which when combined with

Published by Copernicus Publications on behalf of the European Geosciences Union.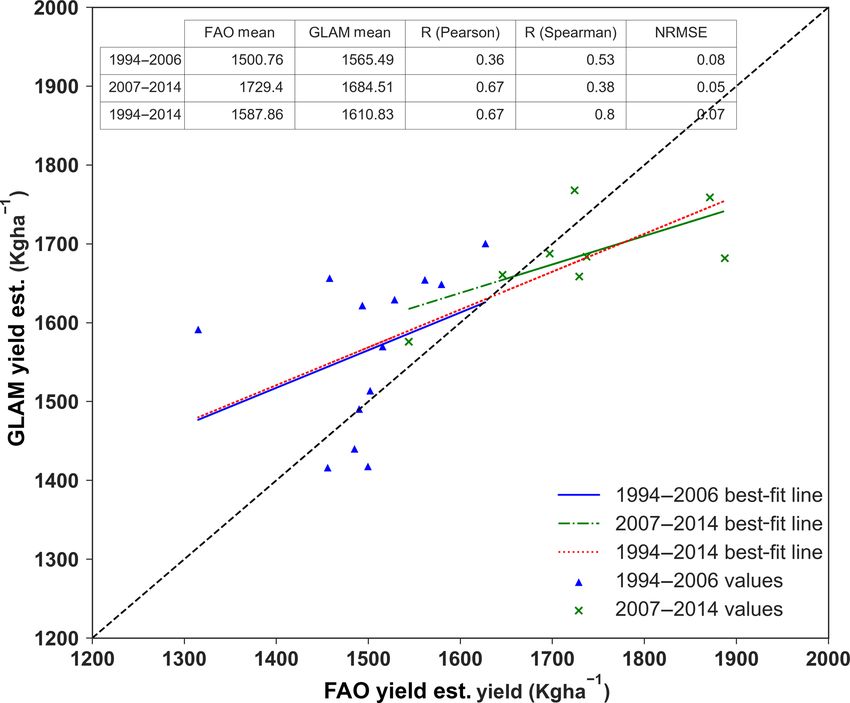
2354                             D. Asfaw et al.: TAMSAT-ALERT v1: a new framework for agricultural decision support

socioeconomic assessments, can be used by governmental              crop models have mainly focused on issuing predictions in
agencies and NGOs to help farmers manage agricultural risk.         advance of sowing. A weather generator approach to provid-
   The need for timely information on agricultural risk             ing continually updated assessments was, however, success-
has motivated the development of a number of drought                fully demonstrated for UK winter wheat yield (Bannayan et
early warning systems and decision support platforms. The           al., 2003), indicating the potential of this type of approach
Rainwatch-AfClix early warning system (RWX; http://www.             for operational risk assessment.
rainwatch-africa.org/rainwatch/, last access: June 2018), for          TAMSAT-ALERT complements existing systems by pro-
example, provides time series of cumulative rainfall, which         viding a means of continually updating yield predictions
are compared against historical time years. Users value the         as the season progresses, in a manner similar to that pro-
facility to compare the current season against past years, find-    posed in Hansen et al. (2006) for characterizing the simu-
ing that it enables them to intuitively gauge risk (Tarhule         lated uncertainty in yield resulting from climatic variabil-
et al., 2009). The severity of drought, however, depends not        ity. The TAMSAT-ALERT methodological approach com-
only on rainfall. It is furthermore not straightforward to trans-   bines the use of historical information, as encapsulated in the
late information on meteorological drought (deficit rainfall)       RWX methodology, with a land-surface or impact model, as
into warning of agricultural drought (deficit soil moisture;        demonstrated in the Africa Drought and Flood Monitor. The
Black et al., 2016). The need to consider a range of variables      system can output any variable or metric that can be gener-
and to compare data from a variety of sources is addressed          ated by the land-surface or impact model. The impact model
by more comprehensive platforms, such as the Famine                 output and the weather risk associated with the output that
Early Warning Systems Network Early Warning Explorer                can be obtained from TAMSAT-ALERT can be used by gov-
(FEWSNET-EWX; https://earlywarning.usgs.gov/fews/ewx/               ernmental and nongovernmental organizations involved with
index.html, last access: June 2018) and International Re-           providing farming information and aid, as well as by weather
search Institute (IRI) data library and map rooms (http:            index insurance providers, who require continuously updated
//iridl.ldeo.columbia.edu/index.html?Set-Language=en, last          assessment of the risk.
access: June 2018), which enable users to compare me-                  In this study, TAMSAT-ALERT is demonstrated through
teorological data with land-surface remote sensing prod-            continually updated seasonal assessments of the meteorolog-
ucts, such as the normalized difference vegetation index            ical risk to agriculture for Ghana. Although an application of
(NDVI) and soil moisture. Such platforms are aimed at               TAMSAT-ALERT has been described elsewhere (Brown et
expert users capable of interpreting complex, multivari-            al., 2017), this paper is the first formal description and val-
ate data. An alternative approach is to use a land-surface          idation of the methodological approach. Section 2 describes
model driven with meteorological time series to derive snap-        the design of the framework and gives brief notes about its
shots and forecasts of soil moisture. The Africa Flood              implementation. Section 3 describes the implementation of
and Drought Monitor (AFDM; http://stream.princeton.edu/             the framework for the assessment of meteorological risk to
AWCM/WEBPAGE/interface.php, last access: June 2018),                yield in Ghana. The paper concludes with a discussion of
for example, estimates soil moisture using a land-surface           the place that TAMSAT-ALERT has in early warning sys-
model. The model is driven with satellite data for monitoring       tems of meteorological hazards and wider decision-making
current conditions with bias-corrected, downscaled forecasts        processes (Sect. 4). A user manual for TAMSAT-ALERT is
for predicting future conditions (Sheffield et al., 2014). The      included as a Supplement, and all of the TAMSAT-ALERT
Africa Flood and Drought Monitor is implemented continent           scripts are freely available on GitHub.
wide, with the aim of monitoring and forecasting metrics re-
lated to drought and flood (soil moisture and streamflow).
The AFDM does not, however, attempt to predict crop yield           2     Framework concept and design
at particular localities. There have been several attempts to
                                                                    2.1    Concept
forecast yield using crop models driven by seasonal fore-
casts (Hansen and Indeje, 2004; Semenov and Doblas-Reyes,           The TAMSAT-ALERT framework provides a means of de-
2007). Mismatches between the scales of the input agro-             riving quantitative agricultural risk assessments from infor-
nomic and climate data and the lack of skill of the seasonal        mation on the climatology, historical time series and (op-
forecasts proved challenging for these early systems (Hansen        tionally) meteorological forecasts. In essence, the system ad-
and Indeje, 2004). In the last few years there have, how-           dresses this question:
ever, been marked improvements in the skill of sub-seasonal
to seasonal forecasts, leading to greater success for fore-                Given the climatology, the state of the land surface,
casting yield, even in the extratropics where predictability               the evolution of the growing season so far, and (op-
is low. A recent study, for example, demonstrated signifi-                 tionally) the meteorological forecast, what is the
cant skill for predicting wheat yield in France using a wheat              risk of some adverse event?
growing model driven with seasonal forecasts (Canal et al.,            The “adverse event” is any metric that can be derived
2017). Previous operational attempts to predict yield using         either directly from meteorological data or using a model

Geosci. Model Dev., 11, 2353–2371, 2018                                                www.geosci-model-dev.net/11/2353/2018/
D. Asfaw et al.: TAMSAT-ALERT v1: a new framework for agricultural decision support 2355
driven with meteorological data. TAMSAT-ALERT is de- conditions. Finally, skillful meteorological forecasts provide
signed to be modular and flexible, enabling users to choose direct information on the likelihood of adverse weather con-
models and datasets to suit their application. So far it has ditions in the remainder of the season. The relative impor-
been applied to risk assessments of agricultural drought using tance of these sources depends on the metric being predicted,
the Joint UK Land Environment Simulator (JULES) model along with the local climate and land-surface conditions. The
(Brown et al., 2017) and to risk assessments of low yield us- effect of forecast information depends both on the precision
ing the General Large Area Model (GLAM) for annual crops of the forecast and the relevance of the meteorological fore-
(Sect. 3.2.2). In addition, code is supplied for the assessment cast metric for the metric of hazard assessed by TAMSAT-
of purely meteorological metrics, such as cumulative rainfall ALERT.
(Supplement – User Guide).
At a given location and for a given season, the likelihood 2.2 Model implementation
of an adverse event may depend on past and future weather.
Midway through the growing season, for example, the like- The TAMSAT-ALERT framework is illustrated in Fig. 1. The
lihood of low yield depends both on weather in the past and user provides a time series of driving data, which is long
on the likelihood of unfavorable conditions in the coming enough to generate a statistically meaningful ensemble and
weeks. In TAMSAT-ALERT, past weather is based on ob- climatology. The driving meteorological data are used in sev-
servations, and future weather is based on the climatology. eral ways: to generate an ensemble of predictions; to assess
Thus, a 30-year climatology generates a 30-member ensem- the progress of the period of interest so far and to derive ini-
ble of possible yields based on 30 possible weather futures, tial conditions for the future period (if required for the en-
each of which can be driven through a crop model and used semble predictions); and to generate a climatology against
to derive a possible yield. Statistical comparison between which the forecast ensemble can be compared. Once the cli-
the forecast ensemble yield and the climatological ensemble matology and ensemble have been produced, meteorological
yield leads to quantitative assessments of the risk of unfavor- forecast information is optionally introduced to weight the
able conditions. ensemble members. The system is modular and thus easily
In its default setup, for which meteorological forecast adapted for different impact models, metrics of risk and me-
information is not included, TAMSAT-ALERT treats all teorological forecasts.
weather futures as equally likely. The risk assessments can, The steps for deriving probabilistic assessments of the risk
however, be refined by weighting the ensemble members of some adverse event on a particular day (the day in ques-
based on probabilistic forecast information, for example ter- tion) can be summarized as follows.
cile forecasts of cumulative rainfall or mean temperature cu-
1. The user prepares a file containing historical time se-
mulated and averaged over a 90-day period. Specifically, the
ries of driving data, along with any other parameter
value of the metric being forecasted for each ensemble is
files (e.g., agronomic or soil parameters). These should
used to assign that ensemble member to a particular tercile.
extend at least until the day in question. Note that
Each ensemble member is then weighted by the appropriate
TAMSAT-ALERT v1.0 only supports daily input. Sup-
tercile probability (see Sect. 2.2 for further explanation). If
port for higher- or lower-resolution data will be intro-
there is a weak link between the metric being forecast (for ex-
duced in future versions of the framework.
ample, regional seasonal rainfall) and the risk being assessed
(for example, local low yield), then the forecast will have lit- 2. The user converts the long daily time series of driving
tle impact on the risk assessments. Conversely, if the link is data into the appropriate format for their impact model
strong, skillful forecasts can significantly reduce the uncer- and carries out a historical run in order to derive an
tainty in the risk assessments. TAMSAT-ALERT is thus both annual historical time series of their chosen risk met-
a method for downscaling and bias-correcting meteorologi- ric. This enables a baseline assessment of climatologi-
cal input into impact models and a method for accounting for cal risk. The risk metric time series should be presented
mismatch between forecast variables and metrics of risk. as an annual time series of the form hyeari hdatai. Here,
There are several sources of potential predictive power we will call this time series file “historical_metric.txt”.
in TAMSAT-ALERT. Firstly, as the season progresses, the
amount of observational information included in the fore- 3. For the probabilistic risk assessments, the impact model
cast increases, and the range of possible outcomes is thus is driven with an ensemble of meteorological forcing
reduced. Secondly, the antecedent state of the land surface data generated by TAMSAT-ALERT. As described ear-
(especially root zone soil moisture) has a significant effect lier, the period of interest might contain both the past
on the likelihood of drought and hence low yield (Brown et and the future.
al., 2017). Thirdly, local information on the climatology de-
termines the likelihood that meteorological conditions will a. For the past, the meteorological driving data for en-
be sufficiently favorable during the remainder of the season semble member includes identical time series taken
to offset less favorable past meteorological and land-surface from observations.
www.geosci-model-dev.net/11/2353/2018/ Geosci. Model Dev., 11, 2353–2371, 20182356 D. Asfaw et al.: TAMSAT-ALERT v1: a new framework for agricultural decision support
Figure 1. Conceptual overview of the TAMSAT-ALERT system. The blue boxes represent input data sources, the orange boxes represent the
processes involved in the system and the green boxes show the outputs from TAMSAT-ALERT system.
b. For the future, the meteorological driving data for their impact model. The user then carries out the ensem-
each ensemble member is based on the historical ble prediction runs, outputting the time series of driving
climatology. Specifically, for a given day of year data through the impact model and outputting the user-
(DoY), the driving data are taken for that DoY for defined metric over whatever period is relevant for that
a year in the past. To maintain the daily weather metric. Because of the nature of the TAMSAT-ALERT
statistics and the consistency between variables, method, each ensemble member is associated with the
each ensemble member is based on a particular past year for which the possible weather future was derived
year. Thus, ensemble member x is based entirely on (see above). The output can thus be presented in a sin-
year y. gle file with two columns, hyeari hdatai, for file name
ensemble_metric.txt.
To accomplish this, the system converts the daily time
series of driving data into multiple files, each contain- 4. The risk assessment is derived by comparing the mean
ing driving data for one ensemble member. The user is and standard deviation of the climatological baseline
allowed to set the period over which the ensemble sys- distribution (historical_metric.txt derived in point 2)
tem will be run. This is distinct from the period over with the mean and standard deviation ensemble distribu-
which the metric is calculated (the metric period). The tion (ensemble_metric.txt derived in point 3). Note that
metric period is the period on which the weighting will an alternative approach employing an empirical cumu-
be done, and the probabilistic risk is calculated. For ex- lative distribution function can be specified by the user.
ample, if one wants to estimate the metrological risk on The empirical cumulative distribution function (ECDF)
available soil moisture the ensembles can be run for a approach is suitable for non-Gaussian variables but can
much longer period to allow the spin-up of the model result in noisy predictions if the ensemble is relatively
to equilibrium values for the initial condition required, small.
but the main interest for the user might be the first 90 At this point, meteorological forecast data are incorpo-
days. Hence, the length of the metric period is only the rated (if available).
first 90 days and all risk analysis is done on this met-
ric period. The period over which the ensemble will a. An annual historical time series of the metric be-
be run should include sufficient time before the met- ing forecast (e.g., cumulative June–August rain-
ric period to allow for spin-up. The user makes any fall) is provided by the user for file name weight-
format changes necessary to convert these TAMSAT- ing_metric.txt, which is of the form hyeari hdatai.
ALERT driving data files into driving data specific to The data series should be provided for the years
Geosci. Model Dev., 11, 2353–2371, 2018 www.geosci-model-dev.net/11/2353/2018/D. Asfaw et al.: TAMSAT-ALERT v1: a new framework for agricultural decision support 2357
used to generate the weather future aspect of the vest in Ghana. The first and second part of the case study de-
ensemble (i.e., ensemble_metric.txt as described in scribe the study area and the implementation and evaluation
3b). The TAMSAT-ALERT v1.0 release includes a of a mechanistic crop model, GLAM. The third part demon-
utility function for extracting forecast metrics from strates the implementation of GLAM as part of the TAMSAT-
the historical driving meteorological data file sup- ALERT system for continually updated risk assessments.
plied by the user.
b. The annual time series of forecast metric is then 3.1 Study area
ranked. Based on this ranking, each historical year
is assigned to a forecast category. In the case of ter- Ghana is located on the southern coast of West Africa be-
ciles, for example, the bottom third is assigned to tween latitudes 4◦ 440 and 11◦ 110 N and longitudes 3◦ 110 W
tercile 1, the middle third to tercile 2 and the top and 1◦ 110 E. Rain-fed agricultural systems are the major
third to tercile 3. component of the Ghanaian economy, accounting for 30 %
of the GDP and employing half of the labor force (PARI,
c. As was noted in 3b, each ensemble member
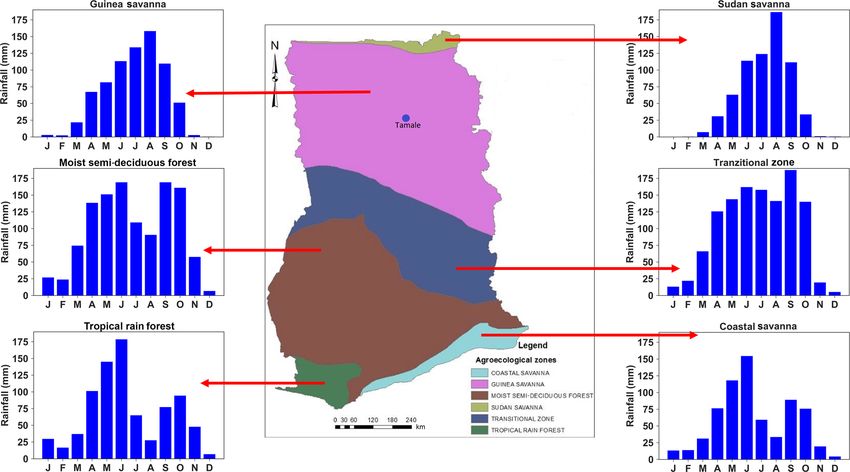
2015). The country is divided into six agroecological zones,
is associated with a historical year and ensem-
each with a distinct rainfall pattern (Fig. 2). The northern part
ble_metric.txt is presented in the form hyeari
is dominated by Guinea savanna with average annual rainfall
hdatai. Each data point in this file can thus be as-
of 1000–1100 mm from one rainy season spanning May to
sociated with a quantile category using the year as-
September, while in the southern part, moist semi-deciduous
signments described in 4b.
agroecology dominates, with an average annual rainfall of
d. When calculating the mean and standard deviation, 1500 mm falling within two rainfall seasons (Owusu and
the ensemble is weighted by the user-supplied cate- Waylen, 2009, 2013). Most of the cereal crops (primarily
gorical forecast probabilities, which are assigned to sorghum, millet and maize) are produced in the northern part
each member during 4c. of Ghana (Martey et al., 2014). Table 1 shows the six agroe-
The TAMSAT-ALERT code is written in Python. All code cological zones with the average annual rainfall and major
and documentation (including a user manual) for TAMSAT- crops grown in the agroecological zones.
ALERT have been released on GitHub (https://github.com/ Maize is one of the major crops produced in Ghana. The
tamsat-alert/v1-0, last access: June 2018). However, users production area and the amount of yield has been increas-
need to have their own working installations of their chosen ing since 1994 (Fig. 3). Figure 4 shows a time series of
impact model. The TAMSAT-ALERT v1.0 release consists maize yield in Ghana (expressed in kg ha−1 ). From 1994–
of scripts to 2006 there is no observed trend, but after 2007 there is a step
change in yield coinciding with the introduction of a new va-
– convert meteorological time series into driving data for riety by the Crop Research Institute (CRI) of the Council for
both the ensemble forecasts, Scientific and Industrial Research (CSIR) of Ghana in 2007
(Ragasa et al., 2013).
– calculate quintile predictions for user-defined risk met-
rics based on the input files historical_metric.txt, en-
semble_metric.txt and weighting_metric.txt, and 3.2 Data and methods
– produce a set of plots comparing the ensemble and cli- 3.2.1 Datasets used
matological distribution (see the user guide in the Sup-
plement). The driving weather datasets for the evaluation of the model
were daily time series extracted from the Watch Forcing Data
In the GitHub release, in addition to the general TAMSAT-
ERA-Interim (WFDEI; Weedon et al., 2014) for shortwave
ALERT framework scripts listed above, scripts are provided
radiation, maximum temperature, minimum temperature and
that set TAMSAT-ALERT up for (i) for the GLAM crop
rainfall. For the demonstration of the system at a point, the
model (the implementation demonstrated in Sect. 3 of this
driving data were based on daily, quality-controlled station
paper) and (ii) for assessments based purely on time means
data provided by the Ghana Meteorological Agency. The
and cumulations of meteorological variables. A test case is
station used is Tamale, which is located in northern Ghana
provided so that users can be assured that the system is work-
(9.41◦ N, 0.85◦ W; Fig. 2). Precipitation and maximum–
ing as expected.
minimum temperature were measured directly, and short-
wave radiation was derived from sunshine hours. We chose to
3 Demonstration of the system: a case study of maize use Tamale because it is in the northern part of Ghana (Fig. 2)
yield prediction in Ghana where most of the maize is grown. The station in Tamale also
has a long-term record of the driving data for the crop model.
This case study demonstrates the use of the TAMSAT- It should be noted that TAMSAT-ALERT can in principle
ALERT system for forecasting the risk of poor maize har- be run using any gridded meteorological data, like satellite
www.geosci-model-dev.net/11/2353/2018/ Geosci. Model Dev., 11, 2353–2371, 20182358 D. Asfaw et al.: TAMSAT-ALERT v1: a new framework for agricultural decision support
Figure 2. Agroecological zones of Ghana (source: Sidibe et al., 2016) and average seasonal rainfall pattern of each agroecological zone
based on TAMSAT rainfall estimates.
Table 1. Characteristics of agroecological zones in Ghana (source: http://www.fao.org/nr/water/aquastat/countries_regions/GHA/, last ac-
cess: June 2018).
Agroecological zone Rainfall Number of Major crops grown
(mm yr−1 ) seasons
Sudan savanna 1000 1 Millet, sorghum, maize
Guinea savanna 1100 1 Maize, sorghum
Transition zone 1300 1 Maize, roots, plantain
Moist semi-deciduous forest 1500 2 Roots, plantain
Costal savanna 800 2 Roots, maize
Rain forest 2200 2 Roots, plantain
rainfall estimates (e.g., TAMSAT (https://www.tamsat.org.
uk/data/rfe/index.cgi, last access: June 2018), with a resolu-
tion of 4 km (Maidment et al., 2017).
Tercile forecast data were downloaded from the publicly
available IRI regional forecasts (http://iri.columbia.edu/
our-expertise/climate/forecasts/seasonal-climate-forecasts/,
last access: June 2018). The IRI forecasts are based on
a hybrid dynamical–statistical method developed by the
U.S. National Oceanographic and Atmospheric Admin-
istration North American Multi-Model Ensemble Project
(NOAA-NMME; Kirtman et al., 2014). The seasonal
forecasts are issued at the beginning of each month for
precipitation and temperature at a global scale with a spatial
resolution of 2.5◦ for precipitation and 2◦ for temperature
Figure 3. Maize production area over Ghana from 1994 to 2014. (Barnston and Tippett, 2014). The IRI forecasts were chosen
for this analysis because of their wide use by African mete-
orological services and regional climate outlook forums. In
this study the seasonal forecast data were used in the form
Geosci. Model Dev., 11, 2353–2371, 2018 www.geosci-model-dev.net/11/2353/2018/D. Asfaw et al.: TAMSAT-ALERT v1: a new framework for agricultural decision support 2359
Figure 5. Time series of FAO yield (red line) and GLAM-simulated
Figure 4. Maize yield in Ghana 1994–2014. There are two separate yield (green line).
periods marked by the red lines during which we observe changes
in yield. For 1994–2006 there is no clear trend in the yield pro-
duced and for 2007–2014 there is a shift in the production in which vious studies have demonstrated that GLAM has skill in cap-
a higher yield is observed. turing the impact of weather on crops (Challinor et al., 2005,
2006). Such information enables users to translate time se-
ries of weather into a time series of yield estimates (Challi-
they are supplied to farmers, i.e., tercile probabilities of nor and Wheeler, 2008). GLAM has also been used to model
3-month cumulative rainfall and 3-month mean temperature weather and climate change impact on crop yield and adap-
at a regional level. tation strategies (Parkes et al., 2015; Ramirez-Villegas et al.,
In addition to meteorological time series, GLAM requires 2015a; Ramirez-Villegas and Challinor, 2016).
data on soil type and the agronomic properties of maize GLAM requires daily values of precipitation, shortwave
(Sect. 3.2.2). For this study, the soil texture was set to be radiation, maximum temperature and minimum temperature
sandy loam and the planting date was set to start from the as driving weather data with additional inputs of soil prop-
124th day of the year to the 154th day of the year, which erties and planting window (Watson and Challinor, 2013).
allows for a 30-day planting window. The maize agronomic GLAM accumulates the aboveground biomass, which is a
properties were taken from the published literature and are product of daily transpiration and a predetermined transpi-
presented in the Supplement (Table S1). ration efficiency value, within the growing season to deter-
GLAM was evaluated against national-level maize yield mine total biomass production, which is converted into yield
data released by the FAOSTAT (http://www.fao.org/faostat/, using a harvest index (Osborne et al., 2007). The planting
last access: June 2018; see Fig. 4). Although the FAO issues date is either prescribed by the user or determined using
guidance on the compilation of these datasets, in practice GLAM’s intelligent planting date system (the approach taken
there is little quality control and the data should be treated in this study). It is important to note that GLAM does not
with caution. account, in a process-based fashion, for non-meteorological
influences on crop growth, such as pests, diseases and fer-
3.2.2 The GLAM crop model tilizer use. Rather, these factors are encapsulated in the yield
gap parameter (YGP), which is determined by calibrating the
As described in Sect. 2.1, the TAMSAT-ALERT system can model yield with observed yield (Challinor et al., 2004). The
be used to assess any metric of risk that can be output by YGP is assigned a value between 0 and 1, where 1 represents
a model driven with meteorological data. In this study, the the potential yield given the weather conditions, soil texture
General Large Area Model (GLAM) for annual crops is used and crop development parameters (Challinor et al., 2005).
to simulate maize yield and subsequently to monitor the
probabilistic risk of poor harvest as the growing season pro- 3.2.3 GLAM evaluation
gresses.
GLAM is a process-based crop simulation model, which GLAM was used to simulate the yield from 1994 to 2014
incorporates sufficient processes to capture the impact of using the WFDEI as a driving dataset. The WFDEI has a
climate variability on crop yield (Challinor et al., 2004; 0.5◦ by 0.5◦ resolution and so GLAM was output at this
Ramirez-Villegas et al., 2015b). GLAM uses a limited num- resolution. The simulated yield at each grid point was then
ber of driving datasets and an intermediate complexity of weighted by the year 2000 season fraction of production area
crop development process representation. Nevertheless, pre- over each grid point to make a country average yield (Wee-
www.geosci-model-dev.net/11/2353/2018/ Geosci. Model Dev., 11, 2353–2371, 20182360 D. Asfaw et al.: TAMSAT-ALERT v1: a new framework for agricultural decision support
Figure 8. An example hindcast of maize yield using GLAM im-
plemented into the TAMSAT-ALERT system. Black dots represent
individual ensemble members and red lines are the climatology.
Figure 6. Scatter plot between FAO yield and GLAM-simulated
yield. The red dotted line is the best-fit line for the whole period
considered (1994–2014). The blue solid line shows the best-fit line The YGP was maintained at 0.4 for the whole simulation pe-
for the period 1994–2006. The green line shows the best-fit line for riod.
the period 2007–2014. The results of the simulated crop yield are presented in
Fig. 5 and the statistical values of the comparison are pre-
sented with the scatter plot in Fig. 6. GLAM was able to
maintain the overall mean yield and, and as a result the nor-
malized root mean square error (NRMSE) is very low (0.07).
The overall correlation value is found to be 0.67 (Pearson)
and the Spearman correlation, which is less affected by out-
liers, is 0.8. The difference in the Spearman and Pearson cor-
relation coefficients is mainly due to the severe overestima-
tion of 2001 season yield, probably resulting from a long dry
spell, the impact of which on farming practices was not fully
accounted for by GLAM (FAO/WFP-Global Information and
Early Warning System on food and agriculture, 2002). Some
of the correlation strength is due to capturing the change in
mean yield from the 1994–2006 to 2007–2014 period, and
this is done by changing the transpiration efficiency (TE)
value for the two periods. The strength of the correlation
Figure 7. Process flowchart for crop yield forecasting within the of yield suggests that the link between Ghana-wide weather
TAMSAT-ALERT system. The blue boxes represent input data and yield is moderate – an important consideration for policy
sources, the orange represents the processes involved in the system makers when they make use of information from TAMSAT-
and the green box shows the final probabilistic forecast for the crop ALERT. This is primarily due to the myriad of factors that
yield. can affect yield, including agronomic practice, pests and dis-
ease, and socioeconomic problems. Nevertheless, in vulner-
able regions, the meteorological risk to yield is, in itself, an
don et al., 2014; Monfreda et al., 2008). This country av- important consideration for agricultural agencies because ac-
erage yield was then compared with the FAO maize yield tion can be taken to mitigate the hazard. This might include
dataset for the same period. It is shown in Fig. 4 that maize subsidizing drought-resistant varieties or encouraging early
production can be split into two distinct periods: 1994–2006 planting and replanting.
and 2007–2014. Because of the reported changes in agro-
nomic practice and drought-tolerant maize variety introduc- 3.2.4 Incorporation of GLAM into TAMSAT-ALERT
tion through the drought-tolerant maize for Africa (DTMA)
project (Obeng-Antwi et al., 2013; Ragasa et al., 2013) the Figure 7 shows how GLAM has been incorporated into the
transpiration efficiency (TE) value was increased from 7.0 TAMSAT-ALERT system. As described in Sect. 2, time se-
for the period 1997–2006 to 8.0 for the period 2007–2014. ries of driving data based on historical observations are used
Geosci. Model Dev., 11, 2353–2371, 2018 www.geosci-model-dev.net/11/2353/2018/D. Asfaw et al.: TAMSAT-ALERT v1: a new framework for agricultural decision support 2361
Figure 9. Histograms of yield forecast for (a) 15 June 2011, (b) 15 July 2011, (c) 15 August 2011 and (d) 15 September 2011.
plementation of GLAM, a climatological period of 30 years
(1980–2009) was used for the yield forecast.
3.3 Case study results
3.3.1 Yield forecasting using GLAM: 2011 season
example
Figures 8, 9 and 10 illustrate the implementation of
TAMSAT-ALERT for the 2011 growing season, which na-
tionally was a low yield year compared to other post-2007
years (noting that we do not have yield data for Tamale).
The hindcasts were initiated every 5 days. GLAM infers that
planting occurred on 4 June and harvesting on 15 September
to 20 September. Figure 8 depicts all ensemble members in
Figure 10. Standard deviation of the yield estimate initiated on the
the context of the climatological spread in yield. Figure 9
dates displayed on the x axis.
shows histograms of ensemble members at monthly inter-
vals, starting 10 days after planting. Figure 10 shows a time
series of ensemble spread (standard deviation of ensemble
both to derive climatological yield and to generate an en- yield predictions).
semble of predicted yield. Individual planting dates are de- At the outset of the season, the yield estimates are derived
termined for each ensemble member using GLAM’s intelli- only from the meteorological climatology; no in-season ob-
gent planting date system, and the crop is harvested when servational data are incorporated. The spread is thus large
the growing degree-day requirement is fulfilled (Challinor (equivalent to the climatology). During the season, as in-
et al., 2004; Challinor and Wheeler, 2008). Because of the season data are incorporated by TAMSAT-ALERT, the mete-
way TAMSAT-ALERT is set up to incorporate observational orological time series driving GLAM become progressively
data continually as the season progresses, once the optimum more similar. As a result, the ensemble rapidly converges. In
planting time has passed for the year being hindcast, the this example, for instance, 2 months after planting, the en-
planting date for each ensemble member converges. Analo- semble standard deviation is 34 % of the climatology.
gously, once the harvest date for the hindcast year has passed The yield forecasts can be communicated with end users
in the observations, the harvest date, and indeed the predicted in a probabilistic form, with the ensemble expressed as quin-
yield, for each ensemble member is identical. In this im- tiles representing the following categories: above the 80th,
www.geosci-model-dev.net/11/2353/2018/ Geosci. Model Dev., 11, 2353–2371, 20182362 D. Asfaw et al.: TAMSAT-ALERT v1: a new framework for agricultural decision support
Figure 11. Probabilistic forecasts for maize yield in northern Ghana (Tamale) for five dates: (a) 4 June 2011, (b) 4 July 2011, (c) 4 Au-
gust 2011, (d) 4 September 2011 and (e) 4 October 2011. The planting date was 4 June 2011. In the first day of planting the impact of the
weather is not well indicated that the yield probabilities are spread more or less equally in all categories, but after 1 month on 4 July 2011
it is indicated that 62 % of the ensembles fall in the average and low categories. After 2 months on 4 August 2011, 76 % of the ensembles
indicate an average and low yield estimate compare to the climatological yield. A few days before harvest on 5 September 2011, 100 % of
the yield is estimated to be in the average and low quintile category.
60th–80th, 40th–60th, 20th–40th and below 20th percentile. It is evident from Fig. 11 that the ensemble mean tends to-
These categories can be equated to very high, high, average, wards average or low values, even 2 months ahead of the har-
low and very low yield, respectively. An example of such vest date during 2011, suggesting a degree of precision, even
quintile forecasts at monthly intervals during the 2011 grow- towards the beginning of the growing season. Section 3.3.3
ing season is shown in Fig. 11. Consistent with Figs. 8 and 9, presents a formal evaluation of skill for the 2002–2011 pe-
at the outset of the season, the categories are equally likely riod.
except the extreme categories, the difference in probability
coming from the change in planting date for some years in 3.3.2 Incorporation of meteorological forecasts
the climatological period considered (1980–2009). As the
season progresses, the average and low categories become
As described in Sect. 2.1, the TAMSAT-ALERT framework
more likely and the extreme categories (very high and very
can use probabilistic information from meteorological fore-
low) less likely.
casts to weight the yield forecast ensemble, providing a
Geosci. Model Dev., 11, 2353–2371, 2018 www.geosci-model-dev.net/11/2353/2018/D. Asfaw et al.: TAMSAT-ALERT v1: a new framework for agricultural decision support 2363
Table 2. IRI tercile seasonal forecast for the 2011 season.
Season Rainfall Temperature
Below normal Normal Above normal Below normal Normal Above normal
JJA 25 35 40 30 40 30
JAS 33.3 33.4 33.3 30 40 30
ASO 33.3 33.4 33.3 45 35 20
SON 33.3 33.4 33.3 33.3 33.4 33.3
means of incorporating forecast information into the decision ized June–July–August (JJA) tercile temperature forecasts to
support system. In this study, we consider tercile forecasts of weight the forecast on 4 June 2011, July–August–September
cumulative 90-day rainfall and mean 90-day temperature to (JAS) tercile temperature forecasts to weight the forecast on
reflect the information currently available to the Ghana Me- 4 July 2011, August–September–October (ASO) tercile tem-
teorological Agency. The forecasts are commonly issued at perature forecasts to weight the forecast on 4 August 2011
the start of every month. Hence, we have applied the fore- and September–October–November (SON) tercile tempera-
casts only to the meteorological season being forecasted with ture forecasts to weight the forecast on 4 September 2011.
the remaining season not included in the weighting estima- As with rainfall, the upper, middle and lower terciles are
tion. For example, for running TAMSAT-ALERT on 4 June, weighted [1,0,0] for a “perfect cold forecast”, [0,1,0] for a
the seasonal forecast of June–July–August is applied. To il- “perfect normal forecast” and [0,0,1] for a “perfect warm
lustrate the process of including forecasts, we continue with forecast”. Figure 13 shows the forecast for the 2011 cropping
the 2011 case study. We have used idealized tercile seasonal season with a perfect average temperature forecast. Due to a
forecasts for total June–July–August (JJA) precipitation to negative correlation of the average temperature with maize
weight the forecast on 4 June 2011, July–August–September yield, a warmer temperature forecast is associated with pre-
(JAS) precipitation to weight the forecast on 4 July 2011, dictions of lower yield. Comparison between Figs. 12 and 13
August–September–October (ASO) precipitation to weight suggests that temperature forecasts have a greater effect on
the forecast on 4 August 2011 and September–October– the risk assessments than rainfall forecasts.
November (SON) precipitation to weight the forecast on So far, only idealized forecasts have been considered. In
4 September 2011. the next section, we demonstrate the effect of using actual
To assess the potential value of tercile rainfall and temper- tercile forecast information issued by the International Re-
ature seasonal forecast information, we have weighted the search Institute (IRI) for rainfall and temperature. The sea-
ensemble as if the next 90 days of temperature and cumu- sonal forecasts from IRI for 2011 in northern Ghana are
lative rain are known (i.e., perfect forecast experiment). So, shown in Table 2.
we consider three probabilistic forecasts: tercile weightings Figure 14 shows the yield forecast probabilities based on
of [0,0,1] for the lower, middle and upper tercile, respectively weighting the yield ensembles by seasonal rainfall forecasts
(perfect wet forecast), [0,1,0] for the lower, middle and upper from IRI. Comparison with Fig. 11 suggests that the weight-
tercile, respectively (perfect normal forecast), and [1,0,0] for ing has little effect. Figure 15 shows the quintile yield pre-
the lower, middle and upper tercile, respectively (perfect dry dictions when temperature forecast weightings from IRI are
forecast). The ensemble was weighted by these perfect tercile applied. As with rainfall, comparison with Fig. 15 shows that
forecasts according to the actual total rainfall (perfect rainfall the weighting has little effect.
forecast) or the actual mean temperature (perfect tempera- The results are summarized in Fig. 16, which represents
ture forecast) that ensued in the next 90 days following each the probability of each yield pentile at different lead times
TAMSAT-ALERT hindcast. in the 2011 season yield forecast with no seasonal forecast,
Figure 12 shows the yield forecast probabilities when the precipitation forecast or temperature forecast applied. For
perfect rainfall forecast is used. When a perfect rainfall fore- all lead time periods indicated, weighting by IRI seasonal
cast is used to weight the ensemble, the probabilities of the forecast for the 2011 season showed no improvement in pre-
quintile forecast show more rapid convergence, especially dicting the final yield compared to the non-weighted values.
2 months into the season. The improvement is less noticeable This is not surprising because the relationship between the
in June and July, perhaps reflecting the fact that, at least in seasonal cumulative rainfall and seasonal mean temperature
the GLAM crop model, cumulative rainfall in this part of the with maize yield is very low (see Figs. S1 and S2 in the
season is comparatively less strongly correlated with yield. Supplement). The tercile weightings for the IRI forecast (Ta-
An alternative approach is to use temperature forecasts ble 2) are close to climatology, and the previous discussion
to weight the ensemble. To investigate the effect of tem- showed that even a perfect and precise seasonal forecast has
perature forecasts, the ensemble was weighted using ideal- relatively little impact.
www.geosci-model-dev.net/11/2353/2018/ Geosci. Model Dev., 11, 2353–2371, 20182364 D. Asfaw et al.: TAMSAT-ALERT v1: a new framework for agricultural decision support
Figure 12. Yield probability forecast for the year 2011 for five forecast dates, (a) 4 June, (b) 4 July, (c) 4 August, (d) 4 September and
(e) 4 October, when ensembles are weighted by a perfect tercile seasonal rainfall forecast.
In summary, Figs. 12 and 13 indicate that if meteorologi- ALERT skill are carried out in a “perfect model” frame-
cal forecasts have sufficient accuracy and precision, they can work, in which we attempt to forecast the yield simulated
add information to the decision-making process, especially by GLAM forced with observed weather data. It is impor-
in the middle to later part of the growing season. However, tant not to confuse these skill assessments with evaluation of
Figs. 14–16 show that the tercile forecasts currently issued in GLAM (Sect. 3.2.3), although the usefulness of the frame-
northern Ghana do not have sufficient precision information work depends to a large extent on the quality of the model
to yield risk assessments. A further application of TAMSAT- and data incorporated within it.
ALERT could be to investigate the level of skill that is re- Figure 17 shows GLAM hindcasts at four approximate
quired for meteorological forecasts to contribute useful in- lead times (i.e., ∼ 3, ∼ 2, ∼ 1, ∼ 0.5 months ahead of har-
formation to such decision-making processes. vest) for 5 years. Towards the outset of the season, the hind-
casts for each year are similar and close to the climatology,
3.3.3 Formal skill evaluation with the minor differences explained by variation in planting
date. For all the lead times considered the spread of the en-
The objective of TAMSAT-ALERT is to provide early warn- sembles is reduced as the season progresses. Only the years
ing of the meteorological risk to yield, which is not an ob- 2007–2012 are presented in Fig. 17 because the maize va-
servable quantity. For this reason, evaluations of TAMSAT- riety changed in 2007, making the hindcasts of these years
Geosci. Model Dev., 11, 2353–2371, 2018 www.geosci-model-dev.net/11/2353/2018/D. Asfaw et al.: TAMSAT-ALERT v1: a new framework for agricultural decision support 2365 Figure 13. Yield probability forecast for the year 2011 for five forecast dates, (a) 4 June, (b) 4 July, (c) 4 August, (d) 4 September and (e) 4 October, when ensembles are weighted by a perfect average temperature of seasonal forecast. more relevant to the present day than the 1994–2006 period unit value represents a perfect score and zero or below-zero (see Fig. S3). values indicate no skill in the forecast. As described in Sect. 3.3.1, the probabilistic ensemble The RPSSD for Tamale was derived for the period 2002– forecasts will be presented as the likelihood of quintile cat- 2011. This period is used because IRI seasonal forecasts egories. The skill of the probabilistic forecast was assessed for precipitation and temperature issued on a monthly basis using the ranked probability skill score (RPSS). The RPSS are only available from 2002. Figure 18 indicates the skill is a skill score formulated from the ranked probability score scores for the four lead times for the forecasts made using (RPS) that compares the cumulative squared probability er- the TAMSAT-ALERT system. The skill scores are generally ror for climatological forecasts in each category identified. above 0.4 for ∼ 2-month lead time and over 0.6 for ∼ 1- The RPSS is negatively biased with smaller ensemble sizes month lead time over the 10-year period considered. There (< 40) and due to this a correction was done on the refer- are some years in which the skill score was lower than the ence RPS used before calculating the final RPSS. The bias- stated values and this is mainly because of shifts in forecast corrected RPSS is called the discrete ranked probability skill categories towards the end of the season, which tends to hap- score (RPSSD ). Details on the calculation and bias-correction pen if the yield is near a category boundary. For example, the are given in Muller et al. (2005) and Weigel et al. (2007). 2011 final yield was in the low category, but 1 month ear- Positive values indicate better skill than the climatology; a lier than harvest the ensembles indicate 56 % in the average www.geosci-model-dev.net/11/2353/2018/ Geosci. Model Dev., 11, 2353–2371, 2018
2366                             D. Asfaw et al.: TAMSAT-ALERT v1: a new framework for agricultural decision support

Figure 14. Yield probability forecast for the year 2011 for five forecast dates, (a) 4 June, (b) 4 July, (c) 4 August, (d) 4 September and
(e) 4 October, when ensembles are weighted by IRI seasonal rainfall forecast.

category and 44 % in the low category (see Fig. 11), which             4   Discussion and conclusions
results in a low skill score for that year. The overall skill of
the system is presented in Fig. 19, which shows a good skill           The TAMSAT-ALERT framework complements and extends
even 2 months ahead of harvest. The average RPSSD shows                previous systems by driving impact models with ensembles
an increase in skill as the lead time decreases, which is ex-          based on observed weather rather than weather generators or
pected. Comparison of similar period skill scores for yield            direct forcing with seasonal forecasts. This provides a sim-
forecasted weighted by the IRI seasonal weather forecast of            ple means of combining information at different scales and
rainfall and temperature showed a similar result to that of the        bias-correcting seasonal forecasts. The framework is thus ca-
non-weighted forecast. This indicates that the seasonal fore-          pable of integrating multiple sources of environmental obser-
casts have little impact in predicting the maize yield in the          vations and forecasts into continually updated assessments of
region, which is associated with both the low correlation of           the likelihood of a user-defined adverse event, such as unfa-
seasonal weather values and maize yield and with the vague             vorable weather conditions for maize yield. While the em-
nature of the forecasts.                                               phasis of our study has been on forecasting adverse events,
                                                                       such as low yields, it should be noted that TAMSAT-ALERT
                                                                       is also capable of anticipating favorable conditions, enabling
                                                                       decision makers to maximize the benefits of such years, for

Geosci. Model Dev., 11, 2353–2371, 2018                                                   www.geosci-model-dev.net/11/2353/2018/
D. Asfaw et al.: TAMSAT-ALERT v1: a new framework for agricultural decision support 2367 Figure 15. Yield probability forecast for the year 2011 for five forecast dates, (a) 4 June, (b) 4 July, (c) 4 August, (d) 4 September and (e) 4 October, when ensembles are weighted by IRI seasonal forecast average temperature. example by managing post-harvest storage and markets. The teorological hazard to yield (Dzotsi et al., 2003; Kassie et system can, moreover, work at any spatial scale for which al., 2014, 2015; MacCarthy et al., 2017). The implementa- driving data are available, including for individual commu- tion of TAMSAT-ALERT described in this study quantifies nities. the meteorological risk to agriculture, and as such potentially The use of decision support tools for agricultural activities provides information for government, aid agencies and non- in Africa is low because of low capacity for model use, lack governmental organizations working in agriculture. A key re- of funding from governments in the development of agri- sult is that, even in the absence of meteorological seasonal cultural decision support tools, lack of data availability for forecasts, low yield can be anticipated 6–8 weeks before with the validation and calibration of models, and low knowledge some skill. among decision makers about the use of decision-making In the example described in this paper, we have used the tools (MacCarthy et al., 2018). Nevertheless, the demand for GLAM crop model. It is clear from the validation of GLAM meteorologically driven crop models, such as the Decision against national yield statistics presented in Sect. 3.2.3 that Support System for Agrometeorology Transfer (DSSAT), the model’s ability to simulate year to year variation in World Food Studies (WOFOST) and Crop Environment Re- Ghana-wide maize yield is moderate. Nevertheless, previ- source Synthesis–Maize (CERES–Maize) for sub-Saharan ous studies have demonstrated that GLAM can capture the Africa, speaks to a need for the quantification of the me- meteorological hazard to yield (Challinor et al., 2007, 2010; www.geosci-model-dev.net/11/2353/2018/ Geosci. Model Dev., 11, 2353–2371, 2018
2368                              D. Asfaw et al.: TAMSAT-ALERT v1: a new framework for agricultural decision support

Figure 16. Probability of yield forecast for the 2011 growing season when weighted by IRI seasonal forecast of rainfall (blue), when weighted
by IRI seasonal forecast of temperature (green) and when no weightings are used (red). The x axis represents the pentile categories used in
the yield forecast.

Figure 17. Time series of maize yield forecast in Ghana from 2007        Figure 18. Discrete ranked probability skill score for the yield fore-
to 2011 with four lead times of forecast. This is done using a hind-     casts over Tamale using the TAMSAT-ALERT system at different
cast for each year and comparing the plots of ∼ 3-month lead time        lead times.
(red), ∼ 2-month lead time (green), ∼ 1-month lead time (magenta)
and ∼ 0.5-month lead time (blue).
                                                                         Osborne et al., 2013) when the model is driven with high-
                                                                         quality meteorological data and is compared against robust
                                                                         information on yield. The provision of the scripts for the

Geosci. Model Dev., 11, 2353–2371, 2018                                                     www.geosci-model-dev.net/11/2353/2018/
D. Asfaw et al.: TAMSAT-ALERT v1: a new framework for agricultural decision support 2369
maize yield. This could be because the sensitivity of crops to
moisture is on a specific period of their growth and the sen-
sitivity of crops to temperature is also not similar throughout
their growth stage. In other words, our findings highlight the
necessity of more specific and localized forecasts if users are
to benefit from the inherent skill contained in the forecasts.
These findings are consistent with anecdotal evidence that
the tercile seasonal forecasts of rainfall routinely issued by
forecasting organizations are of little practical benefit for de-
cision making. A secondary application of TAMSAT-ALERT
could be to provide guidance on forecasts that would poten-
tially be of use for decision makers should they have suffi-
cient skill. Such analyses are currently underway as part of
a major national capability program being carried out at the
Figure 19. Discrete ranked probability skill score for the yield fore- National Centre for Atmospheric Science.
casts over Tamale using the TAMSAT-ALERT system at different In summary, TAMSAT-ALERT is a lightweight system,
lead times averaged for 2002–2011. which can be run either using the computing facilities avail-
able in house at meteorological services or on the cloud. Its
modular design enables it to work alongside existing sys-
GLAM implementation will enable further studies to be car- tems to combine multiple sources of data into quantitative
ried out at locations with more robust information on yield assessments of risk. Together with socioeconomic assess-
and agronomic characteristics. ments, this information could be of significant value for gov-
This study used the GLAM crop model as an illustration of ernments, policy makers and humanitarian service providers
the implementation of the system. The strength of TAMSAT- tasked with mitigating the effect of drought on Africa’s poor-
ALERT, however, is its modularity. TAMSAT-ALERT can est farmers.
be implemented for any impact model driven with meteo-
rological data. There is now demand for TAMSAT-ALERT
in locations throughout East and West Africa, with the sys- Code availability. The TAMSAT-ALERT v1.0 framework code
tem adapted to implement trusted metrics and models. This and the user manual are openly available on GitHub (https://github.
modularity and flexibility is important, since the skill of the com/tamsat-alert/v1-0, last access: June 2018) and Zenodo (Asfaw
TAMSAT-ALERT system is constrained by the quality of et al., 2018). The GLAM v3 crop model is provided under a license
agreement, so it is not possible to directly release it on GitHub but
the model and its calibration. In this study, for example,
it is possible to obtain it through the contact form at the follow-
the evaluation and calibration of GLAM was hampered by
ing link (http://www.see.leeds.ac.uk/research/icas/research-themes/
quality-control issues with the available yield data. The sys- climate-change-and-impacts/climate-impacts/glam/, last access:
tem would be much improved if used in house by agencies June 2018).
with access to high-quality yield data and locally calibrated
models. Nevertheless, it is important that model error is taken
into account in the decision-making process, and forecasts
should therefore be issued in the context of model evalua- The Supplement related to this article is available
tions like the one presented in this study. TAMSAT-ALERT’s online at https://doi.org/10.5194/gmd-11-2353-2018-
modular structure, moreover, permits forecasts to be pro- supplement.
duced using an ensemble of crop models and crop model
parameterizations, facilitating formal analysis of model un-
certainties. Competing interests. The authors declare that they have no conflict
of interest.
A key finding from our study is that tercile seasonal fore-
casts have little impact on TAMSAT-ALERT’s skill for the
case study considered. This is not unexpected. The corre-
Disclaimer. Any opinions, findings, conclusion or recommenda-
lation of 90-day total rainfall with GLAM-simulated maize tions expressed in this publication are those of the author(s) and
yield in this region is low. The low correlation means that do not necessarily reflect the views of the BMGF.
we do not expect precipitation seasonal forecasts to improve
the yield forecasts even if they are skillful. Our results do not
suggest that there is no information available from seasonal Acknowledgements. Dagmawi Asfaw is supported by a studentship
forecasts. However, we do show that 90-day tercile forecasts implemented by CIMMYT as part of Taking Maize Agronomy to
of temperature and rainfall, even if perfectly skillful, provide Scale in Africa (TAMASA), made possible by the generous support
comparatively little information for risk assessments of low of the Bill and Melinda Gates Foundation (BMGF).
www.geosci-model-dev.net/11/2353/2018/ Geosci. Model Dev., 11, 2353–2371, 2018You can also read