Lessons from the 2016 Kaikoura Earthquake: Understanding the Impacts of a Potential Alpine Fault Earthquake on Government Productivity in ...
←
→
Page content transcription
If your browser does not render page correctly, please read the page content below
Lessons from the 2016 Kaikoura
Earthquake: Understanding the Impacts
of a Potential Alpine Fault Earthquake on
Government Productivity in Wellington
(NZ)

April 2018

Charlotte Brown
Nick Horspool
Garry MacDonald
Kaylene Sampson
Erica Seville
Nicola Smith
Joanne Stevenson

QuakeCoRE Project E6471-AF5/ NHRP 2017-ROR-01-NHRP

Executive Summary

Currently little is known about how government entities respond and adapt to disruption. Similarly,
little is known about how these disruptions affect the delivery of government services and how
those impacts flow through the regional and national economy. Because of the way government
services are priced (or not priced) and consumed in the economy, interruptions in the provision of
government services produce different economic outcomes when compared to disruptions in the
provision of other sectors’ goods and services. A better understanding of the behaviour of
government entities in the face of these disruptions will improve our ability to model the economic
impacts.

This report summarises the initial findings of a project jointly conducted by Resilient Organisations,
M.E Research, and GNS Science, to enhance our understanding of the changes in national
government productivity in Wellington associated with an Alpine Fault earthquake scenario. This
project employed a three-stage approach. The first stage examined the impacts of the 14 November
2016 Kaikōura earthquake on four New Zealand government departments based in Wellington. In
the second stage, the hazard impact and loss modelling tool, RiskScape generated probable damage
and loss estimates from an Alpine Fault earthquake on the greater Wellington metro area. In stage
three, these outputs were incorporated into the Measuring the Economics of Resilient Infrastructure
Tool (MERIT) to estimate the economic losses that could transpire from government disruptions
following an Alpine Fault earthquake scenario. There is a previous report available with more
information on the Kaikōura case studies in a report published by Sampson et al. 2017.

Stage One Results
The main aim of stage one was to understand the experiences of government departments in
relation to the 2016 Kaikōura earthquakes, to provide context and estimate some parameters used
in the subsequent modelling of earthquake disruptions on government productivity. Phase one
engaged 12 staff from seven different New Zealand government agencies. Results from stage one
indicated that:

    •   The primary mechanism for disruption faced by case study agencies in Wellington was
        building disruption.
    •   Demand for critical government functions, such as social support payments, health services,
        and civil protection often increased following the disruption, while non-critical functions
        often experienced reduced demand.
    •   The government’s ability to meet demand will depend on the disruption to critical services
        and buildings, the ability of the agency to reprioritise staff, and other resources toward
        demand increases, and the capacity of agency offices based outside of Wellington to absorb
        additional demand or house staff displaced from Wellington.

Phase one also provided useful insights into the length of time government agencies may need to
operate from temporary locations, the loss of effective employee hours due to building disruptions,
and how government agencies adapt to deal with the loss in effective employee time or
productivity.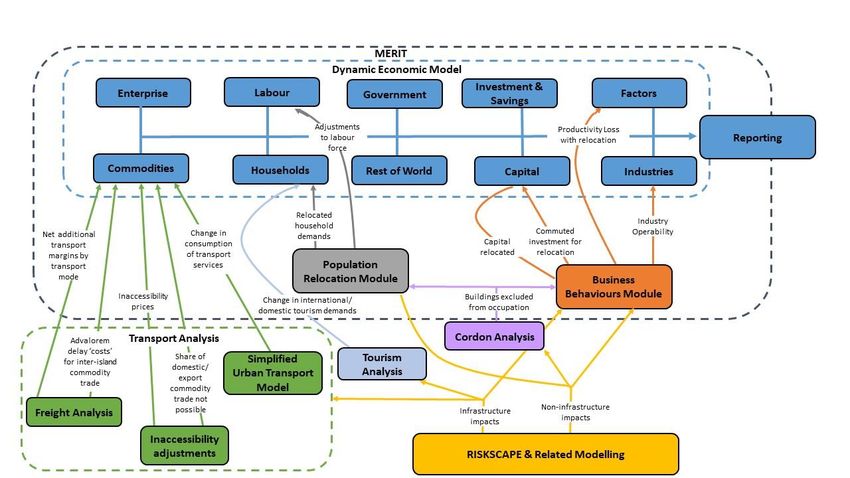
Stage Two
The second stage of this project estimated the potential building damage and subsequent
consequences of an Alpine Fault earthquake using the RiskScape multi-hazard loss modelling tool.
For this study we selected an earthquake scenario with a fault rupture that included both the Alpine
Fault and a subsequent rupture of the Wairau Fault, which is the northern extension to the Alpine
Fault. We deliberately selected a hazard scenario with potentially severe impacts for Wellington to
enable in-depth analysis of the relationship between government productivity and impacts on both
government and other buildings in the city. It is important to keep in mind when interpreting the
results, that the chosen scenario is near to an Alpine Fault event worst case scenario for Wellington.

The RiskScape model produces different impact results for different runs of the same hazard
scenario model. To capture a range of outputs, we produced 10 runs of the Alpine-Wairau fault
rupture scenario, each producing different impacts for the Wellington metro areas.

Across all the model runs, the number of buildings in Wellington subject to the greatest damage
(damage state 5 - collapse) was generally low (0-3 buildings). The number of buildings subject to
irreparable structural damage (damage state 4) varied quite significantly (ranging from 3 to 45
buildings). We were able to match specific government tenants with the RiskScape building stock
and damage information using the results of a recent survey of Wellington building occupancy and
data from the NZGPP group on employee numbers at each location. This allowed us to translate the
building disruption outputs to estimated impacts on government productivity in stage three.

Stage Three
Outputs of stages one and two were incorporated into the Measuring the Economics of Resilient
Infrastructure Tool (MERIT) to estimate the economic losses that could transpire as a result of
government disruptions following an Alpine Fault earthquake scenario. The core task for the MERIT
modelling in this project was to design a new module or series of mathematical steps that could
translate physical damage information into inputs for the economic model.

Overall the Government Organisations Module developed through this research estimates how
building damage alters the productivity of government staff. While the initial disruption is to capital
stocks (buildings), the way we implement and model the economic consequences of the disruptions
is focused on the labour implications. There are three steps in the newly created Government
Organisations Module:

    1) Calculate the expected number of days each government organisation in the Wellington CBD
       is without a building or working in a temporary location (e.g. from home or sharing office
       space with another government organisation).
    2) Calculate the hours of employee lost productivity due to building disruptions.
    3) Assign adaptation measures taken by government agencies to deal with the loss in effective
       employee time or productivity.

In this study the adaptations focused on labour tactics to recapture lost productivity either through
staff working harder and longer hours without extra pay, or by the agency paying overtime to staff
or employing extra labour (either by contract or as additional staffing). We then selected parameters
to adjust in the Dynamic Economic Model component of MERIT in order to best simulate the system-
wide implications of a change in government productivity.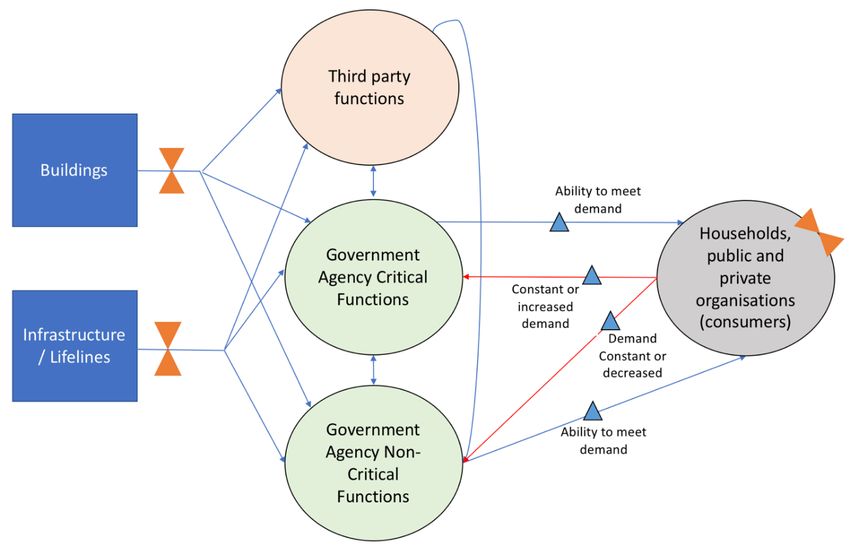
Results
The Government Organisations Module has been run 200 times providing some useful insights into
the ranges of results that might be expected for the Alpine-Wairau scenario. It also provides some
output indicators relating to non-market impacts (namely unpaid overtime) while the Dynamic
Economic Model produces outputs relating only to the market economy.

Displacement
Initially, at day one after the event, all model runs report that the entire population of 28,000
government employees in the CBD (i.e. 100% of employees) are working at a temporary location.
Over the next two weeks, the numbers of CBD employees in temporary working locations fall rapidly
but are still at 13,000 or 46% according to the median of the model runs. By six months the
equivalent figures for the median run are 1,500 or 5%. On first inspection these results may seem
high, however, it is important to keep in mind that the modelling also incorporates buffer areas or
cordons placed around buildings of damage states 4 and 5, and the assumed length of time of these
cordons is relatively long. Interestingly, for all RiskScape runs, the number of government employees
impacted by these cordon areas is higher than the number of employees impacted through
occupancy of buildings directly impacted. These results serve to highlight that for government
continuity planning there is strong importance not only in the structural resilience of buildings
directly occupied by government staff, but also the neighbouring buildings, as these also have
significant potential to create disruption.

Government Productivity Losses
Next, we quantified the losses in government productivity due to employees not being as productive
following building disruptions. Here productivity losses are measured in the effective loss of ‘as
normal’ employee hours. The event the losses in productivity vary quite substantially between the
model runs. Summing over all days for the first year after the event, the total losses in hours are
calculated across the 200 model runs as ranging from 1.56 to 2.57 million hours, with a median of
1.98 million hours (25 percentile = 1.83 million, 75 percentile =2.13 million).

Government Adaptations
We quantified the adaptation measures taken by government organisations to recover losses in
productivity. It is assumed that there will a time for which the costs will be borne entirely by
employees simply through working extra time or harder, without corresponding extra remuneration.
The module calculates that these effects will be greatest just over one week after the event. We also
calculated the number of additional paid employee hours generated to recover productivity. Under
the median model run, the total additional number of paid employee time is around 21,000 hours
per day shortly after the event and is maintained at higher than 10,000 hours per day for the entire
first month after the event. For the entire first year after the event, and over the set of 200 hundred
model runs the median time required was 1.10 million hours.

Gross Domestic Product
Finally, the simulation of the Dynamic Economic Model, utilised the single selected median run from
the Government Organisations Module as the relevant input data. We calculated cumulative impact
on Gross Domestic Product (GDP) at three categories of spatial aggregation: Wellington Region, rest
of New Zealand, and total New Zealand.

    •   At the national level the absolute impact is less than $1 million over the first two months,
        over six months there is a relatively small cumulative change of $1million in GDP, and over
        the entire first year the absolute impact is back down to less than $1 million.
    •   At the sub-national level, Wellington GDP increases by $11 million, but conversely GDP for
        the rest of New Zealand decreases by $11 million.
    •   The largest losses occur in the aggregated industry ‘government, education, and health’ in
        the rest of New Zealand, reflecting that it is expenditure on services from this industry group
        from which the largest pool of public funding has been withdrawn.

The relatively small changes at the national level reflect that to a large extent the outcomes are
transfers in income and spending from one agent to another. When we look at the sub-national
results we can see that transfers occur within the country.

Limitations and Discussion Points
    •   Hypothetical event: The event that has been modelled is hypothetical and focused almost
        exclusively on building damage in Wellington. In an Alpine fault rupture is quite likely that
        there will be damage to other built environment services necessary for a well-functioning
        economic system.
    •   Economics and Systems-Analysis: Our MERIT analysis and modelling has helped to illustrate
        the counter-balancing relationships that exist in economic systems. Additionally, in the
        government sector ‘sales’ of services and incomes generated do not fall despite the lack of
        supply and ‘sector output’ does not get sourced from alternative suppliers as this is
        generally not possible. As a result, the impacts on GDP are relatively minor. In this scenario
        analysis of a rupture event on the Wairau-Alpine fault, the economic modelling has
        produced an overall neutral impact on GDP.
    •   Regional changes: The funding of additional labour is ultimately sourced from all over New
        Zealand, there are differences in impacts at a regional level, with Wellington receiving a net
        increase in incomes and GDP, and the rest of New Zealand a net loss. In this study, we have
        not included any consideration of supply-side constraints on labour resources in the MERIT
        modelling, and therefore positive gains produced by the modelling may, to some extent, be
        over-estimated.
    •   GDP/Value added versus other metrics. A full consideration of welfare implications is likely
        to require other considerations and metrics. Although GDP impacts may be relatively
        neutral, welfare impacts may be quite high. Indeed, by its very nature, the government
        sector tends to be involved in the provision of goods and services that are poorly priced in
        markets relative to their social welfare benefits. Hence changes in GDP/value added from
        the education/ health sectors are not necessarily the best way to conceptualise the impacts
        that occur.

The results of this demonstrate that although such an event would cause significant disruptions to
the operations of government agencies in terms displacement and labour hours lost, the impact on
New Zealand’s GDP is minimal. This work is a first attempt at quantifying the impact of a significant
earthquake event on New Zealand’s government productivity, and we note a number of areas for
ongoing development in the full report.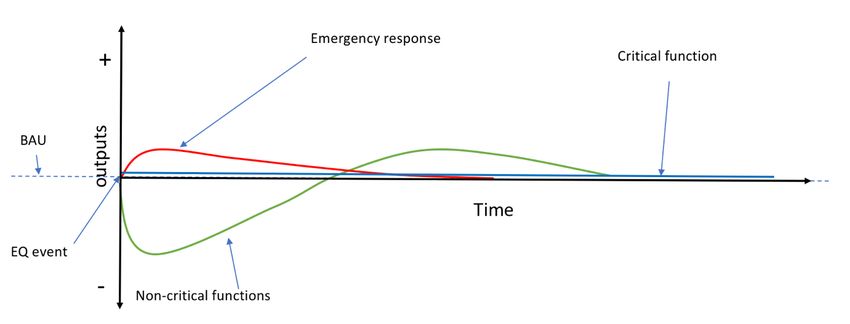
Acknowledgements
This project was supported by Natural Hazards Research Platform (Grant Number 2017-ROR-01-
NHRP), which is funded by the New Zealand Government through the Ministry of Business
Innovation and Employment (MBIE). The project is also funded in part by QuakeCoRE, a New Zealand
Tertiary Education Commission-funded Centre (QuakeCoRE Project E6471-AF5). We also offer
sincere thanks to all of the participants in the focus groups and interviews. This project was also
assisted greatly by information supplied by the New Zealand Government Procurement and Property
(NZGPP).
Table of Contents

1.0     Introduction ........................................................................................................................................ 1

2.0     Measuring Productivity ....................................................................................................................... 2

  2.1      Productivity ........................................................................................................................................... 2

  2.2      Measuring Government Productivity .................................................................................................... 2

  2.3      Capturing Productivity Changes for MERIT Modelling .......................................................................... 3

3.0     Building a Government Organisation Productivity Model ................................................................... 4

  3.1      Stage 1: Observations from the Kaikōura Earthquake .......................................................................... 4

  3.2      Stage 2: RiskScape ............................................................................................................................... 10

  3.3      Stage 3: MERIT Modelling ................................................................................................................... 13

  3.4      Results: MERIT ..................................................................................................................................... 22

4.0     Discussion ......................................................................................................................................... 29

5.0     Conclusions & Future Work ............................................................................................................... 31

6.0     References ........................................................................................................................................ 33
1.0          Introduction

New Zealand’s capital city of Wellington experienced significant disruptions from a magnitude 7.8
‘Kaikōura’ earthquake that occurred on November 14th, 2016 at 12:02am local time. Although
Wellington is 60km north of the northernmost causative faults (Litchfield et al. 2016; Bradley,
Wotherspoon and Kaiser, 2017) several buildings were damaged, capacity was reduced in the main
seaport, and water, electricity, and telecommunications services were temporarily disrupted
(Giovinazzi et al. 2017; Hughes et al. 2017). Almost a month on from the quakes, approximately 11%
of Wellington office spaces remained closed due to damage (Bradley, Wotherspoon and Kaiser,
2017). As the nation’s capital, Wellington houses a concentration of government agencies. As such,
the loss of productivity, and associated disruptions that were felt by organisations across the
affected areas (Stevenson et al. 2017) were equally an issue for government. At least nine of the
buildings requiring closure as a result of the earthquake housed government agencies, which
required the temporary or permanent relocation of thousands of staff (Stevenson et al. 2017).

Currently, little is known about how government entities respond and adapt to disruption. Similarly,
little is known about how these disruptions affect the delivery of government services and how
those impacts flow through the regional and national economy. A better understanding of the
behaviour of government entities in the face of these disruptions will improve our ability to model
the economic impacts.

This report summarizes the initial findings of a project being jointly conducted by Resilient
Organisations, M.E Research and GNS Science, to enhance our understanding of the changes in
government productivity associated with an Alpine Fault earthquake scenario. This research
combines observations of the changes to government productivity resulting from the Kaikōura
earthquake and a desktop scenario of a probable damage and loss estimates from an Alpine Fault
earthquake generated by the hazard impact and loss modelling tool, RiskScape. These outputs are
then incorporated into the Measuring the Economics of Resilient Infrastructure Tool (MERIT) to
estimate the economic losses that could transpire as a result of government disruptions following an
Alpine Fault earthquake scenario.

The Impact of the 2016 Kaikoura Earthquake on Government Productivity in Wellington (NZ)      Page 1
April 2018
2.0            Measuring Productivity

2.1            Productivity
Productivity is calculated as a ratio between outputs and inputs. It is used to assess how efficiently
inputs, such as labour and capital, are used to produce outputs, such as goods and services, to
achieve a given outcome. Measures of productivity can be used to compare a system to itself over
time or to compare different organisations or economies. Figure 1 illustrates the relationship
between four distinct aspects of the production process: inputs, process, outputs, and outcomes.

Figure 1: A simple representation of a production process (Sampson et al., 2017)

2.2            Measuring Government Productivity
Measuring government productivity is not straight-forward. The marginal or added value that is
created through the process stage of production can be difficult to quantify. This is particularly true
where government services are subsidised or provided free to the public or ‘consumer’. Though in
some cases the services provided by the state do have equivalence in the private sector (i.e.
education); while in other cases, such as the services provided by Inland Revenue, there are no
private sector equivalents from which to draw estimates of relative productivity (Douglas, 2006).

Government agencies perform a range of functions.1 The outputs of some functions are more
difficult to monetize or quantify than others. For example, the All Right? Wellbeing public awareness
campaign jointly run between Canterbury District Health Board and the Mental Health Foundation of
New Zealand was designed to increase the emotional and psychological resilience of Christchurch
residents in the period after the 2010/11 earthquakes (Sampson et al., 2017). Measuring the
effectiveness of such campaigns relies on intermediate measures or indicators as proxies for latent,
diffuse, or longer-term outcomes (Douglas, 2006). In contrast, metrics that capture government
activity that is directly outward facing or provides services directly to individuals, such as call centre
support or hospital stays, are easier to capture (Douglas, 2006).

1
 Functions are the categories of activities performed and the statutory duties and procedures associated with
carrying-out those activities.

The Impact of the 2016 Kaikoura Earthquake on Government Productivity in Wellington (NZ)               Page 2
April 2018
Each agency also performs a variety of functions, typically divided into critical and non-critical
subcategories. This categorisation is based on the assessment of whether a service, activity, or
product must be maintained for an agency to meet its primary responsibilities and obligations. There
is no consistent definition of criticality, and agencies apply the term to functions at their own
discretion. Criticality will often determine how activities are prioritised during a disruption event.
So, productivity at the agency level is a product of resource sharing and prioritisation at the function
level.

In addition, some agencies provide ‘emergency functions’ in significant community-wide disruption
events, for example, administering funding or other support services to disrupted populations.
These activities are conducted in addition to business-as-usual (BAU) services, and often displace
BAU activities during a response. This provides a challenge when measuring productivity change, as
the nature of the service outputs are different before and after an event.

2.3          Capturing Productivity Changes for MERIT Modelling
Because the types of outputs and the ability to measure or quantify outputs varies so significantly
across the government sector, we have chosen to describe and measure productivity change with
metric that does not require any quantification of outputs. That is, we assume that for each
government organisation there is a given level of output achieved per hour by an average (i.e. non-
disrupted) staff member. When the organisation is disrupted, we can think of the productivity losses
as the ‘effective hours of normal staff output lost’ per hour of staff time worked, meaning that a
disrupted labour hour is less productive than a BAU labour hour.

The Impact of the 2016 Kaikoura Earthquake on Government Productivity in Wellington (NZ)         Page 3
April 2018
3.0          Building a Government Organisation
             Productivity Model

This project employed a three-stage sequential approach to assess the impacts of an Alpine Fault
earthquake on government productivity. The first stage examined the impacts of the 14th of
November 2016 Kaikōura earthquake on four New Zealand government departments based in
Wellington. This stage provided a conceptual foundation for building a model of earthquake impacts
on government productivity. In the second stage, we modelled a potential future earthquake
associated with the Alpine Fault and its potential impacts on buildings in the greater Wellington
metro region. In the third stage of the project, the Measuring the Economics of Resilient
Infrastructure Tool (MERIT) incorporated elements of stages one and two to evaluate the
consequences of such a disruption to government productivity in Wellington.

3.1          Stage 1: Observations from the Kaikōura Earthquake
The main aim of stage one was to understand the experiences of government departments in
relation to the 2016 Kaikōura earthquakes, to provide context and estimate some parameters used
in the subsequent modelling of earthquake disruptions on government productivity. In this stage,
we first conducted a focus group meeting with participants from five separate agencies who are part
of a cross-government business continuity management (BCM) working group. All participants
contributed to business continuity management or similar in their organisation. The focus group was
conducted first to enable a cross-government view of the issues government organisations faced
because of the 2016 earthquake event. The focus group discussion addressed post-Kaikōura
earthquake operational environments, vulnerabilities, and adaptive strategies.

The focus group was followed by a series of one-on-one interviews with representatives from four
different government agency ‘case studies’. Two BCM working group participants offered their own
agencies for inclusion in the interviews that followed, and that captured a more in-depth exploration
of government productivity changes. Two additional agencies were recruited through contacts
established in the focus group discussion. Between September and October 2017, we interviewed
nine representatives from four government agencies with physical bases in Wellington, each of
which provides a range of functions across New Zealand.

In total stage one engaged 12 staff from seven different agencies. The functions of these agencies
varied considerably. The broad range of services included public facing functions such as call centres
and service counters, revenue collection and distribution, document and records management,
policy development and delivery, as well as leadership, strategy, and ministerial support services
amongst others. Data for both the interviews and the earlier focus group was voice recorded and
notes taken by two members of the research team. Anonymity and confidentiality was assured to all
agencies that participated. The study was approved by the University of Canterbury Human Ethics
committee.

The Impact of the 2016 Kaikoura Earthquake on Government Productivity in Wellington (NZ)        Page 4
April 2018
3.1.1 Disruptions
The case study organisations experienced different levels of disruption following the 2016 Kaikōura
event. Our case studies of four agencies reported performing 19 separate functions, of which six
were considered critical. All critical functions related to services directly provided to the public.
Government organisation disruptions were largely caused by damaged buildings and temporary loss
of access due to safety concerns about buildings. In one case, while two thirds of staff were able to
return to work the day after the earthquake, the remaining third were unable to return and were
relocated elsewhere on the North Island. Another agency was required to move premises on three
separate occasions, within the space of a few weeks. In the third case, the occupation of multiple
dwellings meant that staff were able to return to work at varying rates from within a few days up to
16 weeks (112 days). The fourth agency operated from a single building, which experienced damage
and the building was closed to most staff for approximately 10 weeks. Because of the nature of this
organisation’s core function, limited direct access to building and contents led to a substantial loss of
productivity for a subset of staff who could neither use the premises nor work from home.
The ability to occupy any buildings was contingent on the continued functioning of critical
infrastructure services such as transport networks and the quick resumption of electricity services.
Time to reoccupy some government buildings was reliant on third party service providers, such as
qualified engineers, to carry out safety inspections. We expect that in a larger event such as an
Alpine fault rupture, it is likely that demand for engineering services would greatly surpass supply.
Other significant vulnerabilities that would severely hinder the ability to deliver agency function
included:
• IT and data hosting
• Access to specialist staff
• Coordinating services with other government agencies
• Third party suppliers, especially banking and telecommunications
3.1.2 Changes to Inputs
Two kinds of inputs are discussed herein; labour inputs and capital inputs. Figure 2 illustrates the
level of labour input for each agency for both critical functions and non-critical agency work relative
to ‘business as usual’ (BAU) inputs. As can be seen, Agency 1 returned to about 38 per cent of BAU
staff hours worked by a week after the earthquake and 100 per cent of business as usual (BAU) staff
hours worked within two weeks of the disruptive event. This recovery of input was more rapid for
critical functions within the organisation which had about 75 per cent of BAU labour input within a
day of the event. Agency 2 returned to 90 per cent of staff hours as a proportion of BAU for both
critical and non-critical functions within a week of the event and 100 per cent within two weeks.
The Impact of the 2016 Kaikoura Earthquake on Government Productivity in Wellington (NZ) Page 5
April 2018100%
90%
80%
70%
60%
50%
40%
30%
20%
10%
0%
Day 0
Day 1
Week 3
Week 6
Week 1
Week 2
Week 4
Week 5
Agency 1: Non-critical function Agency 1: Critical function
Agency 2: Non-critical function Agency 2: Critical function
Agency 3: Non-critical function Agency 3: Critical function
Agency 4 : Non-critical function Agency 4: No critical function
Figure 2: Labour inputs (staff hours) as a proportion of BAU labour inputs for non-critical function outputs (solid line) and
critical function outputs (dotted line).
Agency 3 maintained 100 per cent of labour inputs for their one critical function from the day of the
earthquake, while total staff labour input did not return to 100 per cent of BAU until a week after
the earthquake. Agency 4 did not identify any critical functions and therefore has a single measure
for total labour input (non-critical functions) as a proportion of BAU labour input. The day after the
earthquake some staff from Agency 4 began to reoccupy their building and work, but staff were
notified later that week that the building was unsafe. Thus, labour input decreased between 15
November and 21 November 2016. It did not reach 100 per cent of BAU labour input until late
December, around 6 weeks after the event.
Capital inputs are the second kind of input examined. As noted above, building damage was an issue
to a greater or lesser degree for all case study agencies. The New Zealand Government Procurement
and Property (NZGPP) group was established with the objective of ensuring “efficient and effective
management of the Crown estate” (MBIE, 2016). The GPG played a significant role in helping
affected agencies find spaces to occupy after the Kaikōura event. Their approach focused on filling
space needs with existing buildings in the Government stock, facilitating temporary sharing
agreements, and enabling hot-desking. Departments with less disruptions contributed to space
sharing arrangements, with more than one respondent noting the high level of cooperation within
the public service.
The Impact of the 2016 Kaikoura Earthquake on Government Productivity in Wellington (NZ) Page 6
April 2018An interesting observation to make here is the discrepancy between the time taken to return to BAU
function and the rate of return to buildings. As noted above, at least one agency took around 16
weeks to get back to full usage of their building, though returning to full function took considerably
less time (about 6 weeks) for even the slowest agency. This highlights the success of the numerous
adaptive strategies that were employed immediately after the Kaikōura event, which were aimed to
reduce workflow disruption while meeting both BAU and emergency function requirements. Some
of these strategies included:
• Paying overtime to pick up lost productivity
• Awarding time in lieu for overtime hours
• Redeploying staff from non-critical functions to meet critical functions or more urgent BAU
• Putting non-critical work on hold or removing it altogether from the work schedule.
It is interesting to note that one agency indicated that the built-in excess capacity in staffing as part
of standard practice meant that no additional staffing hours were required to catch-up on work
backlogs the weeks and months following the earthquakes. For a fuller discussion of specific agency
action and approaches refer Sampson et al. (2017).
3.1.2 Changes to Outputs
The case study agencies reported on the effects the Kaikōura earthquake had on their service
delivery in the days, weeks, and months following the event. Just as damage experienced was
different for each agency, so too was the impact on output capacity. Outputs comprise three types
of activity: emergency response, critical BAU, and non-critical BAU. These activities were engaged in
at different rates across the four case study agencies, with one agency only having BAU output flow
to manage, while others were juggling all three types of activities following the Kaikōura event.
Figure 3 is intended to illustrate one of the four patterns of output activity experienced by the case
study agencies. As can be seen in this schematic (Figure 3), non-critical functions were dropped to
make time for the required emergency response. As the pressure on the immediate emergency
response waned over time, some of the non-critical work was resumed. In this model, staff worked
overtime (increasing outputs above BAU) to catch up on some of the work that had been put on
hold. Concurrently, the critical functionality of this agency was able to be maintained throughout the
recovery period. This schematic is intended to illustrate the changes to critical and non-critical
outputs relative to business as usual status.
The Impact of the 2016 Kaikoura Earthquake on Government Productivity in Wellington (NZ) Page 7
April 2018Figure 3: Schematic of approximate changes to critical, non-critical and emergency outputs over time.
Across the four agencies, some service outputs were continued through redirection of staff efforts,
and others were suspended due to staff availability. The impacts of disruptions on outputs is
summarised in Table 1.
Table 1: Changes to outputs for emergency functions, critical and non-critical BAU for the four case study agencies.
Agency Emergency Critical BAU Non-critical BAU
response
function
1 None Increased staff hours to meet two Suspended some functions -
critical functions redistributed staff to other
agencies elsewhere in the North
Island
2 None Minimal interruptions – high level Suspended functions intermittently
of online/automated output activity for specific issues – i.e. building
access, premises move
3 Yes – small Stable without interruption - Five functions – a range of impacts
increase in though staff were relocated to new from total suspension, significant
emergency premises outside of Wellington to reduction, or redistribution of work
functions perform this function to other agencies
4 None Nil – but increase in earthquake Reduced in line with staff input
generated functions that became reduction – redirected efforts to
critical/urgent. earthquake generated recovery
tasks.
Finally, as was noted by the BCM working group, and confirmed by our participants, government
agencies in general are highly dependent on third party suppliers for critical functions. Following the
Kaikōura event, there was one case study organisation’s building re-entry was slightly slowed by the
availability of structural engineers to check premises. Other than this instance, none of the agencies
reported disruptions related to third party suppliers. In future events, however, it should be noted
The Impact of the 2016 Kaikoura Earthquake on Government Productivity in Wellington (NZ) Page 8
April 2018that many third-party functions originate in Wellington and therefore are equally exposed to the types of earthquake generated disruptions as the government agencies they are serving. This interruption may additionally impact the capacity for effected agencies to return to full operation. 3.1.3 Stage 1 Results Summary Figure 4 provides a system diagram of the relationship between the various aspects of disruption, government functions, and the communities that rely on government functions. As illustrated, the primary mechanism for disruption faced by our case study agencies in Wellington was building disruption. There were some very minor disruptions to infrastructure (electricity and related IT services), and it was clear that even with these minor disruptions, agencies’ ability to function was compromised. Demand for critical government functions, such as social support payments, health services, and civil protection often increases following a disruption. Non-critical functions may experience reduced demand, while people’s energies are refocused on response and recovery priorities (as shown in Table 1). The government’s ability to meet demand will depend on the disruption to critical services and buildings, the ability of the agency to reprioritise staff and other resources toward demand increases, and the capacity of agency offices based outside of Wellington to absorb additional demand or house staff displaced from Wellington (Figure 4). Figure 4: Relationships between elements influencing government productivity The Impact of the 2016 Kaikoura Earthquake on Government Productivity in Wellington (NZ) Page 9 April 2018
3.2 Stage 2: RiskScape
The second stage of this project estimated the building damage and subsequent consequences of a
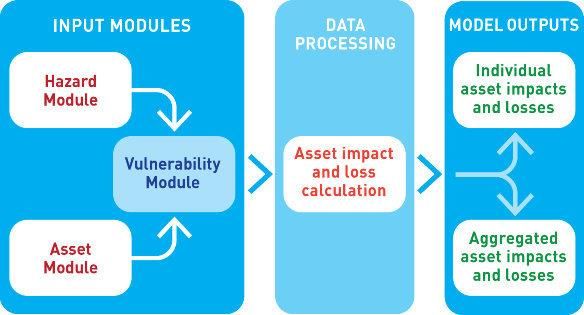
potential Alpine Fault earthquake using the RiskScape multi-hazard loss modelling tool. RiskScape is
a loss modelling tool designed to assist organisations and researchers with estimating asset impacts
and losses from natural hazard events. The software is principally developed through collaboration
between two New Zealand research organisations, GNS Science and NIWA, as well as other
organisations affiliated with the Natural Hazards Research Platform. Further information on the tool
can be found on the RiskScape website2 and RiskScape Wiki.3
RiskScape operates by combining information or ‘layers’ relating to specific natural hazard scenarios
and their hazard intensity, with asset locations and their characteristics, and vulnerability models.
RiskScape then calculates asset damage and losses for each chosen scenario and outputs this
information as individual asset impacts and losses (e.g. for each building RiskScape provides outputs
indicators that include number of buildings by damage state, casualties estimated, time for
reoccupation of building, and estimated reinstatement costs) or as aggregated asset impacts and
losses over a geographic area.
Figure 5: RiskScape modelling components and workflow (RiskScape, 2018)
3.2.1 Scenario
As mentioned earlier, the focus of this project is on estimating the impacts on government
productivity of an Alpine Fault event. There are many potential scenarios of an Alpine Fault event
that will have differing impacts for Wellington. Among the most important source of variation is the
site for the initial fault rupture. For example, an initial rupture location at the northern end of the
fault and propagating towards the south will likely produce significantly less ground shaking for
Wellington compared with a rupture propagating north towards Wellington. Other plausible
scenarios include the rupture of the Alpine Fault and other nearby faults in the Marlborough Fault
System, much like occurred during the Kaikōura earthquake, which resulted in the rupture of over 14
faults. For this study, we have deliberately selected a hazard scenario that is at the upper or more
severe end of the spectrum of Alpine Fault ruptures in terms of potential impacts for Wellington.
The reason for choosing a scenario with significant impacts on Wellington was to enable in-depth
2
https://www.riskscape.org.nz/
3
https://wiki.riskscape.org.nz/index.php/Overview.
The Impact of the 2016 Kaikoura Earthquake on Government Productivity in Wellington (NZ) Page 10
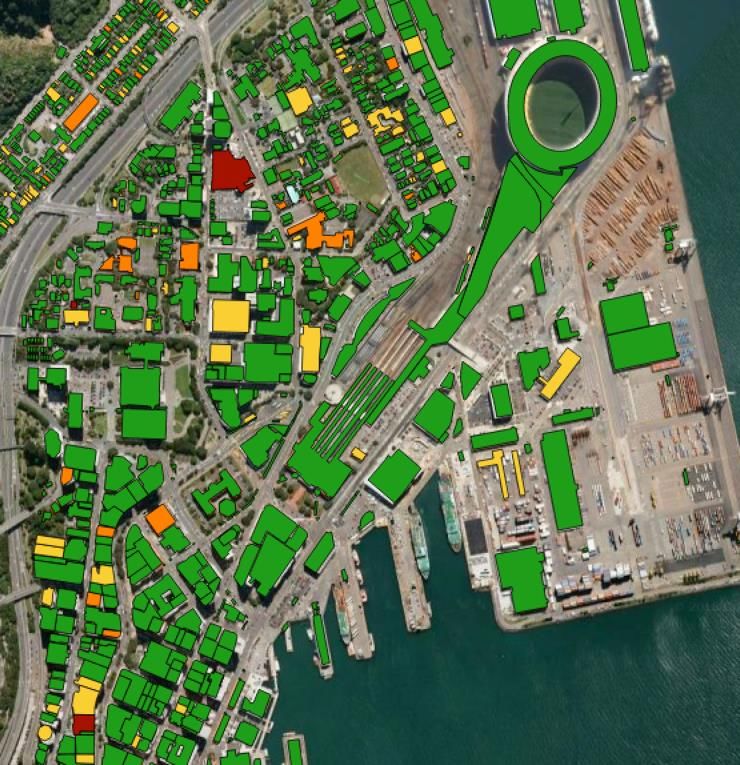
April 2018analysis of the relationship between government productivity and impacts on government buildings and other capital in the capital city. The selected scenario is a fault rupture that includes both the Alpine Fault and subsequent rupture of the Wairau fault which is the northern extension to the Alpine Fault. Nevertheless, it is important to keep in mind when interpreting the results, that the chosen scenario is purposely severe for Wellington in terms of an Alpine Fault event. The ground motion maps for this scenario were developed by Professor Brendon Bradley from University of Canterbury for the AF8 project4 which is developing a South Island wide response plan for an Alpine Fault earthquake. 3.2.2 Modelling The RiskScape model is not deterministic. Impact results can be different for different runs of the same hazard scenario model, even when the input information and assumptions are unchanged.5 Random variation will occur in the model results because the functions that are responsible for calculating building damage and structural failure include probability distributions; and each time the model is run it selects parameters from within those distributions. Another important aspect of the RiskScape modelling for this project is that only building assets were considered (i.e. infrastructure damage was excluded from the analysis). Based on the experience of the Kaikōura earthquake, building damage is likely to be the key driver of changes to government productivity. Figure 6 illustrates the types of outputs that can be generated by RiskScape. Figure 6: Example of outputs that can be generated by RiskScape. Damage states are shown as damage state 1 (green), damage state 2 (yellow), damage state 3 (orange), damage state 4 (dark red), damage state 5 (black). Definitions are provided in Table 2 below. 4 http://projectaf8.co.nz/ 5 Detailed technical documentation for the RiskScape model is available at the following websites: https://www.riskscape.org.nz/ and https://wiki.riskscape.org.nz/index.php/Overview. The Impact of the 2016 Kaikoura Earthquake on Government Productivity in Wellington (NZ) Page 11 April 2018
To enable the variation in potential building damage to be propagated through to the analysis of
actual impacts on government productivity, the RiskScape model was run ten times, and the results
for each run were provided separately to the MERIT modellers.

3.2.3         Outputs
The output provided to the MERIT modellers from RiskScape was essentially a set of GIS shapefiles.
From these files it was possible to extract a matrix of building data. The rows of the matrix consisted
of a list of all buildings. To keep the project tractable, only buildings located within Wellington
central business district (CBD) were considered. For each building we then have within the matrix,
several columns of attribute information (i.e. data that does not change when the model is run), the
most important being: x and y co-ordinates that specify the building location, building use code, and
number of building occupants (night and day). The other columns of the matrix contained the
building damage state assigned to each building, for each of the ten runs. Table 2 details the damage
state classification ranges from 1-5, with each state also corresponding to a range of expected time
for re-occupation. Note that all buildings receive a Damage State of at least 1 for every model run
(i.e. no ‘non-damage’ state).

Table 2: Building Damage States for RiskScape Model Runs

                                                                                         Expected
    Damage
                                                 Description                          Re-Occupation
     State
                                                                                     (days post-event)
        1           Inspection and minor non-structural (fittings or services)             1 to 7
                    repairs
        2           Repairs to more severe non-structural damage                            7 to 180
        3           Repairable structural damage. Assessment and insurance                 180 to 730
                    delays, some buildings will be demolished and rebuilt rather
                    than repaired
        4           Non-repairable. Assessment, insurance negotiation,                     730 to 1095
                    demolition, rebuild
        5           Building collapses                                                     730 to 1095

A summary of the building damage states is provided in Table 3 below. Across all model runs, the
number of buildings subject to damage state 5 (collapse) is generally low (0-3 buildings), while the
number of buildings subject to damage state 4 (irreparable structural damage) varies quite
significantly (ranging from 3 to 45 buildings). Run 1 exhibits relatively unusual results when
compared to the other 9 runs, particularly in terms of many extra buildings subject to damage state
2 and a corresponding fall in the number classed as damage state 1. This could be due to this run
sampling an extreme end of the vulnerability model distribution. Ideally, it would be optimal to
include up to 1000 different runs to fully sample the probability distributions in RiskScape but due to
the scope of this project and the need to pass this data on to MERIT, only 10 runs were included.

The Impact of the 2016 Kaikoura Earthquake on Government Productivity in Wellington (NZ)           Page 12
April 2018
Table 3: Count of buildings by damage state for each RiskScape run of the Alpine-Wairau Fault scenario
Damage State
Run Total
1 2 3 4 5
1 2,098 1,121 145 45 3 3,412
2 2,977 321 101 13 - 3,412
3 2,963 352 85 12 - 3,412
4 2,962 351 94 3 2 3,412
5 2,965 327 109 8 3 3,412
6 2,960 336 108 7 1 3,412
7 2,955 337 111 7 2 3,412
8 2,953 345 106 6 2 3,412
9 2,969 322 112 9 - 3,412
10 2,963 335 106 7 1 3,412
3.3 Stage 3: MERIT Modelling
MERIT (Measuring the Economics of Resilient Infrastructure Tool)6 was initially developed in the
2012-16 MBIE funded Economics of Resilient Infrastructure (ERI) research programme by three
partner organisations, M.E Research, Resilient Organisations and GNS Science. Further research and
consultancy projects have since provided opportunities for ongoing development and application of
this tool.
3.3.1 Background: Tasks Involved in MERIT Modelling
The core task faced in undertaking MERIT modelling is to translate descriptions of asset damage and
other forms of physical disruption, derived for a specific disruption scenario or scenarios such as an
earthquake event, into estimates of economic impacts. For the most part such information cannot
be applied directly as inputs to an economic model. Instead, a variety of additional modelling steps,
typically incorporating further information and assumptions are first undertaken to provide a set of
time-dependent parameters that could be used directly as inputs to an economic model.
Figure 7 provides an example scheme of a MERIT modelling process undertaken recently for a
Wellington Fault scenario (report currently unreleased). Arrows indicate where information flows
between models (i.e. outputs from one model become an input to another model). Central to MERIT
(and used in every modelling application) is a multi-sectoral, multi-regional, and fully dynamic
economic model, termed the ‘Dynamic Economic Model’ (blue boxes) in the diagram below. This
economic model is intentionally designed to imitate the core features of a Computable General
Equilibrium (CGE) model. Unlike a typical CGE model, however, it is formulated as a System
Dynamics simulation model using finite difference equations. This innovative extension is necessary
to capture the transient nature of economic consequences following a disruption event. Further
details of the economic model can be found in the technical report (Smith et al., 2016). Thus far, all
6
www.merit.org.nz
The Impact of the 2016 Kaikoura Earthquake on Government Productivity in Wellington (NZ) Page 13
April 2018MERIT applications have focused on reporting outcomes from the economic model in terms of impacts on GDP/ value added, although there is potential to also report other indicators which are either directly contained within the model or could be calculated from model variables. 7 The nature and extent of the modelling necessary to generate inputs for the Dynamic Economic Model will vary depending on the information available and the questions under consideration. To date MERIT applications have primarily focused on the impacts of disruptions to critical infrastructure (i.e. roads, electricity, telecommunications, rail, ports, potable water, wastewater). Given that the core source of disruption examined in this project is building disruption, it is not necessary to undertake some of the infrastructure-related modelling that has occurred in other projects (e.g. the transport modelling shown in green boxes in Figure 7). Similarly, population relocation and tourism analysis are not a core focus of this project (e.g. grey and light blue models in Figure 7 not relevant). Figure 7: Example of a MERIT Modelling Scheme To date, all MERIT applications have applied the Business Behaviours Module (BBM). It translates information on physical disruptions into estimates of industry ‘operability’ over time. Operability parameters vary between 0 (no operability) and 1 (non-disrupted or normal operability) and are closely related to the concept of productivity loss. When operability reduces to less than 1, industry output is scaled down from the level that might otherwise be expected from a given quantity of inputs to production. Importantly, the BBM is constructed mainly out of data from the Canterbury 7 To assist in the conceptualisation, the mathematical procedures that make up the modelling process have been grouped into a series of ‘models’, some of which have underlying sub-components or ‘modules’. For example, the Dynamic Economic Model is the core economic model constructed within the System Dynamics modelling language, and it is underpinned by several modules that cover Enterprises, Factors, Capital, Labour, and so on (see also Smith et al. (2016)). The Impact of the 2016 Kaikoura Earthquake on Government Productivity in Wellington (NZ) Page 14 April 2018
earthquakes and as already discussed, the focus has mainly been on infrastructure damage.8 It is also
important to keep in mind that the structure and functions underpinning the BBM are designed to
be generically applicable across all industries, rather than focused specifically on the nuances of the
government sector. With this background, the core task for the MERIT modelling undertaken in this
project is to design a new module or series of mathematical steps that, like the current BBM, can
translate physical damage information into inputs for the economic model. The new module, termed
the ‘Government Organisations Module’ can be considered an adaptation or extension to the BBM
that addresses the following aims:

    •   Propagation of uncertainty –In this project we will seek to provide information on the
        potential range of impacts on government productivity, rather than provide a best guess of
        the most likely impacts. As outlined above, the RiskScape modelling provides some
        information on aleatoric uncertainty associated with an Alpine Fault event. For any given
        hazard event scenario, the model can produce a set of runs with differing outputs reflecting
        statistical uncertainty. A key goal of the Government Organisations Module will be
        propagation of this uncertainty through the equations that ultimately determine impacts on
        government productivity. Other key parameters incorporated in the Government
        Organisations Module are assigned probability distributions so that the associated
        uncertainty propagate through the module.9

    •   Specifying disruptions from building damage – For the Government Organisations Module
        the focus is specifically on the disruptions caused by interruptions in the ability to use
        buildings. We therefore sought to match specific government tenants with the RiskScape
        building stock and damage information. Fortunately for this project we have available the
        results of a recent survey of Wellington building occupancy (O. Filippova & N. Horspool,
        personal communication, 7 March 2018), as well as data from the New Zealand Government
        Procurement and Property (NZGPP) group under MBIE. The survey provides a list of all
        buildings in the Wellington CBD, including information about the tenants and space usage
        within the buildings.10 The NZGPP data supplements this by also providing information on
        employee numbers at each location occupied by government agencies.

    •   Incorporation of government-specific productivity implications and adaptations – The
        government sector is relatively unique compared to other industry sectors in the economic
        model. Many of the functions of the government sector are of a public good nature, with
        sector ‘outputs’ not required directly as ‘inputs’ to production by other sectors. Also, while
        some government functions are time-critical, there also tends to be a relatively large

8
  The BBM does include consideration of non-infrastructure damage (e.g. disruptions to premises,
neighbourhoods and staff). For earthquakes the levels of non-infrastructure disruptions are estimated based
on ground shaking. To date no attempt has been made to consider how different building types (construction
methods, materials etc) will also impact on the extent of premises disruption.
9
  Ideally, we would also do this within the Dynamic Economic Model, but the scale of the task is outside the
scope of this project.
10
   Without this survey it would be very difficult to match buildings with occupiers classed according to specific
industry groups. Although the RiskScape building attributes include a building use category, these are very
aggregate groupings (e.g. ‘commercial’, ‘residential’) and only one use code is assigned for each building.
Another option is to look at rating database information, but experience has shown it is difficult to match the
use information to industry categories and furthermore the use categories are often inconsistently applied and
infrequently updated.

The Impact of the 2016 Kaikoura Earthquake on Government Productivity in Wellington (NZ)                 Page 15
April 2018
component of activities that are relatively non time-critical. This provides some flexibility for
adaptation measures that include reschedule and reprioritising. Another key feature is that
some of the general market mechanisms for adapting to disruption supply of outputs from
sectors (looking to alternative suppliers, increasing price to reduce demand) are not
particularly relevant for the government sector. All of this has important implications for the
way we seek to implement changes in productivity and adaptation responses in the
economic model, and hence the parameters we seek to produce from the Government
Organisations Module.
3.3.2 Structure of the Government Organisations Module
Overall the Government Organisations Module seeks to estimate how building damages alter the
productivity of government staff. In other words, because government staff experience a disrupted
working environment, the levels of production that can be achieved within an hour of work will be
less than under normal circumstances. Interestingly, although the initial disruption is to capital
stocks (buildings), the way we implement and model the economic consequences of the disruptions
is focused on the labour implications.
From outside of the organisation, it may be the case that not all productivity losses caused by the
building disruptions are apparent. This is because organisations implement adaptation measures
that reduce the impact of the disruption. For example, staff may work harder and longer, an
organisation may hire temporary contractors, or reschedule work to another time. Nevertheless, it is
important to consider the full range of impacts immediately caused by the disruption, so that we can
correctly assess the level of adaptation that occurs. Given that adaptation measures would not need
to occur under normal circumstances, the costs of the adaptations are an important component of
the overall economic impact.
The case studies undertaken during Phase 1 of this project highlighted that in addition to the
disruptions driven by building damage, the ability of government organisations to undertake normal
functions following an Alpine Fault event will also be highly influenced by the additional work that
will be created for the government sector in responding to the event. This situation can be
conceptualised as a fall in ‘as normal’ or BAU levels of productivity because organisations will be
required to move resources away from normal functions to response functions. For the MERIT
modelling no attempt has been made, however, to assess changes in government organisations
functions and ‘as normal’ productivity due to the need to undertake response functions.11
The first step in the Government Organisations Module is to calculate the expected number of days
each government organisation in the Wellington CBD are without a building or working in a
temporary location (e.g. from home or sharing office space with another government organisation).
11
In addition to the uncertainty associated with the types of response functions likely to be carried out by all
government agencies, we do not have information on the specific community-wide damages likely to be
encountered (particularly in the upper South Island) as a result of the specific Wairau rupture scenario and
hence the extent of the disaster response required.
The Impact of the 2016 Kaikoura Earthquake on Government Productivity in Wellington (NZ) Page 16
April 2018You can also read