ECOLOGICAL MARKET PRODUCTS FOCUSED ON ROAD TRANSPORT - Author: JOSÉ RAMON PALMER SORIA E-mail: Bachelor's Degree in Economics ...
←
→
Page content transcription
If your browser does not render page correctly, please read the page content below

ECOLOGICAL MARKET
PRODUCTS FOCUSED ON
  ROAD TRANSPORT
 Author: JOSÉ RAMON PALMER SORIA
       E-mail: al317399@uji.es
   Bachelor’s Degree in Economics
      Academic year: 2020-2021
    Tutor: NIKOS GEORGANTZIS

                                    1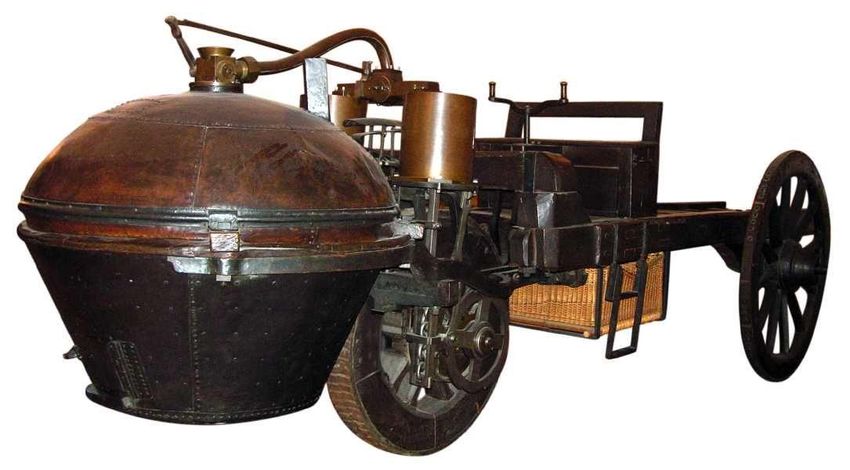
ECOLOGICAL MARKET PRODUCTS FOCUSED
                         ON ROAD TRANSPORT

Abstract
Nowadays the evolution of road transport is turning into one ecological market products.
Therefore, we have analysed the types of vehicles such as steam, gasoline, diesel,
electric, hybrid, and the new hydrogen vehicles. Furthermore, we also took a note of one
important fact, the technological improvements for the mitigation of greenhouse gases
that involves one of the most important things in the research, the sector pollution. Also,
we have asked to ourselves one question about how much each engine pollutes,
therefore we have used the rule of three to solve it. Moreover, we had to be aware about
the electric and internal combustion manufacturing process pollution because there are
plenty of “fake news1”. Besides we have studied the government’s influence and the
situation in Norway, Spain and two states of USA. Finally, we have analysed one
econometric model related to new electric vehicles registered.

Keywords:
Manufacturing process pollution, road pollution, government policies, lithium battery cell,
plug-in electric hybrid vehicle, electric, hydrogen, gasoline, and diesel.

JEL code:
Q55, Q56, Q58

1
    False news

                                                                                              2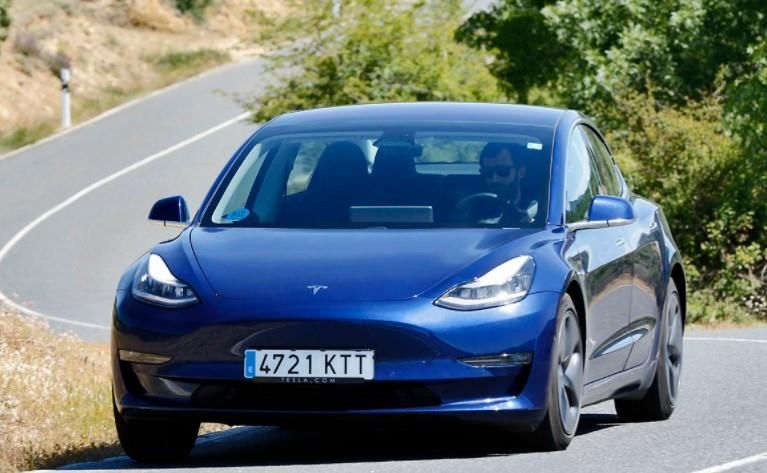
INDEX

Abstract ......................................................................................................................................... 2
Keywords: ...................................................................................................................................... 2
JEL code: ........................................................................................................................................ 2
LIST OF FIGURES, EQUATIONS AND TABLES .................................................................................. 4
1 INTRODUCTION.......................................................................................................................... 6
2 THEORETICAL FRAMEWORKS .................................................................................................... 7
2.1 THE EVOLUTION OF THE VEHICLE INDUSTRY......................................................................... 7
2.1.1 THE TYPES OF VEHICLE ENGINES ......................................................................................... 7
   2.1.1.2 Steam vehicle ................................................................................................................ 7
   2.1.1.3 Gasoline and Diesel vehicle ........................................................................................... 9
   2.1.1.4 Electric and Hybrid vehicle .......................................................................................... 11
   2.1.1.5 Hydrogen vehicle......................................................................................................... 13
2.1.2 TECHNOLOGICAL IMPROVEMENTS FOR THE MITIGATION OF GREENHOUSE GASES ..... 15
   2.1.2.1 Transport sector pollution .......................................................................................... 15
   2.1.2.1 How much does each engine pollute. ......................................................................... 18
   2.1.2.2 Internal combustion manufacturing process pollution .............................................. 25
   2.1.2.3 Electric manufacturing processes pollution ................................................................ 29
3 THE GOVERNMENT’S INFLUENCE IN THE AUTOMOBILE INDUSTRY ...................................... 33
   3.1 CURRENTLY ANALYSES OF SITUATION .............................................................................. 33
   3.1.1 The government’s influence in Norway ......................................................................... 33
   3.1.2 The hypothetical case in Spain ....................................................................................... 36
   3.1.3 The situation of USA and its energy sources .................................................................. 38
4 ECONOMETRIC MODEL............................................................................................................ 40
   4.1- Normality ......................................................................................................................... 42
   4.2- Multi collinearity .............................................................................................................. 47
   4.3- Homoscedasticity ............................................................................................................. 48
   4.4. Heteroscedasticity ............................................................................................................ 49
5 CONCLUSIONS .......................................................................................................................... 51
   5.1 THEORY CONCLUSION ....................................................................................................... 51
   5.1 ECONOMETRIC MODEL CONCLUSION............................................................................... 52
6- REFRENCES .............................................................................................................................. 54

                                                                                                                                                  3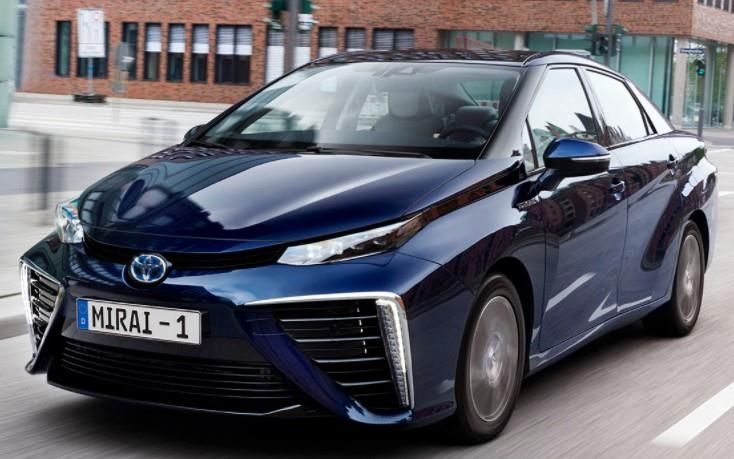
LIST OF FIGURES, EQUATIONS AND TABLES

Figure 1: Cugnot's Fardier steam car of 1769. .............................................................................. 8
Figure 2: Internal combustion engine Etienne Lenoir (1896) ....................................................... 9
Figure 3 First diesel vehicle by Rudolf Diesel (1936) ................................................................... 11
Figure 4 Plug-in electric hybrid vehicle & author of thesis (2021). ............................................. 13
Figure 5: First hydrogen vehicle (Electrovan) by GM (1966)....................................................... 14
Figure 6: Global greenhouse gas emissions by sector (2016). .................................................... 16
Figure 7:Consume and emissions of co2 of some vehicle models. ............................................. 17
Figure 8: Tesla Model 3 Standard Plus RWD. .............................................................................. 19
Figure 9:Toyota Mirai Cell Fuel Hydrogen (CFH). ........................................................................ 20
Equation 2: Cost of refuelling the electric part of a PHEV. ......................................................... 20
Equation 1: cos of refuelling the inter combustion of a PHEV. ................................................... 20
Figure 10: Toyota Camry 220H Advance ..................................................................................... 21
Equation 3: Total cost of refuelling a normal hybrid (1700kg) ................................................... 22
Figure 11: BMW 520d Berlina. .................................................................................................... 22
Equation 4: Total cost of refuelling a diesel vehicle (1700kg) .................................................... 23
Figure 12: Volkswagen Tiguan 2.0 TDI 110kw (150hp) ............................................................... 24
Equation 5: Total cost of refuelling a gasoline vehicle (1700kg)................................................. 24
Figure 13: a BMW x4 drive 20I. ................................................................................................... 25
Equation 6: Total kg per day that consume a sucker road pump. .............................................. 26
Equation 7: How much a sucker road pump pollutes according to its weight. .......................... 27
Equation 8: How much a sucker road pump pollutes during its journey going up and down
(0,005km) .................................................................................................................................... 27
Figure 14: Lifecycle of vehicle pollution (150.000km) ................................................................ 28
Figure 15: Lifecycle of electric vehicle manufactured and drived in EU and Lifecycle of electric
vehicle manufactured in China and drived in EU ........................................................................ 29
Figure 16: Battery metals for manufacturing an electric vehicle. ............................................... 30
Figure 17: Components of a lithium battery. .............................................................................. 32
Figure 18: Norway road map. Source:......................................................................................... 35
Figure 19: Manufacturing an electric vehicle in Norway comparing China and EU. ................... 36
Figure 20: Population density of Spain. ...................................................................................... 37

                                                                                                                                               4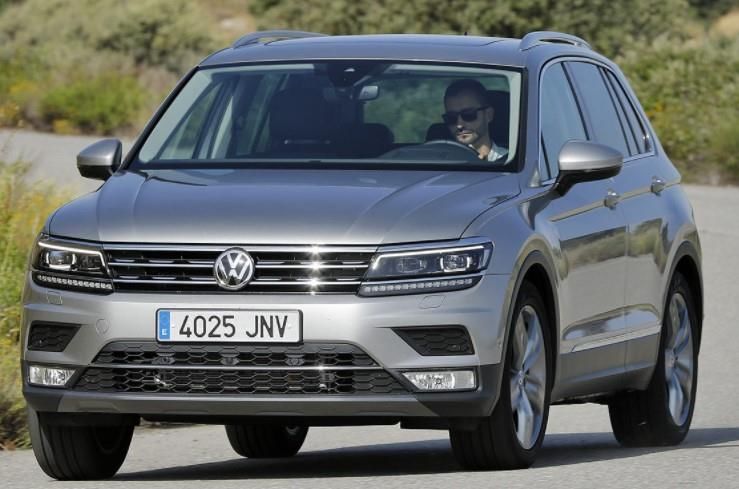
Figure 21: Washington energy sources that influence in the pollution of vehicles. ................... 39
Figure 22: Wyoming energy sources that influence in the pollution of vehicles ........................ 39
Figure 23: Econometric model (1 step) ....................................................................................... 41
Figure 24: Econometric model (2 step) ....................................................................................... 41
Figure 25: Econometric model (3 step) ....................................................................................... 41
Figure 26: Econometric model (4 step) ....................................................................................... 41
Figure 27: Econometric model (5 step) ....................................................................................... 42
Table 1: panel data base with Norway ........................................................................................ 43
Table 2: Panel data base without Norway .................................................................................. 44
Figure 28: Econometric model (6 step) ....................................................................................... 45
Figure 29: Econometric model (7 step) ....................................................................................... 45
Figure 30: GDP Gaussian curve ................................................................................................... 46
Figure 31: EEFH Gaussian curve .................................................................................................. 47
Figure 32: Econometric model (8 step) ....................................................................................... 47
Figure 33: Econometric model (9 step) ....................................................................................... 48
Figure 34: Econometric model (10 step) ..................................................................................... 50
Figure 35: Econometric model (11 step) ..................................................................................... 50

                                                                                                                                  5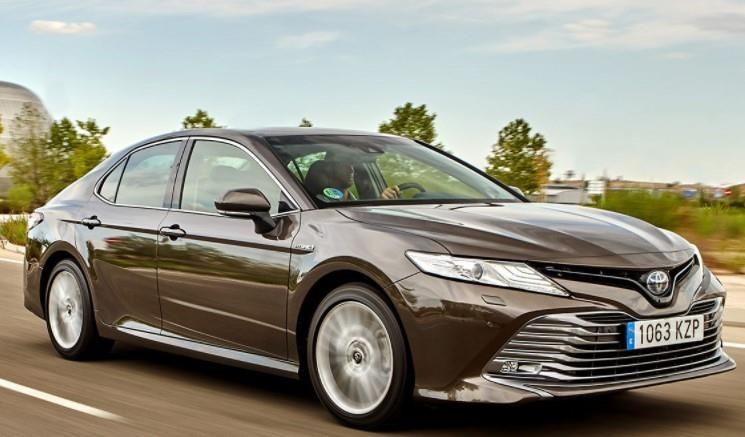
1 INTRODUCTION

The following research work is based on the study of the market of ecological products.
Exactly, about the transport sector that these days is having the best change in its live.
Currently most of the people, if we talk about electric cars have not good information,
overall due to their disinformation or ignorance. So, this could be one trouble to do not
buy this type of vehicle or probably they could be right?
Due to, the manufacturing of an electric car and the bad charging of the vehicle; For
instance, in Wyoming. Could pollute more than an internal combustion car.
In addition, we have reduced plenty of greenhouse gases emissions with solar roofs,
wind wills, power walls, power packs, electric or hydrogen batteries for transportation or
even hybrid cars. Nevertheless, all these incredible inventions are criticized by most
people, because there are expensive, have not got green energy at all or even in the
way that their production has caused a lot of pollution.
So, to achieve all these technologies we should have to be patient, humble and make a
big effort as we did at the beginning of our history. So, when we said “at the beginning
of our history” we were referring us about the transport history and their process or steps.
¡Therefore, everything comes!
However, the electric cars could be one more step in our history, because the hydrogen
companies have begun to appear in the transport market and even in the electric system
market to provide electricity to our houses also.
Currently, we have four Fuel Cell Vehicles (FCV), this name is referring to a hydrogen
car. So, in our roads we have the HONDA FCX clarity, TOYOTA MIRAI, HYUNDAI NEXO
and Mercedes GLC. All these companies work with one cell which is fed by the hydrogen
battery. Furthermore, this energy is also made for trucks, trains, ships and for airplanes.
But we are going to focus on vehicles because, there are more troubles for the use in
cars than for all the last ones. Besides, we will see that there are also problems in how
to obtain the hydrogen energy source and how to sell it in petrol stations.
Finally, we will develop and will make an objective study of these problems which the
most important fact is ¡do not pollute anymore!

                                                                                          6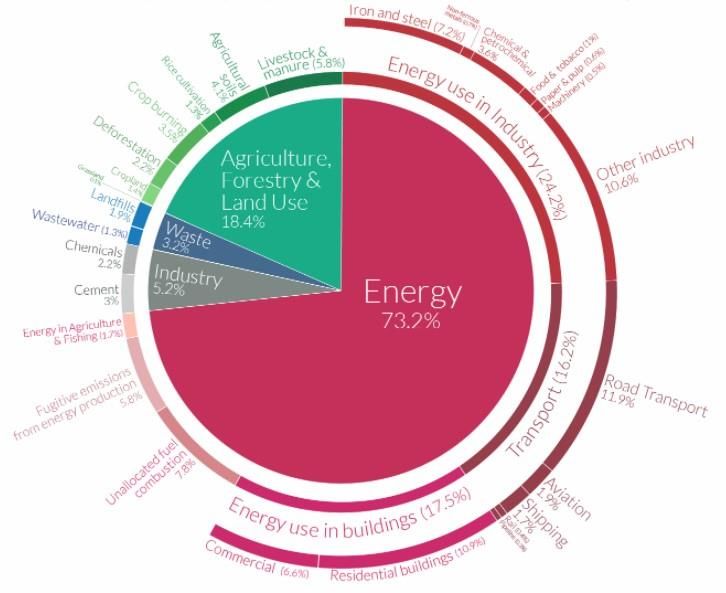
2 THEORETICAL FRAMEWORKS

2.1 THE EVOLUTION OF THE VEHICLE INDUSTRY

2.1.1 THE TYPES OF VEHICLE ENGINES

2.1.1.2 Steam vehicle

The history of the automobile and the evolution of technology have always gone hand to
hand. There were a lot of technologies until arriving at the hydrogen electric battery.
Nowadays it is unreal thinking about one steam car. However, Nicolas Joseph Cugnot
would think the opposite.
In 1763 this French engineer created the first steam car in the world “cugnot car”. The
idea was searching for a way to transport big artillery cannons. But as the famous proverb
says, “The beginnings are always hard”, we saw how the cugnot car crashed into one
house wall on the first test day.
Nevertheless, a British engineer whose name was James Watt, patented the “Firebomb”
in 1769. Also, he improved in a better way. This British engineer discovered that
coetaneous designs wasted a great amount of energy cooling and warming the cylinder
faster. Therefore, James watt introduced one better design “the capacity condenses” due
to cugnot car crashed.
Therefore, Great Britain nominated Richard Trevitthick as the first steam car inventor of
our history because the car was completely an engineering achievement, for the reason
that it could transport people and great issues for the military army without any problem.
However, it only reached the speed of 15 km/h in 1801.
In American Continent the first steam car arrived in 1803 by the hand of the inventor and
engineer of EEUU Oliver Evans.
Both inventors focused on the railway version because the steam train was invented
before and they wanted a transport that would not only move on rail but also on road.
The first retail chain (Massive production) was built in 1873 by Amedee Bolle who made
a school of selling steam cars as a dealer.

                                                                                        7
By the way, his first car was L’Obeissante2 and already contained independent front
suspension and gearbox3. Then De Dion Bouton (1883) Leon Serpollet (1887) and the
famous French engineer Armand Peugeot (1889) arrived and followed the retail chain
process of Amédée Bollée.
The first car racing in our history arrived in 1884 whose name was Paris Rouen, because
of course it was celebrated in Paris. Besides, the participation was that only seven out
of twenty-one cars had steam engines. However, various steam cars such as Leon
Serpollet achieved the speed of 120 km/h. Also, the Stanley twins from north America
achieved the maximum speed of 200 km/h.
Nevertheless, in 1889 without Leon Sepollet, was the end of the retail steam cars in
Europe. But in the American continent, exactly in EEUU, Stanley and some partners of
the steam engine continued to sell the steam car, approximately until 1902, with the last
car produced by Stanley in the Locomobile fabric4. However, these famous twins
continued producing cars, but he replaced the steam engine for petrol engines.
In 1960 plenty of brands studied the possibility of adopting steam engines again for
simple reasons such as the cheap fuel, was quieter when it works, because of its
combustion engine instead of explosion, and the emissions of gases, for the reason that
the greenhouse gas emissions were less than gasoline cars. However, they stopped
immediately, because the new inventions and projects in gasoline and diesel engines
worked, so this fact made the age of oil begin.

                             Figure 1: Cugnot's Fardier steam car of 1769. Source:
                        https://en.wikipedia.org/wiki/History_of_steam_road_vehicles

2
  Is the French name of the first steam road vehicle, built by Amédée Bollée
3
  Mechanical transmision
4
  Was an automobile manufacturer in the United States.

                                                                                       8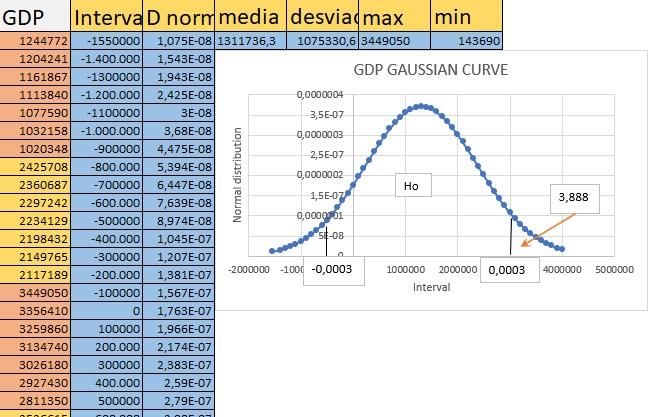
2.1.1.3 Gasoline and Diesel vehicle

The history of the internal combustion engine or the petrol engine began when the
external combustion engine or steam engine arrived at the end.
Therefore, first, we should know how the gasoline engine works. In fact, we must be
aware that the combination between air and gasoline inside the engine produces energy.
However, the real process is pressing the spark plugs 5until arriving at the explosion for
creating energy to move the wheels.
In 1860 the first internal combustion engine was built by the hand of the Belgium
Engineering Etienne Lenoir. This engine was fed by lightning gas, in other words, was
fed by burning solid fossil fuels. However, it only produced three percent of energy. But
this was the first step of evolution.

Figure 2: Internal combustion engine Etienne Lenoir (1896) Source: https://www.britannica.com/biography/Etienne-
                                                       Lenoir

In addition, in 1876 arrived the great development of Nikolaus Otto, therefore he
improved the energy power of the engine with a four-stroke cycle. Nevertheless, the
engine was bigger for the size of a normal car, creating an impossible place to install.
By the way, this engine was patented by Otto, although everybody in the world knows it
with the name of gasoline engine.

5
 Is a device that emits across a small gap creating the ignition for the combustion needed to start your
vehicle.

                                                                                                              9
Two years later, exactly in 1878, one invention appeared. This time with only two stroke
cycles but was the satisfactory gasoline engine who all people were looking for. In fact,
was made by the Scottish engineering Dugald Clerk. Therefore, we can say that this was
the first achievement of the gasoline vehicle history.
On the other hand, people were focused on building the first car without any problem.
However, to arrive at this point, we had to wait eight more years, exactly in 1886 by the
hand of the famous German engineer Karl Benz.
This important person achieved the German patent number 37435, and this patent was
the invention of the first gasoline vehicle in the world. By the way it contained three
wheels, with tubular chassis powered off at ⅔ of 250 rpm (revolution power per minute)
in other words, every time that the spark went up and down per minute.
However, a few months later the German engineer Gottlieb Daimler made the last
invention to the internal combustion engine. Therefore, he built a gasoline vehicle
powered by four wheels and two transmission speeds. The design was an open horse-
drawn carriage with two sparks in one engine and was positioned in the centre of the
vehicle.
Furthermore, in 1892 another German inventor whose name was Rudolf Diesel invented
an auto-ignition propellant that worked on heavy fuels. Therefore, there are differences
between gasoline and diesel engines. The fact is that the diesel is bigger and slower
than gasoline, even though it is cost of production is higher.
Nevertheless, the first easy diesel engines were uncomfortable because of their noisy
and their way of accelerating.
However, in 1923 the characteristics of the diesel technology engine were finally
achieved. Due to the successful MAN6 truck diesel engine test, which travelled from
Munich (Germany) to Barcelona (Spain) without problems.

6
    MAN is a German company that manufactures trucks and buses.

                                                                                      10
Figure 3 First diesel vehicle by Rudolf Diesel (1936) Source: https://www.diariomotor.com/noticia/primer-coche-
diesel-historia/
2.1.1.4 Electric and Hybrid vehicle
In the history of the electric car there was no one who built the battery engine and the
electric car at the same time. Therefore, was pretty much the same as the history of the
internal combustion engine car as we have seen. The fact was that to build the electric
car there were plenty of inventions, developments, and evolutions.
The first step was in 1828 by the hand of the engineer and inventor Anyos Jedlick from
Hungary. He was the first man to use the first electricity cell battery. In fact, he built one
small car module, as a toy car, moved by his electric engine. However, it was smallest
for transport people and big issues of transportation, even it had problems in its battery
exactly about charging their cells. For that reason, in 1834 Thomas Davenport and
Robert Anderson from EEUU built another small electric vehicle. However, the difference
was that this second one could work at least in a small circular circuit.
By the way, we have to say that in this period there were a few independent rechargeable
power sources. Therefore, they had a limited usefulness as a means of transportation.
Finally, the world had to wait until 1859 by the hand of the French physicist Guston Plante
who developed the lead battery, but it was not enough. So, in the meanwhile the
technology was growing until 1881 with the help of another French engineer Camille
Alphonse Faure who improved the capacity of cells. Therefore, this caused a massive
battery engine production of industrial scale with a reliable and rechargeable energy
source.
These were the first inventors, developments, and evolutions of the electric battery
engine since nobody achieved the goal of putting the battery engine in a vehicle.
11Nevertheless in 1867 people were celebrating the world exhibition of engines in Paris
and Franz Kravogl, an engineer from Austria, presented his electric prototype car. The
result was two electric wheels but not very reliable. However, this fact was the beginning
of the evolution of the electric car. Therefore in 1884 the British inventor, Thomas Parker
built the first electric car of production. Parker fed his car using a good size and a great
capacity for rechargeable battery cells.
In American continent, exactly in EEUU by the hand of William Morrison de Des Moines
developed one electric car for six passengers that raised the speed of 24 km/h.
Nevertheless, people were not interested in these types of electric engines. They were
more vigorous with other engines like gasoline or steam.
However, it was a great era of technology and as we could see a few years later the
interest of people in electric vehicles came back in 1900 and little by little his numbers of
sales were growing until 2006. In fact, it was the boom year of the massive electric car
production overall in EEUU and Europe by the hands of TESLA7 and Toyota.
By the way, we have to be aware that in 1890 W.H.Patto had the idea to build a tram
with hybrid power in series combining gas and electric engines.
In fact, the idea appeared because of the short autonomy of electric vehicles and the
inconvenience of the weight.
Therefore, in 1896 the British H.J.Dowsing and L.Epstein patented the parallel hybridity.
By the way, they turned the idea into one historical fact combining gasoline and electric
engines in the Arnold Dinamo Vehicle and this was the first hybrid car in the world. So,
the advantages were the combination of these engines, making the easy start of the
gasoline engine and recharged batteries.
Therefore, we have made a video to explain the difference between plug-in hybrid
electric and normal hybrid vehicle.
7
Is a USA company that design, manufactures and sell electric vehicles, electric components and
domestic batteries.
12Figure 4 Plug-in electric hybrid vehicle & author of thesis (2021). Source:
www.youtube.com/watch?v=EU742AtURnc&t=37s
(Here is the link to access to watch the video
https://www.youtube.com/watch?v=EU742AtURnc&t=37s)
2.1.1.5 Hydrogen vehicle
The history of hydrogen vehicles seems very current. However, we must go back until
1966 for the reason that, General Motors 8developed and researched for carrying out the
world’s first test of a hydrogen powered car, which name; Electrovan. In fact, it was a
van because of the size of the vehicle allowed to install the hydrogen engine. By the way
the test had two important inconvenient; the first one due to the expensive cost of making
a car, in fact the issues, materials and the pieces of the battery were limited. Then the
second one was the inefficient hydrogen stations.
8
Opel’s global partners automobile group
13Nevertheless, the history of the hydrogen vehicle stopped in 1966, but it appeared again
in 2012 with a lot of faster developments according to GM, Tesla, Honda, and Toyota.
Due to its long autonomy as the gasoline and diesel engine besides because it did not
pollute at all compared to other engines.
Therefore, the inconvenience of few hydrogen stations persists nowadays. Therefore, it
costs plenty of money and time for governments even being a necessary fact to reduce
the principal polluted sector in the world, the transport.
Nevertheless Toyota, Honda and Mercedes are betting on hydrogen vehicles, currently
doing a great example to fight against the organisations and countries that never wanted
to try to pollute less and signing important ecological deals such as Russia, China, India
or EEUU.
Figure 5: First hydrogen vehicle (Electrovan) by GM (1966). Source:
https://www.hydrogencarsnow.com/index.php/gm-electrovan/
142.1.2 TECHNOLOGICAL IMPROVEMENTS FOR THE MITIGATION OF
GREENHOUSE GASES
2.1.2.1 Transport sector pollution
The pollution in the atmosphere is one of the biggest problems nowadays in our lives.
Due to, is causing the worst problem of global warming. Therefore, the reduction of
greenhouse gas emissions (CO2) has become one of the most famous objectives
currently in all over the world. Overall, for all Governments, Institutions and
Organizations. As you know, it is the gas that pollutes more. However, there are others
like sulphur dioxide, nitrogen dioxide or hydrogen peroxide, for that reason we are going
to split first the pollutants and then describe them.
• Primary pollutants are the gases that have direct contact with the atmosphere
such as CO2, SO2, NOX… They come from various sources like from traffic,
industries, manufacturing processes etc. However, we cannot reduce it at all,
despite some greenhouse gas emissions. For instance, including a filter in your
car, or burners with few NOX emissions.
• Secondary pollutants are the gases that are made by physic-chemical processes
around the atmosphere. Usually, these gases come from the primary pollutants.
Therefore, the correct mitigation for these is reducing the greenhouse gas
emissions of the primary pollutants exactly at the source. Due to the gas
generation such as NO2, HNO3, H2O2, O3 etc
We had to figure it out from where the greenhouse gas emissions came from to be aware
that the world emits around 50 billion tonnes of carbon dioxide each year, due to 1,2
billion of vehicles. This was the first reason and the most important one. But there are
plenty of others.
In fact, the CO2 is the dioxide that pollutes more specially in transports and energy
sectors. Nevertheless, we are going to focus on the pollution of the transport sector.
Apart of being the highest second pollutant sector in general with 16,2% we must be
aware that dividing into industry sections such as rail, shipping, or aviation, we could say
that the road transportation or the automobile transportation is the industry section that
has the highest percentage of greenhouse gas emissions from all industries with a
number of 11,9%. In fact, this pollution is as we have mentioned at the beginning
because of the burning of petrol and diesel. By the way we can split the emissions of
sections, such as the 60% of road emissions coming from passenger travel and the
15remaining 40% from road freight instead of burning petrol and diesel to move the wheels.
So, all automobile companies have created, since 2006 until nowadays, electric energy
using batteries as engines, saving plenty of greenhouse gas emissions.
Then, the second industry sector that pollutes more exactly with 10,9% of pollution is the
residential building. These emissions are correlated with the energy that is provided from
the electricity companies and water companies such as Iberdrola and Facsa, both are in
the Spanish country, but in some places are others. Therefore, these companies
generate electricity for lighting, appliances, cooking, and heating at home. However, we
can generate electricity by solar roofs or solar panels, for the reason that each of them
can recharge one big electric battery cell that provides electricity from lightning,
appliances and heating at home. But at least, the most important thing is that finally we
reduce and save a lot of greenhouse gas emissions.
Figure 6: Global greenhouse gas emissions by sector (2016). Source: https://ourworldindata.org/emissions-by-sector
Therefore, as we have divided at the beginning. We must split two types of pollutants
dioxide also that produce the transport sector.
16• The first one as we all know is carbon dioxide because it is affecting global
warming directly, due to the emissions that are immediately in contact with the
atmosphere and causing greenhouse gases emissions.
• The others are more complex because they are harmful to human health such as
nitrogen oxides (NOX), carbon monoxide CO) unburned hydrocarbons (HC), lead
compounds, sulphur dioxide and solid particulates. Even these last ones have
the worst consequences for people that are in big cities.
Nevertheless, nowadays these greenhouse gas emissions have decreased due to
electric vehicles. Although they are still polluting carbon dioxide but in an indirect way to
the atmosphere. Considering its manufacturing process of building electric batteries as
a pollution generator. However, for sure less than gasoline, diesel, and hybrid emissions.
For that reason, we are going to compare the greenhouse gas emissions between these
types of vehicles that I show you in the table below.
However, there are a lot of inconveniences such as the size, weight, and revolutions per
minute. Nevertheless, we have chosen plenty of vehicle models to be aware and to have
an idea of how many emissions are emitted each model. Furthermore, some additional
information to know about the median of carbon dioxide emissions in a gasoline vehicle
is around 143 g/km. Therefore, compared to an electric vehicle the bad emissions are
between 47% and 53% less than the gasoline vehicle. Then, compared to a hybrid
vehicle the reduction of carbon dioxide emissions is 36% less. Besides, hybrid car
pollution is 92 g/km of CO2. Finally, diesel vehicles pollute 120 g/km approximately 19%
of Carbon dioxide emissions less than gasoline vehicles.
Figure 7:Consume and emissions of co2 of some vehicle models. Source: https://www.motor.es/noticias/coche-electrico-
contamina-201737700.html
17Considering these databases from IDAE (Institute for energy saving and diversification)
however, these capital letters are referring from the institute of Spain (Instituto para el
Ahorro y la Diversificación de la Energía) So we can say that there are officials and easy
to figure it out by people due to the information that are provided by the manufacturers.
Nevertheless, all people are aware about these databases in real life because these
consumptions increase between 10 and 20% depending on the conditions of use. In fact,
the real carbon dioxide emissions increase in all models, even until 20%. For that reason,
this Seat Ibiza that has been made to fight against the bad emissions of diesel in 2015.
Probably, are emitting 135g/km of carbon dioxide emissions, instead of 112% g/km
officials.
2.1.2.1 How much does each engine pollute.
After looking for information about transport sector pollution on the road, we have
realised that numbers of pollution can change in vehicles. Due to the size and weight of
models, even because of how new the models are and how clean they are. Furthermore,
we can say that depending on the state of the asphalt or pavement road conditions, one
vehicle can pollute more or less. Therefore, we have checked it and exist plenty of
sources to determine exactly the emissions that produce one specific vehicle during his
journey.
Nevertheless, we are trying to compare the four engines in their total characteristics that
we have analysed during the evolution of the vehicle industry, such as the autonomy,
the cost of fuel and how much a vehicle pollutes.
By the way, we should focus on the same models of each engine to be in an equal way
without advantages and disadvantages. But we know that there are not exist one
identical model for each engine. Therefore, we are going to approximate the kilograms
of vehicles.
For that reason, we have chosen as a pure electric vehicle a Tesla Model 3 Standard
Plus RWD whose cost is 49.980€ and has a 4.694mm of length, 1.443mm of height,
1.849mm of width and 1.726kg of weight. Furthermore, this car has an electric power of
306 hp (horsepower) with a maximum speed of 225km/h and its acceleration from 0 to
100km/h is 56 seconds. A part of that the Tesla Model 3 Standard has an autonomy of
419km. Number that increase a little bit during the time, although this model had plenty
of technological improvements. Moreover, another characteristic is how much the charge
cost.
18Therefore, currently in a supercharger station to charge a Tesla Model 3 Standard with
his 419km. In fact, the total cost is 16.00€, exactly is the cost to travel from the University
Jaume I (Castellon) to Las rozas (Madrid)
So, in other words the cost of 1 kilowatt per hour is 0,14€ of charging and the Tesla
Model 3 standard consumes 28kwh per 100km. Therefore 28 · 0,14 = 3,99€/100km now
we should multiply 3,99 · 4 = 16.00€ approximately. Furthermore, on the road a Tesla
Model 3 Standard does not pollute any emissions of carbon dioxide or even bad health
emissions such as nitrogen dioxide (NOX) if it is charge by renewable energy. To sum
up, we could say that the electric vehicle has a short autonomy 419km and the charge
is cheaper but slower. Therefore, you could spend 4 hours in your house charging or 30
min in superchargers9, even though this is slower than the intern combustion engines.
Figure 8: Tesla Model 3 Standard Plus RWD. Source: https://www.km77.com/coches/tesla/model-
3/2018/sedan/estandar/model-3-traccion-trasera-autonomia-estandar-plus/datos
Also, we can include the Hydrogen vehicle with the same characteristics as the Tesla
Model 3 Standard such as Toyota Mirai Cell Fuel Hydrogen (FC) with 1850kg of weight,
something more than the electric vehicle but pretty much the same in all his numbers.
Besides, the vehicle emits zero emissions of carbon dioxide in all his processes and
even in his rolling. Also, it has a long autonomy, and the time of the charge is faster like
the intern combustion engines, exactly 5 minutes.
9
Electric stations, where electric vehicles can stay between 30 min or 4 hours charging.
19Figure 9:Toyota Mirai Cell Fuel Hydrogen (CFH). Source: https://www.km77.com/coches/toyota/mirai/2015/4-
puertas/estandar/mirai-2015/imagenes
A plug-in hybrid electric vehicle (PHEV) with similar conditions could be Toyota Camry
220H Advance whose cost rose 38.450€, 10.000€ less than the electric vehicle.
Furthermore, it has a maximum speed of 180km/h, therefore is slower than the electric,
also it has a length of 4.605mm, a width of 1,845mm, a height of 1.675 and a weight of
1.670kg a little bit less heavy than the Tesla Model 3 standard. Besides, it combines two
autonomies 1.146 (gasoline) and 50km (electric). A part of the charge time in
superchargers is 30 min but at home the duration is 4 hours, and the cost is 0,15€ per
kilowatt hour. Therefore, the Toyota Camry plug-in Hybrid electric vehicle 2020H
Advance has a power of 152hp in terms of gasoline engine and 112kwh in terms of
electric engine. So, the cost of 1 kilowatt per hour is 0,15€ in Spain as we have said,
therefore if we multiply 112kwh per 0,15€ would be 16,8€. Furthermore, the median
consume is 2 litres per 100km.
Equation 1: cos of refuelling the inter combustion of a PHEV. Equation 2: Cost of refuelling the electric part of a PHEV.
20In addition, a plug-in hybrid electric vehicle as Toyota Camry 220H Advance with 1.670kg
of weight pollutes 35 grams of carbon dioxide per 1 kilometre. So, if we have based the
quantity of pollution according to the example that we talked that was the journey from
the University of Jaume I (castellon) to Las rozas (Madrid) will be 35 · 418km = 14.630
grams of carbon dioxide will pollute this plug-in hybrid electric vehicle in Spain.
By the way I said Spain because depending on the electric energy supplied by each
country it can cost and pollute.
Figure 10: Toyota Camry 220H Advance.
Source: https://www.km77.com/coches/toyota/camry/2019/estandar/advance/camry-220h-advance/datos
On the other hand, a normal hybrid in this case we have chosen a BMW 520d berlina
with similar autonomy, length, height, compared to the plug-in electric hybrid vehicle
(Toyota Camry 220H Advance) and has a weight of approximately 1.670kg.
By the way, the first advantage is that it can spend less time refuelling, because refuelling
a normal hybrid vehicle is the same as refuelling an internal combustion vehicle such as
gasoline or diesel. Therefore, the cost of refuelling his 950km of gasoline autonomy
would be taking the reference in Spain of the cost per 1 litre of gasoline that is 1,30€ and
taking the median consume of the vehicle per 100km which is 5,3L.
Therefore, we will calculate a rule of three to know how much cost refuelling the entire
container of a normal hybrid vehicle.
21Equation 3: Total cost of refuelling a normal hybrid (1700kg)
Nevertheless, a normal hybrid vehicle has a combination of gasoline and electric engine.
Therefore, this electric engine helps to save autonomy and combustion for the car. Since
when the vehicle is stopped and when it is accelerating for the first time. Then it changed
to a normal gasoline vehicle.
So, this is the principal reason why these types of vehicles have the stick of ECO vehicles
and not the stick of 0% emissions, therefore this is an important disadvantage with
respect to the plug-in hybrid electric vehicle.
Moreover, talking about carbon dioxide emissions per kilometre this vehicle pollutes
exactly 119kg/CO2 per kilometre. Therefore, if we use our example from the University
of Jaume I to Las Rozas with 418km. We will know how much a normal hybrid vehicle
pollute. So, if we multiply the km of the journey per the grams of CO2 that pollutes the
car, we will achieve the result, therefore 119 · 418 = 49.742 grams of carbon dioxide,
however we must be aware that is not an exact number due to, the help of its small
battery. Therefore, could be between 35.000 and 45.000 grams of co2.
Figure 11: BMW 520d Berlina. Source: https://www.km77.com/coches/bmw/serie-5/2017/berlina/estandar/520d-
berlina3/datos
22On the other hand, the diesel vehicle with similar conditions and characteristics that we
have chosen is a Volkswagen Tiguan 2.0 TDI 110kw (150hp). This diesel vehicle has a
cost of 27.700€ and with this price we could say that is the cheapest one. However, it
has a maximum speed of 204km/h pretty much the same as the others. Also, we could
confirm that it has similar length 4.486mm, wide 1.839mm, high 1.654mm and similar
weight 1.677kg. Furthermore, the car has an acceleration from 0 to 100km/h of 9,5
seconds, due to his power of 150hp. Moreover, to be exact the vehicle has between
3.500 and 4.000 revolutions per minute. Besides, the Volkswagen Tiguan 2.0 TDI 110kw
(150hp) has a consumption of 4,7L/100km. So, if the autonomy of the vehicle is 1.059km,
the total consume will be 4,7 · 10,59 = 49,773L therefore if the price per 1 litre of diesel
today (29/03/2021) is 1,184€/L the cost of refuelling the diesel container will be 49,773 x
1,184 = 58,93€
Equation 4: Total cost of refuelling a diesel vehicle (1700kg)
Nevertheless, the impact of carbon dioxide in the atmosphere is 123 grams of CO2 per
Kilometre is a lot. But diesel vehicles have polluted even more in nitrogen oxides, which
is harmful for the health of people, with a number per kilometre of 165 grams of NOX.
Moreover, in terms of carbon dioxide emissions and sticking to our example from
Castellon to Madrid (418km) a diesel with 1677kg pollute exactly 123 · 418 = 51.474
grams of CO2 in this total journey.
23Figure 12: Volkswagen Tiguan 2.0 TDI 110kw (150hp).
Source: https://www.km77.com/coches/volkswagen/tiguan/2016/estandar/edition/tiguan-2016/datos
The last but not at least, we have analysed the gasoline vehicle with similar qualities. In
this case we have chosen a BMW x4 drive 20I as a reference to compare it with a Tesla
model 3 Standard with 1700kg as we did with the diesel, plug-in hybrid electric vehicle,
normal hybrid vehicle and the hydrogen vehicle. Therefore, this diesel car has similar
skills and characteristics such as the length with 4.752mm, the width with 1.918mm, the
weight with 1.621mm and the weight 1795kg. However, the price of the BMW x4 drive
20I is a little bit more expensive than the others with a cost of 53.000€. Furthermore, it
has a maximum speed of 214km/h and his acceleration from 0 to 100km/h is in 8,3
seconds. Besides his autonomy is 915km due to his media consumption of 7,1L/100km.
Therefore, if the cost of 1 litre of gasoline today (29/03/2021) is 1,304€ the cost of
refuelling the entire container will be: 915km per 7,1L/100km is equal to 6.496,5 then
divide this amount by 100km and the result is 64,96L/915km finally multiply 64,96L per
1,304€/1L of gasoline and the result would be 84,714€
Equation 5: Total cost of refuelling a gasoline vehicle (1700kg)
On the other hand, we must be aware about how much a vehicle that has more than 320
years in our roads pollutes. Therefore, this vehicle specially pollutes 163 grams of CO2
per 1km. So according to our example from the University Jaume I to Las rozas (418km)
24we can calculate that in this journey this vehicle could pollute 163 · 418 = 68.134 grams
of carbon dioxide.
Figure 13: a BMW x4 drive 20I. Source: https://www.km77.com/coches/bmw/x4/2018/estandar/estandar/x4-
xdrive20i/datos
2.1.2.2 Internal combustion manufacturing process pollution
All people must be aware that a part of carbon dioxide emissions carried out by vehicles,
also exist the pollution of the manufacturing process, exactly in how to subtract the crude
and how it turns into oil. This refers to an internal combustion vehicle as diesel or
gasoline. Nevertheless, there is another bad part of how to subtract the lithium and how
this material turns into a battery cell combined with cobalt.
In this case we are referring to electric vehicles or plug-in hybrid vehicles (PHV). That
combines the bad of both parts but not with the same intensity of pollution as a total
internal combustion or a normal hybrid vehicle.
Nevertheless, there is no pollution in the manufacturing process to produce containers
of hydrogen fuel cells. It is not the same cells with lithium as we have seen with electric
vehicles.
However, we should know how and how much we pollute directly or indirectly to the
atmosphere. Therefore, all began when human people preferred vehicles powered by
internal combustion engines instead of steam or battery cells.
According to the first step of the Internal combustion vehicle manufacturing process is:
subtracting crude oil that is in 1800m underground or also it can be subtracting under
2510
the seabed. Therefore, exist suckers rod pumps that work with an electricity network
energy in the underground but with diesel or gasoline engines in offshore platforms. This
last energy pollutes a lot because it is working plenty of hours during the day. So, this
sucker rod pump needs exactly 332kwh per day or 9.960kwh per month.
An important fact is that in EEUU there are 435.000 oil wells that use sucker rod pumps,
and they have a consumption of 4.300-gigawatt hour per month.
On the other hand, the first process in deep waters is subtracting with oil platforms crude
oil and transporting it to refineries. Furthermore, these refineries where the crude is
turned into oil, require a high temperature to burn the crude oil. Besides they achieved it
with an electricity grid energy or internal combustion engine. An important fact is that a
sucker rod pump on the high seas consumes 20 or 30 tons of diesel per day.
Therefore, imagine a Ford Fiesta vehicle with a diesel combustion engine which has
1.200kg. Well, suppose that this type of car makes one trip per day of 60km. According
to my experience it is a normal trip to go and come back from my town La Vall D'uixo to
my University Jaume I of Castellon.
So, the consumption is 5 litres of diesel and during the journey polluted 90 grams of CO2
per kilometre. Therefore, the pollution per day is 90gco2k/km · 60km = 5.400 grams of
CO2. So according to the consumption of a sucker rod pump per day we could calculate
the pollution of it that moves a dynamic plunger per day by an internal combustion diesel
engine.
As we expected is an autogenous due to if we turn into the 25 tons of diesel, that
consume a sucker rod pump per day to litres. So, we will obtain with a rule of three and
knowing that 1 litre of diesel is 0,85 kilograms that.
Aquation 6: Total kg per day that consume a sucker road pump.
10
It is a tool for extracting crude oil from the ground.
26So, the journey is moving the dynamic plunger which weights around 300kg, up and
down stroke of 5,00 metres. So, with a rule of three we can calculate how much a sucker
rod pump pollute every time that goes up and down (0,005km · 22,5gco2/km / 1km =
0,1125 grams of CO2). The number of 22,5 is the grams of co2 per 1 kilometre that a
dynamic plunger of 300kg pollute. Consequently (300kg x 90gco2 / 1200kg = 22,5
gco2/km)
Equation 7: How much a sucker road pump pollutes Equation 8: How much a sucker road pump
during its journey going up and down (0,005km) pollutes according to its weight.
Therefore, if in 1 minute the sucker rod pump move its dynamic plunger 65 times, we
can calculate the distance and the pollution in 1 minute 0,005km · 65 = 0,325km
multiplied by 22,5g/co2 per km = 7,31gCO2 this number is with a weight reference of
300kg that is the dynamic plunger. By the way, the number 90 is the pollution of a diesel
car of 1200kg.
So, in a day will be 93.600 times (24h x 3.900times of 1h = 93.600 times of 24h) that it
goes up and down therefore we should multiply this by the km of 1 time 93.600 · 0,005
= 468km and then by 22,5 and we will obtain a pollution of 10.530 grams of CO2 per day
the same as diesel vehicles with a journey of 60km per day.
One important fact that we should say is that, in the world there are 1.470 oil wells in
deep waters generating 6.191.640 grams of CO2 per day.
A part of subtracting the crude oil in oil wells and oil platforms, we must be aware that
the next step of the manufacturing process is to transport the crude oil with boats and
trucks to refineries. This step also causes pollution due to transport powered by diesel
combustion. Even they use the heaviest diesel because there are limited rules of
transport pollution in the sea. Furthermore, catastrophes caused by these types of
transports and failures of engine oil platforms are harmful for wildlife and the
environment. The catastrophes are oil spills in the ocean and oil platforms explosions
and burnings.
Also, instead of transporting the crude in diesel ships or diesel trucks, we can transport
the crude by pipelines. These ducts are regenerated by electric grid energy.
27By the way, one important fact is that in the maritime transport its pollution is
1.000.000.000 tons of carbon dioxide per year and 10% of that is contributing to the
transport.
Due to these ships that pollute so much, there are some countries that do not allow work
near its coastal area. Finally, they must be towed by boats, to transport the barrels of
crude to the refineries,
The process of oil refining requires plenty of energy. Therefore, the manufacturing of oil
processes pollution even more. Due to burning crude oil until 420 degrees Celsius.
An important fact is that they are refining by electric grid power and internal combustion
energy and this causes pollution also.
Then the next step, after the crude oil refining, is to deliver it by tanker truck also powered
by an internal combustion engine until arriving at petrol stations there are oil tanks
refuelled by these tanker trucks of oil crude refining to finally give oil combustion to every
vehicle in the world.
Nevertheless, we must be aware about building an internal combustion vehicle. In this
case building the parts of a gasoline or diesel car will be less polluting than building an
electric vehicle.
Even it could be 70% less polluting because the problem as we have analysed is the
way of how to subtract the combustion but not the manufacturing process of building the
vehicle with all the parts with its interior and bodywork, overall, in building the lead
battery.
Consequently, is because the engine of the combustion car is made of strong metals
such as steel and cast aluminium. For that reason, achieving all these metals pollutes a
lot. But less than an electric vehicle, obviously with the same size and weight.
Figure 14: Lifecycle of vehicle pollution (150.000km).
Source: https://ec.europa.eu/clima/sites/clima/files/transport/vehicles/docs/2020_study_main_report_en.pdf
282.1.2.3 Electric manufacturing processes pollution
We have mentioned at the beginning that an electric vehicle cannot pollute the road, and
this is not 100% true. We must be aware of the energy of a battery, exactly If a battery
of an electric vehicle is recharged by coal, oil, or nuclear energy. This will have bad
consequences of polluting directly to the atmosphere emitting carbon dioxide emissions
during its journey.
However, if the energy batteries are recharged by renewable energy sources such as
solar, wind, biomass, or hydroelectric energy, we can say that the electric vehicle will not
pollute anymore on the road.
So, depends on countries and their power plants because the process is the same as
recharging a computer in your house. If the power plant is recharged by clean energy
your computer will not pollute. However, if your country uses polluting energy in its power
plants your computer will pollute.
Nevertheless, even an electric car recharged in whatever country will pollute less than a
gasoline or diesel combustion vehicle in general. For instance, in occidental Europe
countries is 500 grams of carbon dioxide per kwh and obviously that in this case an
electric car will pollute less but if we manufactured in China exactly in Shanghai where
the first energy source is coal with 80.4%, we can see that even like this, an electric car
will pollute less than an internal combustion.
Figure 15: Lifecycle of electric vehicle manufactured and drived in EU and Lifecycle of electric vehicle manufactured
in China and drived in EU.
Source:
https://www.transportenvironment.org/sites/te/files/downloads/T%26E%E2%80%99s%20EV%20life%20cycl
e%20analysis%20LCA.pdf
29However, we are focusing on the electric manufacturing process pollution of electric
vehicle. The simple fact of building is polluting between 15 and 20 tons of CO2,
depending on the models due to its size and weight can change the quantity of
emissions.
In fact, it pollutes a little bit more since the electric engine is made of strong metals such
as steel and cast aluminium like an internal combustion engine.
But this is not the important fact due to exist other metals savings in cells of an electric
battery, whose name is Ions of lithium, anode, that is a circuit of metal oxide and cathode,
that it could be graphite or maybe the new chemical element that is silicon, moreover
there are a liquid whose name is electro lithium that splitting the anode and cathode.
Both combined, anode and cathode, show that the battery can work positively,
consuming and boosting a vehicle or negatively recharging the battery, when the driver
comes to brake the car.
These metals do not pollute anymore when it comes to work if they are recharged by a
renewable energy source. Otherwise during its manufacturing process of subtracting the
lithium, of course these metals pollute directly to the atmosphere. Therefore, an electric
vehicle can pollute more during its manufacturing process. Although it depends on size
and weights of the battery cells you want to install for the vehicle, because it can obtain
lithium inside the battery and it can pollute to the environment.
An important fact is that a Tesla model 3 Standard with a weight of 1700kg generates 65
kilograms of lithium in his battery cells.
Figure 16: Battery metals for manufacturing an electric vehicle. Source:
https://ec.europa.eu/clima/sites/clima/files/transport/vehicles/docs/2020_study_main_report_en.pdf
30Moreover, to know about the production of an electric car, we must be aware that an
electric vehicle requires more energy to manufacture it. Due to the great capacity of
lithium batteries that they have under the body.
So, it is evidence that one company spends more energy to build one electric, because
they do not share components as an internal combustion vehicle does. For instance,
Porsche, Volvo, Volkswagen, and Jaguar have the same platform to share these
components and reduce costs of manufacturing, cost of energy and therefore they
pollute less in the manufacturing process.
Nevertheless, little by little we could say that the electric vehicle will cover most of the
manufacturing process in industries and will pollute less. Because also electric
companies can share components by making deals between electric brands that work
with the same materials and platforms.
But currently, we must be aware that an electric vehicle and plug-in hybrid electric
vehicles are the principal cars that pollute more in the manufacturing process between
15kg of CO2 and 20kg of CO2. Then exist the normal hybrid and the internal combustion
vehicle that pollutes less between 10kg of carbon dioxide and 15kg of carbon dioxide.
However, we have not included the subtracting of lithium.
By the way the manufacturing process of an electric vehicle is subtracting the reactive
metal (Lithium) that is necessary for the use of every battery in the world. Therefore, this
process pollutes in two parts. The first one is because of the environment, including
deforestation and the second one is because it pollutes in direct contact with the
atmosphere.
Furthermore, this reactive metal is very well cared for because it reacts in a bad way with
the oxygen and the water. However, it is transported to big factories and laboratories to
manufacture electric battery cells and subsequently all the components of an electric
vehicle.
The good news is that instead of an internal combustion that lost all the combustion. The
components of batteries cell are recycling.
31Figure 17: Components of a lithium battery. Source:
https://ec.europa.eu/clima/sites/clima/files/transport/vehicles/docs/2020_study_main_report_en.pdf
According to Ricardo’s consulting Life Cycle Assessment informs of CO2 emissions for
a vehicle production by vehicle system and overall life cycle impact. We could say that
gasoline and diesel vehicles are the most polluting cars in a 150.000km of life. Otherwise,
an electric vehicle and a plug-in hybrid Electric Vehicle are the others that pollute less
directly to the atmosphere. Due to the 70% of the combustion of gasoline or diesel
vehicles expire and only the 30% is used for power. However, electric vehicles use 95%
of the energy consumed by the battery. Overall depending on which country, the car is
charged. It could pollute, so according to this information Ricardo’s consulting is based
on United Kingdom energy sources. Therefore, an electric vehicle in the UK can pollute
300 grams CO2 per kwh.
Otherwise, if we talk about the carbon dioxide emissions in vehicle production, we note
that they are the internal combustion vehicles that emit less CO2 emissions to the
atmosphere. Manufacturing an electric car costs a lot of energy as we have mentioned.
By the way another fact, depending on where the company is located, will also pollute
depending on the energy sources of the country.
Consequently, the source of Ricardo’s consulting is a great example to identify that
manufacturing a battery is very difficult and expensive. That's the reason why an electric
vehicle is in the top pollutants in the manufacturing process phase, however in general
it turns into the lowest one.
32You can also read