Informal document WP.5/GE.3 (2021) No. 1 - UNECE
←
→
Page content transcription
If your browser does not render page correctly, please read the page content below
Informal document WP.5/GE.3 (2021) No. 1
                                                                                               Distr.: General
                                                                                               19 April 2021

                                                                                               English only

Economic Commission for Europe
Inland Transport Committee
Working Party on Transport Trends and Economics
Group of Experts on Assessment of Climate Change
Impacts and Adaptation for Inland Transport
Twentieth session
Geneva, 22 and 23 April 2021
Item 2 of the provisional agenda
Initiatives in climate change impact assessment and adaptation for
inland transport

                Current state of knowledge on the evolution under Climate
                Variability and Change (CV&C) of the potential hazards for
                inland transportation (Draft)1

                Submitted by the University of Aegean

1 Introduction
A well-functioning and resilient transport sector is vital to the global, regional and local economic and social development,
as well as for supporting regional and global cooperation and integration. Well-developed, efficient, safe and secure inland
transport systems offer important access to markets, employment, education and basic services critical to poverty
alleviation; at the same time, transportation is a major driving force of the growing world demand for energy and has a
significant environmental footprint. As a cross-cutting sector, transport will play a critical role in the efforts towards
achieving the 2030 Sustainable Development Goals (SDGs) 2. Integrated approaches and policies should be fostered for
transport infrastructure development and land use planning, with a view to providing an accessible, affordable, safe,
secure, and cost and energy efficient transport.
Transport sustainability is shaped by socio-economic, demographic and environmental trends. Significant changes in
population size, age structure, household size and urbanization are expected in the 21st century, which may have serious
implications for the inland transport demand and patterns; these will be further complicated by Climate Variability and
Change (CV&C) 3. There are five recognized dimensions of sustainable transport (ECE, 2015): accessibility, affordability,
safety, security and environmental impacts from transport and on transport. Accessibility refers to the ability to reach

            1   This draft review was prepared by Adonis F. Velegrakis, University of the Aegean, Greece.
            2   Many of the 17 2030 Agenda for Sustainable Development Goals (SDGs) depend on a well-functioning
                and resilient transportation; Goal 9 (‘Build resilient infrastructure, promote inclusive and sustainable
                industrialization and foster innovation’) refers directly to resilient transport infrastructure.
                https://sustainabledevelopment.un.org/content/documents/21252030%20Agenda%20for%20Sustaina
                ble%20Development%20web.pdf
            3
                Climate Variability and Change refers to the variability and sustained change of climatic
                conditions relative to a baseline period (e.g. 1961–1990, 1986–2005 or 1981–2010).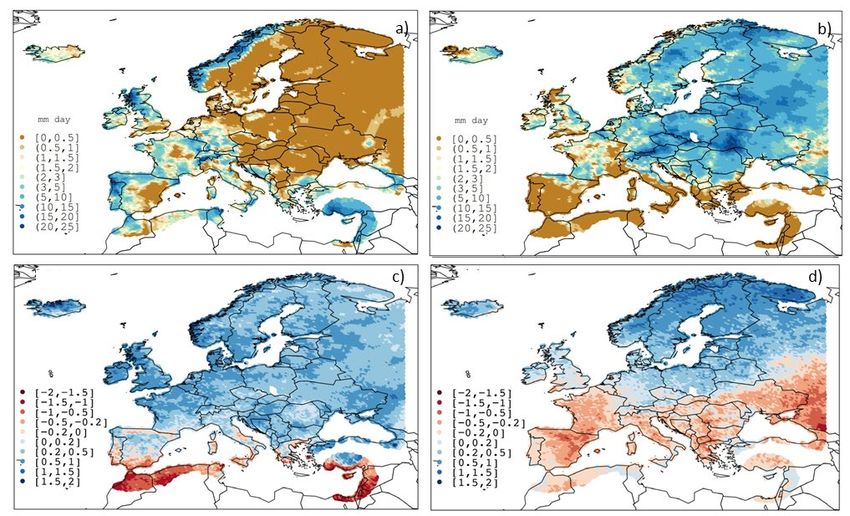
Informal document WP.5/GE.3 (2021) No. 1

goods, services, activities and destinations from a given location using the available transportation system; many factors
affect accessibility, such as demographics and transport needs, connectivity 4, transport option quality, land use patterns
and resilience of transport infrastructure and operations against climatic perturbations. Affordabilty, which refers to the
ability of individuals and societies to access adequate and affordable transport services, is controlled by the costs (and
returns) of passenger and freight transport services and the sustainability of the investments related to the maintenance
and upgrading of existing and/or the planning and construction of new transportation infrastructure. Transport safety and
health issues can be serious social, economic and development threats 5, whereas transport security deals with acts ranging
from ordinary damage infliction and delinquency to acts of organized crime and terrorism directed towards the transport
infrastructure, passengers and freight; security is a particular challenge for inland transport 6. Finally, (inland) transport
can affect or be affected by the environmental conditions in many ways and at different spatio-temporal scales.
Transportation needs energy, emits pollutants and requires infrastructure that involves extensive land use and, thus,
potential loss of natural habitats. It is also both a major contributor to carbon emissions and a heavily impacted sector by
the Climate Variability and Change (CV&C), with impacts varying by climatic factor and mode.
Efficient inland transport networks (roads, railways and inland waterways), as well as their connecting coastal nodes
(seaports) are instrumental to the movement of people and to (international) trade and development. Both short- and long-
term disruptions to these networks may cause adverse economic and social effects. Extreme weather events, some of
which are increasing in intensity and frequency, as well as slow onset climate changes (for example, mean temperature
and sea level rises) can cause infrastructure damages, operational disruptions as well as adverse impacts on the capacity
and efficiency of the supply chains.
Previous reports of the United Nations Economic Commission for Europe (ECE, 2013; ECE, 2020) on climate change
impacts and adaptation for transport networks have shown that: (a) transportation assets tend to be at risk to both
incremental climate change and extreme events (e.g. heat waves, heavy downpours, high winds and extreme sea levels
and waves); (b) transport assets are particularly at risk from extreme events of low probability relative to typical weather
variability; and (c) transport operations are generally more at risk to climate influences than physical assets, as thresholds
for delaying and/or /cancelling transport services are generally lower than those associated with infrastructure damages.
The United Nations Economic Commission for Europe (ECE) Group of Experts on Climate Change Impacts and
Adaptation for Transport Networks and Nodes analyzed CV&C impacts on the main transport networks and assets of the
ECE region (ECE, 2020). They identified the major climatic hazards impacting transportation (Table 1-1), as well as
climatic variables (e.g. warm spell duration, annual numbers of very hot, icing, and extreme precipitation days) the change
of which could have significant impacts on transportation and, then, considered Regional Climate Model (RCM)
projections for these variables under two climate change scenarios (RCP2.6 and RCP8.5) to assess potential CV&C
impacts and identify hazard ‘hot spots’ within the ECE region.
Although the list of climatic variables analyzed was not exhaustive, certain patterns emerged for the potential CV&C
impacts on the ECE transport networks and nodes. These findings together with the insights from a range of relevant case
studies have indicated that: a) there could be very significant impacts on transportation for many areas of the ECE region;
b) more comprehensive assessments of the CV&C hazards for and the exposure and vulnerability of the ECE
transportation networks are required which should consider additional (e.g. sea level rise and storms) and, particularly,
compound hazards; c) there should be a greater awareness of the potential CV&C impacts on transport infrastructure and
operations; and d) mainstreaming of CV&C considerations in the planning and implementation of transport
infrastructure/operations is critical for the transport resilience and sustainability.

            4   International transport links are most important facilitators of global trade and a prerequisite for
                participation in the global supply chains and economic development.
            5   Globally, more than one million transport accident fatalities are reported annually despite under-
                reporting and the insufficient harmonization of the global statistics regarding transport accidents. These
                accidents, in addition to the human loss/suffering, have resulted in huge financial losses, particularly
                for developing countries and economies in transition (in some countries up to 1 to 3 % of their GDP).
                There are also challenges for human health and safety from e.g. the transport-related emissions of
                atmospheric pollutants and the increasing transport of dangerous goods (ECE, 2015).
            6   Due to their location and extent, inland transport systems are relatively unprotected from security
                threats in comparison with e.g. seaports and airports.

2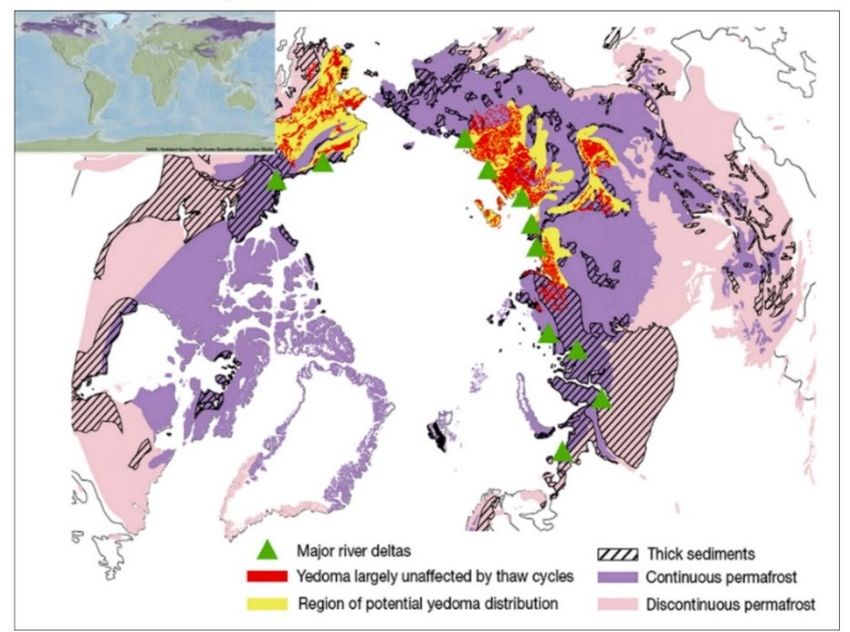
Informal document WP.5/GE.3 (2021) No. 1

Table 1-1 Climate change hazards and impacts relevant to transportation infrastructure and operation operations (after
ECE, 2020). The list is not exhaustive.

The above findings and recommendations guide the work of the ECE ‘Group of Experts on Assessment of Climate Change
Impacts and Adaptation for Inland Transport’. This contribution is a first (draft) review of the most recent (and emerging)
research on the potential CV&C threats for the ECE transport infrastructure and operations, with an emphasis on inland
transportation (i.e. roads, railways and internal waterways). As, however, inland transport infrastructure and operations
form, in most cases, ‘seamless’ networks with the maritime transport (ECE, 2010; UNCTAD, 2020), consideration will
be also given to hazards that could potentially affect seaports and their connecting inland connections.

2 CV&C hazards for transportation: Recent Trends and Projections
There is overwhelming evidence that the planet has been warming since the 1850s from the upper atmosphere to the
depths of the oceans, with changes observed in many climatic factors and indices (IPCC, 2013). Climate models project
that many of these changes will intensify in the course of the century. Global warming of 2°C above pre-industrial level
has been widely suggested as a threshold beyond which climate change risks become unacceptably high (IPCC, 2018) 7.
Warming is considered a result of the rise of Greenhouse Gas (GHG) concentrations in the Earth system (IPCC, 2013;
IPCC, 2018), which have increased very substantially since the industrial revolution. In 2019 GHG concentrations reached
new record levels (WMO, 2021): Carbon dioxide (CO2) concentration recorded as 410.5 ± 0.2 ppm (148 % of
preindustrial levels), Methane (CH4) as 1877 ± 2 ppb (260 % of preindustrial levels) and Nitrous oxide (N2O) as 332.0
± 0.1 ppb (123 % of pre-industrial levels).
2.1 Temperature
The change in the globally-averaged, near-surface temperature (GMST) is a most cited indicator of climate change, as it
relates to both climate change causes (I.e., increases in GHG concentrations) and impacts (IPCC, 2013). Notwithstanding
short-term variability, a steady warming trend is visible in the global temperature record (Fig. 2.1), particularly in the
most recent 40-year period (1979- 2019), when temperature rose by between about 0.17 and 0.19 0C per decade depending
on the data set used (Rohde and Hausfather, 2020).

            7   See also the 2015 Paris Agreement thresholds (UNFCCC, 2015).

                                                                                                                         3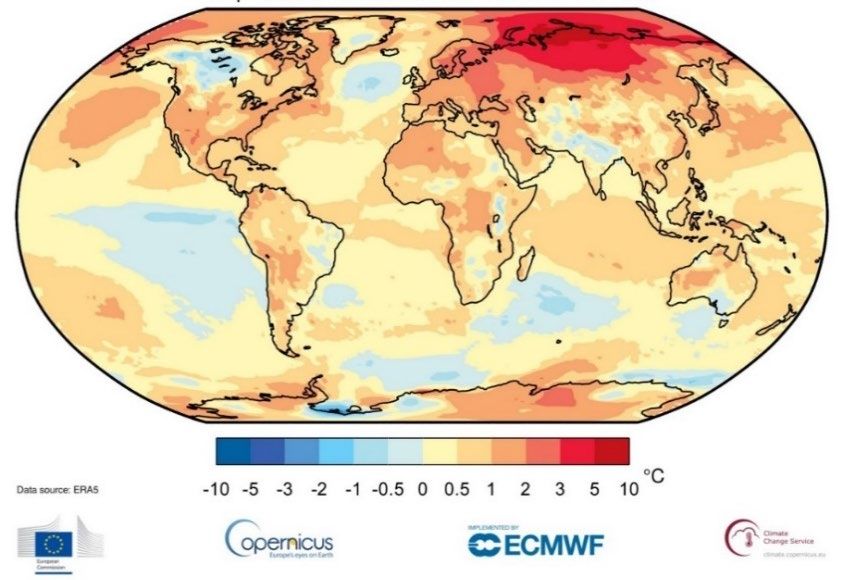
Informal document WP.5/GE.3 (2021) No. 1

Fig. 2.1 Published global surface temperature records for the period 1850-2019. The left panel shows annual anomalies
relative to a 1961– 1990 baseline period (Berkeley Earth uncertainty is the shaded area). The right panel shows trends
and the two-sigma trend uncertainties calculated by an autoregressive moving average approach, ARMA (1,1) (Rohde
and Hausfather, 2020). See also http://berkeleyearth.org/data/.

The last decade (2011-2020) has been the warmest in record, whereas 2020 despite developing cooling La
Niña conditions was one of the three warmest years on record, with the GMST being 1.2 ± 0.1 °C warmer than
that of the pre-industrial baseline period of 1850-1900 (WMO, 2021). The highest increases have been
observed in the Arctic area, particularly in the Siberian region of the Russian Federation (Fig.2.2). Since the
mid-1980s, Arctic surface air temperatures have warmed at least twice as fast as the global average, while sea
ice, the Greenland ice sheet and glaciers have declined over the same period and permafrost temperatures (and
melting) increased. These trends may have huge implications not only for Arctic populations, ecosystems and
infrastructure (including transport infrastructure), but also for the global climate through various feedbacks,
such as the increasing Methane emissions from the permafrost melting.
Most of the heat storage occurs in the ocean which absorbs most of the heat added to the system (Cheng et al.,
2019). Changes in the ocean heat content (OHC) can lead to regional shifts in the oceanic and atmospheric
circulation, which may cause (amongst others) more intense and/or frequent extreme storms and heavy
precipitation events in some areas, as well as prolonged droughts in other regions. In recent decades, there has
been evidence of an increasing ocean heat content, with the last 2 decades showing a particularly strong
increase across all water depths (WMO, 2021).
The atmospheric temperature has been projected by IPCC (IPCC, 2013) to increase by 1.0 – 3.7 °C in until
2100, depending on the GHG concentration scenario 8; the ocean will also warm further, with most warming
expected to take place in the upper 100 m of the ocean (by 0.6 °C under the RCP2.6 scenario and up to 2.0 °C
under the RCP8.5 scenario in 2100).

           8   Since the last IPCC Assessment Report AR5 (2013), projections are made on the basis of the
               Representative Concentration Pathway - RCP scenarios and not the previously used IPCC SRES
               scenarios. The CO2 equivalent concentrations have been set to: RCP 8.5, 1370 C02-equivalent in 2100;
               RCP 6.0 850 CO2-equivalent in 2100; RCP 4.5, 650 CO2-equivalent in 2100; and RCP 2.6, peak at
               490 CO2-equivalent before 2100 (Moss et al., 2010).

4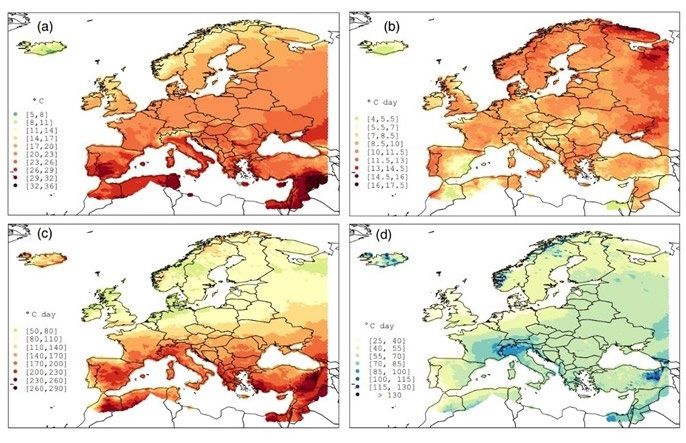
Informal document WP.5/GE.3 (2021) No. 1
Fig. 2.2 Global temperature difference between 2020 and the average temperature of the 1981-2010 period (WMO,
2021). Note the extreme increases recorded in the high northern latitudes in Eurasia.
Climate does not and will not change uniformly. Temperatures will likely rise faster at higher latitudes, consistent with
current trends. As the mean temperature rises, hot extremes will also become more frequent (Coumou and Rahmstorf,
2012). Even under a mean global warming of 1.5 – 2 °C above the pre-industrial levels (the thresholds of the 2015 Paris
Agreement), large increases in hot extremes are projected for most inhabited regions with high confidence (IPCC, 2018).
Under all emissions scenarios, large temperature increases have been projected by global and regional models over the
ECE region, particularly for its northern areas (e.g. IPCC, 2013; ECE, 2020). Recent simulations from the Coordinated
Regional Climate Downscaling Experiment (CORDEX), based on a combination of 16 global circulation models (GCMs)
and 20 regional climate models (RCMs) indicate that most northern ECE regions will face increases of more than (about)
4 °C by the end of the century, even under a moderate (RCP4.5) scenario (Fig. 2.3); these increases may reach extreme
magnitudes in the northernmost areas of Canada, Alaska and, particularly, Eastern Siberia (Spinoni et al., 2020).
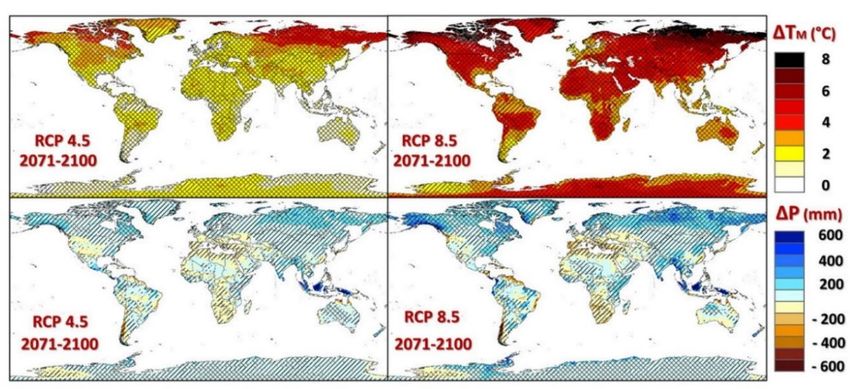
Fig. 2.3 Changes in mean temperature (ΔTM, upper panels) and annual precipitation (ΔP, lower panels) between 1981–
2010 and 2071–2100 under RCP4.5 and RCP8.5 from CORDEX simulations, showing also the robustness of the
projections (Spinoni et al., 2020). Projections are robust in sign if more than two-thirds of the simulations agree on the
sign of change and robust in magnitude if the median change (based on the ensemble) between 1981–2010 and 2071–
2100 is larger than intermodel variability (one standard deviation) of the 30 yearr average value over 1981–2010. Cross-
hatched lines represent a change robust in both magnitude and sign, hatched lines (///) represent change robust in sign
only, hatched lines (\\\) represent change robustness in magnitude; areas with no hatched lines represent non robust
projections.
5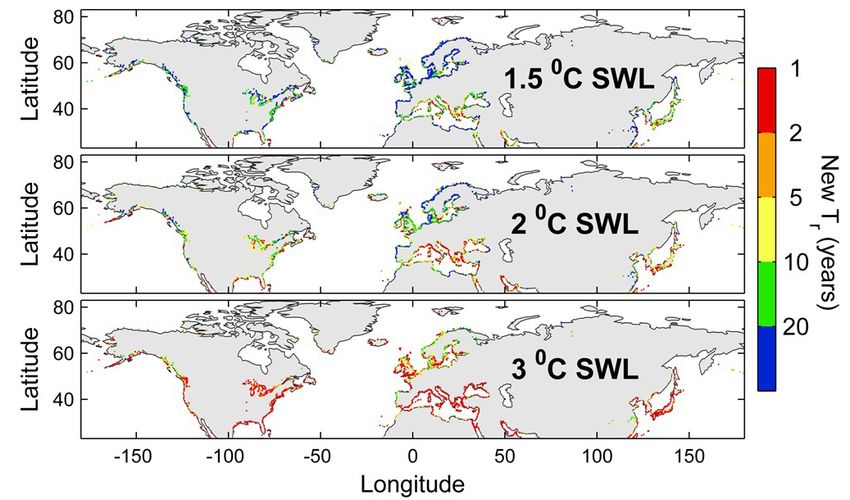
Informal document WP.5/GE.3 (2021) No. 1

2.2 Precipitation
Global land rainfall data show increasing trends, especially in middle and high latitudes (e.g. IPCC, 2013).
These precipitation changes may be linked to the temperature rise; it has been suggested that a global warming
of about 1°C relative to pre-industrial time may result to global precipitation increases of about 2 – 3 %
(Schneider et al., 2017). However, land precipitation shows stronger spatio-temporal variability than
temperature due to, amongst others. the influence of large climatic modulations such as the El Niño-Southern
Oscillation (ENSO). In the future, precipitation is expected to change in an even more complex manner than
temperature: increases are projected for some regions (medium confidence) and decreases and/or droughts for
other regions (IPCC, 2018). In the ECE region, precipitation patterns are projected to change in the 21st century
under the RCP4.5 and, particularly, RCP8.5 scenarios, with the north generally becoming wetter and the south
drier (Fig. 2.3). In N. America, annual precipitation is projected to increase in most areas in the later part of
the 21st century, with the exception of the southwestern USA (Spinoni et al., 2020). In winter, profound
increases are projected for northern Canada, whereas summer precipitation is expected to decrease over
southern Canada, particularly under the high-end emission scenario (Zhang at al., 2019).
It should be noted that annual and/or seasonal precipitation projections might not show the whole picture with
regard to the potential effects of precipitation on transportation, as short-term heavy precipitation events could
be of equal, or even greater importance (see also Section 2.5). A profound spatial divide in the number of days
with precipitation higher than 20 mm (R20mm) has been projected for the northern and southern European
parts of the ECE region by 2051-2080, particularly under RCP8.5; increases of about 4 R20mm days have
been projected for the northern Europe (and some mountainous areas), whereas in the south (e.g. the Iberian
Peninsula and areas of Italy, Greece and Turkey) decreases of up to 4 - 6 R20mm days per year have been
estimated. In Canada, substantial increases in R20mm days have been also projected for the period 2051-2080
under RCP8.5, particularly for southwestern and southeastern Canada (ECE, 2020).
Droughts also present large challenges to inland transportation systems (particularly the inland waterways - IWWs),
including those induced by changes in transportation demand due to changes in e.g. the agricultural productivity and
tourism (ECE, 2013). During the past decades, Europe has experienced droughts that caused high socio-economic losses
and environmental impacts. Recent work, based on machine learning clustering algorithms, has shown substantial
increases in short warm-season droughts which were found to be concurrent with increases in evapotranspiration
(Markonis et al., 2021). In terms of projections, widespread droughts have been projected for most of southwestern North
America for the mid to late 21st century; by comparison, central Europe, the Mediterranean region and parts of North
America have been projected to face shorter and less intense droughts (e.g. Dai, 2013; IPCC, 2018).
Recent projections (Spinoni et al., 2020), based on a large ensemble of GCMs and RCMs, indicate that about 15 % the
global land will likely to experience more frequent and severe droughts in the period 2071 – 2100 compared with the
period 1981 – 2010. In the ECE region, the Mediterranean countries will be particularly affected whereas droughts may
also increase in parts of N. America and in central Europe and Asia; at the same time, fewer droughts are projected for
the high latitudes of the Northern Hemisphere.

2.3 Snow, sea ice and permafrost
Trends in and projections for the snow cover, sea ice, glacier and ice sheet extent and the permafrost state (cryosphere)
are particularly important for the transport sector in the extensive Arctic regions of the Russian Federation, Scandinavia,
Canada and the United States of America. Cryosphere dynamics has very significant implications for not only the climate
in general (e.g. IPCC, 2019), but also for the transportation sector beyond the Arctic (ECE, 2020).
Since the 1950’s, the spring snow cover extent (SCE) has decreased in the Northern Hemisphere (NH) 9 (IPCC, 2013;
IPCC, 2019). Between 1967 and 2012 the June SCE has declined by 11.7 % per decade, with the trend being spatio-
temporally variable (EEA, 2015). In recent years, this trend has continued; in 2016, the mean annual NH SCE was 0.5
million km2 below the 1967 – 2015 average (24.6 million km2), despite the large January snow storms in North America
(NOAA, 2017). However, Arctic snowfall is projected to increase. Winter snow depth will increase over many areas, with

            9   The snow cover in the Northern Hemisphere accounts for about 98 % of the global snow cover.

6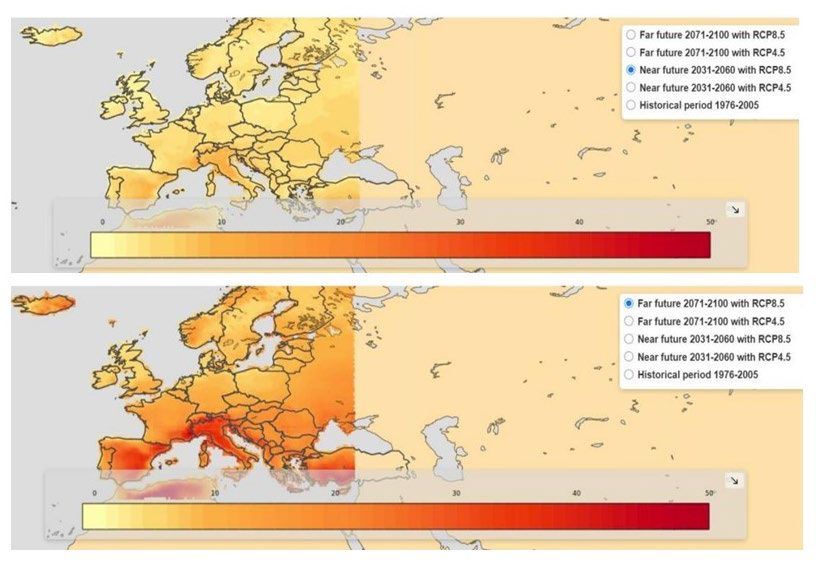
Informal document WP.5/GE.3 (2021) No. 1

the most substantial increases (15 to 30 % by 2050) projected for Siberia. However, spring SCE is projected to decrease
by 2100 by approximately 25 % under RCP8.5 (IPCC, 2013).

Fig. 2.4 Arctic and Antarctic sea ice extent (SIE) evolution 1979-2019 (Taalas, 2019)

Polar regions are losing ice, and their oceans are changing rapidly. These dynamics have consequences for the whole
planet. Arctic surface air temperature has likely increased by more than double the global average over the last two
decades, with feedbacks from the loss of sea ice and snow cover contributing to the amplified warming (NOAA, 2017).
Arctic sea ice is in decline; minimum Arctic sea ice extent (SIE) has declined by about 40 % since 1979, with most records
in ice minima occurring in the last decade (Fig. 2.4). Arctic SIE sea ice extent has declined in all months of the year (very
high confidence), with the strongest reductions observed in September (–12.8 ± 2.3 % per decade in the 1979 – 2018). It
has also thinned; since 1979, the areal proportion of thick ice at least 5 years old has declined by approximately 90 %;
however, it appears that the Antarctic SIE although shows large variability does not exhibit a significant trend over the
same period (Fig. 2.4). In 2017, the SIE was well below the 1981 – 2010 average in both the Arctic and Antarctic, whereas
in 2020, the annual minimum Arctic SIE was the second lowest on record with record lows observed in July and October
(WMO, 2021). These developments have already had implications for the transport sector. Shipping has steadily increased
during the Arctic summer over the past two decades concurrently with the SIE reductions; transit times across the Northern
Sea Route have shortened due to lighter ice conditions, whereas the distance travelled by ships in e.g. the Arctic Canada
nearly tripled during 1990 – 2015 (IPCC, 2019).
Further sea ice extent decreases are projected for the future, but with considerable inter-annual variability. In 2081 – 2100,
SIE reductions of 8 – 34 % in February and 43 – 94 % in September have been projected relative to the average SIE of
1986 – 2005 (IPCC, 2013). For a stabilised global warming of 1.5 oC since the pre-industrial times (Specific Warming
Level - SWL of 1.5 oC), an about 1 % probability for any given September being sea ice free has been projected for the
end of 21st century; for a stabilised SWL of 2 oC, this probability rises to 10 – 35 % (IPCC, 2019).

                                                                                                                            7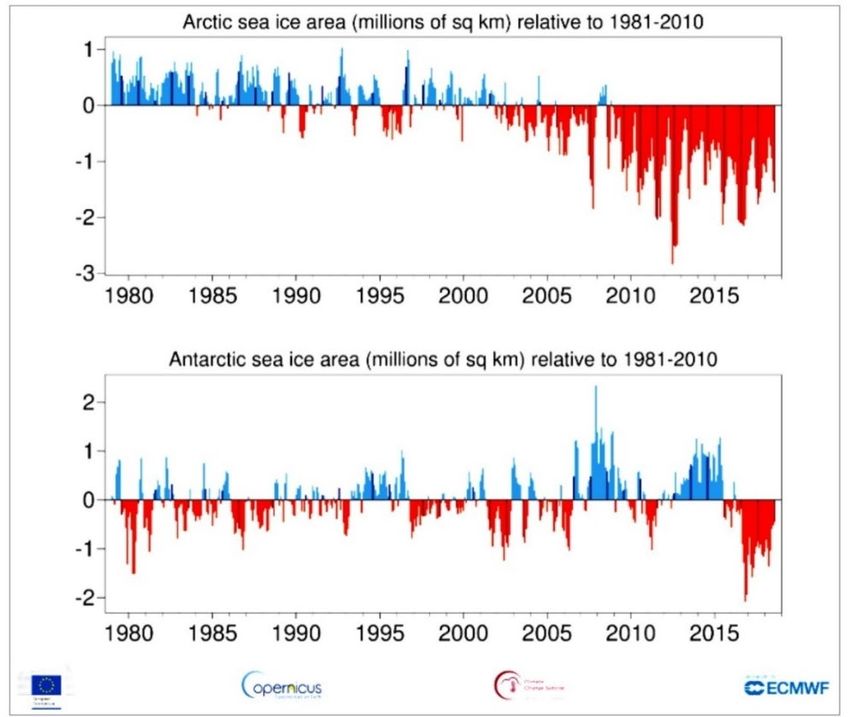
Informal document WP.5/GE.3 (2021) No. 1

The (land) ice mass balances of the Greenland and Antarctica ice sheets (GIS and AIS, respectively) are extremely
important as they control (amongst others) the mean sea level rise (SLR) 10, as well as a plethora of amplifying feedbacks
(Hansen et al., 2016). The surface mass balance-SMB of the GIS has been decreasing since the early 1990s (Velicogna
et al., 2014) resulting in a statistically significant contribution to the mean sea level rise (SLR) (Hansen et al., 2016). GIS
summer melting has increased since the 1990s to a level unprecedented over (at least) the last 350 years, and two to five
times the pre-industrial level (IPCC, 2019). In 2020, the Greenland ice sheet continued to lose mass. Although SMB was
close to its long-term average, loss of ice due to iceberg calving was at the high end of the 40 year satellite record; in
total, approximately 152 Gt of ice were lost from the ice sheet between September 2019 and August 2020 (WMO, 2021).
The SMB of the Greenland ice sheet is projected to continue its melting in the future; by 2050, the GIS mass loss may
account for about 23 mm of the global mean sea level rise (Muntjewerf et al., 2020).
By comparison, both trends and projections for the SMB of the Antarctic ice sheet (AIS) are variable and not clear (e.g.
Velicogna et al., 2014; De Conto and Pollard, 2016; Rignot et al., 2019). In Antarctica, the 2012 – 2016 losses (–199 ±
26 Gt/yr) were greater than those of the 2002 - 2011 (–82 ± 27 Gt/yr) and those of the 1992 - 2001 (–51 ± 73 Gt/yr)
periods. The AIS losses appear to be dominated by the acceleration, retreat and thinning of the outlet glaciers of the West
Antarctic Ice Sheet, facilitated by the melting of ice shelves by warm oceanic waters (IPCC, 2019).
Regarding glaciers, these are distributed across the planet, both at mountainous areas and the polar regions. Mountain
glaciers form major freshwater supplies and, thus, glacial loss has significant impacts on sustainable development (WMO,
2021). The western North American glaciers have lost 117 ± 42 Gt of mass and showed a fourfold increase in glacier
mass loss between 2000 – 2009 and 2009– 2018 (2.9 ± 3.1 Gt/yr and 12.3 ± 4.6 Gt/yr, respectively) (Menounos et al.,
2018). Future losses in glacier mass will have very significant implications through their contribution to global sea level
rise and mainly local impacts such as negative effects on river flows and water resources. Recent studies suggest (with
high confidence) that glaciers in both the polar and high mountainous regions will lose substantial mass in the 21st century;
by 2100, global glacier mass losses (relative to 2015) will be between about 18 % (RCP2.6) and 36 % (RCP8.5); there
will be, however, large variability between regions (IPCC, 2019).
Mountainous cryosphere dynamics have important implications for inland transport. Glacier mass losses will likely be
higher in small mountain glaciers (e.g. the European Alps) and, although such losses are not likely to cause large feedbacks
for the global climate, they can severely impact regional river flows and inland waterways (IWWs). In addition,
mountainous transport infrastructure is particularly prone to hazards related to snow, ice and permafrost dynamics, due
to their control on slope stability (Haeberli and Whiteman, 2015). Increased water flow along frozen slopes and frozen
ground (permafrost) degradation can increase debris flows and induce subsidence, endangering buildings, roads, rail lines
as well as their protection structures (Kenner et al., 2017; Eriksen et al., 2018; Duvillard et al., 2019). In recent years,
summer heat waves have been observed to trigger rock instability in the European Alps with lags of only a few days or
weeks (Ravanel et al., 2017). Glacier-related floods, including floods from lake outbursts, are also documented in most
mountain glaciers and have affected areas hundreds of kilometres downstream (Carrivick and Tweed, 2016). Generally,
the mountainous infrastructure exposure to cryosphere hazards has increased over the recent decades, and this trend is
expected to continue in the future (IPCC, 2012; IPCC, 2019).

           10   Ice Sheets gain mass at the surface from snowfall, and lose mass from melting and runoff and from
                glacier calving at the ocean front. Negative balance in gain-loss results in global sea level rise.

8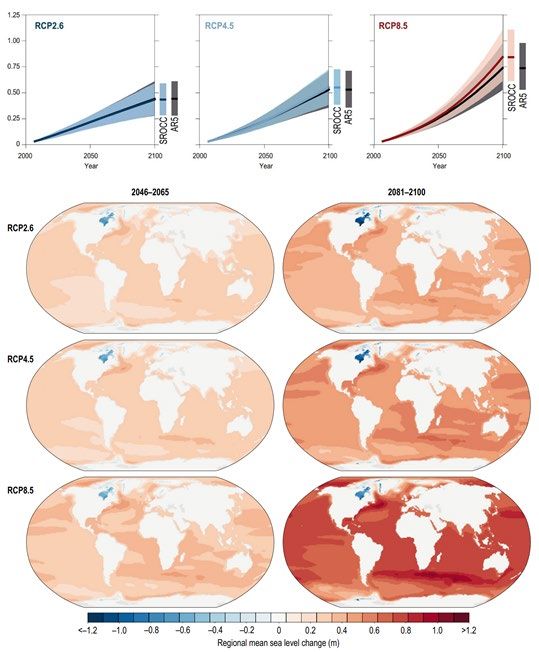
Informal document WP.5/GE.3 (2021) No. 1

Fig. 2.5. Map of the northern polar permafrost zone. Areas in yellow and red show the extent of the Yedoma permafrost
(Schuur et al., 2015).

Unlike the snow cover, ice sheets, sea ice and glaciers, permafrost is a subsurface feature that can not easily be observed
remotely; therefore, its distribution and dynamics are much less understood. Permafrost thaw and degradation can have
severe impacts including on runoff, the infrastructure and GHG emissions. The thickness of the Northern Hemisphere
(NH) polar permafrost (Fig. 2.5) has decreased by 0.32 m since the 1930s and permafrost temperatures have increased
(in most regions) by up to 2°C since the early 1980s, causing thawing and significant infrastructure damage (IPCC, 2013).
Mountainous permafrost in the European Alps, Scandinavia, Canada, Mongolia and the high Asian plateaus has also
warmed during the recent decades; a recent study revealed that the permafrost at 28 mountain locations in the European
Alps, Scandinavia, Canada and Asia warmed by an average of 0.19 ± 0.05 oC per decade between 2007 and 2016
(Biskaborn et al., 2019).
Despite the challenges in assessing future permafrost dynamics, widespread disappearance of Arctic near-surface
permafrost has been projected for this century; by 2100, near-surface permafrost area is expected to decrease by 2 – 66
% under RCP2.6 and 30 – 99 % under RCP8.5 11 (IPCC, 2019). These changes could pose serious challenges to the
development and maintenance of Arctic infrastructure due to thaw-related ground instability (Doré et al., 2016; ECE,
2020). These challenges could limit development of the inland transport networks which are required to connect and
service the (potential) new Arctic shipping routes made possible by the Arctic sea ice melt (see above). By 2050, 70 %
of the Arctic infrastructure will be located in regions at risk from permafrost thaw and subsidence; adaptation measures
taken in advance could reduce costs arising from the permafrost thaw and other CV&C related impacts, such as increased
flooding, precipitation, and freeze-thaw events by half (IPCC, 2019).

2.4 Sea level and waves
The oceans, which may have absorbed more than 80 % of the excess energy associated with the increased emissions since
the 1970s, show significant increases in their heat content (Dieng et al., 2017; Cheng et al., 2019); this has caused thermal

           11   This is projected to release 10s to 100s billions of tons of carbon (Gt C), up to as much as 240 Gt C.

                                                                                                                              9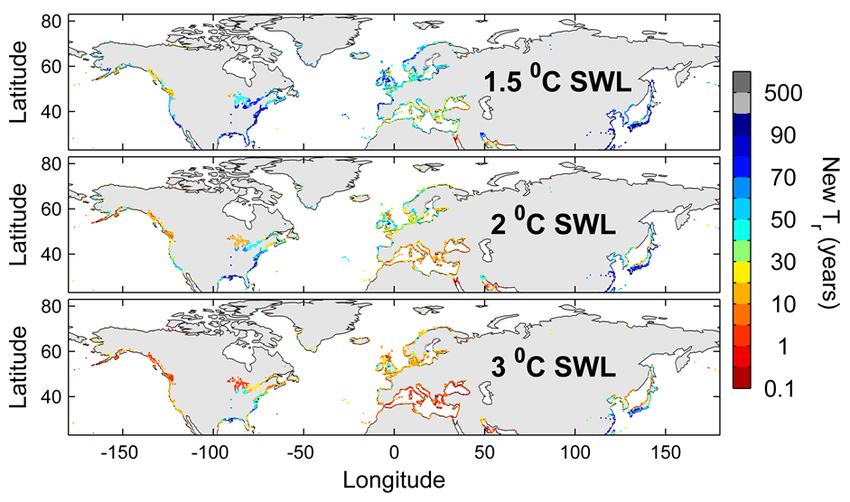
Informal document WP.5/GE.3 (2021) No. 1

(steric) expansion of the ocean volume and, thus, sea level rise - SLR (e.g. Hanna et al., 2013). In recent decades, the
global SLR rate increased sharply above the background rates. Since 1860, global sea level has increased by about 0.20
m, with average rates of 1.3 – 1.8 mm per year; since 1993, however, satellite and tide gauge observations indicate a
global SLR of 3.29 ± 0.3 mm per year peaking in 2020 despite the small decrease in the latter part of the year due to the
La Niña conditions in the tropical Pacific (Church et al., 2013; WMO, 2021). Recent evidence suggests that this
acceleration can be mainly attributed to ice mass balance changes rather than steric effects (e.g. Rignot et al., 2019). There
is also considerable spatial variability in the coastal sea level rise (e.g. Menendez and Woodworth, 2010; IPCC 2019).
Global SLR projections are constrained by uncertainties around the response to global warming and the variability of: the
GIS and AIS mass balances (Hansen et al., 2016; Rignot et al., 2019); steric changes (Cheng et al., 2019); contributions
from mountain glaciers (Menounos et al., 2018); as well as groundwater pumping for irrigation purposes and the storage
of water in reservoirs (Wada et al., 2012). SLR of 0.26 – 0.54 m (RCP2.6) to 0.45 – 0.82 m (RCP8.5) have been projected
for 2081–2100 as compared to 1986–2005 (IPCC, 2013); these projections, however, were upgraded in the latest IPCC
SROCC report (Fig. 2.6). It should be noted, however, that the IPCC has consistently provided conservative estimates 12.
Due to the large spatial SLR variability that has been observed and projected (Fig. 2.6), regional trends should be
considered when assessing potential impacts along a particular coast. In addition to the influences of global processes,
regional factors can also contribute to coastal sea level changes, such as changes in ocean circulation, differential rates in
regional glacial melting, glacial-isostatic adjustment (post-glacial rebound) and the subsidence of coastal sediments
(Jevrejeva et al., 2016). For example, relative sea levels across Canada are projected to rise or fall, depending on local
vertical land motion, with parts of the Atlantic coast projected to experience relative sea-level changes higher than the
global average in the 21st century due to land subsistence (Greenan et al.2018). Sea level rise will continue beyond 2100
(e.g. Horton et al., 2020), due to the rising ocean heat content (Cheng et al., 2019) that will induce increasing thermal
(steric) expansion for (at least) several centuries and the dynamic ice losses projected for Greenland and Antarctica (IPCC,
2019).

           12   A recent survey on members of the scientific community regarding future global mean sea-level
                (GMSL) rise has shown that under RCP2.6 scenario, 106 experts projected a likely (central 66 %
                probability) GMSL rise of 0.30 – 0.65 m by 2100, and 0.54 – 2.15 m by 2300, relative to 1986–2005.
                Under RCP 8.5, the same experts projected a likely GMSL rise of 0.63 – 1.32 m by 2100, and 1.67 –
                5.61 m by 2300. Experts suggested a likelihood of 45 % that, under the high end scenario, GMSL rise
                will exceed the upper bound (0.98 m) of the likely range estimated by the IPCC AR5 for 2100 (IPCC,
                2013). Responses suggested that the increases in upper-end estimates and uncertainties arose from
                recent influential findings for the impacts of marine ice cliff instability on the meltwater contribution
                from the Antarctic Ice Sheet (Horton et al., 2020).

10
Informal document WP.5/GE.3 (2021) No. 1
Fig. 2.6 (a) Time series of Global Mean Sea Level (GMSL) for RCP2.6, RCP4.5 and RCP8.5, showing also a comparison
between the projections by the IPCC AR5 (IPCC, 2013) and the IPCC SROCC (IPCC, 2019) reports. The shaded region
is considered to be the likely range. (b) Regional sea level changes for RCP2.6, RCP4.5 and RCP8.5 (in m). Results are
median values; the left column is for the time slice 2046–2065 and the right column for 2081–2100 (IPCC, 2019).
In addition to SLR, impacts on coastal transport infrastructure and operations can also depend on the mean and extreme
wave conditions and storm surges (see also Section 2.5). A warming climate is expected to affect wind patterns and storm
characteristics which, in turn, will impact wind waves and coastal water levels through changes in the coastal wave set
up (Vousdoukas et al., 2018; Mellet et al., 2018). Wind-wave projections are commonly based on dynamical and statistical
wave models forced by projected surface winds from CMIP GCMs 13. Global multi-model projections of wave conditions
13 In the framework of the Coordinated Ocean Wave Climate Project (COWCLIP), an ensemble of
Coupled Model Intercomparison Project Phase 3 (CMIP3)-based global wave projections was run and
first presented in the IPCC AR5 (IPCC 2013).
11Informal document WP.5/GE.3 (2021) No. 1
(e.g., for the significant wave height 14) under climate change undertaken to assess the impacts on seaports have shown
that the annual mean significant wave height will increase in the Southern Ocean and the eastern Pacific Ocean and
decrease in the north Atlantic Ocean, the northwestern Pacific Ocean and the Indian Ocean, with the magnitude of the
increases being about four times higher than those of the decreases (Camus at al., 2017). Other research has indicated
significant impacts for the Arctic regions, due to their increased vulnerability following the melting of coastal ice (e.g.
Day and Hodges, 2018). A review and consensus-based analysis of regional and global scale wave projections (Morim et
al., 2018) has indicated that annual and seasonal mean significant wave heights will increase in the Southern Ocean,
tropical eastern Pacific and Baltic Sea and decrease over the North Atlantic, the northwestern Pacific and the
Mediterranean Sea.
Wave induced flooding are expected to be severe. Several studies have included waves (i.e., coastal wave set ups) in
addition to tides and sea level anomalies, to assess coastal impacts using dynamical and statistical approaches. It should
be noted that SLR may reduce the depth-limitation of waves, resulting in higher energy waves impinging the coast; for
example, coastal protection design heights might require increases of 48 – 56 % in the German Bight relative to the design
heights based only on the effects of SLR (Arns et al., 2017). Global-scale projections of extreme sea level events that
include wave set ups indicate a very likely increase of the global average 1 in 100 years extreme sea levels (ESLs) of 0.58
– 1.72 m under RCP8.5 (Vousdoukas et al., 2018).
Changes in storm surges and waves will enhance the effects of the relative SLR along most of the northern European
coast, with contributions of up to 40 % in the North Sea (Vousdoukas et al., 2017). Melet et al. (2018) reported that over
recent decades, wave setup and wave swash interannual-to-decadal changes induced by the changes in deep-water wave
heights and periods alone were sizeable relative to those induced by steric changes and water mass additions from the
land-ice melt. However, more comprehensive studies of the coastal sea levels, including regional projections on sea levels,
tides, waves and storm surges (and their interactions) are required, to assess evolving hazards and impacts for coastal
areas (IPCC, 2019).
2.5 Extreme Climate Events
In the public discourse, climate change is often associated with increases in the mean values of the (global) climatic
variables (e.g., mean temperature, precipitation and sea level rise). For the transport industry, however, as well as for the
broader society, economy and environment, regional conditions and changes in climatic extremes can be more relevant
(ECE, 2020). Changes in the mean climate can cause changes in the frequency, intensity, spatial coverage, duration, and
timing of the weather and future climate events, potentially resulting in unprecedented extremes; these extremes can, in
turn, modify the mean climatic conditions (IPCC, 2012; IPCC, 2018). Extreme events cover a large spectrum, such as
heat waves, bouts of high precipitation events (downpours) or droughts, rapid sea ice retreats, sudden water releases from
melting glaciers and permafrost slumping and storm waves and surges. All these, by themselves or in combination, can
cause large damages/losses on the (inland) transport infrastructure/operations 15.
In recent years, there have been many extreme events that have affected the ECE region and its transport infrastructure
and operations, with some of those causing very severe damages and losses 16. In many cases, the impacts of such extremes
can be exacerbated by compound hazards, such as marine and fluvial/pluvial flooding (Forzieri et al., 2016) or combined
extreme temperatures and humidity (Mora et al., 2017; Monioudi et al., 2018). In 2020, the number of the tropical cyclones
has also been above average, with more than 96 cyclones recorded globally that caused billions of dollars of damage and
claimed hundreds of lives (WMO, 2021).
Heat waves
Climate observations show increases in the frequency and intensity of heat waves both in land and the oceans; in 2020,
82 % of the marine environments experienced at least one marine heat wave, causing significant impacts to marine life
14 The average of the highest one third of the recorded waves.
15 Extreme hydro-meteorological events, such as floods and storms have accounted for about 44 and 28
% of all natural disasters, respectively, recorded between 1998 – 2017 (Taalas, 2019).
16 For example, the Hurricane Sandy in the Caribbean and the United States of America (2012),
droughts in the southern and central regions of the United States of America (2012 and 2013), floods
in central Europe (May-June 2013), the 2017 hurricane season, and the very powerful 2019 Dorian
hurricane which affected the United States of America.
12Informal document WP.5/GE.3 (2021) No. 1
and the coastal communities (WMO, 2021). In the ECE region, several severe heat waves were recorded in recent years,
including those of: July 2015 (particularly in Spain, France and Switzerland); 2017 (particularly in Turkey, Cyprus, Spain,
Italy and the Balkans); and 2018, which was caused by atmospheric circulation anomalies and successively affected the
northern and central Europe with temperatures in Finland and northwest Russian Federation breaking historical records
(Liu et al., 2020). In recent years, record heat waves have been also recorded in the western United States (WMO, 2018).
Several studies indicate further increases in the probability of very hot summers and heat wave occurrence during the 21st
century (e.g. Coumou and Rahmstorf, 2012; IPCC, 2013). Larger changes in hot (seasonal) extremes are expected in the
subtropic and mid-latitude regions, whereas the frequency of cold events.
In recent years there has been an increased interest in heat wave projections of improved resolution, using for example
sets of regional climate models (RCMs) such as those integrated in the European EURO-CORDEX project. In the last
ECE Expert Group report relevant projections were presented for the European region of ECE for RCP2.6 and RCP8.5,
which indicated substantial increases in warm spell duration for 2051-2080 under RCP8.5 for the southern Europe and
the Eastern Mediterranean region of the ECE (ECE, 2020).
Similar projections have been also presented by Cardell et al (2020), who used high resolution gridded datasets of
observed precipitation and minimum and maximum land surface temperatures as the regional observed baseline and a set
of RCMs integrated in the European EURO-CORDEX project to project future conditions under the RCP8.5 scenario
(Fig. 2.7). Their results suggest that warm days will increase across Europe and cold nights decrease; increases in heat
wave amplitudes are expected across Europe, with the southern Europe and the Mediterranean being the most affected
regions. Likewise, other recent projections of the number of heatwave days in the European ECE region under RCP8.5
for 2031-2060 and 2071-2100 (Fig 2.8) also indicate that southern Europe and the Eastern Mediterranean will be more
affected, particularly at the latter part of the century (Jeuken et al. 2021).
Fig. 2 .7 (a) Baseline observed 90th percentile of daily mean temperature in summer (Tmean90; 1981–2005), for the
European and Mediterranean ECE region, considered for the definition of heat wave amplitude; (b) observed baseline
heat wave amplitude in summer; (c) future change (RCP8.5) and (d) the corresponding inter-model SD. (Cardell et al.,
2020).
It is, however, noteworthy that the above studies cover only part of the Eurasian region of the ECE, due to the spatial
coverage of the RCMs used. It is submitted that, notwithstanding the modelling challenges and requirements in human,
computational and financial resources, extension of such modelling approaches to the whole Eurasian ECE region will
13Informal document WP.5/GE.3 (2021) No. 1 provide a large added value for inland transportation. Integrated assessments of the hazards and impacts of Climate variability and Change are required for a region characterized by increasing integrated transport infrastructure and operations (ECE, 2020). Fig. 2.8 Evaluation of the number of heatwave days in the European ECE region under RCP8.5 for 2031-2060 (upper panel) and 2071-2100 (lower panel). (data from the Climate Data Store, EURO-CORDEX) (after Jeuken et al., 2021). As stated earlier, a large part of the ECE inland transport supply chains are depended also on their coastal nodes, and particularly the seaports which are major facilitators of both its internal and external transport and trade (e.g., ECE, 2010; ECE, 2015). Seaports can also be severely impacted by CV&C (Table 1-1) in many ways, including by extreme heat events (Monioudi et al., 2018; UNCTAD 2020). Projected changes in the return periods of extreme heat events at the major ECE seaports are presented in Figure 2.9. Although these results are based on global models, they can still provide a fairly good insight on the increasing challenges that seaports, their connecting transport networks as well as the large urban conglomerates associated with these seaports will face under CV&C. It is shown that, even under a SWL of 1.5 oC (projected to be reached by the 2030s), seaports will experience more frequent heat waves, particularly in the American and south European regions of the ECE. Conditions are projected to worsen considerably under a SWL of 2 oC (expected to be reached in the 2050s - 2060s) and, particularly, under a SWL of 3 oC (expected to be reached at the end of the 21st century under RCP8.5). In the latter scenario, most ECE seaports are projected to experience heatwaves with the magnitudes of the 1 in a 100 years heatwaves of the baseline (1976-2005) period once or two times per year; only some ports along the northwestern American and European coasts are projected to face such heatwaves less frequently (every 10 to 20 years). 14
Informal document WP.5/GE.3 (2021) No. 1

Fig. 2.9. Projected changes in the future return periods (Tr) of the 1 in 100 year event with the maginitude of that of the
baseline (1976-2005) period (Dosio et al., 2018) for the major ECE seaports under Specific Warming Levels-SWLs
(IPCC, 2018) of 1.5, 2.0 and 3.0 oC. Port data from the World Port Index.

Heavy rainfall
Observations in many regions indicate that heavy precipitation events (downpours) have become more intense and
frequent in many parts of the world, particularly in the tropical and mid-latitude regions (IPCC, 2013). These events can
have severe impacts for inland transportation, including pluvial inundation of road and rail terminals and inland waterways
ports, damages and/or wash outs of roads, railways and bridges, problems to drainage systems and tunnels and slope
failures and landslides, particularly in mountainous areas (ECE, 2020). River flooding from sustained heavy precipitation
is also a particularly significant threat (King et al., 2015).
Regarding the ECE region, recent studies show a spatial divide in its European part in terms of heavy precipitation events
in both winter and summer (Cardell et al., 2020). In winter, the western and most of southern Europe experience heavier
events than the northeastern Europe, whereas this pattern reverses in summer with downpours becoming much heavier in
northern and Eastern Europe (Fig. 2.10). It appears that climate change will alter significantly these (baseline) patterns.
Projections for late decades of the century (2071-2100) under the high end scenario indicate increases in the magnitude
of the heavy precipitation events for most of the European part of the ECE in winter; in summer, however, increases are
expected in northern and decreases in southern Europe (Fig. 2.10).
The recent ECE study (ECE, 2020) has also found a spatial divide in the projected changes in the number of days with
daily precipitation greater than 20mm (R20mm) for the northern and southern parts of the European region of the ECE.
Changes appear more profound under RCP8.5 than under RCP2.6, with increases of about 4 R20mm days per year
projected for northern and some mountainous areas of Europe; by comparison, large areas of the Iberian Peninsula and
(smaller) areas of Italy, Greece, and Turkey are projected to face decreases in heavy precipitation events. Concerning
sustained heavy precipitation, increases in the amounts of precipitation over 5-day periods (Rx5day) have been projected
over Europe under RCP2.6 and RCP8.5, with the exception of parts of the Iberian Peninsula, Greece and Turkey, and
some small areas in central Europe which are projected to experience decreases under RCP8.5 17. Increases of about 2
R20mm days have been also projected for most of Canada, with the exception of the western coastal areas as well as

        17      It is, however, noteworthy that even in the cases that seasonal precipitation is projected to decrease in terms of duration,
intense short-term precipitation events (downpours) might become heavier; in some areas of the United Kingdom, for example,
summer downpours that can generate flash floods (precipitation > 30 mm in an hour) could become much more frequent
(uo to 5 times) in the future (MetOffice, 2014).

                                                                                                                                         15
Informal document WP.5/GE.3 (2021) No. 1
southern regions of Ontario, Quebec, and Atlantic Canada which have been projected to face increases of 4 or more
R20mm days per year (ECE, 2020).
Fig. 2.10 Observed baseline (1981-2005) heavy precipitation amplitude (in mm per day) in a) winter and b) summer.
Future (2071-2095) changes in the percentage of heavy precipitation days relative to the baseline values in c) winter and
d) summer (Cardell et al., 2020)
Riverine floods have both physical and anthropogenic causes. The former are due to the hydrological cycle which is
influenced by changes in temperature, precipitation and glacier/snow melt, whereas the latter by land use changes, river
management schemes and flood plain development. Extreme riverine flooding is controlled by a variety of factors, such
as the timing, frequency and intensity of precipitation, the geomorphology and the land use. Therefore, observations and
projections of the heavy precipitation events alone can not provide a full picture of the frequency or intensity of extreme
river flood events; to assess flood exposure (and risk), flood modelling is required (e.g. Alfieri et al., 2017).
Global estimates of the climatic hazards for and impacts on the road and rail infrastructure suggest that floods form the
most potent hazard (about 73 % of global expected annual damages) and that about 7.5 % of all assets are exposed to the
1 in 100 years flood event (Koks et al., 2019). A significant flood exposure (from the 1 in a 100 years events) appears to
exist for the Eurasian ECE region, particularly for central and eastern Europe, central Asia and along the large drainage
basins of Siberia (ECE, 2013). Future increases in flood exposure and risk have been projected for central and western
Europe, with expected flood damages (EADs) under a SWL of 1.5°C projected to be twice as high as the average costs
of the 1976– 2005 period, being generally higher in the north than in the south. Under higher SWLs, very high flood
levels are projected for the 1 in 100 years events for the upstream sections of many river basins 18. Transport infrastructure
located in the highly populated and developed middle and lowland basins of major European rivers (e.g. those of the
Danube, Rhine, Elbe, Po, Dnieper, Don and Volga) is also projected to be exposed to significant flooding under the 1 in
100 years events (Alfieri et al., 2018).
Although extreme precipitation events are projected to become more intense over Europe, droughts might also last longer
by the end of the century. In dry regions as Southern Europe, soils are predicted to dry out as temperatures and
evapotranspiration rise and rain bearing atmospheric circulation is negatively modified; nevertheless, the magnitude of
18 It should be noted, however, that normally the upstream parts of the river regions are rarely associated
with transport infrastructure of transregional importance.
16Informal document WP.5/GE.3 (2021) No. 1
extreme droughts might also decrease as a consequence of the projected increases in drought duration (Cardell et al.,
2020).
Storms and high winds
Storms and windstorms can induce combined hazards (e.g., pluvial, fluvial and coastal flooding and high wind damages)
for inland and coastal transport infrastructure (e.g. Becker et al., 2013). In addition, powerful tropical storms (as, for
example, the 2016 Matthew and the 2019 Dorian hurricanes) have been found to have lasting impacts on ocean circulation
and coastal sea levels (Ezer, 2020). It appears that the annual incidence of tropical storms has not changed considerably
with time, although in the last year (2020) there was an unprecedent occurrence of tropical storms (WMO, 2018; WMO,
2021). It should be noted, that tropical and extra-tropical storms do not only occur in oceanic settings. Highly energetic
events (Tropical‐Like Cyclones - TLCs or Medicanes) have been also observed in the Mediterranean. These cyclones
have characteristics similar to those of tropical cyclones and, although their development and evolution mechanisms are
not yet fully understood (Miglietta and Rotunno, 2019), they can induce catastrophic winds and severe flooding affecting
both coastal and inland transport infrastructure, as was the case with the Ianos storm that hit Greece in September 2020
(Smart, 2020).
Storms are difficult to predict. However, as severe tropical and extra-tropical storms (which are usually associated with
extreme winds, rainfall and coastal flooding) are fed by the increasing upper ocean heat content and sea surface
temperatures, it is expected that their destructiveness will increase in the future (e.g. Ruggiero et al., 2010; ; WMO, 2014;
Romera et al., 2017). An attribution study for the hurricane Harvey (August 2017) has indicated that the event had been
made three times more likely by anthropogenic climate change (Trenberth et al., 2018). It has been suggested that a
modest temperature rise of 1°C in the upper ocean might result in storm wind speed increases of up to 5 m/s as well as
increased incidence of the most destructive (Category 5) cyclones (Steffen, 2009). Recent research also projects increases
in the incidence of the most intensive tropical storms by the end of the century, even under a moderate warming scenario
(Taalas, 2019). The implications for coastal communities and transport infrastructure could be severe due to, amongst
others, increases in extreme sea levels (ESLs) and waves (Mellet et al, 2018; Vousdoukas et al., 2018).
Extreme sea levels and waves
Coastal transport infrastructure can be affected by storm wave action, surges and extreme sea levels (e.g. Ranasinghe,
2016; Rueda et al., 2017; Monioudi et al., 2018). Extreme sea levels (ESLs) form the sum of the mean sea level (MSL),
the astronomical tide and the episodic coastal water level rise due to storm surges and wave set ups. Therefore climate-
driven changes in any of the above components will affect also the ESLs (Vousdoukas et al., 2018). Extreme sea levels
can pose a particular threat to the transport infrastructure of the highly developed, low-lying coasts (e.g., river deltas),
which are considered hot spots of coastal erosion/vulnerability due to their commonly high relative SLRs (ECE, 2013;
IPCC, 2019).
Mean sea level rise amplifies the extreme sea levels, as do increases in storm surges. Observed and modelled changes in
the intensity, frequency and/or the distribution of extreme waves (Ruggiero, 2013; Bertin et al., 2013; Mentaschi et al.,
2017) also affect ESLs, as higher waves induce higher coastal wave set ups. Coastal erosion and/or inundations are
expected to increase in the future due to the accelerating sea level rise, under the assumption that other contributing factors
such as the land vertical movements being equal (Hallegatte et al. 2013). Global projections show that ESLs will increase
during the twenty-first century in all areas, although there will be also regional variability. With regard to the storm surge
component of ESL, projections for Europe show larger storm surge levels for the Atlantic and Baltic coasts (and ports);
Increases in storm surges are projected for the North Sea, particularly along its eastern coast as well as for the Atlantic
coast of the United Kingdom and Ireland (Vousdoukas et al., 2017). By comparison, studies in the Mediterranean indicate
small decreases or no future changes (e.g.Androulidakis et al. 2015, Vousdoukas et al., 2016)., which is consistent with
historical trends (Menéndez and Woodworth 2010).
ESLs are currently characterised by considerable regional variability, with large tracts of the northern ECE coast (e.g.
western and eastern Canada, the North Sea and eastern Russian Federation) showing very high values compared to the
Mediterranean and Black Sea coasts (Vousdoukas et al., 2018). Projections show that averaged over Europe’s coastlines,
the present 1 in 100 years exteremse sea level (ESL100) will occur approximately every 11 years by 2050, and every 1 to
3 years by 2100. Consequently, about 5 million Europeans (and their transport infrastructure) may face coastal flooding
on an almost annual basis by the end of the century (Vousdoukas et al. 2017).
17Informal document WP.5/GE.3 (2021) No. 1
Projections show very substantial effects for the critical coastal transport infrastructure, such as seaports. Seaports will be
affected by various climatic hazards, including the relative sea level rise and extreme sea levels and waves as well as
extreme heat, precipitation and wind events (UNCTAD, 2020). In Figure 2.11 the evolution of the return periods of the
baseline (mean of the 1980 - 2014) 1 in 100 years extreme sea levels (ESLs100) is shown for the major ports of the ECE
region under 3 different temperature increases above the pre-industrial temperature (Specific Warming Levels-SWLs of
1.5, 2, and 3 0C). Very significant reductions are projected across the board for the return periods of events with the
magnitude of the baseline ESLs100: even under a SWL of 1.5 0C, ESL events with the magnitudes of the baseline ESLs100
will be occurring much more frequently, with some ports along the Mediterranean coastline experiencing the baseline
ESLs100 once every 10 to 20 years. Under higher SWLs, further deterioration is projected for all ECE seaports, with those
in the Mediterranean, Black Sea and the Pacific Canada coast facing the worst conditions (Fig. 2.11).
Fig. 2.11 Projected changes in the future return periods (Tr) of the 1 in a 100 years extreme sea level events (ESLs100)
at the ports of the ECE region, under with the magnitude of the baseline (1980-2014) events under Specific Warming
Levels-SWLs of 1.5, 2, and 3 0C. Coastal extreme sea level data from JRC-EC and port data from the World Port Index.
2.6 Concluding remarks
This short (draft) review of recent research suggests that the ECE inland transportation faces large threats from a plethora
of climatic hazards under Climate Variability and Change (CV&C). Results show high and increasing potential impacts
from climatic changes involving e.g. flooding under extreme events and operational disruptions from e.g. the increasing
magnitude and frequency of extreme heat waves (Table 1-1). In the light of these projections, there is an urgent need for
detailed risk assessments and management plans that will prioritize resilience and adaptation of the transport infrastructure
in the ECE region under climate change. Such responses are particularly important, as there are very significant
implications for disaster risk reduction, transport accessibility and international and national trade.
Main hazards affecting transportation have been presented. However, in order to assess risk, relevant information on all
risk determinants is required, i..e hazards, exposure and vulnerability (IPCC, 2012). Information on all risk determinants
is not easy to collate and project, particularly at local (network/facility) scales (see ANNEX Table A-1). In order to reduce
and adapt to CV&C risks, reduction of vulnerability is key. Vulnerability depends on many factors, including policies
and regulation that can reduce exposure. CV&C adaptation and resilience-building for transportation infrastructure, assets
and services is a matter of strategic importance and increasing urgency 19. This has been recognised by the international
community and, in recent years, there have been noteworthy developments, including amongst others: the 2019 UN
19 For a definition of urgency in this context see Lenton et al (2019).
18You can also read