1843 Merger Effi ciency Gains: Evidence from a Large Transport Merger in France - Discussion Papers - DIW Berlin
←
→
Page content transcription
If your browser does not render page correctly, please read the page content below
1843
Discussion
Papers

Deutsches Institut für Wirtschaftsforschung      2020

Merger Efficiency Gains: Evidence
from a Large Transport Merger in
France

Ariane Charpin, Joanna Piechucka
Opinions expressed in this paper are those of the author(s) and do not necessarily reflect views of the institute.

IMPRESSUM

© DIW Berlin, 2020

DIW Berlin
German Institute for Economic Research
Mohrenstr. 58
10117 Berlin

Tel. +49 (30) 897 89-0
Fax +49 (30) 897 89-200
http://www.diw.de

ISSN electronic edition 1619-4535

Papers can be downloaded free of charge from the DIW Berlin website:
http://www.diw.de/discussionpapers

Discussion Papers of DIW Berlin are indexed in RePEc and SSRN:
http://ideas.repec.org/s/diw/diwwpp.html
http://www.ssrn.com/link/DIW-Berlin-German-Inst-Econ-Res.html
Merger Efficiency Gains:
         Evidence from a Large Transport Merger in France1

                                     Ariane Charpin2
                                    Joanna Piechucka3

                                        January 7, 2020

                                           Abstract
            Many industries are seeing an increase in concentration, leading to a dis-
        cussion on the effectiveness of horizontal merger enforcement. The policy
        debate shows that one of the key arguments put forward when supporting
        potential mergers is the possibility of realization of merger efficiency gains,
        specifically in the transport industry. Yet, there exists little empirical evi-
        dence on the actual effects of realized mergers on cost efficiencies. We exploit
        a large and highly debated merger that took place in the French transport
        industry to evaluate whether a merger between two major transport groups
        may give rise to merger efficiency gains. We exploit the industry setting to
        employ a difference-in-differences methodology evaluating the effect of the
        merger on operating costs of merging transport groups. Our results show
        that the merger did not lead to any merger specific efficiency gains for the
        merging parties. Our study relies on the use of several control groups and is
        robust to a great number of robustness checks as well as to the introduction
        of heterogeneous treatment effects, depending on the identity of the merging
        party, the contract type in place, as well as the closeness of competition of
        local operators. Overall, our study contributes to a growing number of case
        studies undertaken by economists that can help determine whether horizontal
        merger policy is being properly enforced.

        Key words: Ex-post Evaluation; Mergers; Transport industry; Merger cost
        efficiencies.
        JEL classification: C31, L40, L50, L92.
  1
    We are extremely thankful to to CEREMA, GART and UTP for providing the complete
database on urban public transport in France for the purpose of our research. We thank Sara
Biancini, Philippe Choné, Tomaso Duso, Emmanuel Frot, Philippe Gagnepain, Marc Ivaldi,
Dennis Rickert, Stéphane Saussier, Angelo Secchi, Joel Stiebale, Hannes Ullrich, Jean-Philippe
Tropéano and Paola Valbonesi, as well as audiences at conferences and seminars at AFSE,
CERNA, CRESSE, CREST, DIW Berlin, EARIE, JEI, JMA, YEM for their valuable comments.

  2
      Economic Advisory, Deloitte France, acharpin@deloitte.fr.
  3
      DIW Berlin, jpiechucka@diw.de.

                                                 1
1 Introduction
The intensive merger activity observed since the 1990s along with speculation about
the effectiveness of competition enforcement are fueling a growing interest in ret-
rospective analyses of mergers. While there are a substantial number of studies
estimating the price effects of large and/or controversial mergers, there exists little
evidence on the effects of mergers on cost efficiencies. At the same time, efficiency
gains are often one of the main arguments of merging parties in front of competition
authorities and constitute, in theory, a central aspect to the economic motivation
behind mergers. They constitute the primary justification as for why the mergers
of competitors may benefit consumers. Not surprisingly, one of the “most important
finding” of the report of Ormosi et al. (2015) providing a review of merger decisions
in the European Union is that, “there is very little information on how dynamic
factors, such as innovation and efficiencies, developed after a merger.”
The objective of this study is to assess whether a merger between two major
transport groups gave rise to efficiency gains. We do this by studying the effects on
the operating costs of local urban public transport operators of a large merger that
took place between two of the three leading urban transport groups in France. In
2009, Transdev selected Veolia Transport to merge. This merger was approved by
the French Competition Authority in 2010 with remedies and the deal closed in 2011.
The new entity, which faced one main competitor and three smaller competitors in
the market, had a market share of nearly 40%. While the French Competition Au-
thority mostly focused on potential anticompetitive effects of the merger, the main
concern being the reduction in the number of competitors in competitive tenders,
the notifying parties argued that the transaction would generate merger specific effi-
ciency gains. These were claimed to be linked, on the one hand, to the achievement
of cost savings in the operation of the networks and, on the other hand, to the
possibility of providing a more extensive service offering thanks to the pooling of
experience between the parties.
In France, the urban public transport sector is regulated by local authorities
(cities or groups of cities) that are in charge of its organization at the local level. In
the majority of networks, this task is delegated to a private/public-private operator.
Most operators belong to major transport groups. To select a transport operator,
the local authority is required to launch a competitive tender procedure in which it
specifies the characteristics of the service to be provided (network length, ticket fares,
etc.). One of the main choice criterion in the tenders is the level of subsidies asked
by the operator to operate the service. Hence, efficiency gains can be a powerful
means for operators to succeed in tenders. At the same time, efficiency gains, if
reflected in lower subsidies paid to transport operators, reduce taxpayer burden.
This is of interest in a sector that is highly subsidized, with commercial revenues
2covering only 30% of the cost of operating the service.
We study whether efficiency gains actually materialized by performing an ex post
evaluation of the merger focusing on its effect on operating costs of local operators
belonging to the merging transport groups. Our analysis of efficiency gains is based
on a unique and detailed database that provides information on the characteristics of
urban transport networks, as well as detailed costs and revenues of urban transport
operators, in France over the 2006-2014 period, both before and after the merger.
This data is further complemented by a database of competitive tenders for the
choice of transport operators taking place between 2004 and 2014. In particular,
it contains the identities of the incumbent operator, of the winner of the tender,
as well as of other operators submitting offers in the competitive procedure. This
database enables us to construct various control groups, using information on the
intensity of competition in networks.
We employ a difference-in-differences methodology to study the potential ef-
ficiency gains resulting from the merger by comparing the evolutions of operating
costs of networks operated by the merged companies with those of networks operated
by competing companies. Finding a suitable control group to estimate the causal
effects of mergers can be a great challenge in many industries (see, for instance, the
discussion made by Nevo and Whinston (2010)). The characteristics of the local
public transport industry do seem to be a good field for applying the methodology,
as we can easily exploit variations in the conditions across local networks. We con-
sider several control groups in order to control for the possibility that the networks
operated by competitors of the merging parties have reacted to the merger. We
believe that spillover effects may be an issue only if competitors of the merging par-
ties expected the merging party to become more aggressive in competitive tenders
following the realization of merger efficiency gains. They could have reacted strate-
gically by improving their bids in competitive tenders and subsequently decreasing
operating costs. Hence the reaction by competitors of the merging parties, if any, is
likely to concern contracts signed after the merger. The first control group comprises
all the networks managed by the three main competitors of Veolia Transport and
Transdev, namely CarPostal, Keolis, and RATP Développement. The second con-
trol group accounts for this possible strategic reaction of competitors post merger by
including only networks for which the contract for the operation of the urban trans-
port service in a given network was signed prior to the merger. The third control
group is more restrictive and comprises only networks where there seems to be no
competition from Veolia Transport or Transdev during public tenders. This control
group is composed only of networks in which Veolia Transport and Transdev did
not submit a bid in tenders for the operation of the transport service throughout
the period of our analysis.
3To identify more precisely the impact of the merger on the costs of transport
operators, we further explore heterogeneity in the cost effects by exploiting the
richness of our data. First, we examine whether the effect of the merger differs
between the networks operated by the respective merging groups, Veolia Transport
and Transdev. Secondly, we explore whether effects on costs differ depending on
the type of regulatory contract type in place (fixed-price or cost-plus). Finally, we
also consider the effects of the merger, depending on whether the merging parties
were direct local competitors prior to the merger, defined as having networks in the
same or neighboring counties (fr. département). We also introduce specifications, in
which we remove the years between the announcement of the merger and the closing
of the deal as this event window may suffer from contamination of the data around
the time of the merger.
In all specifications, our results show that the merger did not result in efficiency
gains for the merging parties. Our explanation is that Veolia Transport made its
merger decision too quickly, resulting not just in a poorly prepared merger, but
also employees and clients reluctant to the merger due to differences in cultures
between the two groups. These explanations are highly specific to the case at hand.
Hence, we cannot conclude from our results that a change of market structure in
the sector of urban transport cannot lead to efficiency gains. Additionally, the role
played by the context of the transaction (culture, choice of the target, perception
by clients and employees, operational preparation of the merger, etc.) in the lack
of materialization of efficiency gains questions whether this aspect should be given
more weight by economists in their models and by competition authorities in their
analysis of potential effects of mergers.
The ability to generalize our results and comment on the European horizontal
merger policy is clearly limited. However, we contribute to a growing number of case
studies undertaken by economists that can help determine whether horizontal merger
policy is being properly enforced. Most such studies concentrate on impacts of hori-
zontal mergers on prices. A large volume of empirical research directly estimates the
effects of large and/or controversial mergers by employing a difference-in-differences
methodology. In particular, many studies exploit the growing availability of data
and features of the retailing sector to assess large mergers in Europe (e.g. Aguz-
zoni et al. (2014); Aguzzoni et al. (2016); Allain et al. (2017)) and in the U.S. (e.g.
Ashenfelter and Hosken (2010); Ashenfelter et al. (2013); Ashenfelter et al. (2015)).
Earlier work applying a similar methodology focused on mergers in major industries,
such as airline markets (Borenstein (1990); Kim and Singal (1993)), banking (Fo-
carelli and Panetta (2003)) and petroleum (Hastings (2004); Gilbert and Hastings
(2005)). Further, a small literature studies the actual effects of mergers with the
aim of assessing the validity of predictions of merger simulation models (see, for
4instance, Peters (2006); Weinberg (2011); Weinberg and Hosken (2013); Friberg and
Romahn (2015); Björnerstedt and Verboven (2016)).
Despite the growing number of studies analyzing the price effect of mergers in
a variety of industries, still little work exists on the ex post evaluation of merger-
specific efficiency gains. To our knowledge, there exist few studies covering a limited
number of sectors that evaluate cost efficiencies from mergers directly. Brito et al.
(2013) evaluates the impact of mergers in non-life insurance markets in Portugal
through their effect on exercising of market power via coordinated effects and firms’
internal efficiency. Its analysis relies on the specification and estimation of a struc-
tural model including preferences, technology, and a market equilibrium condition.
It shows that following the mergers, there is no evidence of either an increase in mar-
ket power through coordinated behavior or changes in cost efficiency levels. Kwoka
and Pollitt (2010) studies the impact of the merger wave that took place in the
U.S. electricity industry by analyzing its impact on operating and total costs in
electricity distribution. It employs data envelopment analysis to assess efficiency
effects of mergers and concludes, on the basis of its results, that electricity mergers
are not consistent with improved cost performance. Dranove and Lindrooth (2003)
examines hospital consolidation in the U.S. by focusing on its effect on hospital
costs. Cost function estimates of hospitals undergoing consolidation are compared
to “pseudo-merger” hospitals chosen based on propensity scores. The empirical
strategy is based on the assessment of whether the cost functions of actual merg-
ers are lower than those of pseudo-mergers. It shows that mergers consisting of
consolidation of financial reporting and licenses generated cost savings in the 2-4
years following the mergers. Clearly, more retrospective studies are needed to help
evaluating the effects of mergers on efficiency gains.
The paper is organized as follows. Section 2 presents the French urban public
transport industry and describes the merger under study. Section 3 presents our
empirical strategy and section 4 our main empirical analysis, findings, and robustness
checks. Section 5 discusses the results and section 6 concludes.
2 Industry background
2.1 Organizational background
In France, the public authority, comprising cities or group of cities, is responsible for
organizing urban public transport in that it has to define, finance, and organize it4 . It
provides a guideline for the organization of public passenger transportation in urban
4
The general principles of the organization of urban public transport in France date back to
the Transport Law of 1982 (fr. Loi 82-1153 du 30 décembre 1982 d’orientation des transports
intérieurs.
5transport areas and establishes the concept of economic and social efficiency by
declaring the right to affordable public transport. There exists no national regulator
of the sector and transportation is regulated by local authorities. The relevant
public authority is left with the choice to organize and provide the service itself or
to delegate the relevant responsibilities to a fully private or public-private operator.5
Competitive bidding is then compulsory before awarding a contract for the provision
of a public service.6
Currently, there are approximately 300 transport networks in France, with nearly
90% of them operated by delegated management (GART (2015)). In delegated man-
agement, the local authority chooses an operator to which it entrusts the operation
of the service. The key feature of the French model is that the operation of the net-
work is attributed to only one operator, which carries the responsibility of providing
the relevant service in the whole urban transport area (see Yvrande-Billon (2006)).
The relationship between the operator and the local authority is regulated through
a contract in which the local authority specifies the characteristics of the service
(ticket fares, number of stops, routes, frequency, output, schedule, quality of ser-
vice, conditions for subsidizing the service, level of investment, ownership structure,
obligations of operators to passengers, etc.) as well as the reimbursement scheme.
In most networks, investment in the infrastructure remains the responsibility of the
organizing authority, with the local authority owning the rolling stock and infras-
tructure, which are put at the disposal of the operator. To illustrate, in 2013, 78%
of the rolling stock belonged to organizing authorities (GART (2015)). Hence, op-
erating costs are the relevant measure of long-term efficiency in the specific context
of urban transport because operators do not incur capital costs, they only operate
the networks.
Urban public transport in France is highly subsidized. The strong social objec-
tive of the public policy of urban transport translates into pricing choices that are
disconnected not only from total costs, but also from operating costs. As a result,
the industry is currently facing strong financial constraints. The ratio of commercial
receipts to operating costs has been deteriorating over the years. In 2015, commer-
cial receipts covered, on average, barely 30% of operating costs (Cour des Comptes
(2015)). The remaining operating costs are covered by subsidies from the state,
5
As opposed to the rest of France, the region of Paris (Ile-de-France) has only one author-
ity responsible for organizing urban public transport. It takes its decisions in consultation with
dedicated transport carriers (RATP, SNCF, and OPTILE).
6
Until 1993, the automatic renewal of contracts was a common practice (see Gagnepain and
Ivaldi (2002)). The Sapin Law (fr. Loi 93-122 du 29 janvier 1993 relative à la prévention de la
corruption et à la transparence de la vie économique et des procédures publiques. made competitive
bidding compulsory before awarding a contract for the provision of a public service. The aim of
the law is to prevent collusion and corruption, thus enhancing competition between the operators
in the industry.
6local authorities, and a special transport tax paid by local firms.7 Potential merger
efficiency gains are of interest in such a highly subsidized industry.
Before the merger, nearly 70% of the operators were subsidiaries of three major
groups, two were private and one semi-public: Keolis, Veolia Transport (hereafter
Veolia), and Transdev. In 2009 (prior to the merger), Keolis was owned by SNCF,
the French National Railway Company. Veolia was then a subsidiary of the French
group Veolia Environment8 and Transdev was owned in majority (69.6%) by the
French public financial institution Caisse des Dépôt et Consignations (hereafter
CDC).
In addition, three smaller players were already present in the market at that time
(RATP Développement, Vectalia France, and Carpostal). RATP Développement
(hereafter RATP Dev), owned by RATP,9 was created in 2002. Our interviews with
local operators suggest that RATP Dev has recently become an important player in
the industry, especially in small and middle-sized networks. In addition, two foreign
groups were present in the market: Vectalia France and CarPostal France.10 The
remaining operators were independent or belonged to local and regional transport
groups.
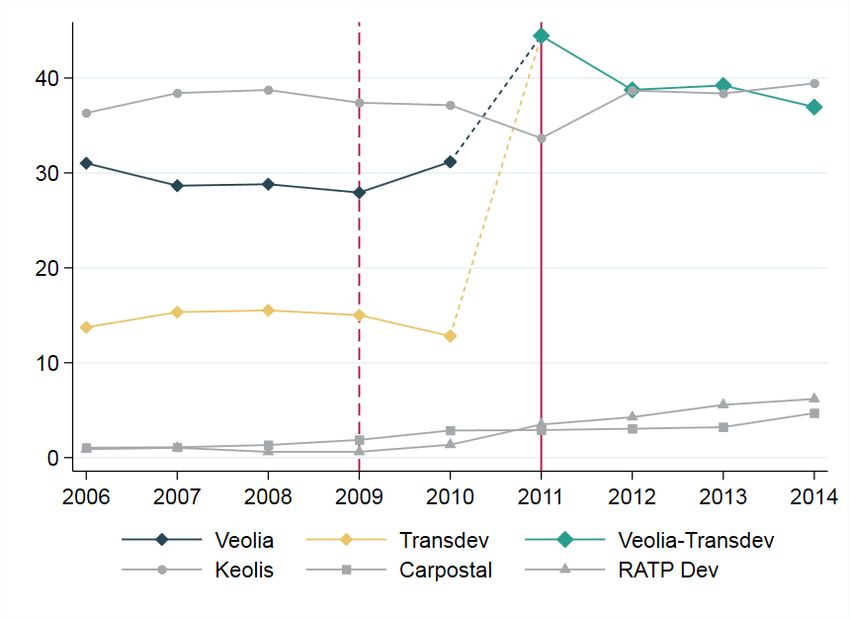
Market shares measured by the number of networks of the respective groups are
presented in Figure 1. Prior to the merger in 2011, the leading transport group was
Keolis (with a market share of nearly 30%), followed by Veolia (30%) and Transdev
(15%).
2.2 The merger
Near the end of July 2009, Transdev decided to merge with Veolia.The new entity
was expected to be one of the largest transport companies in the world and to be
taken public within two years following the merger. The merger was first notified
to the European Commission. Subsequently, on August 12, 2010, the European
Commission referred it to the French Competition Authority for an examination of
the French part of the concentration. The merger was authorized with remedies by
7
This transport tax consists of a local contribution of employers that allows for providing addi-
tional funding for urban public transport. It is imposed on both public and private sector employers
that employ more than 9 full-time employees within an urban transport area of a population of
more than 10,000. It is collected by each urban transport area.
8
Veolia Environnement S.A. is a French group with global activities in water provision, water
sanitation, waste treatment, cleaning and sanitation services, energy services, and transport.
9
RATP is the operator of urban transport in Paris. It is a public company.
10
Vectalia France is a subsidiary of the Spanish group Subus and is present in France since 1998.
CarPostal France is a subsidiary of the Swiss Group CarPostal Suisse and it operates in France
since 2004. The extent of the presence of Vectalia and CarPostal in France was mainly limited to
transport areas close to the relevant borders.
7Figure 1: Market shares (in number of networks, weighted by their population)
Note: Only groups with at least 5% market share in 2014 are included in the figure.
the French Competition Authority in December 201011 and the final closing took
place on March 3, 2011.
The Competition Authority was concerned that the decrease in the number of
candidates resulting from the merger could increase the prices of bids submitted
in tenders and decrease the quality and diversity of offers, hence the merger was
approved by the French Competition Authority subject to several commitments
taken by the merging parties.
As in the case of most mergers, the merger between Veolia and Transdev is
associated with potential anticompetitive and procompetitive effects. On the one
hand, the merger resulted in a decrease in the number of players in the industry
and, potentially, in the number of bidders in the relevant tenders, which could
foster anticompetitive effects. On the other hand, the merger may have resulted in
efficiency gains in the form of a decrease in costs. If these cost efficiencies are passed
on to local authorities in the form of more attractive bids in tenders, the merger
could have benefited consumers and taxpayers.
2.3 Potential efficiency gains
As could be understood from reading the decision of the French Competition Au-
thority, efficiency gains were the key argument put forward by the merging parties to
approve the merger.12 Indeed, the industry suggests several means by which joining
11
Autorité de la concurrence, Décision 10-DCC-198 du 30 décembre 2010 relative à la création
d’une entreprise commune par Veolia Environnement et la CDC.
12
Concerning efficiency gains, the Competition Authority explained in the decision that the
merging parties argued that the merger would create substantial efficiency gains, in particular a
8two groups following a merger may give rise to cost efficiencies.
The characteristics of the industry are such that operators have incentives to
reduce operating costs. The incentive to reduce costs in this highly subsidized
industry comes, on the one hand, from the pressure of competitors in competitive
tenders and, on the other hand, from the type of contracts that are used by local
authorities. The dominant contract types observed in France are fixed-price and
cost-plus contracts. In networks regulated under fixed-price contracts, operators
receive subsidies according to their expected operating deficits. Therefore, profits of
operators suffer from cost overruns and lower-than-expected revenues. In networks
regulated under cost-plus contracts, the organizing authority collects commercial
receipts and fully reimburses the operator’s operating costs, increased by a pre-
defined additional amount that constitutes the margin of the operator. Under this
regulatory scheme, the regulator provides the operator with subsidies to cover its
actual deficits. Thus, cost changes do not affect the operator’s profits. In the past
years, the industry is increasingly moving toward fixed-price contracts, which are
high-powered incentive schemes for operators. The proportion of networks regulated
under cost-plus contracts has indeed decreased substantially: going from 100% in
the 1970s, 60% in the 1980s, 25% in the 1990s (Yvrande-Billon (2006)), to only 7%
in 2013 (GART (2015)). Hence, operators are incentivized to decrease costs in order
to increase their profits.
There exist several potential sources of operating cost efficiencies in the merger
we analyze. Reducing operating costs may come from knowledge sharing between
local operators. Local operators are indeed likely to share knowledge at the group
level on how to efficiently operate a network. Gagnepain and Aguiar (n.d.) uses an
earlier version of our database (until 2001) to show that an operator belonging to
an industrial group benefits from the cost reducing activities of the remaining op-
erators of the group. Specifically, knowledge generated by a local operator may be
processed by the headquarters of the group and then transmitted to other networks
operated by the group. They suggest that cost reducing activities may concern, for
instance, R&D processes, the search for cheaper suppliers, experience in procure-
ment contracts bargaining, or methods in monitoring employees. A merger between
two groups may allow methods, procedures, and general knowledge of operators of
one group to be passed on to operators belonging to the other. As an example,
appropriate staff training may help reduce delays, reduce accidents, and help fight
fraud. Knowledge sharing may also concern means of lowering maintenance costs
by, for example, finding the right balance between prevention and maintenance.
Further, potential operating costs reductions may come from improved manage-
reduction in operating costs. The Authority, without performing a detailed analysis of efficiency
gains, considered that the occurrence of such efficiency gains was not credible enough to counter-
balance potential anticompetitive effects from the merger.
9rial efficiency. A change in the managerial policies and procedures imposed on local
operators by the new group may move networks of the new entity closer to the best
practice of the industry. As an example, better management may help in increas-
ing staff productivity by reducing the rate of absenteeism. The merger may have
changed the attitude of the management, thus motivating it and making it more ef-
ficient. Cost efficiencies may result in more stable management at the regional and
national levels. To our knowledge, management was very unstable in Veolia prior
to the merger. Regional and national managers changed very frequently. Since
they are responsible for monitoring operating costs of local operators, a more stable
managing team could help local operators become more efficient.
Finally, the spread of the specific values and specificities of each group to the
other may have reduced operating costs.
3 Empirical model
3.1 Empirical strategy
We perform a merger evaluation of the merger that took place between Veolia and
Transdev by using a difference-in-differences research design (hereafter, DiD), by
comparing the evolution of the operating costs of the networks belonging to the
merging companies before and after the merger to the evolution of a control group
unaffected by the merger. Our focus is whether the merger resulted in cost efficien-
cies achieved by the new entity.
We estimate the following equation:
X
ln(Cnt ) = α0 + α1 T reati + α2 P ostt ∗ T reatn + βi Xint + ηt + δn + ent (1)
i
where Cnt represents the operating costs of network n in year t, P ostt is a
dummy variable taking the value 1 post-merger, T reatn is a dummy variable taking
the value one for networks belonging to the treatment group, Xnt is a vector of
factors other than the merger affecting operating costs, δn is a network specific fixed
effect13 , and ent is the error term. We include year dummies ηt to account for year-
specific changes in operating costs affecting all operators. α0 , α1 , α0 , and βi are the
coefficients to be estimated. Specifically, α2 is the coefficient of interest, it provides
a measure of the effect of the merger on the operating costs of the merged entities.
The vector Xnt includes time-varying variables measured at the network level, which
are likely to be a source of omitted variable bias if they are not controlled for, such
as the number of seat-kilometers provided by the network or input prices. In all
13
We also consider an estimation without fixed effects. The qualitative results remain unchanged
and are available upon request.
10estimations, standard errors are clustered at the network level to account for serial
correlation, as suggested by Bertrand et al. (2004).
The key assumption behind the use of our identification strategy is that outcomes
(operating costs) in the treatment group and control group would have followed,
conditional on covariates, parallel trends over time absent the treatment (merger).
The ideal control group is such that the variable of interest evolves similarly as in the
treatment group with the only difference that it did not experience the treatment.
The characteristics of our industry appear to make it a good field for applying
the methodology, as we can easily exploit variations in the conditions across local
networks and consider a number of potential control groups.
Control group 1 (C1). We gathered evidence from CarPostal, Keolis, and
RATP Dev, three main other operators in the industry, that are similar with respect
to their operating costs and their responses to cost shocks. The first control group
is composed of all networks managed by these three main competitors of Veolia and
Transdev.14
Control group 2 (C2). We further account for potential spillovers that may
arise if competitors of the merging parties expected the latter to become more aggres-
sive in competitive tenders because of the efficiency gains from the merger. Spillover
effects may be an issue only if competitors of the merging parties expected the merg-
ing party to become more aggressive in competitive tenders following the realization
of merger efficiency gains. They could have reacted strategically by improving their
bids in competitive tenders and, subsequently, decreasing operating costs. Hence
the reaction of competitors of the merging parties, if any, is likely to concern con-
tracts signed after the merger. The second control group accounts for the possible
strategic reaction of competitors post-merger by including only networks in which
the contract for the operation of the urban transport service in a given network was
signed prior to the merger.
Control group 3 (C3). We further exploit information on tender participation
to test a more restrictive control group, which is composed only of networks where
there seems to be no competition from Veolia or Transdev during public tenders.15
We believe that the operators of these networks are unlikely to react to the merger
since they are not subject to competition, neither from Veolia nor from Transdev.
This control group comprises only networks in which Veolia and Transdev did not
submit a bid for tenders for the operation of the transport service throughout the
period of our analysis.
14
We also considered estimations with Keolis separately; the qualitative results remain un-
changed.
15
We also test a control group consisting only of networks where competition in tenders seems
to be absent, which is considered to happen in networks that did not see a change in operator since
2005 and in which only one offer was submitted in tenders taking place since 2004. As the parallel
trend assumption is not verified for this group, it is excluded from the analysis.
11The definitions of the treatment and control groups are summarized in Table 1.16
Table 1: Definitions of treatment and control groups
Group Definition
Treatment Networks operated by Veolia or Transdev
C1 Networks operated by Keolis, RATP Dev, or CarPostal
C2 As C1, but only contracts signed before the merger
C3 As C1, but where neither VT nor T submitted a bid
Parallel treatment assumption. The key identifying assumption of the DiD
estimation method is that had the treatment not been implemented, operating costs
of the treatment group and control group would have followed the same evolution,
conditional on the control variables included in the regression. To support our iden-
tification strategy, we analyze whether the pre-merger common trend assumption is
empirically verified in our data. Specifically, we further verify the satisfaction of the
parallel trends assumption running a placebo test, as suggested by Autor (2003).
It consists of introducing placebo treatments in the equation of interest in all years
except one. The following equation is estimated:
X X
ln(Cnt ) = α0 + ηt + βj(T reatn ∗ I(t = j)) + γi Xint + δn + ent (2)
j6=2010 i
where Cnt represents operating costs of network n in year t, ηt are time-specific
dummies, Xnt is a vector of factors other than the merger affecting operating costs,
δn is a network specific fixed effect, T reatn is a dummy variable taking the value
1 for networks belonging to the treatment group, I(t = j) are time dummies for
all periods except the period just before the merger, and ent is the error term.
In equation 2, all coefficients βj with j < 2010 are placebo tests for whether the
treatment had an effect on costs between the two groups prior to the merger. This
should not happen because if the treatment had an effect before it even occurred,
this casts doubt on the parallel trends assumption. Results are presented in section
4
Exogeneity of the merger. The other key assumption in the application of
the DiD approach is that the choice to merge with Veolia is not endogenous. The
decision by Transdev to merge with another company was not linked in any way to
operating costs of networks operated in France or factors influencing them. Trans-
dev belongs to a public financial institution. Its initiative to merge with another
16
We also undertook the analysis on a balanced panel of transport networks that have not seen
a change of transport operator in the period of the analysis. The use of this voluntarily restrictive
dataset enables us to have networks that remain either in the control or the treatment group over
the whole period studied and observe costs for each year and for each network included in the
sample. The qualitative results remain unchanged and are available upon request.
12French transport company must be understood within this context and the specific
situation at that time. Transdev and RATP were not satisfied by the partnership
they had commenced in 2002; consequently, RATP wanted to divest its 26% share
of Transdev and develop its subsidiary RATP Dev. Hence, the owner of Transdev, a
public institution, started looking for a new partner, with the idea that competition
between four French transport groups for contracts abroad was likely to be detrimen-
tal to the success of these groups and, therefore, to the French transport industry,
and that the creation of a very large group would help win contracts abroad. Thus,
the initiative of Transdev was strategic for the development of the French transport
industry through the winning of contracts for the operation of networks abroad.
The specific choice of Veolia is not endogenous to the operating costs of net-
works. According to a report about the merger published in 2016 by the French
Court of Audit (Cour des Comptes (2016)), Veolia and Keolis were both serious
candidates and the choice of one of them over the other did not prevail in the-
ory.17 A comparative examination of the two offers was organized by the owner
of Transdev, but this comparative examination was made very quickly. For exam-
ple the elements of valuation and financial structuring of the transaction were not
taken into account in this comparative analysis. According to this report, “subjected
to pressure by Veolia Environnement through the media, the CDC did not wish to
deepen negotiations.... This choice is probably not independent from the fact that
the CDC was also the largest shareholder of Veolia Environnement. The CEO of
CDC was in favor of a merger with Veolia. 18 Thus, Keolis was excluded from the
process, with the CDC and Veolia entering into exclusive negotiations regarding the
merger of their subsidiaries. This analysis of the French Court of Audit is a soft
version of the information found in the news media. Le Parisien, a daily newspaper,
explained in 2009 that the general secretary of the French president intervened to
tip the balance in favor of Veolia, whose CEO at the time was close to the French
president. The left-wing political party PS made a statement to denounce the condi-
tions under which Veolia had been chosen, which seemed to be primarily a political
decision sponsored by the French president in order to satisfy the top management
of Veolia.19 An investigation by the French newspaper Mediapart, published in June
2012, argues that Veolia was chosen by the CDC because of the private relationship
between the ex-CEO and non-executive president of Veolia and the CEO of CDC,
17
Regarding operating costs of networks operated in France, a comparison of means of unit costs
(operating costs per seat-kilometers) of networks confirms that the two candidates were similar.
Average unit operating costs of Keolis and Veolia both amount to e0.032 per seat-kilometer in
2009.
18
Cour des Comptes (2016), page 436. Translation from French by the Authors.
19
The article in the French newspaper Le Parisien is available at:
http://www.leparisien.fr/economie/un-geant-du-transport-naitra-de-la-fusion-veolia-transdev-
23-07-2009-588430.php.
13such that the choice of Veolia was mainly motivated by private interests.20 Thus,
we are strongly convinced that the treatment is not endogenous to operating costs
of networks operated in France.
3.2 Data
Our study uses a 9-year panel of urban public transport networks in France for the
years 2006-2014. The database was created from an annual survey conducted by
the Centre d’Études et d’Expertise sur les Risques, l’Environnement, la Mobilité
et l’Aménagement (CEREMA) in collaboration with the Groupement des Autorités
Responsables de Transport (GART) and the Union des Transports Publics et fer-
roviaires (UTP). The database contains details on the actors providing the service,
the regulatory environment, as well as costs and revenues of operators.21
We complement this with an original database gathering tenders for the choice of
a transport operator that took place between 2004 and 2014. This information was
obtained from press releases and from representatives of organizing authorities. The
dataset includes the identity of the transport operators that submitted bids in the
tender, the identity of the incumbent transport operator, as well as the identity of the
winner of the competitive bidding procedure. This database allows us to introduce
one additional control group (C3), relying on information on participation of groups
in tenders.
Our main analysis relies on a larger number of transport networks, dispersed
geographically across the country. Details on the number of observations (and net-
works) included in the respective treatment and control groups are presented in
Table 2. Figure 2 then provides their cartographic representation.
Table 2: Number of observations [networks] pre- and post-merger, distinguishing
between treatment and control groups
Group All Pre–merger Post–merger
Treatment 351 [55] 192 [50] 159 [44]
C1 406 [59] 202 [49] 204 [56]
C2 342 [50] 200 [48] 142 [45]
C3 120 [16] 66 [15] 54 [15]
Studying the effects of the merger on operating costs requires data on the oper-
ating costs, as well as factors, other than the merger, influencing them. Operating
20
The French newspaper Mediapart published an investigation on the merger in June 2012. See
“Veolia Transdev : the secrets of a financial mega-disaster,” by Laurent Mauduit, June 28, 2012,
Mediapart.
21
For sake of homogeneity across observations, only bus networks serving more than 20,000
inhabitants in the territory of France are selected for the analysis.
14(a) Treatment group
(b) Control groups
Figure 2: Map of transport networks included in the treatment and respective control
groups
15costs C are defined as the sum of labor costs and material costs. Output Y is mea-
sured by the number of seat-kilometers, i.e. the number of seats available on all
buses multiplied by the number of kilometers traveled on all routes. Thus, we use a
supply-oriented output variable. Labor price P L is obtained by dividing labor costs
by the annual number of employees employed directly by the operator.22 Material
price P M is obtained by dividing material costs by the total number of vehicles op-
erated by the operator (without including subcontracted vehicles). Since the local
authority owns the rolling stock and infrastructure, which are put at the disposal of
the operator, the operator does not incur capital costs.
Descriptive statistics of our database, which covers 2006-2014, are presented
in Table 3. In the full sample, average operating costs amount to nearly e5M.
The average input prices are approximately e37,000 per employee and e19,000 of
materials per vehicle per year. More than 140 million seat-kilometers are supplied
yearly, on average. For the majority of observations (90%), networks are regulated
under fixed-price contracts.
Table 3: Statitics on the dataset – all observations
Variable Variable Name Mean SD Min. Max.
C Costs (’000 Euros) 4,984.8 6,232.5 38.0 38,435.6
Y Production (’000 seat–kilometers) 143,831.0 159,790.4 711.5 872,391.2
PL Wages (’000 Euros per employee) 37.3 6.2 20.1 80.7
PM Price of materials (’000 Euros per bus) 18.5 7.1 1.7 59.7
FP Fixed-price contracts 0.9 0.3 0.0 1.0
Table 4 reports the mean values of our variable of interest (operating costs) in the
periods prior to and following the merger, separately for our treatment and control
groups. We find that, on average, the treatment faces higher operating costs than
the control groups. Looking at the difference in costs post- versus pre- merger, on
average, yearly costs have increased (yet insignificantly) for all groups considered.
Table 4: Equality of the means prior and post merger
Group Mean pre–merger Mean post–merger Difference t-statistic
Treatment 5,865.2 7,218.0 1,352.8 -1.36
C1 4,737.6 5,760.8 1,023.2 -1.55
C2 4,741.5 5,523.7 782.1 -1.18
C3 5,506.1 6,329.3 823.2 -0.52
* p < 0.10, ** p < 0.05, *** p < 0.01
22
Labor costs concern employees employed directly by the operator. Consequently, the number
of employees does not include the employees of companies to which the operator outsources some
activities. Employees of subcontracting companies represent between 6% and 9% of the total
number of employees of the operator depending on the year considered.
164 Results
4.1 Main results
The results of estimating equation 1 are presented in Table 5, where the costs of the
merging parties are compared to the carefully designed control groups C1, C2, and
C3. We consider two main specifications, gradually controlling for more observable
factors of operating costs that could vary over time. In the first (Specification 1 ),
we control only for the size of the network (ln(Y )). In the second (Specification 2 ),
we include wages (ln(P L)) and material costs (ln(P M )).23 Finally, we introduce
an additional specification (Specification 2 w/ window) consisting of estimations
excluding the years 200924 and 2010. This corresponds to the period between the
announcement of Transdev wanting to merge and the merger itself. The aim of this
test is to rule out the possibility of operating costs of Veolia, Transdev, or its rival
groups being affected by the announcement of the merger.
All specifications include fixed effects to account for the time-invariant hetero-
geneity between networks. This allows for controlling for changes in economic factors
that may impact operating costs but are unobservable to the econometrician. In ad-
dition, we include time dummies to control for changes in operating costs observed
over time, common for all groups. In order to address serial autocorrelation issues,
standard errors are clustered by network in all regressions.
For all control groups and specifications considered, the effect on our coefficient
of interest (Post-merger × Treatment) are low in value (ranging from 1.1% and
4.1%, depending on the specification considered) and insignificant. In addition, the
parameters of the remaining covariates introduced in our model under all specifica-
tions considered are significant, with the expected sign and magnitude. As expected,
a positive variation in output impacts cost positively. Similarly, an increase in labor
and material price, ceteris paribus, increases costs. Overall, these results clearly
suggest that the merger did not lead to merger-specific cost efficiencies. Our con-
clusions do not change following the exclusion of the years 2009 and 2010 from the
sample.25
We verify the satisfaction of the parallel trends assumption running a placebo
test, as presented in equation 2. It consists in introducing placebo treatments in
23
We also consider an alternative specification consisting of estimating a flexible translog cost
function to represent the variable cost function. We do not focus on this specification here, as
we are interested in an analysis beyond scale efficiencies. Indeed, efficiencies may also come from
a reorganization of activities of the merging parties. In any case, results are unchanged by this
modification and are available upon request.
24
We test several alternative time windows, starting at 2007 and 2008. This does not change
our results and conclusions of the analysis remain the same and are available upon request.
25
We also considered specifications with separately material and labor costs as variables of in-
terest. The qualitative results remain unchanged and are available upon request.
17Table 5: Difference-in-differences estimation - main results
Specification 1 Specification 2 Specification 2 w/ window
(C1) (C2) (C3) (C1) (C2) (C3) (C1) (C2) (C3)
Treatment variables
Post–merger × Treatment 0.038 0.035 0.033 0.040 0.040 0.011 0.038 0.041 0.017
[0.031] [0.030] [0.041] [0.031] [0.029] [0.038] [0.036] [0.036] [0.047]
Treatment -0.21 -0.33 0 -0.19 -0.31 0 -0.13 -0.22 0
[0.14] [0.24] [.] [0.15] [0.25] [.] [0.12] [0.19] [.]
Control variables
ln(Y) 0.36∗∗∗ 0.35∗∗∗ 0.13∗ 0.35∗∗∗ 0.34∗∗∗ 0.12∗ 0.35∗∗∗ 0.34∗∗∗ 0.11∗
[0.11] [0.11] [0.070] [0.11] [0.11] [0.065] [0.11] [0.12] [0.067]
ln(PL) 0.21 0.22 0.41∗∗ 0.44∗∗ 0.46∗∗ 0.60∗∗∗
[0.26] [0.26] [0.20] [0.19] [0.20] [0.17]
ln(PM) 0.13∗∗∗ 0.13∗∗∗ 0.069 0.16∗∗∗ 0.17∗∗∗ 0.093∗
[0.041] [0.041] [0.066] [0.057] [0.059] [0.048]
Constant 3.76∗∗∗ 3.94∗∗∗ 6.16∗∗∗ 2.79∗∗∗ 2.89∗∗∗ 4.64∗∗∗ 1.93∗ 1.96 4.04∗∗∗
[1.20] [1.22] [0.78] [0.90] [1.00] [1.10] [1.15] [1.21] [0.92]
Fixed effects yes yes yes yes yes yes yes yes yes
Clustered SE yes yes yes yes yes yes yes yes yes
Year dummies yes yes yes yes yes yes yes yes yes
Observations 757 693 471 757 693 471 595 533 368
R2 - adjusted 0.50 0.50 0.42 0.53 0.52 0.49 0.62 0.62 0.60
Standard errors in brackets
∗
p < 0.10, ∗∗ p < 0.05, ∗∗∗ p < 0.01
the equation of interest in all years except one, for the respective specifications
considered in the analysis. The estimated coefficients βj are plotted in Figures 3a
to 3c, for the respective control groups considered. On top of verifying whether
there is a difference between the two groups before the merger, which is reflected
by coefficients βj with j < 2010, βj with j > 2010 show how the treatment effect
evolves over time after the merger. We might expect the treatment effect to quick in
as time passes since change can take time to implement after a merger. These graphs
show that none of the coefficients are significant (at a 5% significance level) in the
pre-treatment period, confirming the parallel trends assumption. It also shows that
we do not observe any significant effect after the merger.
4.2 Heterogeneous treatment effects
The fact that we do not observe any significant average result might suggest that
our framework fails to take into account some important underlying heterogeneity
in the behavior of networks exploited by the merging parties. Consequently, be-
sides estimating the average effect of the merger on operating costs, we also assess
whether the effect differs along relevant dimensions of heterogeneity in the network
characteristics. These include heterogeneity in the identity of the merging parties,
contract type in place, and the closeness of competition.
Firstly, we explore whether there is any underlying heterogeneity in the behavior
of networks exploited by the two merging parties, Veolia and Transdev. The term of
interest Post-merger × Treatment is interacted with a dummy variable associated
18(a) Control group C1)
(b) Control group C2
(c) Control group C3
Figure 3: Time relative to the merger for main specifications considered and corre-
sponding to results presented in Table 5).
19to the merging transport group that managed the network prior to the merger,
either V eolia or T ransdev. To identify the terms of interest, we need to be able
to identify which of the merged party’s networks were assigned to either Veolia or
Trandev before the merger. For this reason, we restrict our treatment to contracts
of the merging parties for which we have observations both before and after the
merger. The results are reported in Table 6.26
Table 6: Difference-in-differences estimation - heterogeneity, by merging party
(C1) (C2) (C3)
Treatment variables
Post–merger × Treatment × Veolia 0.041 0.061 0.025
[0.048] [0.046] [0.031]
Post–merger × Treatment × Transdev -0.014 0.0025 0.029
[0.022] [0.028] [0.027]
Control variables
ln(Y) 0.18∗∗∗ 0.16∗∗∗ 0.13∗
[0.059] [0.059] [0.064]
∗∗∗ ∗∗∗
ln(PL) 0.53 0.55 0.62∗∗∗
[0.13] [0.13] [0.15]
∗∗∗ ∗∗∗
ln(PM) 0.15 0.15 0.12∗∗
[0.041] [0.045] [0.046]
∗∗∗ ∗∗∗
Constant 3.41 3.54 3.88∗∗∗
[0.75] [0.77] [1.04]
Fixed effects yes yes yes
Clustered SE yes yes yes
Year dummies yes yes yes
Observations 642 578 305
R2 - adjusted 0.63 0.61 0.63
Standard errors in brackets
∗
p < 0.10, ∗∗ p < 0.05, ∗∗∗ p < 0.01
When considering these separate effects, we find no indications of merger effi-
ciency gains, irrespective of the party to the merger considered. In terms of magni-
tude, the effect for Transdev range from -1.4% to 2.9% and are slightly higher than
for Veolia, which range from 0.25% to 6.3%.
Another potential source of heterogeneity in the behavior of networks may be the
contract type in place for a network throughout a contractual period. Gagnepain
and Ivaldi (2017) suggest that operating costs may differ depending on the type of
regulatory contract type in place (fixed-price or cost-plus). In networks regulated
under fixed-price contracts, operators receive subsidies according to their expected
operating deficits. Therefore, any changes in operating costs affect their profits.
26
Note that we exclude Treatment from our model, as in the samples considered and within a
network, we observe no changes in the belonging to the control or treatment groups that would
allow us to identify the coefficient in the presence of network fixed effects.
20On the other hand, in networks regulated under cost-plus contracts, the organizing
authority collects commercial receipts and fully reimburses the operator’s operating
costs, increased by a pre-defined additional amount that constitutes the margin of
the operator. Under this regulatory scheme, the regulator provides the operator
with subsidies to cover its actual operating deficits. Cost changes do not affect the
operator’s profits. We expect that incentives for cost-reducing activities post-merger
may be stronger for networks where fixed-price contracts are in place. We examine
whether the effect of the merger differs between fixed-price and cost-plus contracts.
Table 7 reports the estimated coefficients for heterogeneous treatment effects. In
the first part of the table, the term Post-merger × Treatment is interacted with
the dummy variable associated to the choice of contract type, where F P refers to
fixed-price contracts and CP to cost-plus contracts.27 In the remaining columns,
we consider a sample containing only contracts regulated under F P ; approximately
90% of all observations.28
Our results suggest that there is no significant difference in the effect of the
merger for networks regulated under cost-plus contracts and for networks regulated
under fixed-price contracts. We conclude that the effect of the merger on the merg-
ing groups did not differ significantly depending on the contract type in place and
remains insignificant.
Finally, we also consider the effects of mergers depending on whether the merg-
ing parties were direct local competitors prior to the merger. We introduce two
definitions of such networks. The first consists of networks of one of the merging
party such that another network was operated by the other merging party in the
same county. The second consists of networks of one of the merging party such that
another network was operated by the other merging party in the same or adjacent
counties. The results of the respective specifications are presented in Table 8.
Accounting for whether the merging parties were direct local competitors prior
to the merger, we find no merger-specific efficiency gains.
27
Given that we include network fixed effects in our specifications, the coefficients on F P and
CP solely rely on eight changes of contract type in our sample, of which one concerns our treatment
group. Thus, our results must be interpreted with caution.
28
Please note that we do not separately estimate the model for CP contracts, as we face sub-
stantial limits in number of observations for this contract type.
21Table 7: Difference-in-differences estimation - heterogeneity, by contract type
Interactions w/ contract type Only FP contracts
(C1) (C2) (C3) (C1) (C2) (C3)
Treatment variables
Post–merger × Treatment × CP 0.037 0.033 0.029
[0.034] [0.047] [0.024]
Post–merger × Treatment × FP 0.040 0.040 0.061∗∗ 0.049 0.051 0.065∗∗
[0.033] [0.031] [0.030] [0.034] [0.032] [0.032]
Treatment × CP -0.058 -0.16 0
[0.055] [0.13] [.]
Treatment × FP -0.22 -0.33 -0.033∗∗ -0.22 -0.35 0
[0.21] [0.32] [0.017] [0.24] [0.36] [.]
FP 0.16∗ 0.12∗∗∗ 0
[0.084] [0.030] [.]
Control variables
ln(Y) 0.35∗∗∗ 0.34∗∗∗ 0.15∗∗ 0.34∗∗∗ 0.33∗∗∗ 0.15∗
[0.11] [0.11] [0.070] [0.12] [0.12] [0.074]
ln(PL) 0.22 0.23 0.33 0.19 0.20 0.33
[0.25] [0.25] [0.22] [0.25] [0.26] [0.23]
ln(PM) 0.13∗∗∗ 0.13∗∗∗ 0.077 0.14∗∗∗ 0.14∗∗∗ 0.078
[0.041] [0.044] [0.071] [0.046] [0.049] [0.076]
Constant 2.66∗∗∗ 2.79∗∗∗ 4.77∗∗∗ 2.96∗∗∗ 3.13∗∗∗ 4.69∗∗∗
[0.89] [0.98] [1.25] [0.95] [1.08] [1.30]
Fixed effects yes yes yes yes yes yes
Clustered SE yes yes yes yes yes yes
Year dummies yes yes yes yes yes yes
Observations 757 693 419 687 630 362
R2 - adjusted 0.53 0.52 0.49 0.50 0.50 0.48
Standard errors in brackets
∗
p < 0.10, ∗∗ p < 0.05, ∗∗∗ p < 0.01
22You can also read