MASTER'S THESIS Modeling Mode Choice Behavior After the Introduction of New Railway Connections to Munich Airport - TUM
←
→
Page content transcription
If your browser does not render page correctly, please read the page content below
Technische Universität München - Modellierung Räumlicher Mobilität
 Univ.-Prof. Dr.-Ing. Rolf Moeckel
 Augustenstraße 44, 80333 München, www.msm.bgu.tum.de

 MASTER’S THESIS

Modeling Mode Choice Behavior After the Introduction
 of New Railway Connections to Munich Airport

 Author:
 Sofiia Vernydub

 Supervision:
 Dr. Carlos Llorca Garcia

 Date of Submission: 2020-05-05
 1
Table of Contents

Table of Contents............................................................................................................................ I

Abstract ......................................................................................................................................... III

Acknowledgment .......................................................................................................................... IV

1. Introduction ................................................................................................................................ 1

1.1. Outline of Paper ...................................................................................................................... 2

2. Literature Review ....................................................................................................................... 3

2.1. Four-Step Model...................................................................................................................... 3

2.2. Discrete Choice Models ......................................................................................................... 5

2.3. Nested Logit Model ................................................................................................................. 6

2.4. Airport Mode Choice Models ................................................................................................. 9

3. Methodology and Aim of the Thesis ...................................................................................... 12

4. Data Collection ......................................................................................................................... 15

4.1. Synthetic Population ............................................................................................................ 16

4.2. Mode Choice Survey of Munich Airport Workers .............................................................. 17

4.3. Passenger Survey of Munich Airport .................................................................................. 17

4.4. Data Processing .................................................................................................................... 18

4.4.1. Transfers, travel time and travel cost ................................................................................... 19

4.4.2. Personal attributes of the airport workers ............................................................................ 22

4.5. Data Analysis ........................................................................................................................ 23

5. Model Estimation ..................................................................................................................... 24

5.1. Variables and Correlations .................................................................................................. 24

5.2. Utility Function ...................................................................................................................... 26

5.3. Model Estimation with R Software ...................................................................................... 27

5.4. Multinomial Logit Model ....................................................................................................... 28

5.4.1. Transfer Penalty................................................................................................................... 29

 I
5.4.2. Value of Time ....................................................................................................................... 30

5.5. Nested Logit Model ............................................................................................................... 34

6. Estimation Results................................................................................................................... 35

7. Scenario Analysis .................................................................................................................... 39

7.1. Catchment Area .................................................................................................................... 39

7.2. Scenario 1: Erding Ring Closure ......................................................................................... 40

7.3. Scenario 2: Munich Ring Railway........................................................................................ 41

7.4. Scenario 3: Transrapid Munich ........................................................................................... 41

7.5. Scenario 4: Airport Express................................................................................................. 41

7.6. Direct Bus Connections Scenario ....................................................................................... 41

7.7. Spatial Analysis .................................................................................................................... 42

8. Conclusions ............................................................................................................................. 43

8.1. Limitations and Suggestions for Further Research .......................................................... 44

List of References ........................................................................................................................ 46

List of Abbreviations ................................................................................................................... 50

List of Figures .............................................................................................................................. 51

List of Tables ................................................................................................................................ 52

Appendix A. Estimation results for APMs with three modes .......................................................... 53

Appendix B. Comparison of models’ goodness of fit with different transfer penalty values ........... 54

Appendix C. Complete output of mlogit function ............................................................................ 55

Appendix D. The base modal shares compared to predicted modal shares with 500 m and
2,000 m radii of catchment area .................................................................................................... 60

Appendix E. The spatial distribution of predicted transit shares .................................................... 61

Appendix F. The spatial distribution of predicted transit shares by airport user groups ................ 63

Declaration concerning the Master’s Thesis............................................................................. 64

 II
Abstract

The demand for air travel has grown steadily over the last few years and consequently increased
the number of trips to the airport made by air travelers and airport employees. As a result, ground
access to the airport has become an essential factor in airport attractiveness. This study intends
to investigate the mode choice behavior of airport workers and airport passengers after the
introduction of new railway connections to Munich Airport.

The assessment of the effect of these transportation links will be based on the revealed
preference surveys of passengers and employees of Munich Airport. Discrete choice models are
estimated with R software to analyze the sensitivity of airport users to changes in the railway
service. The research considers six transport modes – private car, rental car, car sharing, taxi,
bus and train; later, they are merged into auto and transit alternatives. The estimation results
confirm the assumption that the reduction of travel time and a number of transfers makes transit
services more attractive for airport users. Gender, age, number of accompanying people and
monthly household income also have an impact on mode choices of air passengers.

The parameters determined for each model are applied to assess various scenarios involving
railway projects in the area of Munich Airport and study their impact on the travel behavior of
airport users. The spatial analysis defined areas affected by the modifications in the railway
network proposed by each scenario and compared changes in transit shares. The findings of this
research create a foundation for ground transportation planning in the area of Munich Airport that
takes into account factors influencing travel behavior of air passengers and airport employees.

 III
Acknowledgment

First of all, I would like to thank my supervisor, Dr. Carlos Llorca Garcia, who guided me and gave
a constructive feedback through each stage of this research. Our meetings and discussions
provided me new perspectives and inspired to think outside the box. His experience and
knowledge made an invaluable contribution to this study. I am grateful that I got an opportunity to
work under his guidance.

Besides, I would like to acknowledge the Traffic Planning Department of Munich Airport for the
provision of vital information that enabled this research to be possible. I also want to pay special
regards to Uwe Martin who was always willing and enthusiastic to assist in any way he could
during the stage of data collection.

I would like to thank the Modeling Spatial Mobility research group for cooperation and access to
various information sources that made it possible to test different approaches to the assigned
task.

I also wish to express my deepest gratitude to my family that constantly encouraged me along the
way despite the distance between us. My academic and professional success would not have
been possible without their support and faith in me. Finally, I thank wholeheartedly my partner
who kept me going on and was there for me in the most difficult moments. I could never have
reached this point without you.

 IV
Introduction

1. Introduction

Munich Airport is the second-largest airport in Germany and plays an important role in the Munich
region (Flughafen München GmbH, 2017). Increasing demand for air travel is represented by the
steadily growing airport passenger turnover. The airport is no longer just a transportation node – it
facilitates economic growth in the region, provides space for business and innovation activities,
and simply serves as a recreational area. At this point, ground accessibility becomes one of the
key factors in airport attractiveness for all its users and visitors.

People use various means of transport to reach Munich Airport. According to the research made
in 2017 by its authorities, 50% of departing passengers’ trips were made by taxis, private and
rental cars (Flughafen München GmbH, 2017, p. 15). The passenger surveys conducted in other
airports reveal an even higher proportion of trips made by car. In particular, their shares in 2005
comprised 63%, 67%, 61% and 72% in Heathrow, Gatwick, London Stansted, and London Luton
airports respectively (National Academies of Sciences, Engineering, and Medicine [NASEM],
2008, p. 137). With the growing number of air travelers, the number of trips to Munich Airport will
continue to rise. This can result in obstructed traffic, heavy road congestion during peak hours
and an increasing level of emissions in the airport area.

Similarly, airport employees use private vehicles as the major mode to access their workplace. In
the overview of modal shares among workers of Frankfurt International and Hamburg Airports
transit comprises only 15% (Leigh Fisher Associates, Coogan & MarketSense, 2000, p. 38). The
peculiarities of work at the airport contribute to the low popularity of transit. The shifts are done
also at night and early in the morning, including weekends and holidays, when the public transport
service may be limited or absent. At the same time, the deficiency of public transport connections
to the airport is one of the key factors that influence the decision of airport workers to use private
vehicles (Leigh Fisher Associates et al., 2000, p. 21). Thus, it is important to improve ground
access to the airport and support sustainable modes of transport not only from the passengers’
but also from the airport employees’ perspective.

One of the ways to promote public transport access to the airport is the provision of rail
connections. Birolini et al (2019, p. 122) stated in their work that a direct railway service to the
airport is a competitive transport option, which will be capable of attracting a significant share of
travelers. The authors also mentioned that the airport’s express train has a much higher potential
to increase the use of the railway services than a simple extension of the existing regional
commuter service (Birolini et al, 2019, p. 113). Moreover, Murakami (2016, p. 97) revealed the

 1
Introduction

relation between airports with rail links and economic development. His research demonstrates
that cities around the world with a rail connection to the airport and with urban rail investments are
respectively 22% and 14.7% more productive than those without any rail systems. This means
that, in addition to improved transport connectivity of the airport, rail links can promote the
economic development of a region.

In the chosen study area a large-scale railway project Erdinger Ringschluss is scheduled to be
executed until 2029, followed by another massive railway connection Walpertskirchener Spange.
This study as well considers several other projects developed for the Munich Airport area to
improve its rail connectivity with surrounding regions. NASEM (2008, p. 14) emphasized that
changes in airport ground access systems (for instance, the establishment of a new rail link to the
airport) are likely to have an outcome in the relative attractiveness of different modes, and thus in
shares of travelers using each mode. That is why it is essential to be able to predict the travel
behavior of airport passengers and their modal choices in response to changes in the range of
existing options (NASEM, 2008, p. 14). Given these facts, this thesis aims to estimate the effect of
new rail connections to Munich Airport on the travel behavior of airport workers and airport
passengers. The resulting mode choice decisions will be predicted using a discrete choice model
and compared with actual modal shares to evaluate the effects of these changes in the airport
ground access.

1.1. Outline of Paper

This thesis is subdivided into eight chapters. An overview of the relevant literature that specifies
the academic and research activity in the field of mode choice models for airport users is provided
in Chapter 2. Chapter 3 describes the proposed methodology and specifies the research
objective. In Chapter 4 various stages of the data collection, processing (Section 4.4) and analysis
(Section 4.5) are presented. Chapter 5 explains the process of model estimation and Chapter 6
focuses on the estimation results. In Chapter 7 various scenarios incorporating railway projects in
the area of Munich Airport are tested. In the same chapter, the predicted modal shares of airport
passengers and employees are compared to the base scenario and spatially analyzed. Finally,
Chapter 8 completes the thesis with conclusions, limitations of this study and suggestions for
future research.

 2
Literature Review

2. Literature Review

2.1. Four-Step Model

With the help of transportation forecasting, the future need for transportation and the capabilities
of the transport system can be evaluated. The forecasting models can determine the impact of
modifications in the transport system. For example, a forecast can demonstrate the changes in a
modal split of the region due to the construction of a new railway line or estimate its effect on the
public transport ridership. Such predictions are widely used for transportation planning, traffic
engineering studies, as well as the design of new transport infrastructure.

A traditional approach to transportation forecasts is a four-step model. This model is used to study
various transport systems and to predict the behavior of its users. For the first time the model was
applied to the full extent in 1955 for the Chicago Area Transportation Study travel forecasting
(Weiner, 1997, p. 18). Rosenbaum and Koenig (1997, pp. 10-11) described the four steps of a
travel demand model:

 1) Trip generation – in the beginning, a study area is divided into traffic zones, where a
 number of trips is generated and attracted by each zone. The calculation of generated and
 attracted trips in each zone is based on the information about households, the number of
 working places and the population of each zone;
 2) Trip distribution – the origin and destination of each trip are matched and the number of
 trips from and to each zone is calculated. Traditionally, this is done with the help of gravity,
 or spatial interaction model, travel time is used as an accessibility measure;
 3) Mode choice – in this step trips are split by transport mode, and as a result, it is possible to
 estimate modal shares. Mode choice models can also consider the travel cost, the relative
 travel time and the trip purpose;
 4) Trip assignment – in the final step the trips between origins and destinations are loaded in
 the transportation network. Traffic assignment defines the route that is chosen by each
 user to reach their destination points and is usually based on the assumption that
 individuals attempt to minimize their travel time. This process continues until all trips are
 loaded into the network.

 3
Literature Review

 Figure 1. Four-Step Model (adapted from Rosenbaum & Koenig, 1997, p. 11)

Figure 1 is a schematic representation of the traditional four-step travel demand model. This
research focuses on the third step of the estimation process – mode choice. NASEM highlighted
in their review of airport ground access mode choice models that the possibility to predict mode
choices of airport workers and air passengers is “a key analytical component of airport landside
planning, as well as airport system planning” (2008, p. 11).

There are two main approaches in modeling the travel behavior – aggregate and disaggregate. In
the first case, the modeling is made for a group of individuals, clustered by their socio-economic
attributes, while modeling the travel choices for each individual is known as a disaggregate
approach (Koppelman & Bhat, 2006, p. 1). The essential advantages of the disaggregate
approach over the aggregate approach were defined by Koppelman and Bhat (2006). According
to the authors, this approach explains the choice of each individual in given conditions, and thus
better reflects changes in choice behavior if attributes of individuals or alternatives are changed.
The second advantage is the causal nature of the disaggregate approach that increases the
likelihood of predicting in a different time and geographic context (Koppelman & Bhat, 2006, p. 2).
Third, the author stated that aggregation results in a substantial loss in variability, thus having a
lower level of model precision than with the disaggregate approach. Finally, Koppelman and Bhat
(2006, p. 2) pointed out that the proper specifications of disaggregate models produce unbiased
parameter estimates. Due to these advantages of the disaggregate approach, discrete choice
models are extensively used in travel demand modeling.

 4
Literature Review

2.2. Discrete Choice Models

Discrete choice models explain decision-makers’ choices among a finite number of mutually
exclusive alternatives (Train, 2009, p. 11). These models calculate the utility for each of the
alternatives. According to NASEM (2008, p. 22), utility is a function of measurable (observable)
characteristics of both the decision-maker (e.g. income, age, education) and the alternative (e.g.
travel time, travel cost). It is assumed that the individual will always choose the alternative with the
highest utility.

However, it is not possible to perfectly model human behavior in the real world. The decision
made by an individual does not only depend on certain characteristics of the alternative but also
some unobservable parameters – a lack of information about another alternative, specific
circumstances in the process of decision making (e.g. weather conditions, national holidays),
personal preferences and perceptions, etc. Train (2009, p. 34) stated that these parameters are
also included in the utility function and considered by the researcher as random. A decision-maker
n has j alternatives and the utility U obtained from alternative j has two components – the known
observable parameters V and the unknown part ε (Train, 2009, p. 34):

 !" = !" + !" (1)

The random component ε in Equation 1 takes into account all unobserved variations in taste and
preferences that influence a person’s decision. Train (2009, p. 34) noted that by assuming that
each εnj is identically and independently distributed extreme value, the logit choice model is
derived. Depending on the number of alternatives, there are binomial (with two alternatives) and
multinomial (with three or more alternatives) logit models.

The probability of choosing a certain alternative is always between 1 and 0 – the higher is the
utility of the alternative, the more likely the individual is to choose it. A common mathematical form
to express it is the logistic function that has been widely used for airport access mode choice
studies (NASEM, 2008, p. 4). For a model that considers more than two alternatives the
probability that the individual n chooses the alternative i equals:

 ! !!"
 !" = !!" (2)
 !!

where Vni represents observable variables related to alternative i and j is the number of
alternatives (Train, 2009, p. 37).

 5
Literature Review

The problem of logit models is the independence of irrelevant alternatives (IIA). Train (2009,
p. 45) claims that for any two alternatives the ratio of logit probabilities does not depend on any
other alternatives. This means that the relative chances of choosing one alternative over another
are the same, regardless of other available alternatives and their attributes (Train, 2009, p. 45).
But this IIA property is not applicable in all situations. Train (2009, p. 46) demonstrates it on the
well-known example of the red-bus-blue-bus problem. A new alternative is introduced to a model
with equal choice probabilities between a car and a blue bus (exactly like a blue bus, just in red
color), so the choice probabilities will be equally distributed among alternatives ( !"# = !"#$!#% =
 !
 !"#$%& = ); however, in real life, the original probability of taking the bus would be split between
 !

the two buses (Train, 2009, p. 46). To overcome the IIA problem of the multinomial logit model, a
nested logit (NL) model can be used.

2.3. Nested Logit Model

According to Train (2009, p. 77), the NL model is suitable when the most similar to each other
alternatives faced by an individual can be subdivided into sets, called nests. A tree diagram below
demonstrates an example of a nested structure for the decision maker’s mode choices.

 Figure 2.Tree Diagram of Mode Choice (adapted from Train, 2009, p. 83)

In Figure 2 the alternatives were grouped into auto and transit nests. This division can be affected
by vehicle ownership that in this case forms two transport subsets. Regardless of the chosen
structure, the one pattern will be applicable for NL models: the IIA problem remains within each
nest but not across nests (Train, 2009, p. 78). Caused by the similarity of the alternatives in one
nest, the cross-elasticities between them will be higher than between nests – in this way, an
increase in the travel cost for rail will have a bigger impact on transit modes as they are more
correlated. With a nesting structure, the red-bus-blue-bus problem from MNL models is omitted.

 6
Literature Review

For instance, if the bus alternative is removed from this sample structure, the probability of
individual driving by rail increases more than the probability of a carpool or driving the car alone.

According to Train (2009, p. 79), if alternatives are grouped into k nests (B1, B2, …, Bk), the utility
that a person obtains from alternative j in nest Bk can be expressed by Equation 1. However, εnjs
are correlated within nests, so for any two alternatives j and m in nest BK, εnj is correlated with εnm
(Train, 2009, p. 79).

If the utility has to be calculated on the deeper level of the structure, the formula changes. Let us
consider the tree diagram with a two-level nesting structure as an example, so the Bk nest will
stand for “Transit” and the alternative j will stand for “Bus” in the k nest. Then the utility equation
for the “Bus” alternative is:

 !" = !" + !" + !" (3)

where Wnk depends only on variables that describe nest k and Ynj depends on variables that
describe the alternative j (Train, 2009, p. 82). The part named Ynj will be different for the “Rail”
alternative in the “Transit” nest, while the Wnk part will remain the same for both the “Bus” and the
“Rail” alternatives. However, for the nest “Auto” the Wnk component will be different.

The probability of selecting the alternative i in nest Bk can be expressed as the product of two
probabilities:

 !" = !" !! ∙ !!! (4)

where Pni | Bk is the conditional probability of choosing the alternative i if nest Bk is chosen, and PnBk
is the marginal probability of selecting an alternative in nest Bk (Train, 2009, p. 82). In this
equation Pni | Bk can be expressed as:

 !!"
 ! !!
 !" !! = !!" (5)
 !
 !"!! ! !

where λk is the logsum coefficient (Train, 2009, p. 82). The values of this parameter denote how
similar are the pairs of alternatives in the nest, where λk = 0 implies that pairs of alternatives in the
nest are perfectly correlated and λk = 1 states that there is no correlation among mode pairs in the
nest, so the NL model turns into the multinomial logit (MNL) model (Koppelman & Bhat, 2006,
p. 163).

 7
Literature Review

To express the marginal probability PnBk, Train (2009, p. 82) uses the following equation:

 ! !!" !!! !!"
 !!! = ! ! !!" !!! !!" (6)
 !!!

The author explains that the probability of choosing nest Bk depends on the expected utility that
the individual obtains from the nest. This expected utility consists of Wnk – the utility that the
person gets regardless of which alternative is chosen in the nest, and λkInk – an additional utility
that the decision-maker n gets by being able to select the best alternative in nest Bk (Train, 2009,
p. 83).

Ink is the log of the denominator in conditional probability formula:

 !!"

 !" = !"!! !
 !
 (7)

and represents the expected utility for the choice of alternatives within nest Bk and is the log of a
sum of the nested utility exponents (Train, 2009, p. 83).

Referring to the tree diagram that was taken as an example, the conditional probability that the
decision-maker uses “Rail” if the nest “Transit” is chosen will be:

 !! !"
 ! !!"#$%&'
 !"#$ !"#$%&' = !!"#$ !!"# (8)
 ! !!"#$%&' !! !!"#$%&'

and the marginal probability of choosing an alternative in the “Transit” nest will be:

 ! (!!"#$%&' !!!"#$%&' !!"#$%&' )
 !"#$%&' = (9)
 ! !!"#$ !! (!!"#$%&' !!!"#$%&' !!"#$%&' )

The tree diagram in Figure 2 considered as an example is one of many possible nested structures
that can be created from four alternatives (carpool, drive-alone, bus, train). Different structures of
NL models create different results and thus change model interpretation. The subsequent
changes in travel forecast may be significant enough to influence decisions regarding
transportation planning and capital investments. To select a suitable nesting structure, a
combination of judgment about reasonable nesting structures and statistical hypothesis testing is
needed (Koppelman & Bhat, 2006, p. 166).

 8
Literature Review

2.4. Airport Mode Choice Models

This study is initiated because at the moment there is a lack of insights into the current condition
of ground access to Munich Airport and its influence on the travel mode choice behavior of airport
users. Discrete choice models are widely used for travel demand modeling due to their ability to
analyze the decision-making behavior of users who have to choose between mutually exclusive
modes of transport. Such models are a powerful tool for forecasting the changes in travel
behavior due to the modifications in mode attributes (new tariffs, faster connection, increased
capacity), transportation network (new road or railway), or socioeconomic characteristics of an
individual (increase in income, age changes). There are numerous examples of discrete choice
models used in both air passenger and airport workers mode choice models.

In his book, Train (2009, p. 71) provided an example of a successful implementation of a logit
model for forecasting travel behavior of commuters after the launch of a new rail system in the
San Francisco Bay area. Mode choice models were estimated on the commuters’ sample before
the system launch and provided valuable information about factors that influence commuters’
decisions (Train, 2009, p. 71). After the Bay Area Rapid Transit system was open for service, the
mode choices of the commuters were observed and the predicted share of new rail system users
was compared with the observed share (Train, 2009, p. 71). Train (2009, p. 71) highlighted that
the models’ prediction was good and far more precise than the forecasts that did not use discrete
choice models.

The discrete choice modeling was also used in the research for the new Athens International
Airport. Psaraki and Abacoumkin (2002, p. 93) classified travelers in twelve types by
characteristics that affected their modal choice – residence, trip purpose and destination. In the
research they used a logit model to define ground access choices for each type of passenger at
the existing airport. The resulting choice probabilities were applied to forecast the modal split for
the new airport, so the proper planning of ground facilities could be done (Psaraki & Abacoumkin,
2002).

Birolini et al (2019) evaluated in their research a new direct rail connection to Milan-Bergamo
Airport, considering five modes of transport (private car, drop-off, taxi, bus and train) and two
market segments (business and non-business air travelers). The authors used a mixed
multinomial logit model to study the behavior of outgoing passengers, to estimate their sensitivity
to travel cost and travel time and to quantify access mode choice preferences of air passengers.

 9
Literature Review

Later, Birolini et al (2019, p. 117) simulated the introduction of new rail service and used the
estimated model coefficient to calculate the potential share of each transport alternative.

Miyoshi and Rietveld (2014) used another type of discrete choice model to test the hypothetical
carbon charge on car commuters that produce carbon dioxide emissions to access Manchester
Airport. The authors researched the impact of this charge on travel behavior with the help of the
two-level nested multinomial logit model, with one nest for car users (car alone, car with a
passenger, passenger in a car and taxi) and another for alternative mode choices (bus, metro,
walking and bicycle). The modal shares of commuters were calculated taking into account the
travel time and travel cost and then were compared to the modal shares after the introduction of
carbon charges (Miyoshi & Rietveld, 2014). The authors highlighted that there is a great effect of
shifting from private to public transport on the overall damage costs of CO2.

NASEM (2008) provided a comprehensive review of eight airport ground access mode choice
models. The study includes information about the data used for modeling, the structure of the
model, its explanatory variables, the market (air passengers or airport workers) and its
segmentation. Some of these models are reviewed in more detail below.

Based on an air passenger survey conducted in the Boston Logan International Airport in 1993,
two models with separate coefficients for business and non-business trips were created – NL for
residents and MNL for visitors (NASEM, 2008, p. 109). The broad list of considered variables
included the travel time (in-vehicle and out-of-vehicle), the access time to the public modes by
car, the travel cost, the number of transfers, the residence, the number of luggage pieces, the air
party size, the number of air trips in the last year and whether travel expenses were covered by
the employer (NASEM, 2008, p. 109). The resulting model was a part of the regional
transportation planning in the Boston metropolitan area and was used to predict car trips to and
from Boston Logan International Airport (NASEM, 2008, p. 112).

The Chicago Airport Express Ridership Forecasting study was conducted in 2004 to understand
how air passengers might change their mode choice behavior after the opening of an express
train connection between the Chicago city center and O’Hare International and Midway (NASEM,
2008, p. 113). Based on the results of revealed preference and stated preference surveys, two NL
models with nine transport modes were created for travelers on business and non-business
journeys (NASEM, 2008, p. 114). The utility function included the total travel time with different
weights for the access, transfer and waiting time, travel cost with separate coefficients for two
traveler income groups and two dummy variables – the availability of baggage check-in at the
downtown terminal and the use of an intermediate station (NASEM, 2008, p. 114). Several

 10
Literature Review

scenarios were tested to forecast the ridership and the revenue for the Airport Express train,
including different fares, the availability of a free shuttle and various travel time assumptions
(NASEM, 2008, p. 119).

Another airport access mode choice model described by NASEM (2008, p. 124) was developed in
2001 to evaluate the effect of a new transport link between bus rapid transit and Oakland
International Airport on ridership compared with an existing shuttle bus connection. The
multinomial logit model considered not only air passenger trips (subdivided by trip purpose and
residence) but also trips of the airport employees, and included six explanatory variables – the
travel cost, the household income, the waiting time, the walking distance and travel times by bus,
rail and car (NASEM, 2008, p. 125).

The described above studies suggest that the topic of airport access mode choice models is well
studied. They also provide evidence that discrete choice modeling is a suitable and appropriate
method for the problem considered in this research. However, there is no general approach to
model the alterations in the mode choice behavior of airport users after changes in the
transportation system (e.g. new transport connections) or transport service (e.g. new tariff). The
researchers use different model structures, market segmentation, transport modes and
explanatory variables in models for certain regions and even for airports in the same area. This
conclusion suggests that there are all preconditions to create separate mode choice models for air
travelers and employees of Munich Airport. The estimation results of these models will identify the
attributes that play a role in travel decisions of airport users. The insights of this research can be
used to create ground access strategies and evaluate transportation projects that can motivate
passengers and employees of Munich Airport to switch from private vehicles to more sustainable
modes of transport.

 11
Methodology and Aim of the Thesis

3. Methodology and Aim of the Thesis

Over the last couple of decades, there were numerous studies in the field of airport transport
accessibility, described in detail in Section 2.4. Nevertheless, the ground access at every airport is
unique because of the airport’s location, passenger volumes and their socio-economic
characteristics and even the economic development of the country. Comprehensive research
made by NASEM (2008) is questioning the transferability of airport ground access models due to
their wide-ranging specifications. Although the behavior of airport users seems to be similar in
different regions, “after taking into account differences in air passenger or airport employee
characteristics and transportation system service levels, it appears unlikely that current airport
access mode choice models do this correctly” (NASEM, 2008, p. 70). That is why the case of
Munich Airport has to be addressed individually to increase the accuracy of forecasting.

Another important aspect considered in this study is the travel behavior of airport employees.
Most of the studies mentioned in Chapter 2 do not examine this group of travelers during the
development of mode choice models. However, their trips can comprise a significant share of the
trips to and from the airport. It is essential to model mode choices of airport employees since their
trips are performed regularly and create a high demand for airport ground access services.

Based on the previous findings and practices, this research aims to estimate the impact of various
railway projects on the mode choice behavior of passengers and workers of Munich Airport. The
objectives are to create a discrete choice model for a part of the Munich metropolitan area and to
confirm the assumption that the improvement in the existing railway service will increase the
attractiveness of railway connections to the airport. The designed models can be used for future
surface transport strategies and planning procedures in the area of Munich Airport. In the
furtherance of this goal, a methodology described in Figure 3 will be implemented.

 12
Methodology and Aim of the Thesis

 Figure 3. Research Methodology

A process map in Figure 3 distinguishes four main steps: Data Collection, Data Processing and
Analysis, Model Estimation and Model Implementation. During the first step, three main data
sources are involved:

 1. Traffic Planning Department of Munich Airport – provided results of passenger and
 employee surveys;

 13
Methodology and Aim of the Thesis

 2. Assistant Professorship of Modeling Spatial Mobility – shared the attributes of a synthetic
 population, a map of traffic analysis zones and level of service for each transport mode;
 3. Geofabrik – a download server of Openstreetmap for geospatial data that was used for
 spatial analysis in this research.

After the collection of necessary data, all information went through certain processing stages.
First, irrelevant trip records are filtered out and the data are structured for further analysis and
merged into bigger data frames if necessary. Later, the missing information about the travel cost
is added to a dataset. Then, the airport passengers’ data are subdivided into four groups by
residence and travel purpose to create a separate sub-model for each of them. The processed
data is later analyzed by socio-economic and trip characteristics.

In the following step datasets for passengers and employees are transformed into a shape
suitable for statistical processing with R software. The models are iteratively estimated with mlogit
package for R to develop a utility function with explanatory variables and coefficients that have the
closest match to the input data. The output of each model is evaluated until the function that
results in the highest goodness of fit is defined for each group of airport users. During this stage,
the significance and plausibility of all explanatory variables in the selected models are confirmed.

Finally, the models are implemented to predict the impact of various railway projects on the modal
shares of employees and passengers of Munich Airport. Construction projects are subdivided into
four scenarios and compared to the base scenario, the variances in modal shares are analyzed
spatially and by groups of the airport users. With this approach, the railway projects that wield
major influence on the travel behavior of Munich Airport users can be identified.

 14
Data Collection

4. Data Collection

To conduct travel forecasting, prior data collection is necessary. Modeling mode choice behavior
can be based on the information obtained by conducting a revealed or stated preference survey.
The stated preference survey is used to examine choices that individuals will make among
hypothetical alternatives. For example, the survey might describe a set of future public transport
connections to the city center and ask an interviewee to choose one of the alternatives.

In contrast, the revealed preference survey collects the data about actual choices that were made
by individuals. In terms of mode choice modeling, the information obtained from the survey will
describe the actual trip and its attributes – the origin, destination, trip purpose, travel time and
mode of transport used. Additionally, it can also include information about decision-makers that is
believed to affect their choices (such as age, gender, income, education, occupation, etc.). There
are numerous examples of revealed preference surveys applied in other travel behavior
researches. For instance, Birolini et al (2019) used the results of the survey conducted in Milan-
Bergamo Airport to evaluate the new rail service. To understand the mode choices made by
commuters, Miyoshi and Rietveld (2014) used the data from a revealed preference survey of
Manchester Airport staff. Finally, Psaraki and Abacoumkin (2002) studied access modal split with
the help of a passenger survey conducted in the existing Athens Airport.

This study uses two revealed preference surveys, conducted by the Traffic Planning Department
of Munich Airport in 2018. The first one is a sample of almost 20,000 departing passengers and
provides individual characteristics of each traveler, together with the mode that was used to reach
the airport. The second one is a mode choice survey of around 3,000 Munich airport workers and
contains information about the transport means used by employees to commute to their
workplace.

Another data that is used for model estimation is the synthetic population provided by the
research group Modeling Spatial Mobility (MSM) led by Prof. Dr. Rolf Moeckel at the Technical
University of Munich (https://www.msm.bgu.tum.de) free of charge. Moeckel and Moreno (2018)
developed an algorithm that generated around 4.5 million individuals for the greater Munich
metropolitan area. The attributes of the synthetic population created in their research are applied
in this study since no other information on the personal level is available due to privacy reasons.
The detailed overview of data used in this research is provided further in Sections 4.1-4.3 and
Section 4.4 explains how different datasets were merged and processed before model estimation.

 15
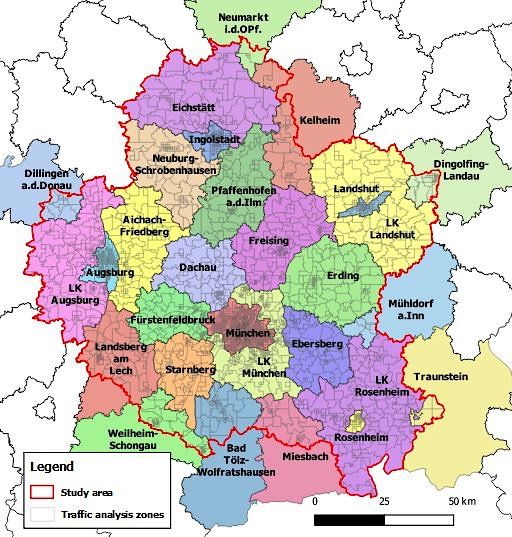
Data Collection

4.1. Synthetic Population

The development of the synthetic population was done in the study area that covered the cities of
Munich, Augsburg, Landshut, Ingolstadt and Rosenheim, together with their suburbs (Moeckel &
Moreno, 2018, p. 4). This area contains a population of 4.5 million persons, 2.1 million households
and 444 municipalities (Moeckel & Moreno, 2018, p. 4). Later, Moeckel and Moreno (2018)
divided municipalities into traffic analysis zones (TAZs) using a gradual raster-based zone
system. The resulting 4,953 TAZs are used for further analysis and define the study area of this
research since the personal attributes essential for further modeling are only available for this
territory. Figure 4 demonstrates the map of counties and cities in Bavaria (in color) divided into
TAZs, with a red line delineating the study area.

 Figure 4. Study Area With TAZs. Adapted from data provided by MSM

 16
Data Collection

The attributes of the synthetic population generated during the research of Moeckel and Moreno
(2018) were provided in CSV format. The file contains 4,424,760 records with demographic
characteristics of each individual. The variables relevant for this study and their description are
listed in Table 1. Additionally, the MSM research group provided the aggregated travel times and
the number of transfers for car, bus and train from each postal code zone in the study area.

Table 1. Relevant Synthetic Population Data

 Variable Description

 Household ID Identification number of individual’s household
 Age Age of the individual in years
 Gender Male / female
 Occupation Toddler / student / employed / unemployed / retiree

 Income The annual income of an individual in Euro
 Home zone Number of TAZ where individual lives

4.2. Mode Choice Survey of Munich Airport Workers

In 2018, the Traffic Planning Department of Munich Airport examined what transport modes the
employees of Munich airport and subsidiaries use to arrive at their workplace. The survey defines
the current transport choices of the workers and their modal preferences. For the estimation of the
model, only two variables extracted from the survey results are used: the postal code of the
worker’s permanent residence and the chosen transport mode. The modes mentioned by
employees include private car (used as driver or passenger), train, bus, motorbike and bicycle.
Additionally, the total number of workers in each postal code area was provided.

4.3. Passenger Survey of Munich Airport

The same year Munich Airport carried out an investigation and questioned almost 20,000
departing passengers. The survey contains personal attributes of passengers, information about
their flight (such as travel purpose, destination country, whether the flight is outward or return) and
the characteristics of their trip to the airport. Table 2 provides the variables chosen for modeling,
together with the detailed description.

 17
Data Collection

Table 2. Relevant Data From the Passenger Survey

 Variable Description

 Origin Postal code of travel origin
 Residence The trip to the airport starts from the place of residence
 Travel purpose Business / private
 Trip length Duration of a trip in days

 Age Age of the individual in years
 Gender Male / female
 Companion Number of accompanying persons in the trip to the airport terminal
 1. under 500 €
 2. 500 – 1,000 €
 3. 1,000 – 1,500 €
 4. 1,500 – 2,000 €
 Income group 5. 2,000 – 2,500 €
 6. 2,500 – 3,000 €
 7. 3,000 – 3,500 €
 8. 3,500 – 4,000 €
 9. 4,000 € and more

 Mode Mode of transport used to arrive at the airport

There are seven modes of transport in the passenger survey – private car, rental car, car sharing,
taxi, shared taxi, bus and train. The taxi and shared taxi are later merged into taxi mode.

4.4. Data Processing

The subsequent procedure in the research is the preparation of data for the modeling process.
The survey results are represented in the form of a table, where each record corresponds to the
individual’s response. During the data processing, the records that meet one of these conditions
are eliminated:

 • The transport mode is not specified;
 • The transport mode used for the trip is bicycle or motorbike (in airport workers survey);
 • The study area does not cover the postal code of the individual’s permanent residence.

When the irrelevant records are filtered out from the surveys, two data frames are created with
2,736 trip records of the airport employees and 13,858 trip records of the airport passengers. As
the next step, the data frames have to be completed with variables that are essential to
understand the transport choices.

 18
Data Collection

4.4.1. Transfers, travel time and travel cost

The distances, number of transfers and travel time for each TAZ are provided by the MSM
research group. These variables are available for three modes (private car, bus and train) and are
aggregated by postal codes. In the passenger survey, the travel time and distances for rental car,
car sharing, taxi and shared taxi are the same as for the private car. The number of transfers for
the mentioned above modes is set to zero. The resulting variables are matched with the
corresponding postal code in each data frame record. If there is no connection by public transport
from a certain postal code area, the travel time is specified as 10,000 minutes. This is done
minimize the utility of such transport connections, so the individual is not likely to choose this
route to the airport.

Travel cost for public transport

Both surveys for passengers and workers do not contain the travel cost for all origin-destination
pairs. There is no platform or service that allows gathering this information automatically, so it was
decided to collect this data manually. Due to the considerable number of records that have to be
processed, the travel cost was aggregated at the county and city level. In fact, the travel cost is
not uniform since the public transport fares vary depending on distance, time of the day, travel
party size and age of the individual; also, some people have season tickets or special fares.
Altogether, the study area covers five cities (Ingolstadt, München, Landshut, Rosenheim and
Augsburg) and 24 counties (Aichach-Friedberg, Augsburg, Bad Tölz-Wolfratshausen, Dachau,
Dillingen, Dingolfing-Landau, Donau-Ries, Ebersberg, Eichstätt, Erding, Freising,
Fürstenfeldbruck, Kelheim, Landsberg am Lech, Landshut, Miesbach, Mühldorf am Inn, München,
Neuburg-Schrobenhausen, Neumarkt, Pfaffenhofen an der Ilm, Rosenheim, Starnberg, Weilheim-
Schongau).

The fares for the long-distance railway trips are collected from the Deutsche Bahn AG (DB)
website and for the short-distance trips from the Münchner Verkehrs- und Tarifverbund (MVV)
website. Since ticket prices on the DB website can change depending on the time of the day, day
of the week and the time interval before the planned trip, for more consistent results it was
decided to collect all data at once under the following conditions:

 • The trip is planned one month in advance;
 • The trip will be made during the off-peak hours in a workday;
 • Among the trips with the same duration and number of transfers, the trip with the lowest

 19
Data Collection

 fixed fare is chosen.

Taking into consideration that the surveys were conducted in 2018, the costs for short-distance
trips correspond to the MVV tariffs in the fourth quarter of 2018, before the entry into force of the
new tariffs related to the completion of the Neufahrn rail link on December 9th, 2018 and the MVV
tariff reform on December 15th, 2019.

The available bus connections to the airport were checked through the route planner of Google
Maps, the costs were obtained from the Flixbus, Lufthansa Express Bus, Ingolstädter
Verkehrsgesellschaft and MVV websites. For the area covered by MVV, tariffs from the fourth
quarter of 2018 are applied. During the data collection, the same conditions as for the train ticket
fares were applied. It must be noted that 10 counties and one city do not have a bus connection
even to the city of Munich, so the 1,000 Euros fare was applied to minimize the utility of traveling
by bus from these areas.

Travel cost for private car

The travel cost for cars is subdivided into two parts. The first one represents compulsory costs
that are based on the average fuel consumption per kilometer and petrol prices. According to the
German online portal for statistics Statista, cars with petrol engines used on average 7.8 liters of
petrol per 100 kilometers in 2018 (Ahlswede, 2020). The same source mentions the average
annual price for a liter of premium gasoline: 145.6 cents (Hohmann, 2020). Thus, fixed costs of
0.015 Euro per kilometer are included for modes like private car, rental car, car sharing, taxi and
shared taxi.

The second part takes into account additional costs that can be time-related (such as payments
for parking, car rental and car sharing services) or distance-related (taxi rates). For travelers that
drive to the airport by car, these costs are a parking charge. The passenger survey distinguishes
five types of car users:

 1) Car passengers;
 2) Parked at the airport terminal;
 3) Parked in other parking spaces;
 4) Parked in an unspecified location;
 5) Parked in the airport surrounding.

The parking fee is neglected for people that were brought to the airport and for the airport
workers. For other Munich Airport passengers, there are two types of parking tariffs – terminal and

 20
Data Collection

budget (Flughafen München GmbH, 2020, p. 1). Terminal parking lots are located right in
between Terminal 1 and Terminal 2, so the departure gates are within walking distance. In
contrast, budget parking spaces are positioned outside the airport, and passengers have to use
S-Bahn (suburban rail) or bus transfer to reach the terminals. However, the fee for this parking
area is lower. The parking rates in different areas of Munich Airport are provided in Table 3.

Table 3. Parking Rates at Munich Airport

 Duration of parking Budget parking rate Terminal parking rate
 1 day 26 € 36 €
 2 days 36 € 72 €
 3 days 46 € 108 €
 4 days 56 € 144 €
 5 days 68 € 175 €
 6 days 76 € 187 €
 7 days 87 € 199 €
 8 - 13 days 26 € per day + 5 € 36 € per day + 15 €
 14 days 122 € 299 €
 15-21 days 26 € per day + 5 € 36 € per day + 15 €
 22 days 162 € 419 €
 Every next day +5€ + 10 €
Note. Reprinted from “Parken am Flughafen München”, by Flughafen München GmbH, 2020, p. 1, Munich: Author.
Copyright 2020 by Flughafen München GmbH

The price for travelers that did not specify their parking location is calculated according to the
budget tariff, assuming that individuals tried to pay less. For those who are not willing to park at
the airport premises, there are numerous parking areas nearby. It was decided to choose the one
with the highest number of reviews on the website for parking space comparison (Ravenhorst,
n.d.). It turned out to be Pfiffing Parken located in Schweig, five kilometers away from Munich
Airport (Oslislo, 2018). With all that said, three parking tariffs (terminal, budget, outside the airport)
are calculated based on the duration of the passenger’s trip – the number of days abroad defines
the parking time and the corresponding price.

Travel cost for car sharing and car rental

The varying costs for car sharing are calculated based on the tariffs of SHARE NOW. It is the
oldest and most significant car sharing service provider in the market that in 2019 united two other
companies – car2go and DriveNow (SHARE NOW GmbH, 2019). Since the rental price per

 21
Data Collection

minute varies from 20 to 36 cents, the average of 28 cents is taken, together with an additional
13.99 Euros fee for dropping off the car at Munich Airport (SHARE NOW GmbH, n.d.).

Car rental costs are usually calculated per day. The well-known German car rental company Sixt
SE is one of the Munich Airport contractors and taken as a reference. The prices for their services
are obtained from the Munich Airport car rental webpage (Sixt). The average fee per day is
calculated among 20 different sedan models (as this is the most common vehicle type) excluding
outliers in the price range. It results in 105 Euros and since the rental period is unknown, the
rental costs are considered for one full day only.

Travel cost for taxi and shared taxi

In contrast to the mentioned costs, the taxi tariffs are based on the distance traveled. In Munich
city, the price includes a minimum fare of 3.70 Euros, an order fee of 1.40 Euro and the price per
kilometer – 2 Euros for distances up to five kilometers, 1.80 Euro for 5-10 kilometers range and
1.70 Euro for trips over 10 kilometers (Taxi Munich, 2008). Since no rates for the shared taxi
services were found, this mode is treated as taxis and the travel cost is calculated accordingly.

4.4.2. Personal attributes of the airport workers

The data provided by the Traffic Planning Department of Munich Airport does not contain personal
attributes of airport workers due to privacy reasons. It was decided to combine the results of the
mode choice survey of the airport workers with the synthetic population data using R software.
The following methodology was applied:

 1) The total number of airport workers is summarized by postal code;
 2) The travel time to the airport is added to each of the postal codes;
 3) TAZs from the synthetic population are overlapped with the postal code areas in Bavaria
 using QGIS software;
 4) TAZs are matched with each postal code to define the number of workers in every TAZ;
 5) The employed people are extracted from the synthetic population, their number in each
 TAZ equals the number of airport workers living there;
 6) The annual income of every person is recalculated to the total monthly household income;
 7) Personal attributes of the employed people from the synthetic population are added to the
 survey results by pairing the TAZs.

As a result, 24,884 records with individual characteristics of airport workers and the travel time of

 22
You can also read