Emergency Communications Hurricane Ike - Harris County Regional Radio System
←
→
Page content transcription
If your browser does not render page correctly, please read the page content below
Emergency Communications
                   During
           Hurricane Ike

 Harris County Regional Radio System

       A Technical Case Study by the

 Federal Communications Commission’s
Public Safety and Homeland Security Bureau’s
 Communications Systems Analysis Division

             December 01, 2009

                                               1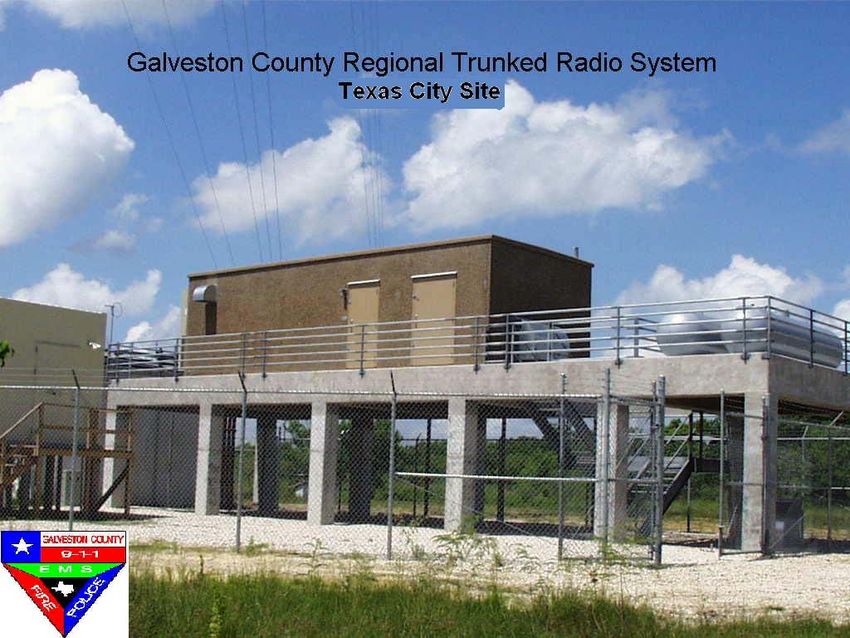
Table of Contents

I. EXECUTIVE SUMMARY .................................................................................................................... 5
II. INTRODUCTION .................................................................................................................................. 8
     A. Hurricane Ike ................................................................................................................................... 8
III. OVERVIEW OF THE HARRIS COUNTY REGIONAL RADIO SYSTEM ..................................... 10
IV. CHARACTERIZATION OF PUBLIC SAFETY COMMUNICATION TRAFFIC
     DURING THE DISASTER.................................................................................................................. 12
     A. Introduction .................................................................................................................................... 12
     B. Systems Usage (Active Calls) ........................................................................................................ 12
     C. Traffic Congestion ......................................................................................................................... 16
        1. Queued Calls ........................................................................................................................... 16
        2. Queued-Dropped Calls ............................................................................................................ 17
V. INTEROPERABILITY ........................................................................................................................ 19
     A. Talkgroups ..................................................................................................................................... 20
     B. Talkgroup Users ............................................................................................................................. 20
VI. PERFORMANCE RELATED TO INFRASTRUCTURE IMPACTS................................................. 22
     A. Introduction .................................................................................................................................... 22
     B. Harris County RRS Performance Related to Infrastructure Impacts ............................................. 22
        1. System Infrastructure Impacts ................................................................................................. 23
        2. Baytown Site ........................................................................................................................... 23
        3. Walker West Site ..................................................................................................................... 24
     C. Site Trunking ................................................................................................................................. 25
        1. Tomball Site ............................................................................................................................ 26
        2. Galveston Site.......................................................................................................................... 28
     D. Queuing Delays.............................................................................................................................. 29
        1. Background on Queuing .......................................................................................................... 29
        2. Excessive Queuing Delays ...................................................................................................... 29
     E. Unaffected Sites in the Hurricane Path .......................................................................................... 33
VII. PERFORMANCE MODELING AND EVALUATION ..................................................................... 35
     A. Analysis and Discussion of Harris County LMR System .............................................................. 36
     B. Site Evaluation ............................................................................................................................... 36
     C. Talkgroup Evaluation..................................................................................................................... 43
VIII. OPERATIONAL PROCEDURES AND BEST PRACTICES ...................................................... 47
IX. CONCLUSIONS .................................................................................................................................. 48
X. APPENDIX A: LMR PERFORMANCE MODELING & ANALYSIS .............................................. 51
     A. Systems Modeling.......................................................................................................................... 51
     B. Modeling Approach ....................................................................................................................... 51
     C. System Parameters and Performance Metrics ................................................................................ 53
        1. Central Queue for System Performance .................................................................................. 53
        2. Performance Metrics ............................................................................................................... 53
        3. Local Queue for Talkgroup Performance ................................................................................ 55
        4. Performance Metrics ............................................................................................................... 59
        5. Derivation of Talkgroup Utilization Threshold ....................................................................... 60
     D. Performance Analysis of Trunked LMR Systems ......................................................................... 62
     E. Capacity Analysis of Trunked LMR Systems................................................................................ 65
     F. Example for Talkgroup Performance............................................................................................. 68

                                                                                                                                              2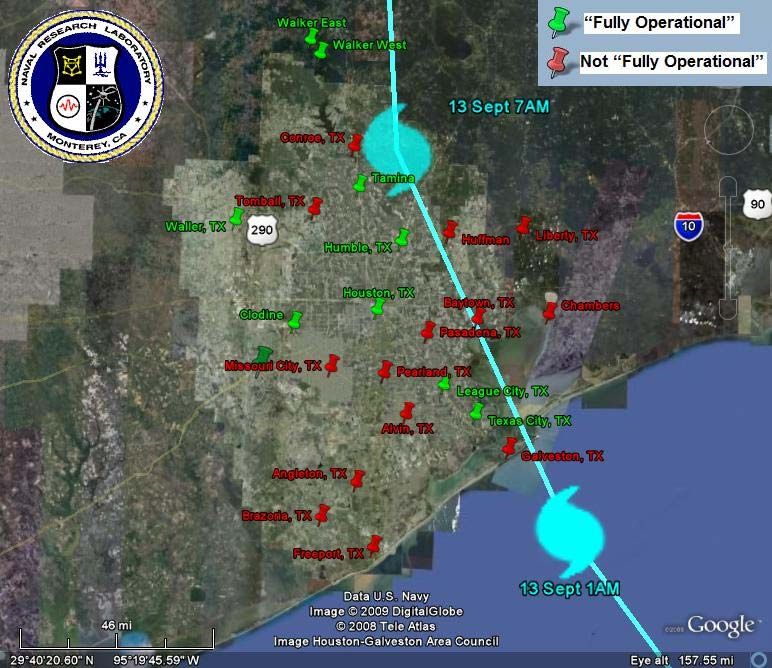
Table of Figures
Figure 1 - Harris County System and Hurricane Ike Path ............................................................... 9
Figure 2 - Harris County RRS Sites Impacted ............................................................................... 10
Figure 3 - Total Usage per Day ...................................................................................................... 13
Figure 4 - Change in Busy Hour Traffic ........................................................................................ 13
Figure 5 - Call Air Time by Occurrence ........................................................................................ 14
Figure 6 - Call Air Time (Cumulative) .......................................................................................... 14
Figure 7 - PTT per Site .................................................................................................................. 15
Figure 8 - Active Calls and Busies................................................................................................. 16
Figure 9 - Percentage of Busies ..................................................................................................... 16
Figure 10 - Average and Maximum duration of Queued Calls ...................................................... 17
Figure 11 - Queued Dropped Calls ................................................................................................ 18
Figure 12 - Duration of Queued Dropped Calls ............................................................................. 18
Figure 13 - Duration of Queued Dropped Calls (w/o anomalies) .................................................. 19
Figure 14 - Number of Talkgroups ................................................................................................ 20
Figure 15 - Talkgroup 800647 Usage on September 5th ............................................................... 21
Figure 16 - Talkgroup 800647 Usage on September 14th .............................................................. 22
Figure 17 - Baytown Site ............................................................................................................... 24
Figure 18 - Walker West Site......................................................................................................... 25
Figure 19 - Tomball Site Affiliations ............................................................................................. 27
Figure 20 - Tomball Map Location ................................................................................................ 27
Figure 21 - Galveston Site Affiliations .......................................................................................... 28
Figure 22 - Galveston Site Photo ................................................................................................... 28
Figure 23 - Average and Maximum Queuing Duration ................................................................. 30
Figure 24 - Queuing Time, Cumulative Distribution ..................................................................... 31
Figure 25 - Maximum Duration of all Queued Calls ..................................................................... 31
Figure 26 - September 14th, Maximum Duration of all Queued Calls .......................................... 32
Figure 27 - Texas City Site Photo .................................................................................................. 34
Figure 28 - Maximum Site Capacity .............................................................................................. 38
Figure 29 - Site Highest Utilization ............................................................................................... 39
Figure 30 - Percent Busy at Site Highest Utilization ..................................................................... 39
Figure 31 - Operation Region ........................................................................................................ 40
Figure 32 - Capacity region ........................................................................................................... 40
Figure 33 - Site 7 at Peak ............................................................................................................... 41
Figure 34 - Site 6 at Peak ............................................................................................................... 42
Figure 35 - Percent Busies at Site 6 and 7 ..................................................................................... 42
Figure 36 - Distribution of Talkgroup Hourly Usage .................................................................... 44
Figure 37 - Distribution of Talkgroup hourly Usage; expanded .................................................... 44
Figure 38 - End to End System for Model B ................................................................................. 52
Figure 39 - Queue Models ............................................................................................................. 53
Figure 40 - Local User Wait Time ................................................................................................. 60
Figure 41 - Percent Queued vs. System Utilization ....................................................................... 62
Figure 42 - Average Delay for all Calls ......................................................................................... 63
Figure 43 - Average Delay for Queued Calls ................................................................................ 64
Figure 44 - GOS ............................................................................................................................. 64
Figure 45 - Capacity Region .......................................................................................................... 66
Figure 46 - Operation Region ........................................................................................................ 67
Figure 47 - Capacity Region .......................................................................................................... 67
Figure 48 - Operational Region ..................................................................................................... 67

                                                                                                                                              3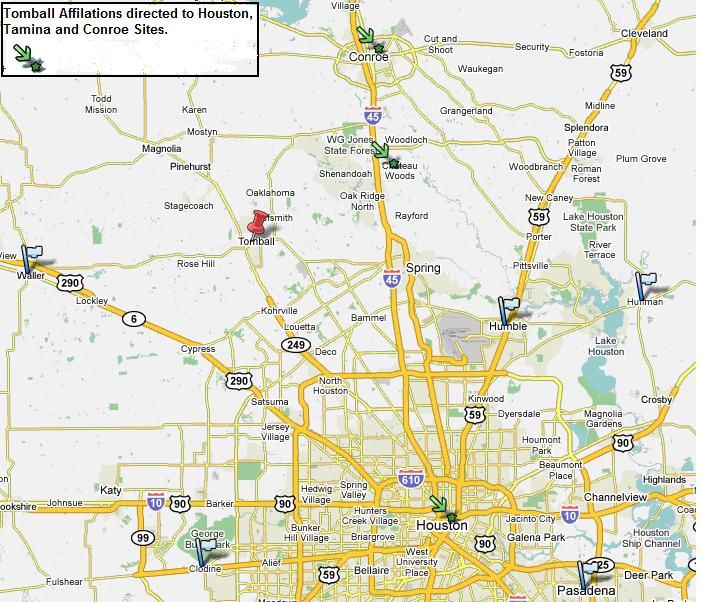
List of Tables

Table 1 - Department Types in Harris County ............................................................................... 19
Table 2 - Harris County RRS - Overall Performance .................................................................... 23
Table 3 - Tomball Site Affiliations ................................................................................................ 26
Table 4 - Tomball Site Affiliations Percentage.............................................................................. 26
Table 5 - Harris County Sites with Voice Channels ...................................................................... 37
Table 6 - Harris County Highest Site Utilization ........................................................................... 38
Table 7 - Harris County Site Busy Hours ...................................................................................... 43
Table 8 - Talkgroup Utilization ..................................................................................................... 45
Table 9 - Talkgroup Count over 30% ............................................................................................ 46
Table 10 - Example Sites ............................................................................................................... 68
Table 11 - Talkgroup Utilization Threshold .................................................................................. 68

                                                                                                                                         4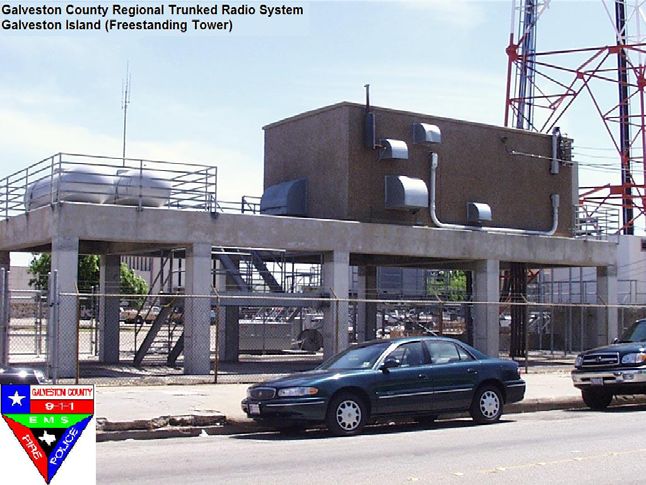
I.     EXECUTIVE SUMMARY

As part of an ongoing effort to better understand the communication needs of emergency
responders, the Communications Systems Analysis Division (CSAD) of the Public Safety &
Homeland Security Bureau (PSHSB) studied the impact of Hurricane Ike on local emergency
communications systems. To conduct our study, CSAD analyzed empirical data from the Harris
County Regional Radio System (RRS). The RRS was used by emergency responders, before and
after Hurricane Ike’s landfall.

On Saturday, September 13, 2008, Hurricane Ike struck Texas as a Category 2 hurricane with
winds up to 110 mph. Immediately prior to Hurricane Ike’s arrival, Galveston Island and other
coastal areas were devastated by twenty foot storm surges.

CSAD’s examination of Hurricane Ike’s impact on emergency communications had the following
objectives and outcomes:

       •   To characterize public safety communications traffic from a baseline and disaster
           perspective. This characterization would allow us to improve our understanding of
           the public safety community’s service needs.

           By analyzing 30 days of traffic data, CSAD characterized the performance of the
           RRS during the disaster, which included changes in busy-hour traffic, total push-to-
           talks by site, busy calls, and queued calls.

       •   To use analytical tools to model the overall performance of Harris County’s land
           mobile radio (LMR) system during the disaster. This modeling would permit CSAD
           to use the same analytical tools to characterize system performance for traffic loads
           that have not been recorded directly. CSAD could then apply these lessons to other
           jurisdictions.

           CSAD analyzed the performance and capacity guidelines, which included charts
           displaying the location of capacity as a function of traffic intensity. CSAD also
           identified the location of operational regions, relative to system utilization.

       •   To understand how the multi-jurisdictional interoperable LMR system assisted
           emergency responders during the event.

           CSAD evaluated the multi-jurisdictional interoperability in the LMR system, the
           participating agencies and departments, and the traffic that was generated within the
           Talkgroups. While we cannot make quantitative findings from this work, we can
           conclude that the RRS provided a platform for multi-agency communication.
           Furthermore, first responders used the system extensively to coordinate their
           response to the storm. CSAD also analyzed the Talkgroup performance of LMR
           systems and found that if Talkgroups are not engineered carefully, an end-user can
           perceive an LMR system’s performance to be poor, even at low system utilization
           levels.

                                                                                                   5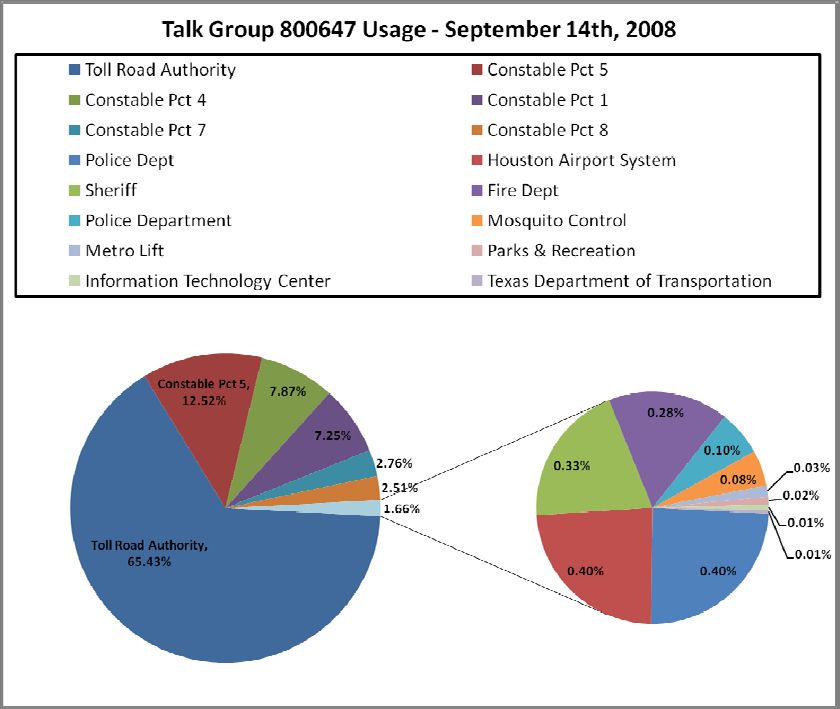
•    To characterize how the system performance correlated with known infrastructure
             impacts and systematically analyze any system performance issues that were related
             to infrastructure impacts or system abnormalities.

             CSAD studied Hurricane Ike’s affect on Harris County’s systems infrastructure, its
             operational assets, its restoration efforts, and the steps that were taken to restore
             emergency communications. We also analyzed the RRS’s site trunking mode 1 and
             excessive queuing delays.

        •    To determine lessons learned; recommend policy, operational procedures and
             standard system settings.

             CSAD finds that the following actions may improve communications systems when
             confronted with similar disasters:

                 o    Capacity – A number of sites were flooded with call volume and lacked
                      sufficient resources to process the traffic and maintain high performance.
                      This problem can be mitigated by provisioning additional channels to starved
                      sites.

                 o    Redundant Backhaul – Backhaul failures, both outside plant and inside plant,
                      resulted in frequent instances of the site trunking operational mode. Eighty
                      percent of the sites found to be not fully-operational were in that state due to
                      backhaul outages, resulting in the site trunking mode. This back-up mode
                      allows users to communicate locally, but not across the network. Site
                      trunking often creates the collateral effect, in which users affiliated with the
                      isolated site try to affiliate with a site that is not isolated, thereby regaining
                      network-wide connectivity. This otherwise desirable feature results in
                      performance degradation on healthy sites. The provision of microwave
                      backhaul for redundancy would help to mitigate this effect – a step that
                      Harris County is taking.

                 o    Fast-Start Mode – Harris County provisioned all talkgroups for All-Start
                      mode, which does not permit a call to be completed until resources are
                      available to support all of the users in the talkgroup. This feature gives users
                      confidence that all of their colleagues are participating in a call, but when the
                      system is under high load it can result in call delays. The Fast-Start mode
                      assigns resources even if the system can only support a subset from the
                      outset. As resources free up, additional users are able to join the call. This
                      mode of operations allows the call to begin quickly, particularly in times of
                      high usage. While All-Start is likely more desirable during normal operation,
                      Fast-Start may be more desirable during disasters.

1
 Site trunking is a LMR fail-safe mode that the site enters when it can no longer communicate with the rest
of the network.
                                                                                                         6
o Talkgroup Engineering – Talkgroups are engineered to achieve grade of
service and quality of service objectives. During a fast-moving disaster,
when new agencies are joining the network without advanced planning,
talkgroups can drift out of engineering tolerances, which can lead to
underperformance. Public safety entities can mitigate this problem by
conducting additional up-front planning for large-scale emergencies that will
result in rapidly evolving talkgroups.
o Push-To-Talk (PTT) Timeout – Defective radios can create excessively long
hold times and impact system performance. Many LMR systems include a
PTT timeout feature that allows the system to drop calls that are holding for
an excessive amount of time in queue. CSAD believes that public safety
entities should determine the availability and setting of this feature.
o First-In-First-Out (FIFO) Queue Performance – There is evidence that the
system queue was not functioning properly during the hurricane. Public
safety entities can minimize the likelihood of this problem by collaborating
with system vendor(s) to conduct additional system testing.
7II. INTRODUCTION
As part of an ongoing effort to better understand the communication needs of emergency
responders and public safety LMR systems, CSAD studied the impact of Hurricane Ike on local
emergency communications systems in Harris County. The purpose of this study was to inform
the public safety community about the evolution of communication capabilities and services and
facilitate the sharing of important information about the performance of public safety
communications systems during emergencies.
CSAD recently studied the impact of the Minneapolis bridge collapse on local emergency
communications systems in Minneapolis, MN. In order to develop mechanisms and tools to
better characterize public safety system’s performance in stress situations, CSAD studied the
performance characteristics of current generation public safety wireless voice communication
systems and next-generation commercial wireless communications.
This study, similar to the Minneapolis bridge collapse work, was accomplished by methodical
examination of the system’s call detail records (CDRs). The call records included all information
pertaining to radio communications, for all users and talkgroups. In addition, CSAD interviewed
Harris County personnel, carefully reviewed Harris County reports, pre and post storm activities,
technician notes and related publicly available related news articles.
CSAD gratefully acknowledges the cooperation of Steven Jennings, Chief Information Officer
(retired), Craig Bernard, Managing Director, and Jim Bridwell, Radio Systems Supervisor, who
provided access to critical data and shared their knowledge of LMR system operation and
performance. Their generosity made this report possible. Without the cooperation and
contributions of public safety organizations like Harris County, CSAD would not be able to
disseminate valuable lessons learned from natural disasters.
A. Hurricane Ike
On Saturday, September 13, 2008, at approximately 3:00 AM, the center of Hurricane Ike made
landfall at Galveston Island as a category 2 Hurricane. 2 Hurricane Ike was blamed for at least
195 deaths. Despite the strong winds, the real danger associated with Hurricane Ike was coastal
flooding and large, damaging waves. Hurricane Ike pushed water 20 to 25 feet above normal
high-tide levels, burying coastal regions by more than nine feet of water as much as a mile inland,
warned the National Weather Service. 3 Figure 1 - Harris County System and Hurricane Ike
Path shows the locations of the RRS tower sites, in relation to the path of Hurricane Ike.
2
See http://www.fema.gov/hazard/hurricane/2008/ike/about.shtm, last accessed June 18, 2009.
3
See http://earthobservatory.nasa.gov/NaturalHazards/view.php?id=35351
8Figure 1 - Harris County System and Hurricane Ike Path
9Figure 2 - Harris County RRS Sites Impacted 4
III. OVERVIEW OF THE HARRIS COUNTY REGIONAL RADIO SYSTEM
The RRS is a multi-agency partnership and is the only public safety communications system used
by any jurisdiction in the county, except for the City of Houston.
4
This figure displays RRS sites that were “fully-operational” (GREEN) and sites that were “not
fully-operational” (RED) during the Hurricane Ike event. “Fully-operational” sites may have lost
commercial power, but did not encounter any physical or hardware damage and were still
operational on battery backup or generator power. In most cases, the sites were in “site trunking”
mode when they were “not fully operational.” CSAD found that 80% of sites that were “not
fully-operational” were in that state due to backhaul outages, which resulted in the site trunking
condition. Site trunking occurs when a transmitter site loses the ability to communicate with the
zone controller (central station). Radios can only communicate with other radios that are
affiliated (or connected) with that site. In other words, multicast sites that lose their links will go
into site trunking mode and will no longer communicate with other sites. In this situation, data
will neither be sent back to the central controller, nor logged into the database records, as we see
later in the hourly PTT data statistics.
10The RRS presently covers nine counties and supports more than 33,000 users and 641
departments. Currently, the system covers 9,581 square miles supporting a population of
5,236,716. The system uses a Motorola 4.1 Mixed Mode (Digital/Analog) SmartZone System to
support 24 trunked multicast sites using a total of 259 channels. The RRS’s users talk to each
another on shared talkgroups over a large coverage area. The current SmartZone 4.1 radio system
does not operate on 700 MHz channels and is not a Project 25 (P25) compliant system. Multicast
systems broadcast identical audio information on different frequencies from multiple
geographically separated sites to support talkgroups over a wide geographic area.
The RRS leases T-1s and DS3s to connect all of their tower sites and dispatch centers into the
master site. For a given number of voice channels, a trunked LMR system can support more
users than a conventional LMR system. Subscribers request a channel from a central controller,
via a shared control channel. The central controller dynamically assigns a shared radio channel to
a subscriber unit and then direct the appropriate receiving units to tune or switch to the same
channel. 5 The central controller manages the control channel and the pool of communications
channels. When all of the RRS’s communication channels are in use, a subscriber unit must
make further requests, which can be queued until a communication channel becomes available.
The RRS employs Dynamic Frequency Allocation (DFA) to use spectrum efficiently. DFA
tracks the location of individual mobile units and the talkgroups that the mobile units are
scanning. The RRS then intelligently allocates channels to the individual tower sites on an as
needed basis.
In a trunked multicast system, if the members of a particular talkgroup are within the coverage
area of a single tower site, only that specific tower site is needed to provide communications for
the entire talkgroup. However, if the members of a talkgroup are spread throughout the system’s
coverage area, the system will need multiple tower sites with a channel on each site. Talkgroups
are organized to use as few sites as possible permitting each talkgroup to use less spectrum,
which allows more channels to be available for other talkgroups.
All of the talkgroups in the RRS are set for “All-Start” operation. In this mode, the system will
wait for all necessary resources to be available before it will process a call request. In other
words, before Harris County will provide a channel, all of the requested sites must have an
available frequency channel.
When systems are set to “Fast-Start,” radio users in the talkgroup do not have to wait for the
necessary resources at all sites, but they do have to wait for the necessary resources at their site
affiliation. “Fast-Start” endeavors to capture as many radio users as possible. In other words, a
“Fast Start” talkgroup will assign channel resources if at least one channel resource is available at
one of the conceivably numerous sites. In “Fast-Start,” some radios may not receive transmission
at the beginning of the call, but the radios will join the call midstream, once the channel resources
are available.
5
Typically, voice channels for LMR systems operate in Frequency Division Duplex (FDD) mode. In FDD
mode, there is separate spectrum for both transmit and receive channels that are associated with a specific
voice channel.
11IV. CHARACTERIZATION OF PUBLIC SAFETY COMMUNICATION TRAFFIC
DURING THE DISASTER
A. Introduction
During unpredictable incidents, such as the Minneapolis bridge collapse, 6 it is incredibly difficult
to predict the level of communication traffic. In the case of a somewhat foreseeable disaster,
however, such as Hurricane Ike, communications traffic tends to increase several days before the
disaster, coinciding with the preparation and evacuation processes. In the case of Hurricane Ike,
the RRS was under heavy load for several days before and after landfall. Traffic on the RRS was
highest on the day Hurricane Ike made landfall and remained high for five days after landfall.
When a user initiates a call, a channel is granted, which remains reserved for the entire call,
as long as each subsequent response is initiated before the repeater hang-time expires.
The repeater hang-time is the period of time that a channel remains reserved after the PTT has
been released. The repeater hang time allows users that are already involved in a call to have
immediate access to a channel and not have to compete for the channel with other users that are
not part of the call. As such, as long as the parties to a call are responding to one another within
the repeater hang-time period, a single call can have multiple PTTs, which allows multiple back-
and-forth communications to take place without interruption. After the repeater hang-time has
elapsed, however, the communication is assumed to have ceased and the channel resource is
released and all subsequent PTTs constitute a new call.
In this section, we discuss three types of calls: active calls, queued calls, and queued-dropped
calls. A call is only considered to be an “active call,” when a channel has been assigned
specifically for the call. If there is not a channel available, the call will go to the queue and wait
for the next available channel. A call in the queue is identified as a “queued call.” Calls that wait
in the queue for some period of time, but are dropped, are referred to as “queued-dropped calls.”
Queued-dropped calls rarely occur during a normal day and have a very short duration. During
the busiest of days, however, some “queued-dropped” calls can last for hours. In addition, Total
calls counted are equal to the following; active plus queued plus queued-dropped calls.
B. Systems Usage (Active Calls)
Figure 3 - Total Usage per Day shows total air usage over a 30-day period. On September 11,
2008, two days before the hurricane, usage began to rise. On September 13, 2008, the day
Hurricane Ike made landfall, usage rose dramatically. On September 15, 2008, usage reached its
peak and system usage remained high for about five days. On September 20, 2008, usage started
to decrease.
6
http://www.fcc.gov/pshs/minneapolisbridge.html
12Total Usage Per Day September '08
8000000
Hurricane IKE Landfall
7000000
Total Usage (seconds)
6000000
5000000
4000000
3000000
2000000
1000000
0
9/ 08
9/ 08
9/ 08
9/ 08
11 8
13 8
15 8
17 8
19 8
21 8
23 8
25 8
27 8
29 8
8
9/ 00
9/ 00
9/ 00
9/ 00
9/ 00
9/ 00
9/ 00
9/ 00
9/ 00
9/ 00
00
20
20
20
20
2
/2
/2
/2
/2
/2
/2
/2
/2
/2
/2
1/
3/
5/
7/
9/
9/
Date
Figure 3 - Total Usage per Day
From September 1, 2008 to September 7, 2008, a week before the event, the average busy-hour
traffic was over ten thousand PTTs per hour. We used this average number of PTTs as a baseline
to compare peak traffic immediately before and after Hurricane Ike. Figure 4 - Change in Busy
Hour Traffic compares the peak traffic during Hurricane Ike with average busy-hour traffic.
During the busy-hour of September 17, 2008, the RRS handled almost twice as many PTTs than
it would handle on a typical day. We found these numbers to be consistent with the system load
of the Minneapolis public safety communications system when a bridge collapsed in August
2007, which we previously studied.
Figure 4 - Change in Busy Hour Traffic
Figure 5 - Call Air Time by Occurrence displays a histogram of call durations using a
logarithmic scale. On average, call durations were seven seconds on a normal day (i.e.,
September 1, 2008) and almost eight seconds on a busy day with a standard deviation of seven
seconds. By comparison, the Minneapolis Bridge collapse study indicated that the average call
air time was 9.4 seconds and had a standard deviation of 9.4 seconds. During Hurricane Ike, the
13average call air time for a PTT was approximately five seconds. In our previous study of the
Minneapolis bridge collapse, we found that the average duration of a PTT was six seconds. Thus,
an emergency responder’s average PTT duration is approximately five to six seconds, which is
much shorter than the average phone call in the United States (approximately three minutes).
Call Air Time by Occurrence
September 14th
50000
45000
40000
35000
30000
Count
25000
20000
15000
10000
5000
0
1 10 100 1000
Call Duration
Figure 5 - Call Air Time by Occurrence
Figure 6 - Call Air Time (Cumulative) displays a cumulative percent distribution of call
durations. We found that 80% of all calls were shorter than ten seconds and 90% of all calls were
shorter than twenty seconds. We also found that nearly 10% of all calls were greater than ten
seconds and therefore considered to be long calls. While most calls are very short during a
disaster, Figure 6 - Call Air Time (Cumulative) notes that certain calls lasted more than 100
seconds and the longest call lasted 160 seconds.
Call Air Time (September 14)
Cumulative Percent
100.00%
80.00%
60.00%
Percent
40.00%
20.00%
0.00%
1 10 100 1000
Duration (seconds)
Figure 6 - Call Air Time (Cumulative)
14Figure 7 - PTT per Site shows PTT usage per site at the eight busiest sites. There are 24 sites in
the RRS and each site’s channel count ranges from 5-28 channels, depending upon the geography
and population of those areas.
Site 1, with 28 channels, is located in the City of Houston, which has a population of 2,114,491,
the highest population in Harris County. Site 1 is the busiest site.
Site 9, with only five channels, is located in the city of Chambers, which has a population of
28,771 people. 7
Despite the fact that site 2 (city of Tomball), site 7 (City of Baytown), and site 19 (Galveston) lost
communications with the central station during Hurricane Ike, those sites entered site trunking
mode, which allowed all users affiliated with those sites to maintain communications within the
local area. 8
Sites 7 and 19 went into site trunking mode during the hurricane. As a result, while they were in
site trunking mode, there was no data reported for those sites. Figure 7 - PTT per Site does not
show any data for site 7 between September 14, 2008 and September 16, 2008. It also does not
show any data for site 19 between September 12, 2008 and September 14, 2008.
The figure also shows that the eight sites were restored in 1-3 days. We cover this information in
more detail in Section 8.
Finally, the chart below displays each site’s overall performance. The chart demonstrates that
when sites were isolated, nearby sites that did not lose connectivity gained traffic. In later
sections, we will explain this phenomenon in greater detail.
Push to Talks (PTT) per Site
September '08
Site 1 Site 2 Site 7 Site 9 Site 19 Site 22 Site 6 Site 5
110000
Hurricane Ike Landfall All Sites Restored
100000
90000
80000
Number of PTTs
70000
60000
50000
40000
30000
20000
10000
0
8
8
8
8
8
8
8
8
8
8
08
08
08
08
08
00
00
00
00
00
00
00
00
00
00
20
20
20
20
20
/2
/2
/2
/2
/2
/2
/2
/2
/2
/2
1/
3/
5/
7/
9/
11
13
15
17
19
21
23
25
27
29
9/
9/
9/
9/
9/
9/
9/
9/
9/
9/
9/
9/
9/
9/
9/
Date
Figure 7 - PTT per Site
7
http://quickfacts.census.gov/qfd/states/48/48201.html
8
When a site enters Site Trunking mode, no log data is reported to the central station.
15C. Traffic Congestion
1. Queued Calls
Figure 8 - Active Calls and Busies depicts the number of active calls and the number of queued
calls. As shown, while the number of active calls gradually increased, the number of queued calls
remained relatively low, but had a sharp spike on September 14, 2008, the day after Hurricane Ike
made landfall.
Active calls & Busies
Active Busies
350000
300000
250000
Count
200000
150000
100000
50000
0
11 8
08
08
08
08
9 / 0 08
9 / 0 08
9 / 0 08
29 8
8
9 / 0 08
9 / 0 08
17 8
19 8
9 / 0 08
0
00
00
00
00
20
20
20
20
20
/2
/2
/2
/2
/2
/2
/2
/2
/2
/2
1/
3/
5/
7/
9/
21
23
25
27
13
15
9/
9/
9/
9/
9/
9/
9/
9/
9/
Date
Figure 8 - Active Calls and Busies
Figure 9 - Percentage of Busies displays the percentage of queued calls versus the total number
of calls in the system. On September 13, 2008, less than 5% of all calls were in queue. On
September 14, 2008, the number of queued calls reached almost 34%, which is quite high.
Percentage of Busies
(num ber of busies/total calls)
35.00%
30.00%
25.00%
Percent
20.00%
15.00%
10.00%
5.00%
0.00%
13 8
15 8
17 8
19 8
21 8
23 8
25 8
27 8
29 8
8
08
08
08
08
11 8
00
00
00
00
00
00
00
00
00
00
0
20
20
20
20
20
/2
/2
/2
/2
/2
/2
/2
/2
/2
/2
1/
3/
5/
7/
9/
9/
9/
9/
9/
9/
9/
9/
9/
9/
9/
9/
9/
9/
9/
9/
Date
Figure 9 - Percentage of Busies
16Figure 10 - Average and Maximum duration of Queued Calls displays maximum and average
duration of all queued calls using a logarithmic scale. On normal days, the average queuing
duration was one to two seconds and the maximum queuing duration was more than ten seconds.
During the event, between September 12, 2008 and September 16, 2008, queuing duration was
extensive. On the day before and after Hurricane Ike made landfall, the average queuing duration
was over seven seconds. We found that some calls were delayed for more than one hour.
Average Queuing Duration Max Queuing Duration
10000
1000
Duration (seconds)
100
10
1
8/30/08 9/4/08 9/9/08 9/14/08 9/19/08 9/24/08 9/29/08 10/4/08
0.1
Date
Figure 10 - Average and Maximum duration of Queued Calls
2. Queued-Dropped Calls
Figure 11 - Queued Dropped Calls depicts the number of queued-dropped calls in September
2008. As shown, between September 1, 2008 and September 11, 2008, there were only a few
queued-dropped calls with short durations. The number of queued-dropped calls increased
sharply, however, beginning on the day before Hurricane Ike made landfall. On September 12,
2008, there were 71 queued-dropped calls with the highest duration of more than 200 seconds.
On September 13, 2008 and September 14, 2008, there were over 1,000 queued-dropped calls -
about 0.1% of the total number of calls - where the highest duration was over three hours, as
shown in Figure 12 - Duration of Queued Dropped Calls.
17Queued-Dropped Calls
in September '08
1800
1660
1600
1316
1400
1200
Count
1000
800 598
600 439
400
200 2 4 4 2 3 2 11
71 60 19 11
1 4 2 1 1
0
08
08
08
10 8
9/ 008
14 8
9/ 008
9/ 008
20 8
9/ 008
24 8
9/ 008
9/ 008
30 8
8
0
00
00
00
00
00
20
20
20
20
/2
/2
/2
/2
/2
/2
/2
/2
/2
/2
/2
2/
4/
6/
8/
12
16
18
22
26
28
9/
9/
9/
9/
9/
9/
9/
9/
9/
Date
Figure 11 - Queued Dropped Calls
Figure 12 - Duration of Queued Dropped Calls
As shown in Figure 13 - Duration of Queued Dropped Calls (w/o anomalies), after we removed
the calls that were caused by defective radios, there were still many queued-dropped calls that
lasted for hundreds of seconds.
18Figure 13 - Duration of Queued Dropped Calls (w/o anomalies)
V. INTEROPERABILITY
Currently, there are 243 agencies with 641 departments using the RRS for intra-agency and inter-
agency communications. Of the 641 departments using the RRS, 210 are law enforcement
departments and 112 are fire departments. Table 1 - Department Types in Harris County
displays many of the other departments that use the RRS:
Department Types Count Percentage
LE Law Enforcement 210 32.76%
FD Fire Department 112 17.47%
PW Public Works 64 9.98%
EMS Emergency Medical Service 38 5.93%
Admin Admin Administrative 29 4.52%
OEM Emergency Management 27 4.21%
Transp Transportation Departments 18 2.81%
Eng Engineering Departments 17 2.65%
Hosp Hospitals 13 2.03%
Comms Communications/Dispatching 12 1.87%
Legal Legal Departments 12 1.87%
Chem
comp Chemical Companies 12 1.87%
Hum Humane Services 12 1.87%
Park Parks Departments 11 1.72%
EO Elected Officials 8 1.25%
Prob Probation Departments 8 1.25%
Env Environmental Monitoring and Services 7 1.09%
ISD Independent School Districts 7 1.09%
Sec Security companies 6 0.94%
Utility Commercial Utility Company 4 0.62%
Military Militaries 3 0.47%
Port Port Authorities 3 0.47%
MUD Municipal Utility Districts 3 0.47%
Air Amb Air Ambulances 2 0.31%
Tax Taxing and Appraisal Departments 2 0.31%
Jail Jail Facilities 1 0.16%
Table 1 - Department Types in Harris County
19A. Talkgroups
Figure 14 - Number of Talkgroups depicts the number of talkgroups generating traffic on each
day in September 2008. We found that the number of active talkgroups steadily increased in the
days leading up to the hurricane, as more responders arrived in Harris County to prepare for the
hurricane. In response to the hurricane, there were approximately 880 talkgroups in use each day.
On September 11, 2008, two days before the hurricane made landfall, the number of talkgroups
began to increase. On September 13, 2008, the day Hurricane Ike made landfall, more talkgroups
were in use than any other day. During the event, the use of talkgroups increased by 20%, which
is a sign of more responders joining and using the RRS and also indicates that the system served
its purpose well.
Number of TalkGroups per day
in September '08
1000
Hurricane Ike made landfall
900
800
Count
700
600
500
400
9/ 008
9/ 008
9/ 008
9/ 008
9/ 008
9/ 008
9/ 008
9/ 008
9/ 008
8
9/ 08
9/ 08
9/ 08
9/ 08
9/ 008
00
20
20
20
20
/2
/2
/2
/2
/2
/2
/2
/2
/2
/2
2
1/
3/
5/
7/
9/
11
13
15
17
19
21
23
25
27
29
9/
Date
Figure 14 - Number of Talkgroups
B. Talkgroup Users
Talkgroups are provisioned to allow people from different departments to communicate with each
other, especially during disasters. On September 14, 2008, more departments communicated on
talkgroups than on September 5, 2008. We believe that this is because people already in the
talkgroup had a greater need to communicate and because people from different agencies joined
the talkgroup in response to Hurricane Ike, possibly by receiving cache radios.
Figure 15 - Talkgroup 800647 Usage on September 5th and Figure 16 - Talkgroup 800647
Usage on September 14th depict a talkgroup that is shared by different departments. In this
Talkgroup, the Constable Pct 5 (Law Enforcement) and the Toll Road Authority (Transportation
Departments) were the main users.
20Figure 15 - Talkgroup 800647 Usage on September 5th shows that there were eight different
departments participating in the talkgroup on September 5, 2008. Figure 16 - Talkgroup 800647
Usage on September 14th shows that there were fifteen different departments participating in the
same talkgroup on September 14, 2008. These diagrams demonstrate that the RRS enabled
various agencies to communicate.
While 15 different departments generated traffic on September 14, the data shows a total 34
departments in Talkgroup 800647 were listening in on the talkgroup conversations. It should be
noted that when creating talkgroup plans, a variety of technical issues must be considered so that
the best possible system performance is achieved. It is possible that talkgroups could be assigned
to meet minimum requirements while significant system and spectrum resources are wasted. In
addition, creating talkgroups that are too large could cause delays that hamper critical
communications.
Since the 1995 Oklahoma City bombing and September 11, 2001 attacks, public safety has been
focusing on making sure that emergency responders from different agencies have interoperable
communications. During Hurricane Ike, despite the lack of interoperable channels, 9 first
responders from different agencies were able to communicate with one another. Cache radios
assigned to different talkgroups were given out to first responders. As indicated in Harris County
report, there were about 166 cache radios distributed to people from different agencies that came
to the affected areas in response to Hurricane Ike. 10
Talk Group 800647 Usage
September 5th 2008
Constable Pct 1
7%
Constable Pct 4
7%
Toll Road
Authority
48% Constable Pct 5
28%
Constable Pct 7
3%
Sheriff
1% Police Dept Constable Pct 8
1% 5%
Figure 15 - Talkgroup 800647 Usage on September 5th
9
http://www.fcc.gov/pshs/summits/hurricane/
10
Hurricane Ike report, HC RRS Response and Recovery Information, Keith LeJeune, page 9
21Figure 16 - Talkgroup 800647 Usage on September 14th
VI. PERFORMANCE RELATED TO INFRASTRUCTURE IMPACTS
A. Introduction
In this section, CSAD analyzed the RRS’s performance after Harris County sustained massive
infrastructure damage from Hurricane Ike. Specifically, CSAD studied the hurricane’s impact on
the local emergency communications system and the resiliency of the RRS. In most cases, we
concluded that performance data can serve to expose system issues.
B. Harris County RRS Performance Related to Infrastructure Impacts
To determine the RRS’s overall system performance as it related to infrastructure impacts, CSAD
analyzed PTT hourly call statistics, call detail records (CDRs), and field technicians’ notes. The
field technicians’ notes discussed field assignments, outages, and equipment failures at the tower
site locations. In our analysis, we were able to determine which sites remained fully operational
and the extent of Hurricane Ike’s impact on communications in Harris County.
We chose the Baytown and Walker West sites for our analysis. These sites were not fully
operational, had significant variance in their PTT data, and each site’s field technician took
comprehensive notes.
221. System Infrastructure Impacts
On September 13, 2008, Hurricane Ike’s impact resulted in only 45.83 percent of the RRS’s sites
being fully-operational. On September 19, 2008, 100 percent of the sites had been restored to full
operation. Table 2 - Harris County RRS - Overall Performance displays the percent of fully-
operational sites on the RRS between September 12, 2008 and September 21, 2008.
Harris County RRS Performance during Hurricane Ike
9/12/2008 9/13/2008 9/14/2008 9/15/2008 9/16/2008 9/17/2008 9/18/2008 9/19/2008 9/20/2008 9/21/2008
% Fully-
Operational: 100.00% 45.83% 54.17% 79.17% 83.33% 95.83% 91.67% 100.00% 100.00% 100.00%
Table 2 - Harris County RRS - Overall Performance
CSAD determined whether each site was “fully-operational” during the hurricane by analyzing
hourly PTT data and the field technician’s notes. 11 Since a comprehensive log of field
technicians’ notes was maintained for each site, we were able to correlate nearly all infrastructure
impacts to call or statistical irregularities.
2. Baytown Site
In Figure 17 - Baytown Site, we show how the system performance of PTT data correlated with
known infrastructure impacts for the Baytown site.
Timeline of Events for the Baytown Site: 12
1. Field technicians began receiving calls about poor reception and various problems.
2. A field technician received an after hours call from the Baytown Police Department and
advised the dispatcher that the Baytown site was in site trunking mode.
3. The field technician determined that a generator had a fuel problem. After someone
flushed the fuel filter, the generator came on-line, but the site came up for only a moment
in wide area mode and then came up in site trunking mode. It was then determined that
the Smart Jack, which terminates the transport connection to the zone controller, was hit
by a lightning strike and needed repair.
4. After the Smart Jack was repaired by the local telephone company, the site came up in
wide area mode, but was still running on generator power.
11
Hurricane Ike report, HC RRS Response and Recovery Information, Keith LeJeune, page 59.
12
Red numbered timeline events correspond to the events on the Figure -Baytown Site
23Figure 17 - Baytown Site
3. Walker West Site
As noted in Figure 18 - Walker West Site, by analyzing the PTT hourly data, CSAD discovered
that the Walker West site experienced more than a one-thousand percent increase in PTT counts
and radio channel assignments on September 13, 2008 because the Conroe site experienced a
problem with the Smart Jack, which caused that site to go into site trunking mode.
In September 2008, the Conroe site was the only site in the RRS that had a microwave link to
handle redundant backhaul communications to the zone controller. The Conroe site’s microwave
path was also able to communicate to the Tomball site and the Bunker location. The Bunker
location provides companies with a secured data center that is able to protect corporate assets
from all kinds of disasters.
To allow the Conroe site to communicate in wide area trunking mode, the field technician’s set-
up a microwave link to the Bunker location, and then routed the calls, via a carrier connection, to
the Walker West site. Figure 18 - Walker West Site highlights that after the Conroe-to-Tomball
microwave link was established, calls logged at the Walker West site increased and the Conroe
site was once again communicating in wide area trunking mode. This figure shows all of the
radio channel assignments and their affiliations. In summary, the West Walker site’s increase in
PTT counts and radio channel assignments gave the impression that the site had a problem;
however, the problem was actually a result of a component failure in the Conroe site.
24Radio Channel Assignments
PTT Radio Channel Assignments Historical Average
700
600
500
400
300
200
100
0
7
4
1
8
5
2
9
6
3
7
4
1
8
14
21
11
18
15
22
19
16
13
20
10
17
14
21
11
18
15
22
ur
ur
ur
ur
Ho
Ho
Ho
Ho
0
0
23
12
8
8
00
00
8
8
00
00
/2
/2
/2
/2
12
19
16
15
9/
9/
9/
9/
Figure 18 - Walker West Site
C. Site Trunking
Since several sites defaulted to site trunking mode, CSAD decided to analyze site trunking mode
in more detail. In site trunking mode, data is not sent back to the central controller and logged
into the database. For example, the Tomball and Galveston sites lost the ability to communicate
with the zone controller (central station) and log CDRs.
As a result, we decided to look at affiliations to determine the hurricane’s impact on
communications. If public safety users were able to immediately affiliate to another site, they
would have been able to continuously communicate with talkgroup members across the
network. 13
During normal radio operation, a radio will search, for the site with the highest signal strength
and then inform the zone controller about which site and talkgroup the radio is communicating
on. This process is referred to as affiliation. Once a site is identified, the radio will register to a
wide area site and continue normal operations.
We analyzed site trunking by observing the CDR and counting the radio affiliations for each site,
before and during site trunking mode. As a result of this analysis, we were able to confirm that
communications never went down and that mobile radios that affiliated to the close available site
were in wide area mode.
When a SmartZone remote site goes into site trunking mode, all of the radios at the site will want
to affiliate to one of the adjacent sites that are operating in wide area trunking mode. Only radios
13
Site Trunking is a failure mode built into Motorola SmartZone systems.
25that cannot capture any other remote site, or are set to “Always Preferred,” 14 will remain at the
isolated (site trunking) site. 15 The RRS’s field technicians visited all of the sites that were in site
trunking mode to ensure that calls could still be completed.
1. Tomball Site
To conclusively demonstrate that communications were not disrupted and that the system
functioned as designed, we analyzed the CDRs and affiliation counts for all of the sites in the
RRS between 2:00 AM and 9:00 AM on September 13, 2008. Below, we display our findings for
the Tomball and Galveston sites.
In Table 3 - Tomball Site Affiliations, and Table 4 - Tomball Site Affiliations Percentage we
aggregated the data to one-hour intervals and determined from the CDRs of affiliations that site
trunking occurred at the Tomball site on September 13, 2008 at 6:00:33 AM. The CDRs proved
that within two to three seconds, radios affiliated with adjacent sites were in wide area trunking
mode, specifically at the Houston, Tamina, and Conroe sites. Figure 19 - Tomball Site
Affiliations displays the affiliations by site, which are aggregated to one minute intervals. Figure
20 - Tomball Map Location displays the geographic location of the sites, relative to the Tomball
site. In our analysis, we observed that sites that were geographically closer to the Tomball site,
not across the network, picked-up the additional traffic.
Affiliations - September 13th, 2008
3 to 4 4 to 5 6 to 7
Affiliated Site ID AM AM 5 to 6 AM AM
Houston 6752 6486 6244 7441
Tomball 1823 1797 2430 33
Tamina 1405 1515 1584 3434
Conroe 288 281 143 520
Table 3 - Tomball Site Affiliations
Percentage Change Hour to Hour of Affiliations - September 13th,
2008
Affiliated Site ID 3 to 4 AM 4 to 5 AM 5 to 6 AM 6 to 7 AM
Houston -4% -4% -4% 16%
Tomball 10% -1% 26% -7264%
Tamina -4% 7% 4% 54%
Conroe 10% -2% -97% 73%
Table 4 - Tomball Site Affiliations Percentage
14
The "Always Preferred" setting forces the radio to remain on a site, even if it goes into site trunking,
unless the radio deems the site trunking site unusable and another wide area site has 2 levels of improved
radio signal and is available for use.
15
We discuss this mode in more detail in the “Operational Procedures and Best Practices” section later in
this report.
26Affilations by Site
Houston Tomball Tamina Conroe
180
160
140
120
100
80
60
40
20
0
.
.
.
.
.
.
.
.
.
.
.
.
in
in
in
in
in
in
in
in
in
in
in
in
M
M
M
M
M
M
M
M
M
M
M
M
53
54
55
56
57
58
59
0
1
10
11
12
s.
s.
s.
s.
s.
s.
s.
s.
s.
s.
s.
s.
Hr
Hr
Hr
Hr
Hr
Hr
Hr
Hr
Hr
Hr
Hr
Hr
6
6
5
5
5
5
5
5
5
6
6
6
Figure 19 - Tomball Site Affiliations
Figure 20 - Tomball Map Location
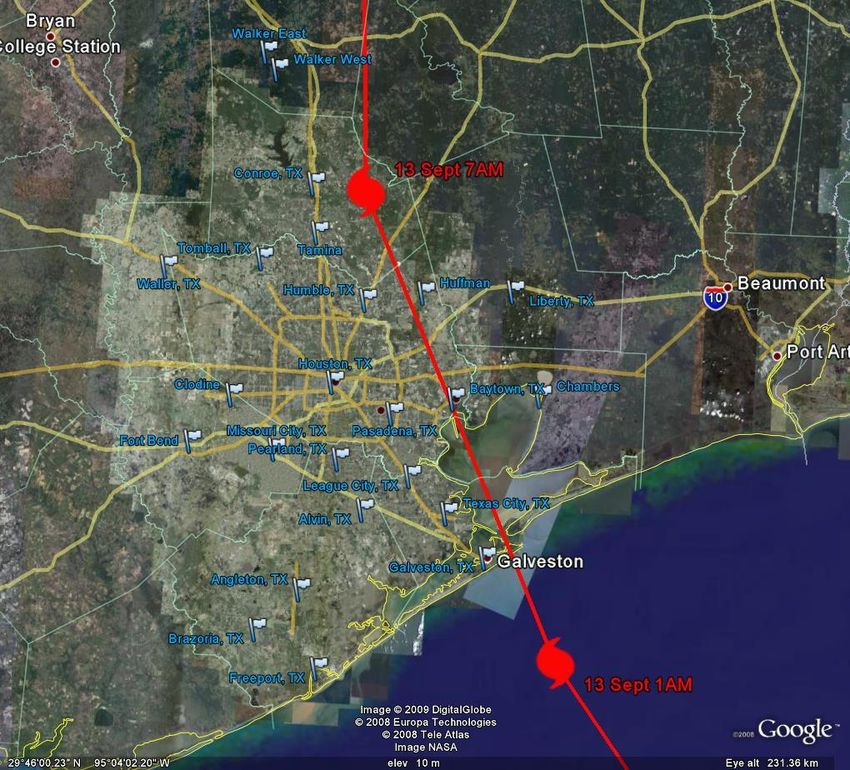
272. Galveston Site
In Figure 21 - Galveston Site Affiliations, based on the call detail records, we aggregated the
data to one minute intervals and determined that on September 12, 2008, at 10:22:16 PM, the site
trunking was a result of the loss of a Telco (T1) connection at the Galveston site. The Galveston
site, shown in Figure 22 - Galveston Site Photo, was constructed for extreme conditions, similar
to the Texas City site. Galveston radios that were affiliated to the Alvin and Texas City sites
were in wide area trunking mode within two to three seconds of Galveston entering site trunking.
Figure 21 - Galveston Site Affiliations
16
Figure 22 - Galveston Site Photo
16
This photo was provided by Galveston County Emergency Communication District.
28You can also read