North Carolina State University - Department of Computer Science Technical Report - CSC @ NCSU
←
→
Page content transcription
If your browser does not render page correctly, please read the page content below
Technical Report TR-2021-2

 North Carolina
 State University
 Department of Computer Science

 TR-2021-2

 TC-DTW: Accelerating Multivariate Dynamic Time Warping Through
 Triangle Inequality and Point Clustering

 Daniel S. Shen, Min Chi

 January 15, 2021

TC-DTW: Accelerating Multivariate Dynamic Time
 Warping Through Triangle Inequality and Point Clustering

 Daniel S. Shen∗ Min Chi+
 ∗ WilliamG. Enloe High School, Raleigh, NC, USA
 + NorthCarolina State University, Raleigh, NC, USA
 danielsongshen@gmail.com, mchi@ncsu.edu

Abstract
Dynamic time warping (DTW) plays an important role in analytics on time series. Despite the large body of
research on speeding up univariate DTW, the method for multivariate DTW has not been improved much in
the last two decades. The most popular algorithm used today is still the one developed seventeen years ago.
This paper presents a solution that, as far as we know, for the first time consistently outperforms the classic
multivariate DTW algorithm across dataset sizes, series lengths, data dimensions, temporal window sizes, and
machines. The new solution, named TC-DTW, introduces Triangle Inequality and Point Clustering into the
algorithm design on lower bound calculations for multivariate DTW. In experiments on DTW-based nearest
neighbor finding, the new solution avoids as much as 98% (60% average) DTW distance calculations and yields
as much as 25× (7.5× average) speedups.

1. Introduction
Temporal data analytics is important for many domains that have temporal data. One of its fundamental
questions is calculating the similarity between two time series, due to temporal distortions. In the medical
records of two patients, for instance, the times when their checks were done often differ; the points on two
motion tracking series often differ in the arrival times of their samples. Consequently, it is important to find the
proper alignment of the points in two time series before their similarity (or differences) can be computed. In
such an alignment, as illustrated in Figure 1(a), one point may match with one or multiple points in the other
series.
 The most influential method to find the proper alignments is Dynamic Time Warping (DTW). It uses dynamic
programming to find the best mapping, that is, an alignment that makes the accumulated differences of the
aligned points in the two series minimum. Such an accumulated difference is called DTW distance. Experimental
comparisons of DTW to most other distance measures on many datasets have concluded that DTW almost
always outperforms other measures [37]. It hence has been used as one of the most preferable measures in
pattern matching tasks for time series data [1, 2, 5, 10, 15, 16, 21, 28].
 DTW remains popular even in the era of deep learning, for several reasons. DTW-based temporal data
analytics are still widely used for its advantages in better interpretability over deep neural networks. Moreover,
there is also interest in combining DTW with deep learning by, for instance, using DTW as part of the loss
function. Studies have shown that DTW, compared to conventional Euclidean distance loss, leads to a better
performance in a number of applications [7] through softmin [6, 32]. A more recent way to combine DTW and
deep learning is to use DTW as a replacement of kernels in convolutional neural networks, creating DTWNet
that shows improved inference accuracy [4].
 Even with dynamic programming, DTW is still time-consuming to compute. On its own, DTW has an O(mn)
time complexity (m, n are the lengths of the involved two series). Maximizing the DTW speed is essential for
many uses. In real-time health monitoring systems, for example, speed deficiency forces current systems to do

 1 2021/1/16
Q
 : A data sequence

 : Envelope
 C

 (a) DTW is to find the best mapping Feature-1
 1
 Q

 C 0.8

 0.6

 0.4

 0.2

 0
 (b) Difference matrix -0.025
 C
 U -0.38
 Feature-2 30
 15 20
 -0.75 5 10
 L Q 0
 Samples
 (c) Bounding envelope of a 1D series and
 (d) Bounding envelope of a 2D series
 the LB Keogh lower bounds
Figure 1. (a) DTW is about finding the mapping between the points on two sequences that minimizes the
accumulated differences between the corresponding points. (b) The difference matrix between two sequences Q
and C, and the Sakoe-Chuba Band. (c) The bounding envelope of sequence Q is used for computing the Keogh
lower bounds (summation of the shaded area) of the DTW distance between Q and C. U and L: two series that
form an envelope of Q. (d) The bounding envelope on a 2D series is even looser due to the stretching effects on
both dimensions.

coarse-grained sampling, leaving many sensed data unprocessed, causing risks of missing crucial symptoms
early. For some diseases, it could be life threatening. For Septic Shock, for instance, every hour of delay in
antibiotic treatment leads to an 8% increase in mortality [11].
 Many studies have been conducted to enhance the speed of DTW-based analytics [20, 22, 28, 34, 38, 39]. The
most commonly used is the use of lower bounds. Consider a common use of DTW, searching for the candidate
series in a collection that is the most similar to a query series. We can avoid computing the DTW distance
between the query and a candidate series if the lower bound of their DTW distance exceeds the best-so-far
(i.e., the smallest DTW distance between the query and the already examined candidate series). Various lower
bounding methods have been proposed [20, 22, 38, 39], with LB Keogh [19] being the most popular choice.
 Most prior work on accelerating DTW has been, however, on univariate DTW; research on optimizing
multivariate DTW has been scarce. A multidimensional or as we will refer to in the following, a multivariate
time series is one in which each temporal point of the series carries multiple values. Multivariate time series
data are ubiquitous in real-world dynamic systems such as health care and distributed sensor networks. For
example, measurements taken from a weather station would be a multivariate time series with the dimensions
being temperature, air pressure, wind speed, and so on. There is a large demands for fast DTW on multivariate
time series [18, 25–27, 30, 33, 36].
 The current multivariate DTW analysis is based on an algorithm named LB MV [29]. It was proposed in 2003
as a straightforward extension of the univariate lower bound-based DTW algorithms to multivariate data. There
have been a few attempts to speed up multivariate DTW, but they are primarily concentrated on the reduction

 2 2021/1/16
or transformations of the high dimension problem space [13, 14, 23, 24], rather than optimizing the designs of
DTW algorithms.
 The goal of this work is to come up with new algorithms that can significantly, consistently outperform
the two-decade prevailing algorithm, whereby advancing the state of the art and better meeting the needs of
temporal data analytics.
 Our approach is creatively tightening the DTW lower bounds. The classic method, LB MV, gets a lower
bound by efficiently computing a bounding envelope of a time series by getting the max and min on each
dimension in a series of sliding windows. The envelope is loose, as Figure 1(d) shows (further explained in
Section 3). The key challenge in tightening the lower bounds is in keeping the time overhead sufficiently low
while tightening the bounds as much as possible. It is especially challenging for multivariate data: As the DTW
distance is affected by all dimensions, the computations of the lower bounds would need to take them all into
consideration.
 Our solution is TC-DTW. TC-DTW addresses the problem by creatively introducing geometry and quanti-
zation into DTW bounds calculations. More specifically, TC-DTW introduces Triangle Inequality and Point
Clustering into the algorithm design of multivariate DTW. It features two novel ideas: (i) leveraging the over-
lapping windows of adjacent points in a time series to construct triangles and then using Triangle Inequality to
compute tighter lower bounds with only scalar computations; (ii) employing quantization-based point clustering
to efficiently reduce the size of bounding boxes in the calculations of lower bounds. These two ideas each lead
to an improved algorithm for DTW lower bound calculations. Putting them together via a simple dataset-based
adaptation, we show that the resulting TC-DTW consistently outperforms the classic algorithm LB MV, across
datasets, data sizes, dimensions, temporal window sizes, and hardware.
 Experiments on the 13 largest datasets in the online UCR collection [3] on two kinds of machines show that
TC-DTW produces lower bounds that can help avoid as much as 98% (60% average) DTW distance calculations
in DTW-based nearest neighbor findings, the most common usage of DTW. The speedups over the default
windowed DTW (without lower bounds) are as much as 25× (8× on average), significantly higher than the
speedups from the classic algorithm. Sensitivity studies on different dimensions, window sizes, and machines
have all confirmed the consistently better performance of TC-DTW at no loss of any result quality, which
suggests the potential of TC-DTW in serving as a more efficient drop-in replacement of existing multivariate
DTW algorithms. The code has been released on github1 . To our best knowledge, TC-DTW is the first known
multivariate DTW algorithm that consistently outperforms the classic algorithm LB MV [29] with no loss of
the result precision.
 In the rest of this paper, we first describe the background in Section 2, provide a formal problem statement 3,
and then present the integration of Triangle Inequality and Point Clustering into DTW respectively in Sections 4
and 5. After that, we explain the adaptive deployment of two ideas, and their combined result TC-DTW in
Section 6. We report experimental results in Section 7, discuss some other issues in Section 8 and related work
in Section 9, and finally conclude the paper in Section 10.

2. Background
In this section, we will review the basic DTW algorithm as well as two common optimizations, window DTW
and lower bound filtering. Then, we will describe the prior solutions to multivariate DTW and their limitations.
Dynamic Time Warping (DTW) Let Q =< q1 , q2 , ...qm > be a query time series and C =< c1 , c2 , ...cn >
be a candidate time series we want to compare it to. As Figure 1 (a) illustrates, DTW tries to find the best
alignment between Q and C such that the accumulated difference between the mapping points is minimum. In
the mapping, it is possible that multiple points in one series map to one point in the other series. DTW finds
such a mapping by building a cost matrix C between each pair of points in Q and C where each element d(i, j)
of the matrix is the cost of aligning qi with cj , as illustrated by the meshed box in Figure 1(b). DTW then uses
1
 https://github.com/DanielSongShen/MultDTW

 3 2021/1/16
dynamic programming, shown as the following recursive formula, to minimize the sum of the elements on a path from the bottom left to the top right of the cost matrix. The path is known as the warping path; at each element of the cost matrix, the path goes right, up, or up right. DT W (i − 1, j) DT W (i, j) = d(i, j) + min DT W (i, j − 1) (2.1) DT W (i − 1, j − 1) Window DTW The basic DTW has a complexity O(mn), where m and n are the lengths of the two sequences. A common approach to reducing the computations is to use a window to constrain the warping path. This restrains the distance in the time axis that a point qi can be mapped to in C. There are several versions of window DTW, the most popular of which, also the one we will be using in this paper, is the Sakoe-Chiba Band [31]. As shown in Figure 1 (b), the Sakoe-Chiba Band assumes the best path through the matrix will not stray far from the middle diagonal. Let two points aligning in C and Q be their ith and jth point respectively. The window constraint states that the following must hold: j − W ≤ i ≤ j + W , where W is called the warping window size. Such a constraint is used in almost all applications of DTW, in both single and multiple variate cases. DTW-NN and Univariate Lower Bound Filtering A common use of DTW is in finding a reference sequence that is most similar to a given query sequence—which is called DTW-NN (or DTW Nearest Neighbor) problem. It is, for instance, a key step in DTW-based time series clustering. As many DTW distances need to be computed when there are many reference sequences, even with the window constraints, the process can still take a long time. Many studies have tried to improve the speed. Lower bound filtering is one of the most widely used optimizations, designed for saving unnecessary computations and hence getting large speedups in this setting. The basic idea is that if the lower bound of the DTW distance between Q and a reference C is already greater than the best-so-far (i.e., the smallest distance from Q to the references examined so far), the calculations of the DTW distance between Q and C can be simply skipped as it is impossible for C to be the nearest neighbor of Q. For univariate DTW, researchers have proposed a number of ways to compute DTW lower bounds (as listed in Section 9). The most commonly used is LB Keogh bound [19]. Given two univariate time series Q and C, of lengths m and n respectively, the LB Keogh lower Bound LB(Q, C) is calculated in two steps. 1) As shown in Figure 1 (c), a bounding envelope is created around series Q (red line) by constructing two time series U and L (for upper and lower, represented by two dotted lines) such that Q must lie in the between. U and L are constructed as: ui = max(qi−W : qi+W ) li = min(qi−W : qi+W ) 2) Once the bounding envelope has been created, LB(Q, C) can be simply computed from the parts of C outside the envelope. Formally, it is calculated as the squared sum of the distances from every part of the candidate sequence C outside the bounding envelope to the nearest orthogonal edge of the bounding envelope, illustrated as the shaded area in Figure 1(c). Multivariate DTW Multivariate DTW deals with multi-dimensional time series (MDT), where each point in a series is a point in a D-dimensional (D > 1) space. We can represent a time series Q as q1 , . . . qn and each qi is a vector in RD , (qi,1 , . . ., qi,D ). Multivariate DTW measures the dynamic warping distance between two MDTs. There are two ways to define multivariate DTW distance. One is independent DTW, calculated as the cumulative P distances of all dimensions independently measured under univariate DTW, expressed as DT WI (Q, C) = i=1,D DT W (Qi , Ci ), where Qi , Ci are univariate time series equaling the ith dimension of Q and C respectively. The other is dependent DTW, calculated in a similar way to the standard DTW for single-dimensional time series, except that the distance between two points on Q and C is the Euclidean distances of two D-dimensional vectors. Both kinds of DTWs have been used. A comprehensive study [33] has concluded that both kinds are valuable for practical applications. 4 2021/1/16
As independent DTW is the sum of multiple univariate DTWs, it can directly benefit from optimizations
designed for univariate DTWs. Dependent DTW is different; the multi-dimensional distance calculations are
not only more expensive than univariate distance, but also offer a different problem setting for optimizations.
This paper focuses on optimizations of dependent DTW, particularly the optimizations that are tailored to its
multi-dimensional nature. Without further notice, in the rest of this paper, multivariate DTW refers to dependent
DTW. (For the completeness of the discussion, we note that there is another kind of multivariate DTW, which
aligns points not on the time dimension, but on a multi-dimensional space [4], such as matching pixels across
two 2-D images. It is beyond the scope of this work.)

3. Problem Statement and Design Considerations
This section starts with a formal definition of the optimal lower bounding problem of multivariate DTW and the
tradeoffs to consider in the solution design. It prepares the foundation for the follow-up presentations of the set
of new algorithm designs.
 The optimal lower bounding problem is to come up with a way to calculate the lower bound of the DTW
of two multivariate series such that when it is applied to DTW-NN (DTW for Nearest Neighbor introduced in
Sec 2), the overall time is minimized. Formally, it is defined as follows.
Definition 1. Optimal Lower Bounding Problem for Multivariate DTW in DTW-NN. Let Q and C be two
sets of multivariate time series. The problem is to find LB∗ = {LBi,j
 ∗ |i = 1, . . . , |Q|, j = 1, . . . , |C|} such that:

 ∗
 ∀Qi ∈ Q, Cj ∈ C, LBi,j ≤ DT W (Qi , Cj ) (3.2)
 ∗
 LB = arg min TQ,C (LB) + TLB (Q, C) (3.3)
 LB

where, DT W (Qi , Cj ) is the DTW distance between Qi and Cj , TQ,C (LB) is the time taken to compute all lower
bounds in LB from Q and C, and TLB (C, Q) is the time taken to find the nearest neighbor of Qi (i = 1, . . . , |Q|)
in C while leveraging LB.
 Formula 3.3 in the problem definition indicates the fundamental tradeoff in lower bounding, that is, the
tension between the time needed to compute the lower bounds and the time the lower bounds may save DTW-
NN. The tighter the lower bound is, the more effective it can be in helping avoid unnecessary DTW distance
calculations; but if it takes too much time to compute, the benefits could be outweighed by the overhead.
Algorithm LB MV LB MV is the classic algorithm for computing the lower bounds of multivariate DTW. Since
it was proposed in 2003 [29], it has been the choice in almost all applications of multivariate DTW. It is a simple
extension of the univariate method for computing the LB Keogh lower bound (which is explained in Section 2).
Like in the univariate case, LB MV also first builds a bounding envelope for the query series. Each point on the
top and bottom of the envelope, ui and li , are defined as follows:

 ui = (ui,1 , ui,2 , . . . , ui,D ) li = (li,1 , li,2 , . . . , li,D )

where, ui,p and li,p are the max and min of the points in a window (centered at i) on the query series Q on
dimension p, that is:

 ui,p = max(qi−W,p : qi+W,p ) li,p = min(qi−W,p : qi+W,p )

 Figure 1(d) illustrates the bounding envelope of a 2D series in an actual time series of Japanese vowel
audio [8].
 With the envelope, the lower bound of the DTW distance between series Q and series C is calculated as (n
for the length of C)

 5 2021/1/16
Cost Matrix ci+2 qi qi ci+1 d(qi , ci-1) d(qi , ci+2) ci d(qi , qi-1) d(qi , ci+1) ci-1 ci-2 ci-1 d(qi-1 , ci-1) qi-1 ci+2 d(ci+2 , ci+1) ci+1 C qi-1 qi Q (a) (b) (c) Figure 2. (a) Cost matrix with window size equaling five. In LB AD, all the distances are computed between a candidate point and the query points within its window, the minimum of which is taken as the lower bound at the candidate, and the summation of these lower bounds across all candidate points is taken as the lower bound of DT W (Q, C). (b) Illustration of LB TI at point qi and ci−1 . (c) Illustration of LB TI at the top boundary of a window, which is ci+2 for query point qi . v 2 uX X (ci,p − ui,p ) if ci,p > ui,p u u n D LB M V (Q, C) = u t (ci,p − li,p )2 if ci,p < li,p i=1 p=1 0 otherwise This straightforward extension has been adopted widely in the applications of multivariate DTW. It computes the bounds fast, but is limited in effectiveness. As simple max and min are taken as the bounds in every dimension, the envelope is subject to the stretching effects on all dimensions, resulting in the loose bounding envelope as seen in Figure 1(d). (Experiments in Section 7 confirm the limitation quantitatively.) Algorithm LB AD. To facilitate the following discussions, we present a simple alternative method to LB MV illustrated in Figure 2(a). In the graph, Q and C are a candidate series and a query series respectively. For a point qi on Q, this method computes the distances between qi and every candidate point in the relevant window, that is, every cj on C (i − W ≤ j ≤ i + W ), and selects the smallest distance as the point lower bound at i . It then sums up all these point lower bounds of C to get the lower bound of DT W (C, Q). The soundness of the method is easy to see if we notice that the point that qi maps to in the DTW path must be one of the cj s on C (i − W ≤ j ≤ i + W ). The lower bounds obtained by this method can be much tighter than LB MV, but the computation time to get the lower bounds is comparable to the time needed to compute the actual DTW distance. We call this method LB AD (AD for all distances). The algorithms that we will introduce next can be regarded as optimizations to LB AD. They either leverage Triangle Inequality or Point Clustering to conservatively approximate the lower bound LB AD while substantially reducing the needed computations. 4. Triangle Lower Bounding The algorithms to be presented in this section center around the basic triangle inequality theorem in geometry. Theorem 1. Triangle Inequality: for any triangle, the sum of the lengths of any two sides must be no smaller than the length of the remaining side, denoted as d(a, b) ≤ d(a, c)+d(b, c), where d(x,y) is the distance between two points x and y. Triangle inequality holds on metrics, such as Euclidean distance. Although it does not directly apply to DTW distance as it is not a metric, an important insight we note is that it still holds for point distances in commonly 6 2021/1/16
seen time series, and leveraging it can avoid many unnecessary distance calculations and hence help efficient
derivation of DTW lower bounds. We next explain how we turn that insight into more efficient DTW algorithms,
which we call triangle DTW.

4.1 Basic Triangle DTW (LB TI)
Figure 2(b) illustrates the essential idea of the basic algorithm of triangle DTW, named LB TI (TI for Triangle
Inequality). Instead of computing the distance between qi and every cj (i − W ≤ j ≤ i + W ) as in LB AD, it
uses triangle inequality to quickly estimate the lower bound of the distance d(qi , cj ).
 Consider an example when j = i−1, that is, the distance between qi and ci−1 in the cost matrix in Figure 2(a).
These two points and qi−1 together form a triangle, shown in Figure 2(b). According to Triangle Inequality, we
have

 d(qi , ci−1 ) ≥ |d(qi−1 , ci−1 ) − d(qi−1 , qi )| (4.4)

 So, |d(qi−1 , ci−1 ) − d(qi−1 , qi )| could be taken as the lower bound of d(ci , qi−1 ). If we do not know
d(qi−1 , ci−1 ), we can substitute it with its lower bound L(qi−1 , ci−1 ) or upper bound U (qi−1 , ci−1 ) as follows:

 d(qi , ci−1 ) ≥ |d(qi−1 , ci−1 ) − d(qi−1 , qi )|
 = max(d(qi−1 , ci−1 ) − d(qi−1 , qi ), d(qi−1 , qi ) − d(qi−1 , ci−1 ))
 ≥ max(L(qi−1 , ci−1 ) − d(qi−1 , qi ), d(qi−1 , qi ) − U (qi−1 , ci−1 )) (4.5)

 Similarly, via Triangle Inequality, we can get the upper bound of d(qi , ci−1 ) as follows:

 d(qi , ci−1 ) ≤ d(qi−1 , ci−1 ) + d(qi−1 , qi )
 ≤ U (qi−1 , ci−1 ) + d(qi−1 , qi ) (4.6)

 Based on Equations 4.5 and 4.6, we have the following recursive formula for the lower bound and upper
bound of d(qi , ci−1 )

 L(qi , ci−1 ) = max(L(qi−1 , ci−1 ) − d(qi−1 , qi ), d(qi−1 , qi ) − U (qi−1 , ci−1 )) (4.7)
 U (qi , ci−1 ) = U (qi−1 , ci−1 ) + d(qi−1 , qi ) (4.8)

 In application of Equations 4.7 and 4.8, d(qi−1 , qi ) will need to be computed, but as it is needed to be
done only once for a query series Q and can be reused for all candidates series, the overhead is marginal.
L(qi−1 , ci−1 ) and U (qi−1 , ci−1 ) are already computed when the algorithm works on qi−1 . The true distances
at q0 can be computed and used as the lower bounds and upper bounds at q0 to initiate the application of the
formulae.
 It is easy to see that the formulae hold if we replace ci−1 with any other candidate points. What we care about
are only the candidate points within the window of qi , that is, cj (j = i − W, i − W + 1, . . . , i + W ). As points
ci−W , ci−W +1 , . . . , ci+W −1 also reside in the window of qW −1 , the lower bound and upper bound values on the
right hand side (rhs) of Equations 4.7 and 4.8 should be available when the algorithm handles qi . But ci+W is
not, and hence needs a special treatment.
 Figure 2 (c) illustrates the special treatment of ci+W at qi . It constructs a triangle with ci+W , qi , and ci+W −1 .
The bounds can be hence computed as follows:

 7 2021/1/16
1. Input:
 2. ℂ, ℚ : two sets of time series
 3. W: window size
 4. Output:
 5. : lower bounds of DTW(Q, C, W), for all Q∈ ℚ & C∈ℂ.
 6. Algorithm:
 7. = []
 8. foreach Q in ℚ: Q = neighborDistances( Q )
 9. foreach C in ℂ: C = neighborDistances( C )
 10. foreach Q in ℚ and C in ℂ
 11. .append (calculateLB_TI(Q, C, Q, C, W))
 12. Subroutine calculateLB_TI (Q, C, Q, C, W):
 13. Compute distances from Q[0] to C[0:W], store them into prevLB and prevUB
 14. LB_TI = min(prevLB)
 15. foreach i in [1, |Q|):
 16. L = U = []
 17. q = Q[i]
 18. foreach c in C lying in q’s window excluding window’s top:
 19. L.append (lowerBound( Q[i-1], prevLB, prevUB)) // eq. (4.7)
 20. U.append(upperBound( Q[i-1], prevUB) // eq. (4.8)
 21. L.append(lowerBoundTop( C[i+r-1], L, U)) // eq. (4.9)
 22. U.append(upperBoundTOP( C[i+r-1], U)) // eq. (4.10)
 23. LB_TI += min(L)
 24. prevLB = L
 25. prevUB = U
 26. return LB_TI
 Figure 3. Algorithm of Basic Triangle DTW, LB T I.

 L(qi , ci+W ) = max(L(qi , ci+W −1 ) − d(ci+W −1 , ci+W ), d(ci+W −1 , ci+W ) − U (qi , ci+W −1 )) (4.9)
 U (qi , ci+W ) = U (qi , ci+W −1 ) + d(ci+W −1 , ci+W ) (4.10)
where, L(qi , ci+W −1 ) and U (qi , ci+W −1 ) are the results at qi and ci+W −1 , and d(ci+W −1 , ci+W ) needs to be
computed ahead of time; but as it can be reused for many query series, the overhead is marginal.
Full algorithm. Figure 3 outlines the entire algorithm. It first calculates the distances between every two adjacent
points on each query and candidate series, then goes through each query-candidate series pair to compute the
lower bound of their DTW. In the process, it applies Equations 4.7, 4.8, 4.9, and 4.10 to compute the lower
bounds and upper bounds at each relevant query-candidate point pair; the minimum of the lower bounds of a
candidate point is taken as its overall lower bound; the summation of all these overall lower bounds across all
candidate points is taken as the lower bound of the DTW of the query-candidate series pair.
Characteristics. Compared to LB AD, this algorithm saves computations by replacing vector (distance)
computations with scalar (bound) computations. It replaces pair-wise distance computations in the distance
matrix with lower bound and upper bound calculations. This basic Triangle DTW algorithm favors problems in
which the time series are obtained through dense sampling such that the distance between two adjacent points
on a time series is small: small d(ci , ci−1 ) and d(qi+r , qi+W −1 ) in Figure 2(b,c) lead to tighter bounds. The
recursive nature of Equations 4.7 and 4.8 entails that as the algorithm moves through the points on a candidate
series, the bounds get looser and looser. We call this phenomenon the diminishing tightness problem. Some
variations of the algorithm may mitigate the problem. We next describe several example variations.

 8 2021/1/16
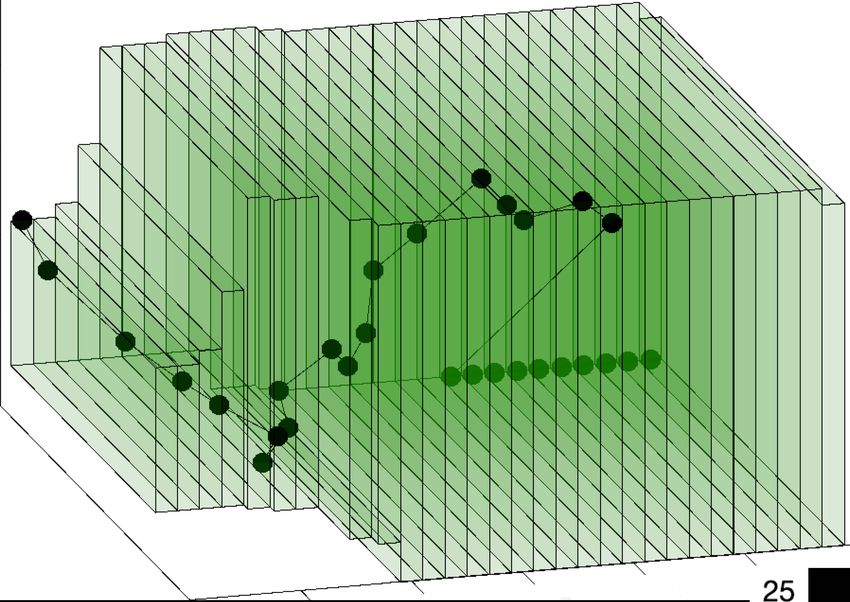
1. Input:
 2. C: the list of candidate points in one window
 3. K: the number of clusters
 4. L: the number of quantization levels
 : query point ci 5. Output:
 LB_PC 6. Boxes: the bounding boxes of C

 V
 7. Algorithm:

 M_
 LB
 8. // get the overall value range
 LB_PC 9. Range = GetValueRange( C )
 10. // L-level quantization in each dimension of each point
 11. Cells = AssignToCells (C, Range)
 12. // get bounding box of each non-empty cell
 13. Boxes = GetBounds (Cells)
 14. if ( |Cells| > K)
 15. Boxes.combine (K)
 (a) Insight behind LB PC (b) Algorithm in LB PC setup stage
Figure 4. (a) The insight behind LB PC. The five query points correspond to qj (j=i-2, i-1, i, i+1, i+2), the five
points in the window of ci . Clustering the query points allows the algorithm to better bound the query points and
hence compute a lower bound much tighter than LB MV gets. (b) Algorithm used in the setup stage of LB PC
for identifying the bounding boxes of candidate series.

4.2 Variations of LB TI with Extra Distances
The variations in this section all try to tighten the bounds of the basic LB TI algorithm by adding some extra
distance calculations.
(1) Triangle DTW with Top (LB TI TOP). The differences of this variation from the basic LB TI is that it
computes the true Euclidean distance between qi and the top boundary candidate point of its window, rather
than estimates it with the (qi , ci+W , ci+W −1 ) triangle (Equations 4.9 and 4.10). Note that as a side effect, it
forgoes the need for computing the distances between adjacent candidate points.
(2) Periodical Triangle DTW (LB TIP ). The difference of this variation from the basic LB TI is that it
periodically tightens the bounds by computing the true candidate-query point distances at some candidate points,
qi (mod(i, P ) == 0), where P is a positive integer, called the TIP period length. These distances are then used
as the lower and upper bounds of qi in the follow-up bound calculations. The smaller P is, the tighter the
bounds could be, and the more computations it incurs. When P equals the query series length |Q|, the algorithm
is identical to the Basic Triangle algorithm LB TI.
(3) Periodical Triangle DTW with Top (LB TIP TOP). It is a simple combination of LB TIP and LB TOP,
that is, besides periodically computing the true candidate-query point Euclidean distances, it also computes the
true distances from every query point to the top boundary of its candidate window.
 Among these variations, our experiments show that variation three (LB TIP TOP) performs the best overall,
striking an overall best tradeoff between the tightness of the bounds and the runtime overhead. In the following
discussion, without further notice, we will use LB TI to refer to this variation.

5. Clustering DTW (LB PC)
The second approach we present tightens the lower bounds by exploiting the structure or distributions of data in
time series through point clustering (LB PC).
 Figure 4(a) illustrates the basic insight behind the design of LB PC. For the purpose of explanation, we
assume that each point in the series of interest is a 2-D point, and the five query points, qi−2 to qi+2 , are located
in two areas as shown in Figure 4(a). An envelope used in LB MV is essentially a bounding box as shown by
the dash lines in Figure 4(a), and the lower bound computed by LB MV is essentially the distance from ci to
the corner closest to it which is corner X in Figure 4(a).

 9 2021/1/16
The bounds would be a lot tighter if we instead first cluster the five query points into two groups (the two
solid-lined boxes in Figure 4(a)), apply LB MV to each of the groups to estimate the minimum distance between
ci and each of the groups, and then take the minimum of those distances (ci to the two corners of the two solid-
lined boxes in Figure 4(a)) as the lower bound between ci and the five query points. Our illustration uses 2-D
space, but the insight obviously also applies to spaces of higher dimensions.
 LB PC is designed on this insight. The challenge is to minimize the time overhead as clustering takes
time. LB PC addresses it by using adaptive quantization as the clustering method, assisted by uniform window
grouping.
Quantization-based clustering.
 Figure 4(b) outlines the algorithm of quantization-based clustering. For some given points to cluster, it first
gets the overall value range in each dimension. It then regards the value range as a grid with LD cells (for D
dimensions)—each dimension’s value range is evenly divided into L segments. The cell that a point belongs to
can be then directly computed by dividing its value by the length of a cell in each dimension. Each non-empty
cell is regarded as a cluster, and the boundaries of the cell define a bounding box.
 To control the number of clusters (e.g., no more than a certain number K), if the number of non-empty cells
exceeds K, the last (in increasing lexicographic order of the cells) extra boxes are combined. In addition, we find
that it is beneficial to add a limit on the smallest cell length in the quantization. When, for instance, all points in
a window have very similar values in one dimension, separating the tiny range into multiple even smaller cells
adds no benefits but overhead. In our experiments, we set the limit to 0.00001 of the normalized range of values.
 This clustering algorithm is applied by LB PC on the query points of each window. In essence, when a query
comes, the LB PC algorithm works as LB MV does, except that it uses the bounding boxes (produced by the
clustering algorithm) rather than the simple envelope. The value of K and the quantization level L determine the
tradeoff between the tightness of the lower bounds and the lower bounds computation overhead. Its appropriate
value can be empirically selected for a given dataset as other DTW parameters are.
Uniform window grouping.
 To further reduce the cost, we introduce an optimization named uniform window grouping. It computes
the bounding boxes for each expanded window. An expanded window is the result of merging w consecutive
windows. Take Figure 2 (a) as an example. In the original example, each window covers 5 points. The expanded
window with w = 3 would include 7 points {qi−2 , qi−1 , qi , qi+1 , qi+2 , qi+3 , qi+4 }. The shifting stride becomes
w accordingly. The next expanded window would include points {qi , qi+1 , qi+2 , qi+3 , qi+4 , qi+5 , qi+6 }, and so
on. This method reduces the number of bounding boxes to compute and save and hence both the time and space
cost by a factor of w. We call w the window expansion factor.
 Note that expanded windows are used in only the computations of bounding boxes; the DTW lower bound
computations still use the original windows. In the DTW lower bound computation, the bounding boxes of an
expanded window are used as the bounding boxes of the original windows that compose that expanded window.
It may cause looser bounding boxes and hence looser lower DTW bounds, but experiments (Section 7) show
that the impact is small.
 It is worth mentioning that an alternative grouping method we considered is non-uniform grouping, which
groups adjacent windows if and only if their bounding boxes are the same. Experiments show that although this
method keeps the bounding boxes sizes unchanged, the space saved is modest (about 20-30%) and it cannot
save time cost. The uniform grouping is hence preferred.

6. Selective Deployment, TC-DTW, and Computational Complexities
Selective Deployment Both of the two proposed methods can help tighten the lower bounds, but also introduce
extra time overhead. Inspired by the cascading idea in univariate DTW [28], we use selective deployment of
these algorithms with the combination of LB MV. For a given query-candidate series pair, the method first
applies LB MV to get a lower bound. It applies the advanced algorithms only if e < LB M V /dbest < 1, where

 10 2021/1/16
Table 1. Summary of the algorithms on computing lower bound of DTW. (Notations at bottom) Method Lower Bounds Calculation Operations Time Complexity Compute envelope of Q and distances to bounding envelopes (1 LB MV O(D ∗ n ∗ M ∗ N ) bounding box/point) LB AD Compute distances to each candidate point O(W ∗ D ∗ n ∗ M ∗ N ) Compute neighbor distances on Q, 1/P LB AD distances, TI LB TI O(4 + ((2 + W/P ) ∗ D) ∗ n ∗ M ∗ N ) bounds, and window top distances Compute bounding boxes and distances to bounding boxes (K LB PC O(K ∗ D ∗ n ∗ M ∗ N/w) boxes per w points) n: series length (for explanation purpose, assume —C—=—Q—); M : |C|; N : |Q|; W : window size; D : dimension; P : the TIP period length; K : # clusters in LB PC; w : window expansion factor. dbest is the DTW distance between the query series and the most similar candidate series found so far, and e is called triggering threshold, a value between 0 and 1. The reason for that design is that if LB M V /dbest ≥ 1, as the lower bound is greater than the best-so-far, this candidate series is impossible to be the most similar candidate; there is obviously no need to apply other methods. If the lower bound is a lot smaller than the best-so- far (i.e., LB M V ≤ e), there is a good chance for this current candidate to be indeed better than the best-so-far. Applying LB TI or LB PC may produce a larger lower bound, which is however unlikely to exceed Dbest ; the DTW between the query and the candidate series would then have to be computed. In both of these two cases, applying LB TI or LB PC adds overhead but avoids no extra DTW computations. This selective deployment strategy can help deploy DTW only when it is likely to give benefits. Similar to other DTW parameters, the appropriate value of triggering threshold e for a dataset can be determined during the setup stage. TC-DTW LB TI and LB PC offer two different approaches to improve LB MV. As the next section shows, both are effective, but the one that performs the best could vary on different datasets. To get the best of both worlds, a simple method is to use a small samples of series, in the setup stage, to try out both methods and settle on the better one. We use TC-DTW to reference the resulting choice. Computational Complexities Table 1 summarizes the various methods for computing the lower bounds of DTW between two collections of time series C and Q. For simplicity, the table assumes the same length shared by query and candidate series. LB AD and LB MV lie at two ends of the spectrum of overhead and tightness, while the methods proposed in this work offer options in the between. They are equipped with knobs (e.g., the period length P and the number of clusters K) which can be adjusted to strike the best tradeoff for a given problem. 7. Experiments To evaluate the efficacy of the proposed algorithms, we conduct a series of experiments and comparisons in DTW-based nearest neighbor findings, in which, the goal is to find the most similar (i.e., having the smallest DTW distance) candidate series for each query series. In this most common use of DTW, lower bounds are used to avoid computing the DTW distance between a query and a candidate if their DTW lower bound already exceeds the so-far-seen smallest DTW distance. The experiments are designed to answer the following major questions: 1. How effective are the two new methods, LB TI and LB PC, in accelerating multivariate DTW in nearest neighbor finding? 2. How effective are the two techniques when they are applied without prior preparations in the streaming scenario? What effects does the runtime overhead of the lower bound calculations impose on the end-to-end performance? 3. How do the benefits change with window sizes or data dimensions? 4. Do they perform well on different machines? 11 2021/1/16
7.1 Methodology
Methods to compare. We focus our comparisons on the following methods:

 • LB MV: the most commonly used method in multivariate DTW [29].
 • LB TI: our proposed triangle DTW (period length P is set to five for all datasets).
 • LB PC: our proposed point clustering DTW with uniform window grouping.
 • TC-DTW: the combination of LB TI and LB PC. For a given dataset, it picks the better one of the two
 methods as described in Section 6.

 Both LB TI and LB PC use the selective deployment scheme as described in Section 6. The parameters used
in the two methods are selected from the following ranges: {0.05, 0.1, 0.2} for the triggering threshold in LB TI,
{0.1, 0.5} for the triggering threshold in LB PC, {2,3} for the quantization levels in LB PC. The selection, as
part of the database configuration process, is through empirically experimenting with the parameters on a small
set (23) of randomly chosen candidate series. Other parameters are the maximum number of clusters K and the
window expansion factor w in LB PC, which are both set to 6 for all datasets.
 In all the methods, early abandoning [37] is used: During the calculations of either lower bounds or DTW
distances, as soon as the value exceeds the so-far-best, the calculation is abandoned. This optimization has been
shown beneficial in prior uni-variate DTW studies [37]; our observations on multivariate DTW are also positive.
Datasets. Our experiments used all the 13 largest multivariate datasets in the online UCR multivariate data
collection [3], which are the ones in the most need for accelerations. The numbers of pair-wise DTW distances
in these datasets range from 40,656 to 525 million, as Table 2 shows. These datasets cover a wide variety in
domains, the length of a time series (Length), and the numbers of dimensions of data points (Dim). Values on
the time series were normalized before being used, and NA values were replaced with zeros. For each dataset,
30% are used as queries, and the rest are used as candidates.
Hardware and measurement. To consider the performance sensitivity to hardware, we have measured the
performance of the methods on two kinds of machines. (1) AMD machine with 2GHz Opteron CPUs, 32GB
DDR3 DRAM, and 120GB SSD; (2) Intel machine with 2.10GHz Skylake Silver CPUs, 96GB DDR4 2666
DRAM, and 240GB INTEL SDSC2KB240G7 SSD. We focus the discussions on the results produced on the
AMD machine and report the results on the Intel machine later. The machines run Redhat Linux 4.8.5-11.
 In the experiments, the methods are applied on the fly by computing the envelopes, neighboring point
distances, and bounding boxes of the query series at runtime as the query arrives. All runtime overhead is
counted in the performance report of all the methods. The reported times are the average of 10 repetitions.
Window Sizes and Data Dimensions One of the aspects in the experiment design is to decide what window sizes
to use for the DTW calculations. Our decision is based on observations some earlier work has made on what
window sizes make DTW-based classification give the highest classification accuracy; the results are listed as
”learned w” on the UCR website [8]. One option considered is to use certain percentages of a sequence length
as the window size as some prior work does. But observations on the UCR list show that there is no strong
correlations between sequence length and the best window size. In fact, a percentage range often used by prior
work is 3-8% of the sequence length, which covers only 10% of the 128 datasets. On the other hand, the best
window sizes of almost all (except two) datasets fall into the range of [0, 20] regardless of the sequence length.
Although that list does not contain most of the multivariant datasets used in this study, the statistics offer hints
on the range of proper window sizes. Based on those observations, we experiment with two window sizes, 10
and 20.
 Even though some of the datasets have points with a high dimension, in practice, practitioners typically first
use some kind of dimension reduction to lower the dimensions to a small number [14] to avoid the so-called
curse of dimensionality. In all the literature we have checked on the applications of multivariate DTW, the largest

 12 2021/1/16
Table 2. Datasets Dataset #DTW #Points #Series Dim Length Description Articularyword. 69,431 82,800 575 9 144 Motion tracking of lips and mouth while speaking 12 different words Charactertraj. 1,715,314 520,156 2858 3 182 Pen force and trajectory while writ- ing various characters on a tablet Ethanolconcen. 57619 917,524 524 3 1751 Raw spectra of water-and-ethanol solutions in whisky bottles Handwriting 210,000 152,000 1000 3 152 Motion of writing hand when writ- ing 26 letters of the alphabet. Insectwingbeat 525,000,000 1,500,000 50000 200 22 Reconstruction of the sound of in- sects passing through a sensor Japanesevowels 86,016 18,560 640 12 29 Audio, recording of Japanese speak- ers saying ”a” and ”e” Lsst 5,093,681 177,300 4925 6 36 Simulated astronomical time-series data in preparation for observations from the LSST Telescope Pems-sf 40,656 63,360 440 963 144 Occupancy rate of car lanes in San Francisco bay area Pendigits 25,373,053 87,936 10992 2 8 Pen xy coordinates while writing digits 0-9 on a tablet Phonemespectra 9,337,067 1,446,956 6668 11 217 Segmented audio collected from Google Translate Audio files Selfregulationscp1 66024 502,656 561 6 896 cortical potentials signal Spokenarabicdigits 16,255,009 818,214 8798 13 93 Audio recording of Arabic digits Uwavegesturelib. 4,211,021 1,410,570 4478 3 315 XYZ coordinates from accelerome- ters while performing various simple gestures. LB_MV LB_TI LB_PC LB_MV LB_TI LB_PC 12 30 10 25 8 Lower bounds 20 Lower bounds 6 15 4 10 2 5 0 0 1 30 59 88 117 146 175 204 233 262 291 320 349 378 407 436 465 494 523 552 581 0 100 200 300 400 500 Sequence number of the candidate series Sequence number of the candidate series (a) Japanesevowels (b) Insectwingbeat Figure 5. The lower bounds of the DTW distance between sequence 0 and other sequences in Japanesevowels and Insectwingbeat datasets. For legibility, the candidate series are sorted based on the LB TI bounds. dimension used is less than 10. Hence, in our examination of the impact of dimensionality on the methods, we study three settings: dim=3,5,10. 7.2 Experimental Results Soundness and Sanity Checks Because the optimizations used in all the methods keep the semantic of the original DTW distance, they do not affect the precision of the results. It is confirmed in our experiments: The optimized methods find the nearest neighbor for every query as the default method does, and return the correct 13 2021/1/16
Table 3. Comparisons of LB TI and LB PC over LB MV with all runtime overhead counted.
 W=20*
 Speedups Percentage of skipped DTWs calc.
 Dataset LB MV TC-DTW LB TI LB PC LB MV TC-DTW LB TI LB PC
 Articularyword. 7.60 10.51 7.32 10.51 84% 91% 85% 91%
 Charactertraj. 16.98 25.31 22.11 25.31 89% 99% 92% 99%
 Ethanolconcen. 6.67 11.08 11.08 7.06 79% 87% 87% 80%
 Handwriting 3.41 3.55 3.55 3.55 36% 50% 42% 50%
 Insectwingbeat 6.03 9.02 7.66 9.02 56% 90% 71% 90%
 Japanesevowels 2.59 2.91 2.69 2.91 10% 40% 17% 40%
 Lsst 1.68 1.64 1.64 1.63 7% 15% 7% 15%
 Pems-sf 6.05 7.33 6.02 7.33 78% 85% 77% 85%
 Pendigits 4.06 4.13 4.13 3.89 27% 48% 34% 48%
 Phonemespectra 1.95 2.02 1.92 2.02 12% 13% 13% 13%
 Selfregulationscp1 1.86 1.92 1.92 1.92 24% 29% 25% 29%
 Spokenarabicdigits 5.76 7.71 7.71 7.28 64% 83% 75% 83%
 Uwavegesturelib. 11.85 17.63 17.63 13.89 92% 95% 95% 94%
 Average 5.88 8.06 7.34 7.41 51% 63% 55% 63%
 W=10*
 Speedups Percentage of skipped DTWs calc.
 Dataset LB MV TC-DTW LB TI LB PC LB MV TC-DTW LB TI LB PC
 Articularyword. 11.24 11.78 10.68 11.78 96% 95% 94% 95%
 Charactertraj. 16.77 18.52 18.52 17.78 100% 100% 100% 99%
 Ethanolconcen. 13.29 15.87 15.87 13.05 97% 100% 100% 94%
 Handwriting 4.16 4.69 3.99 4.69 51% 72% 55% 72%
 Insectwingbeat 5.44 10.91 7.17 10.91 66% 94% 81% 94%
 Japanesevowels 2.55 3.21 2.88 3.21 30% 71% 45% 71%
 Lsst 1.67 2.06 1.70 2.06 21% 39% 21% 39%
 Pems-sf 7.28 7.47 6.78 7.47 86% 91% 85% 91%
 Pendigits 4.08 4.29 4.29 3.98 27% 49% 34% 49%
 Phonemespectra 2.08 2.16 2.10 2.16 25% 27% 25% 27%
 Selfregulationscp1 2.10 2.38 2.18 2.38 41% 52% 41% 52%
 Spokenarabicdigits 8.19 10.42 10.07 10.42 86% 97% 90% 97%
 Uwavegesturelibrary 15.40 16.17 16.17 15.23 98% 100% 100% 98%
 Average 7.25 8.46 7.88 8.09 63% 76% 67% 75%
 *: Actual window sizes are capped at the length of a time series.

DTW distance. In a sanity check on Nearest Neighbor-based classification, the classification results are identical
among all the methods. We focus our following discussions on speed.
Overall Speed Table 3 reports the results when the window size is set to 20 and 10; the actual window size for
a dataset is capped at the length of a series. The first five dimensions are used; Table 4 reports results on other
dimensions.
 The speedup of a method X on a dataset is computed as T (X)/T (default), where T (default) is the time taken
by the default windowed DTW algorithm (which uses no lower bounds) in finding the candidate series most
similar to each query series. T (X) is the time taken by method X which includes all the runtime overhead, such
as the time of lower bounds calculations if method X uses lower bounds.
 In Table 3, the ”Speedups” columns report the speedups of the methods over the default algorithm. The
”Skips” columns in Table 3 report the percentage of the query-candidate DTW distances that those methods
successfully avoid computing via their calculated lower bounds.
 From Table 3, We see that on average, LB MV gives 5.86× speedups on the datasets. The speedups come
from avoiding the DTW calculations for 50% of query-candidate pairs and also the early abandoning scheme.
LB TI avoids 56% DTW calculations, and gives 7.33× average speedup. LB PC avoids 64% DTW calculations,

 14 2021/1/16
Table 4. Speedups (×) in Various Dimensions on Datasets with More than 8 Dimensions. (W=20)
 Dim=3
 Dataset LB MV TC-DTW LB TI LB PC
 Articularyword. 7.67 10.59 7.49 10.59
 Insectwingbeat 12.12 15.24 14.39 15.24
 Japanesevowels 3.17 3.53 3.41 3.53
 Pems-sf 5.99 7.17 5.98 7.17
 Phonemespectra 1.97 1.97 1.97 1.95
 Spokenarabic. 8.41 11.54 11.01 11.54
 Average 6.55 8.34 7.38 8.34
 Dim=5
 Articularyword. 6.86 9.24 6.86 9.24
 Insectwingbeat 6.13 8.94 8.04 8.94
 Japanesevowels 2.63 2.97 2.66 2.97
 Pems-sf 7.82 8.58 7.77 8.58
 Phonemespectra 1.93 1.98 1.98 1.95
 Spokenarabic. 5.55 7.81 7.81 7.40
 Average 5.15 6.59 5.85 6.51
 Dim=10
 Articularyword. 5.80 8.10 5.87 8.10
 Insectwingbeat 2.55 4.45 3.21 4.45
 Japanesevowels 2.12 2.28 2.20 2.28
 Pems-sf 5.27 5.94 5.17 5.94
 Phonemespectra 2.00 1.97 1.97 1.87
 Spokenarabic. 3.12 4.09 4.09 3.93
 Average 3.48 4.47 3.75 4.43

 Table 5. Performance on Intel machine. (W=20)
 Speedup (×)
 Dataset LB MV TC-DTW LB TI LB PC
 Articularyword. 3.52 4.88 3.82 4.88
 Charactertr. 6.97 9.99 9.21 9.99
 Ethanolconc. 6.70 11.16 11.16 7.02
 Handwriting 2.83 2.96 2.96 2.86
 Insectwingbeat 9.09 13.70 11.65 13.70
 Japanesevowels 3.96 4.48 4.19 4.48
 Lsst 2.37 2.39 2.26 2.39
 Pems-sf 3.53 3.86 3.66 3.86
 Phonemespectra 2.44 2.46 2.46 2.36
 Pendigits 6.00 6.34 6.17 6.34
 Selfregula. 1.82 1.97 1.88 1.97
 Spokenarabic. 5.62 10.84 10.45 10.84
 Uwavegesture. 5.06 7.89 7.20 7.89
 Average 4.61 6.38 5.93 6.04

 15 2021/1/16
100 100

 10 10
 LV_TI(ideal)
 LV_PC(ideal)
 1 1 LV_TI
 LV_PC

 ls

 .
 aj.

 ng
 d.

 f

 ts

 lib
 s-s
 we

 igi
 or

 rtr

 iti

 re
 m
 yw

 nd
 wr

 vo
 te

 tu
 Pe

 Pe
 se
 ac
 ar

 nd

 es
 l

 ne
 ar

 eg
 Ha
 cu

 Ch

 pa

 av
 ti
 Ar

 Ja

 Uw
 Figure 6. Speedups of LB TI and LB PC, and their ideal results when all runtime overhead is removed.

achieving 7.42× average speedups, slightly higher than LB TI. As examples, Figure 5 shows the lowerbounds
from the three methods on two representative datasets. Similar trends appear on other datasets. The larger lower
bounds from LB TI and LB PC are the main reasons for the time savings.
 In most cases, LB PC avoids more DTW computations and gets a larger speedup than LB TI. There are four
exceptions, Ethanolconcentration, Pendigits, Spokenarabicdigits and Uwavegesturelibrary,
on which LB TI performs better than LB PC does. The results are influenced by the value distributions and
changing frequencies of the datasets. Method TC DTW gets the best of both worlds through its dataset-adaptive
selection, achieving an average 8.03× speedups. The speedups differ substantially across datasets. On Lsst, the
avoidance rate is only 15%, and the speedup is 1.67×; on Charactertrajectories, the avoidance rate is as
large as 98%, and the speedup is 25.1×. In general, if the series in a dataset do not have many differences, lower
bounds are less effective in avoiding computations, and the speedups are less pronounced. Despite the many
differences among the datasets, TC-DTW consistently outperforms the popular method LB MV on all datasets.
 The results also confirm the usefulness of early abandoning. For instance, even though LB MV avoids only
7% DTW distance calculations on dataset Lsst, the speedup it gives is as much as 1.65×, showing the benefits
from the early abandoning. Nevertheless, the benefits from the improved DTW algorithms are essential. For
instance, on dataset Charactertrajectories, the 25× speedups come primarily from the avoidance of 98%
of the DTW distance calculations. In fact, because early abandoning is adopted by all four methods shown in
Table 3, the differences in their produced speedups are caused only by their algorithmic differences rather than
early abandoning.
Time overhead To study the impact from the runtime overhead, Figure 6 puts the speedups of LB TI and LB PC
in the backdrop of their ideal speedups where runtime overhead is excluded. (For readability, we include only
some of the datasets in that graph.) The vertical axis is in log scale to make all the bars visible. The largest
gaps appear on datasets Charactertrajectories and Uwavegesturelibrary, with a 10-55× speedup left
untapped due to the runtime overhead, indicating that further optimization of the implementations of the two
methods could potentially yield more speedups.
Window size The bottom half of Table 3 shows the results when the window size is 10 (again, capped at the
length of a time series). As window size reduces, all methods become more effective in finding skip opportunities
with the average skips increasing to over 60% in all the methods. The three proposed methods, LB TI, LB PC,
and TC-DTW, still show a clear edge over LB MV.
Dimensions As mentioned earlier, even though some of the datasets have points with a high dimension, in
practice, practitioners typically first use dimension reduction methods to lower the dimensions to a small
number [14] to avoid the so-called curse of dimensionality. In all the literature on multivariate DTW applications
that we have checked, the largest dimension used is less than 10. Therefore in our examination of the impact
of dimensionality on the methods, we focus on three settings: dim=3,5,10. Our experiments run on the datasets

 16 2021/1/16
that have dimensions greater than 8 by changing the used dimensions to the first dim dimensions of the data.
Table 4 reports the speedups from the methods over the default window-based DTW. All methods see some
reductions of speedups as the number of dimensions increase. It is intuitive: As data become sparser in higher-
dimension spaces, the bounding boxes become larger and lower bounds become looser. Nevertheless, TC-DTW
still consistently outperforms LB MV on all the datasets and dimensions.
Performance cross machines To examine whether the new methods consistently show benefits across different
machines, besides the experiments on the AMD machine, we have measured the performance of the methods on
the Intel machine (configuration given in Section 7.1). Table 5 reports the results. The setting is identical to that
in Table 3 (W=40). Compared to the results on the AMD machine in Table 3, the speedups of the three methods
are all somewhat smaller, reflecting the influence of the hardware differences in terms of the relative speeds
between CPU and memory accesses. But the trends are the same. The results confirm that the better efficacy
of the three new methods over LB MV holds across machines, with TC-DTW excelling at an average 6.29×
speedups.
 Overall, the experiments confirm the advantages of the new methods over the current approach LB MV
in accelerating multivariate DTW. The advantages consistently hold across datasets, data sizes, dimensions,
window sizes, and machines. The advantages of the new methods over LB MV are especially pronounced on
large datasets with large windows, where, time is especially of concern.

8. Discussions
The two methods presented in the paper are the crystallized results of the numerous ideas we have explored.
The other ideas are not as effective. We briefly describe one of them for its potential for future development.
 This idea is also about clustering, but instead of point-level clustering, it considers clustering of query
series. The basic insight behind it is that the tight bounds from LB AD meet Triangle Inequality with the
Euclidean distances between two query series. That is, LB AD(Qj , C) − ED(Qi , Qj ) ≤ LB AD(Qi , C) ≤
LB AD(Qj , C) + ED(Qi , Qj ), where ED stands for Euclidean distance. We omit the proof here but note
that it can be easily proved if one notices that such an inequality holds at every corresponding point between
Qi and Qj . Therefore, for two queries series similar to each other, we can use the inequality to estimate one’s
lower bounds with a candidate series based on those of the other series. We attempted with some quick ways
to do clustering (e.g., Euclidean distances among sample points), but did not observe significant benefits except
on only a few time series. The reason is that even though the method can sometimes give bounds tighter than
LB MV, the degree is too small to change the filtering result. Applying the idea to each segment of a series
might give better results. We leave it for future exploration.
 It is worth mentioning another possible application scenario of the proposed methods. In the scenario studied
in our experiments, the bounding boxes and neighboring point distances are computed on the fly when a query
series arrives. Another option is to switch the role of query and candidate series and compute the bounding
boxes and neighboring distances of the candidate series ahead of time (e.g., when setting up the database).
The pre-computed info can then be used in processing queries. Such an option incurs extra space cost as the
bounding boxes and neighbor point distances need to be permanently stored but if that is not a concern, it could
further amplify the performance benefits of the methods.

9. Related Work
The most significant advantage of DTW is its invariance against signal warping (shifting and scaling in the
time axis, or Doppler effect). Experimental comparison of DTW to most other highly cited distance measures
on many datasets concluded that DTW almost always outperforms other measures [37]. Therefore, DTW has
become one of the most preferable measures in pattern matching tasks for time series data. It has been used
in robotics, medicine [5], biometrics, speech processing [1], climatology, aviation, gesture recognition [2],
user interfaces [21], industrial processing, cryptanalysis [10], mining of historical manuscripts [15], space
exploration, wildlife monitoring, and so on [16, 28].

 17 2021/1/16
You can also read