The Behavioural Impacts of Commercial Swimming With Whale Tours on Humpback Whales (Megaptera novaeangliae) in Hervey Bay, Australia - Pacific ...
←
→
Page content transcription
If your browser does not render page correctly, please read the page content below
ORIGINAL RESEARCH
                                                                                                                                               published: 23 August 2021
                                                                                                                                         doi: 10.3389/fmars.2021.696136

                                            The Behavioural Impacts of
                                            Commercial Swimming With Whale
                                            Tours on Humpback Whales
                                            (Megaptera novaeangliae) in Hervey
                                            Bay, Australia
                                            Stephanie H. Stack 1,2* , Kate R. Sprogis 2 , Grace L. Olson 1 , Florence A. Sullivan 1 ,
                                            Abigail F. Machernis 1 and Jens J. Currie 1
                                            1
                                                Pacific Whale Foundation, Wailuku, HI, United States, 2 Pacific Whale Foundation Australia, Urangan, QLD, Australia

                                            Swim-with-whale tourism has expanded across several countries globally, with
                           Edited by:       humpback whales (Megaptera novaeangliae) being the most commonly targeted
                 Renata Sousa-Lima,
  Federal University of Rio Grande do
                                            species of baleen whale. Behavioural responses from humpback whales to swim-with-
                          Norte, Brazil     whale tours have been reported, however, responses are likely context-dependent. In
                        Reviewed by:        2014, swimming with humpback whales began in Hervey Bay, Queensland, Australia, an
                     Aldo S. Pacheco,       important resting ground and migratory stopover for humpback whales. The behavioural
   National University of San Marcos,
                                 Peru       responses of humpback whales to this swim-with-whale industry have not been
               Jorge Urbán Ramírez,         examined in Queensland, preventing informed management of this industry. The aims
      Universidad Autónoma de Baja
                California Sur, Mexico
                                            of this study were to: (1) examine short-term behavioural responses in whales before,
                 *Correspondence:
                                            during, and after swim-with-whale tours, and (2) investigate behavioural responses
                  Stephanie H. Stack        of whales throughout swim-with-whale tours compared to whale watch tours. Data
           research@pacificwhale.org        were collected on board a commercial vessel, where before, during and after data
                   Specialty section:
                                            were collected during swim-with-whale tours (250 h) and whale watch tours (150 h).
         This article was submitted to      Within the swim-with-whale tours, behavioural changes were detected before, during,
          Marine Ecosystem Ecology,
                                            and after the vessel approached and placed swimmers in the water on a mermaid
               a section of the journal
          Frontiers in Marine Science       line, with the majority of significant changes occurring in the during and after phases.
           Received: 16 April 2021          The number of direction changes made by the whales was highest when swimmers
           Accepted: 20 July 2021           were in the water and the whales did not resume undisturbed behaviour after the
         Published: 23 August 2021
                                            swimmers exited the water. There was a 50% reduction in the proportion of time that
                              Citation:
    Stack SH, Sprogis KR, Olson GL,
                                            whales spent resting during swim-tours compared to during whale watch tours. In
       Sullivan FA, Machernis AF and        both tour types, the time spent engaging in various behaviours was impacted by the
     Currie JJ (2021) The Behavioural
                                            distance between the vessel and the whale(s). These results support the conclusion
   Impacts of Commercial Swimming
     With Whale Tours on Humpback           that the behaviour of humpback whales in Hervey Bay was altered in response to
    Whales (Megaptera novaeangliae)         swim-with-whale tourism. As humpback whales are capital breeders with limited energy
              in Hervey Bay, Australia.
            Front. Mar. Sci. 8:696136.
                                            reserves, reducing disturbance to them is of high importance for their continued
    doi: 10.3389/fmars.2021.696136          population recovery and for the sustainability of the marine tourism industry. In Australia,

Frontiers in Marine Science | www.frontiersin.org                                    1                                            August 2021 | Volume 8 | Article 696136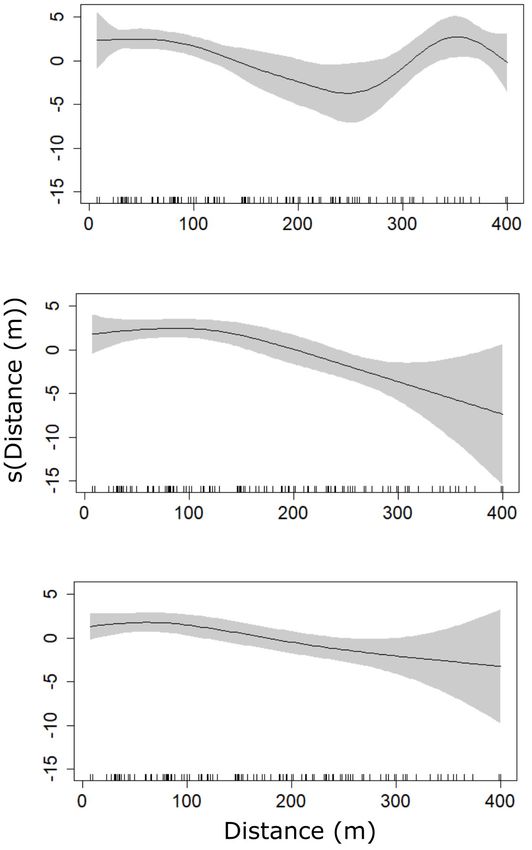
Stack et al.                                                                                                            Swim-With-Whale Tourism Impacts

                                            where swim-with-whale tourism is becoming more established, robust education and
                                            enforcement programs, combined with continued monitoring of population dynamics
                                            through scientific research, are needed to minimise impacts to the population and guide
                                            adaptive management strategies.
                                            Keywords: swim-with-whale, whale watching, in-water interactions, Megaptera novaeangliae, behavioural
                                            responses, anthropogenic impacts, before-during-after study design

INTRODUCTION                                                                    presence of swimmers (Lundquist et al., 2013). Off the Kingdom
                                                                                of Tonga, Kessler et al. (2013) reported that humpback whales
Whale watching has grown into a global marine industry that                     moved away from swim-with-whale tour groups more quickly
has created significant environmental, educational, scientific,                 when swimmers were loud and splashing on the surface of the
and socioeconomic benefits for coastal communities around                       water. Fiori et al. (2019) noted that humpback whales, particularly
the world (Hoyt, 2001; O’Connor et al., 2009). Generating                       mother-calf pairs, exhibited vertical avoidance strategies, such as
over $2 billion USD annually, the whale watch industry has                      increasing the duration of dives and increasing the proportion of
placed an economic value to whales and dolphins and the                         time spent diving. Off Western Australia, migrating humpback
types of interactions people have with them (Parsons, 2012).                    whales adopted both horizontal and vertical avoidance strategies
Over the past few decades, as the interest and value of the                     in response to swim-with-whale activities by increasing their
industry has grown, commercial operations have diversified the                  swim speeds, swimming more erratically, changing their heading
ways in which they facilitate interactions between members                      away from the vessel and altering their dive patterns (Sprogis
of the public and whales and dolphins in the wild (Samuels                      et al., 2020). Likewise, off Reunion Island, humpback whales
et al., 2000; Hoyt, 2001; Rose et al., 2005). One form of                       were less likely to continue resting when swimmers were in
interaction that has emerged is the “swim-with” industry in which               the water (Hoarau et al., 2020). Impacts from swim-with-whale
humans enter the water and attempt to closely observe free-                     tourism likely differ from typical whale watch tourism, due to
ranging whales and dolphins (Samuels and Bejder, 2004; Rose                     closer vessel approaches to the whales to place swimmers in
et al., 2005). One of the first known commercial swim-with-                     the water and the presence of swimmers in the water. Several
whale programs developed during the mid-1900s off the Great                     factors are involved in the response of whales to swim-with-whale
Barrier Reef, Australia, after dwarf minke whales (Balaenoptera                 activities, including the vessel approach type, group composition
acutorostrata) began interacting with snorkelers (Arnold, 1997;                 (if a calf is present), and location type (i.e., breeding ground,
Birtles et al., 2002; Valentine et al., 2004). Since then, the                  migration route, or feeding ground (Machernis et al., 2018;
swim-with-whale industry has expanded across several countries                  Sprogis et al., 2020). Importantly, disturbance to whales from the
globally (Hendrix and Rose, 2014). Worldwide, humpback                          marine tourism industry increases the energetic consequences on
whales (Megaptera novaeangliae) and dwarf minke whales are the                  whales (Lusseau and Bejder, 2007), thus reducing any disturbance
most frequently targeted species for swim-with-whale activities                 is of high importance for both these capital breeders with
(Gero et al., 2016). Humpback whales are commonly targeted                      limited energy reserves and the sustainability of the swim-with-
as they are a cosmopolitan species and are easy to access as                    whale industry. Overall, current research suggests that the rate
they migrate along coastal landmasses (Hendrix and Rose, 2014).                 at which swim-with-whale operations are expanding may not
Other large whale species are also sought after for close, in-                  be sustainable for the targeted population on which they rely
water interactions, including blue (Balaenoptera musculus), fin                 (Gero et al., 2016).
(Balaenoptera physalus), and southern right (Eubalaena australis)                   Examining the short-term behavioural responses of humpback
whales (Hendrix and Rose, 2014). The list of locations and                      whales to swim-with-whale activities across different locations
targeted species continues to grow as the swim-with-whale                       and with differing approach types from operators is of
industry rapidly expands around the world (Stack and Serra,                     importance as swimming with these large whales poses risks to
2021). The design of swim-with commercial operations varies                     the safety of humans. Dangerous encounters between humpback
regionally in the type of permitted approach for vessels and                    whales and humans have been documented off Western
swimmers for vessels and swimmers. The types of permitted                       Australia, Réunion Island and the Kingdom of Tonga (Fiori et al.,
approaches include floating at the surface with or without a                    2019; Barra et al., 2020; Hoarau et al., 2020; Sprogis et al., 2020).
tether, diving underwater on a breath hold and/or scuba diving                  These agonistic behaviours include tail fluke thrashes, peduncle
(Stack and Serra, 2021).                                                        throws and pectoral fin slaps (Sprogis et al., 2020). Swimmers
   Despite the growing industry, limited research has evaluated                 have sustained injuries such as broken bones, bruises, and
the impacts of swim-with-whale tourism on large baleen whale                    scratches (Fiori et al., 2019; Sprogis et al., 2020), generally from
species. In some locations and for some species, behavioural                    pectoral shears and fluke thrashes, which are common behaviours
responses from swim-with-whale activities have been evaluated.                  directed toward swimmers by humpback whales (Barra et al.,
Off Argentina, southern right whales decreased their proportion                 2020). Safety incidents have occurred while swimming with
of time spent resting and increased the proportion of time spent                mother and calves (Barra et al., 2020; Hoarau et al., 2020), where
travelling, with mothers and calves being most sensitive to the                 either the mother or the calf can cause an injury to swimmers.

Frontiers in Marine Science | www.frontiersin.org                           2                                      August 2021 | Volume 8 | Article 696136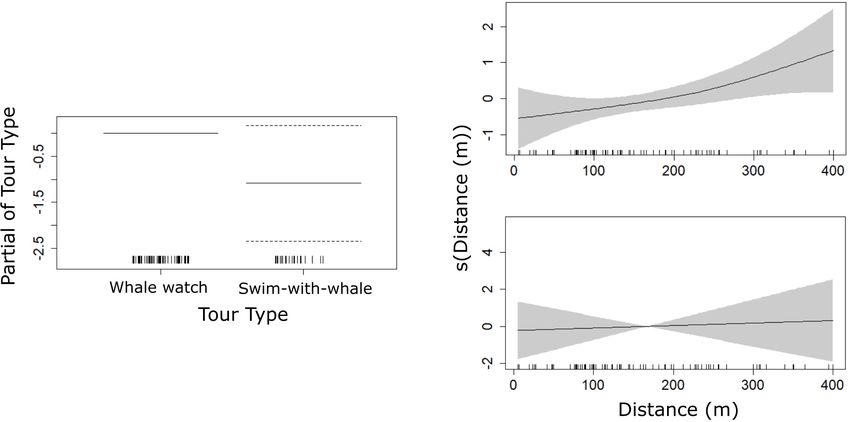
Stack et al.                                                                                                       Swim-With-Whale Tourism Impacts

Thus, due to the high-risk of human injuries it is important to             (1) the effects of swim-with-whale programs will vary among
manage the industry correctly to ensure the safety of swimmers.             targeted species and populations, (2) further research into the
    The swim-with-whale industry began on the east coast of                 impacts of swim-with-whale programs are required, and (3)
Australia in 2013 off Mooloolaba, Queensland. In response                   a precautionary approach toward management of swim-with-
to this, and in an effort to jumpstart the regional economy,                whale programs should be implemented until the impacts are
the Queensland government initiated a trial swim-with-whale                 better understood (International Whaling Commission, 2000;
commercial tourism program in Hervey Bay in 2014. After an                  International Whaling Commission , 2004). To meet this need,
incident-free three-year trial, in 2017, the Australian Government          in this study we examined the short-term behavioural impacts
and Queensland Department of National Parks permitted the                   of swim-with-whale tourism in Hervey Bay. Specifically, we:
swim-with-whale program to become a permanent activity in                   (1) assessed the effects (behavioural activity and changes in
Hervey Bay. During the 2014–2016 trial period, Fraser Coast                 swimming direction) before, during, and after swimmers entered
Tourism and Events, Inc. convened with a group of stakeholders              the water on a mermaid line with juvenile and adult whales,
to develop a Code of Conduct for swimming with whales                       and (2) examined any differences in whale behaviours between
in Hervey Bay. These guidelines were developed by the tour                  whale watch and swim-with-whale tours. Furthermore, we
operators and submitted to the Queensland Parks and Wildlife                identified any factors which influenced short-term behavioural
Service in 2018 (Fraser Coast Tourism and Events, 2018). The                changes in whales in response to swimmers; and identified any
Code of Conduct reinforces the existing national and state                  management issues associated with swim-with-whale tourism.
legislation and guidelines for operation, including the marine              It is hypothesised that: (1) swim-with-whale tours will cause
park management and permitting conditions. The stipulations                 behavioural changes in whales in the during phase compared
for how the activity must be conducted in Hervey Bay include                to before and after, and that (2) short-term responses in swim-
that free swimming/snorkeling is not permitted. Instead of                  with-whale tours will be greater in magnitude compared to
freely swimming in the water, the passengers must hold onto a               whale watch tours.
“mermaid line” that is attached to the vessel at one end or remain
on a submerged swim platform. The Code of Conduct also states
that when placing swimmers in the water, “minimum distances                 MATERIALS AND METHODS
of vessels must comply with the minimum legal requirement
defined as no approach zone for vessels: 100 m from the whale”              Study Site and Species
in line with the Australian National Guidelines for Whale and               This study was conducted from July through September in 2018,
Dolphin Watching (Department of the Environment and Energy,                 2019, and 2020 in Hervey Bay, Queensland (25◦ 000 S, 152◦ 520 E;
2017). There are no limits on the number of available commercial            Figure 1). Hervey Bay is a shallow bay, generally < 18 m
licenses, and all existing whale watch and dive operators were              depth, which is composed of a sand and mud bottom. The E-1
offered the opportunity to add swimming with the whales to                  humpback whale population migrates along the east coast of
their Commercial Activity Agreement. There are currently eight              Australia between May and December to and from their Antarctic
authorised tour vessels that offer swim-with-whale tours in                 feeding grounds (Franklin et al., 2012; Andrews-Goff et al., 2018).
Hervey Bay; some operators focus solely on swim-with-whale                  On their southern migration, whales enter Hervey Bay from
tours while others combine a mix of swim-with-whale and                     approximately early August to mid-October (Franklin et al.,
traditional whale watch tours.                                              2011). Humpback whales predominantly occupy the eastern
    Hervey Bay acts as important habitat for breeding stock                 portion of Hervey Bay, in Platypus Bay (Corkeron et al., 1994),
E-1 on their southern migration in the austral winter after                 which is a general use area in the Great Sandy Marine Park. There
departure from their tropical breeding grounds on the Great                 is a seasonal change in pod characteristics in the bay relating
Barrier Reef (Smith et al., 2012). The bay is shallow, sheltered            to the sexual and maturational classes; this is evident in arrival
and serves as a mid-migratory stopover, especially for mother               patterns. Juvenile whales and mature females are first to arrive
and calves (Corkeron et al., 1994; Franklin et al., 2011, 2018;             in August, by mid-season larger groups of mature adults arrive,
Stack et al., 2019). Migratory stopover grounds, such as Hervey             and by mid-late season mother-calf pairs arrive (Franklin et al.,
Bay, offer shelter and a place for humpback whales to rest, which           2011). Whales may reside in the bay for 2–3 days, with some
supports energy conservation and offers increased opportunities             having extended stays for over a month (Stack et al., 2019). When
for nursing a calf (Videsen et al., 2017; Bejder et al., 2019). Thus,       leaving the bay, the whales exit north and continue their southern
reducing human-induced disturbance to humpback whales is                    migration on the eastern side of K’gari (Fraser Island) (Franklin
particularly important in Hervey Bay.                                       et al., 2018). Breeding stock E-1 has recovered well from the
    In a recent survey of global swim-with-whale operations, it             commercial whaling era, and is currently estimated at >25,545
was recommended that detailed studies should be conducted                   whales (2015 estimate; 95% confidence interval 21,631–27,851)
in each location containing swim-with-whale operations to                   and has been increasing at an estimated 10.9% per annum
examine the impact on individuals, groups, and populations of               (Noad et al., 2019).
cetacean species to evaluate management options (Gero et al.,
2016). These recommendations have been further supported                    Swim-With-Whale Tour Regulations
by the International Whaling Commission (IWC) Scientific                    All trips and approaches to whales were conducted following the
Committee. The IWC Scientific Committee acknowledge that:                   Australia National Guidelines for Whale and Dolphin Watching

Frontiers in Marine Science | www.frontiersin.org                       3                                     August 2021 | Volume 8 | Article 696136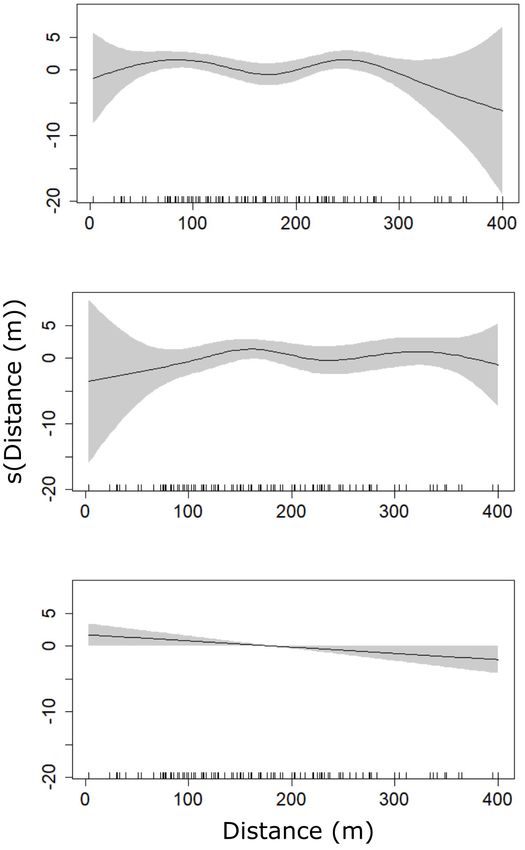
Stack et al.                                                                                                                      Swim-With-Whale Tourism Impacts

  FIGURE 1 | The study area of Hervey Bay, Queensland, and its location along the east coast of Australia (insert). The vessel departed from Urangan Harbour and
  transited the nearshore protected waters west of K’gari (Fraser Island) within the study area outlined in black.

2017 (Department of the Environment and Energy, 2017) and                                Compliance with these regulations is unknown and, to date,
Commercial Activity Agreement guidelines, which are outlined                          Queensland Marine Parks have not monitored the swim-with-
in detail below.                                                                      whale industry in Hervey Bay. As the Code of Conduct is
                                                                                      industry driven (not a government initiative), safety is based
Commercial Activity Agreement and Code of Conduct                                     on the operators Safety Management System (SMS) through the
The main initial safety concern from the Queensland                                   Australian Maritime Safety Authority.
Government for the swim-with-whale tourism industry was from
encounters between humans and sharks. After a review on sharks                        Whale Watch Tour Regulations
in the region (Pepperell and Williams, 2014), swim-with-whale                         The Queensland Government currently requires all commercial
activities were deemed safe by the Queensland Government and                          whale watch operators to abide by the following regulations
permitted for the 2014 whale season in Hervey Bay. Currently,                         (Department of the Environment and Energy, 2017), which were
the Queensland Government Commercial Activity Agreement                               followed by the vessel used during this study.
provides the following limitations for licensed swim-with-whale
operators (Department of the Environment and Energy, 2017):
                                                                                         • The ‘caution’ zone is an area surrounding a whale or
    • Free-swimming with whales is not permitted, and                                      dolphin in which boats cannot travel at speeds of more than
      “immersive whale watching activities” are permitted via                              six knots or speeds that create a wake. The caution zone
      holding a mermaid line (a line that is secured to the                                extends out 300 m from a whale.
      vessel at one end, not to exceed 20 m in length) and/or                            • Within a caution zone there are areas designated as ‘no
      duckboard method (e.g., sitting or lying on a submerged or                           approach’ zones that boats cannot enter. These are the areas
      semi-submerged swim platform aboard the vessel).                                     closest to an animal and directly in front of and behind
    • The maximum number of swimmers allowed in the water                                  an animal. For a whale, the no approach zone surrounds
      at any one time is 10 persons, including guides.                                     the animal for 100 m and extends 300 m in front of and
    • Immersive whale watching is prohibited at any time where                             behind the animal.
      a calf has been identified.                                                        • A boat cannot enter a caution zone if three boats are already
    • A person must not enter the water closer than 100 meters                             present within the caution zone of an animal.
      (m) from a whale and, a person in the water within this
      100 m distance, must not move toward a whale.                                     Compliance with the regulations is unknown; however,
    • The vessel engine must be stopped before the swimmers are                       Queensland Marine Parks does routinely monitor the
      placed in the water.                                                            whale watch industry.

Frontiers in Marine Science | www.frontiersin.org                                 4                                          August 2021 | Volume 8 | Article 696136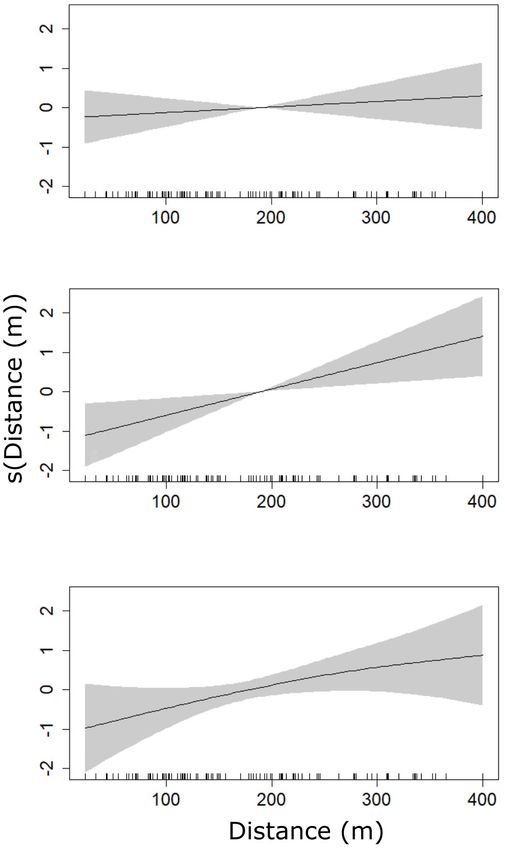
Stack et al.                                                                                                                              Swim-With-Whale Tourism Impacts

Data Collection for Whale Watch and                                                                   The transit time from Urangan Harbour to Platypus Bay was
Swim-With-Whale Tours                                                                             30–45 min. Both swim-with-whale and whale watch tours had
Humpback whale behavioural observations were collected from                                       a transit speed of ∼25–28 knots, and humpback whales were
a rigid-hull inflatable boat (RHIB), 12.5 m in length, with                                       searched for with the naked eye. Two dedicated researchers
four Yamaha 300 hp outboard petrol engines. This same vessel                                      were on board for both swim-with-whale and whale watch
was used to conduct both commercial swim-with-whale tours                                         tours. When a whale(s) was sighted, the vessel slowed to
and whale watch tours at different times throughout the day                                       ∼15 knots until it reached the focal individual/group. Data
departing from Urangan Harbor. Data on swim-with-whale                                            for both swim-with-whale and whale watch tours began from
operations were collected before, during, and after swimmers                                      around approximately 400 m distance. One researcher measured
entered the water, to examine if there were any short-term                                        the distance to the whales using a Bushnell Legend 1200
changes in the whales’ behaviour. Additionally, data were                                         ARC rangefinder throughout the encounter, where the distance
collected from the same vessel platform during traditional whale                                  between the whale and vessel varied, however the group was
watch tours to compare the behavioural responses of whales                                        never actively approached by the vessel
Stack et al.                                                                                                      Swim-With-Whale Tourism Impacts

the swimmers in the water. In some cases, the whales were already          impacts of environmental variables, only data where Beaufort sea
within 100–150 m of the vessel and swimmers were placed in                 state ≤ 3 were used in subsequent analysis.
the water without manoeuvring. Swimmers were never placed
in the water when the whales were closer than 100 m from the               Comparison Between Whale Watch and
vessel. Once the skipper decided to make a swim attempt, the               Swim-With-Whale Tours
engine was turned off, a step ladder was lowered, a mermaid                To determine any potential differences of tour type on whale
line (made of braided nylon, 20 m length, with pool noodles                behaviour and swimming direction changes, data collected in the
attached along the length of the rope to add flotation) was placed         during phase (swimmers in the water) of swim with tours and
in the water and 1–10 people (with masks and snorkel, no fins)             aboard whale watch tours were examined. For whale watching,
entered the water slowly and calmly. Participants were asked to            the engines were mostly left on transiting slowly or in neutral
hold onto the mermaid line and float, and not actively swim.               (occasionally switched off, e.g., when listening to whales) and
The duration of the during phase generally lasted as long as               during swim-with-whale tours, the engines were either switched
the whales remained in the vicinity of the swimmers. The after             off or placed in neutral. To determine potential changes in whale
phase consisted of an additional 15 min focal follow recording the         behaviours, the proportion of time spent in each behavioural state
behaviour of the whales, whilst the swimmers were back on board            (1-min resolution) and frequency of direction changes/hour were
and the skipper kept the vessel at a distance ∼300 m to continue           quantified for each encounter and compared. The proportion of
observations. It should be noted that in some cases, the whales            time spent in each behavioural state was calculated by dividing
actively approached the vessel in the after phase and the vessel           the time observed in a particular behavioural state by the total
remained in neutral to avoid engine noise as much as possible              time spent with the group. For swim-with-whale tours, the
and waited for the whales to move beyond 300 m. The 15 min                 total time was for the during phase only. The frequency of
duration of the before and after phases was chosen to maximise             direction changes/hour was calculated by dividing the observed
the time recording the whale’s behaviour and to allow for the time         counts of direction changes by the total time spent with the
constraints of a three hour swim-with-whale tour.                          group and then converting this to direction changes per hour.
                                                                           As regulations do not permit swim-with-whale tours with calf
                                                                           groups, any mother-calf data collected on whale watch tours were
Data Analysis                                                              excluded to ensure the comparative analysis between the tour
Comparison Among Before, During, After Phases                              types included whales of the same age-classes and composition.
Within Swim-With-Whale Tours                                               To determine whether the tour type affected whales’ behavioural
To determine potential changes in whale behaviour arising                  activity level, we tested for significant differences in the pooled
from swimmers in the water during swim-with-whale tours, the               proportion of time spent in each behavioural state on whale
proportion of time spent in each behavioural state and frequency           watch tours and the during phase of swim-with-whale tours
of direction changes/hour while travelling were calculated before,         using a Z-test for proportions (Welch, 1937). The total number
during, and after swimmers entered the water. We did not                   of samples included in the model were the total number of
attempt to separate the effects of the vessel from the effects of          swim-with-whale tours and the total number of observations
swimmers in the water because under the Commercial Activity                on whale watch tours where Beaufort sea state ≤ 3, group size
Agreement terms and Code of Conduct, the swimmers would                    remained constant throughout the encounter (i.e., no affiliation
never be present without the vessel.                                       or disaffiliations), no calves were present, and at least 15 min of
    The proportion of time spent in each behavioural state was             observation time.
calculated for each phase (before, during, and after), by dividing
the time observed in a particular behavioural state by the total           Generalised Additive Modelling
phase time. The proportion of time spent resting, socialising,             All statistical analyses and subsequent figures were completed
surface active, and travelling was determined by summing the               using R version 4.0.1 (R Core Team, 2020). To ensure
amount of time spent in each of the associated behavioural                 accurate representation of whale behaviour, only phases with
events reported in Table 1 at a one-minute resolution. Socialising         an observation time of ≥15 min were included in analysis.
behaviours were restricted to observations that were specifically          The frequency of direction changes/hour and the proportion of
toward conspecifics. The proportion of time spent diving was               time whales spent in five behavioural states (Table 1; diving,
determined by calculating the time between an associated                   resting, surface active, socialising, travelling) were modelled as
behavioural event for diving (Table 1) and the subsequent re-              a function of explanatory variables using generalised additive
surfacing of the group. The frequency of whale directional                 models (GAMs) developed in the mgcv package (Wood, 2004,
changes/hour was calculated by dividing the observed counts                2017). GAMs allowed for the evaluation of non-normal response
of direction changes while whales were travelling (Table 1) for            variables and testing of potential non-linear relationships.
each observation phase by the time spent in that phase and                    To determine the potential impact within swim-with-whale
then converting this to direction changes per hour. The total              tours, the proportion of time spent in each behavioural state
number of samples included in the final models for before,                 and the frequency of direction changes/hour were modeled as
during, and after data for swim-with-whale tours included data             a function of: whale group size (excluding groups with calves),
on focal groups with a minimum of 15 min observation time in               average distance between the whale(s) and the vessel over the
all three phases, and group size remaining constant throughout             encounter (in m, the number of distance points ranged from 3
the encounter (i.e., no affiliation or disaffiliations). To minimize       to 34, SE = 14), phase (before, during, and after; as a categorical

Frontiers in Marine Science | www.frontiersin.org                      6                                     August 2021 | Volume 8 | Article 696136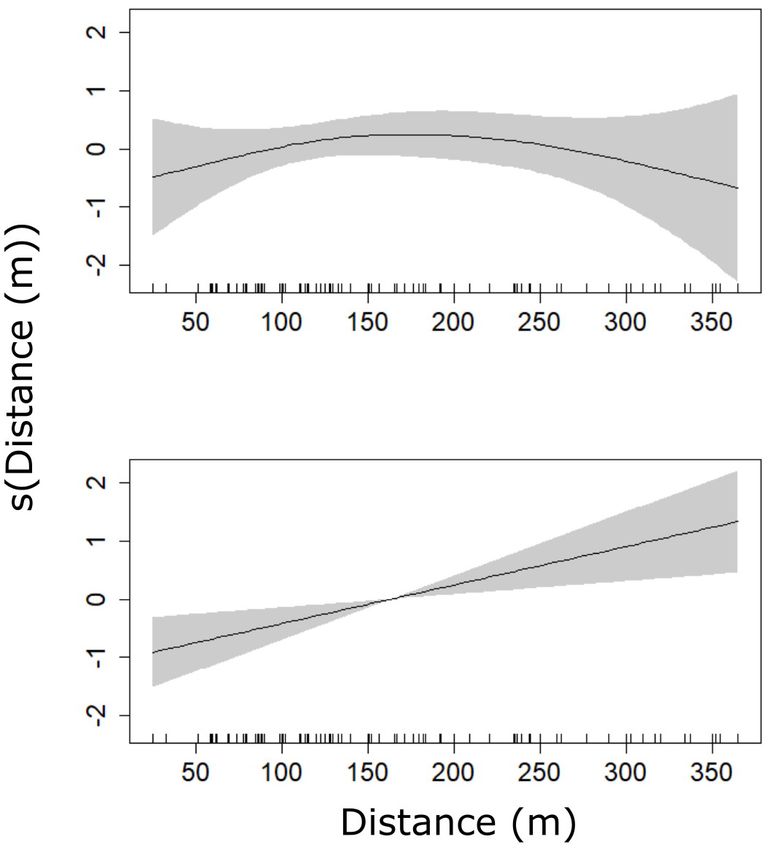
Stack et al.                                                                                                                           Swim-With-Whale Tourism Impacts

TABLE 2 | Summary of top GAM models showing the relationship between the number of direction changes, and the proportion of time spent surface active, resting,
diving, and socialising before, during, and after swim-with-whale tours.

                                            Number of direction Proportion of time              Proportion of    Proportion of        Proportion of      Proportion of
                                                changes           surface active                time resting      time diving       time socialising    time travelling

Intercept                                           –0.69***                –1.54***               –3.97***            0.21              –1.53***            –1.41***
Year                                                    –                   –1.30**                   –                  –                1.21*                 –
Phase – Before                                          –                      –                      –                  –                  –                   –
Phase – During                                          –                      –                      –                  –                  –                   –
Group size                                              –                      –                      –               –0.38*                –                   –
Distance between vessel and whale(s)                    –                      –                      –                  –                  –                   –
Interaction between distance to whale(s)            s(2.57)***                 –                   s(5.19)           s(1.49)                –                s(1.00)
and phase (Before)
Interaction between distance to whale(s)            s(6.77)***                 –                   s(4.26)           s(4.24)                –               s(1.00)**
and phase (During)
Interaction between distance to whale(s)            s(2.40)*                   –                   s(1.00)*          s(1.77)                –                s(1.28)
and phase (After)
Deviance explained (%)                                56.0                   10.2                   25.0               20.4                9.1                10.1
Number of observations                                126                    126                    126                126                 126                126

Rows represent candidate explanatory variables and columns represent response variables considered for each of the six separate models. Cells with a “–” indicate terms
dropped from the final model. Values represent the parametric coefficient estimates for factors and the degree of smoothing [s(edf)] for smooth terms included in the final
model. The significance value is represented as ***p = 0–0.001; **p = 0.001–0.01; *p = 0.01–0.05.

variable), and year. In addition, to determine any differences                             of the term was retained if the smoothed term was dropped,
between swim-with-whale tours and whale watching tours, the                                had an edf near 0, did not decrease the GCV score and/or
proportion of time spent in each behavioural state and the                                 the deviance explained did not increase. Multicollinearity in
frequency of direction changes/hour were modeled as a function                             explanatory variables was tested (>0.7 was deemed multicollinear
of: trip type (swim-with-whale, whale watching), whale group                               per González-Suárez et al. (2013), and if present, the term with
size (excluding groups with calves), average distance between the                          the least support for inclusion in the final model, based on the
whale(s) and the vessel over the encounter, and year.                                      model selection criteria listed above, was dropped.
   All models were fitted using penalized regression splines                                  Model fit was evaluated through visual inspection of residual
(Wood and Augustin, 2002) with default smoothing values                                    plots and diagnostic information produced using the gam.check
(10 knots) in each spline and smoothing parameters estimated                               function (Wood, 2001). Models were checked for overdispersion
using generalised cross validation (GCV) score. To account for                             and autocorrelation to ensure modelling assumptions were met.
overdispersion, a quasibinomial family with a logit link was                               Only models with significant relationships between response and
selected for models investigating the proportion of time spent in                          explanatory variables are presented graphically in the subsequent
each behavioural state, and a quasipoisson family with a log link                          results and included for discussion.
was applied for modelling frequency of direction changes/hour.
This approach introduces a dispersion parameter, (φ), into the
model which describes additional variance in the data that cannot                          RESULTS
be explained by a binomial or poisson distribution alone.
   Model selection procedures followed Wood (2001), where a                                Summary Statistics for
fully saturated model was initially fit for each response variable                         Swim-With-Whale and Whale Watch
including interaction terms, and a final model was selected based                          Tours
on the GCV score and percent of deviance explained. The most                               Over the course of three field seasons, from 2018 to 2020,
parsimonious model was selected by decreasing the GCV score                                data were recorded during 75 swim-with-whale tours (=250 h)
and increasing the deviance explained. With the exception of                               and 48 whale watch tours onboard the tour vessel (=150 h).
categorical variables, all continuous terms were initially fit with                        A total of 324 humpback whale groups were observed across
a smoother. Terms were tested for and removed if there were                                both tour types, of which 127 groups (42 from swim-with-whale
(1) non-significant linear terms with a parameter coefficient                              tours, 85 from whale watch tours) had a minimum observation
near 0; or (2) non-significant smoothed terms with estimated                               time of ≥15 min and were used in subsequent analysis. The
degrees of freedom (edf) close to 1. Smoother terms were retained                          mean duration of time for observations during whale watch
for interactions between a categorical variable and continuous                             tours was 29 min (SD ± 12), and for swim-with-whale tours
variable when at least one level of the interaction term met                               was 28 min (SD ± 16) before, 26 min (SD ± 13) during, and
the criteria listed above. This allowed for the evaluation of the                          28 min (SD ± 17) after. Whale group sizes ranged from one
significant non-linear levels of the interaction term, despite some                        to six whales, with a median of two (SD ± 0.98) across both
levels having an edf = 1 (Nisbet et al., 2018). The linear form                            swim-with-whale tours and whale watch tours. There were 209

Frontiers in Marine Science | www.frontiersin.org                                      7                                         August 2021 | Volume 8 | Article 696136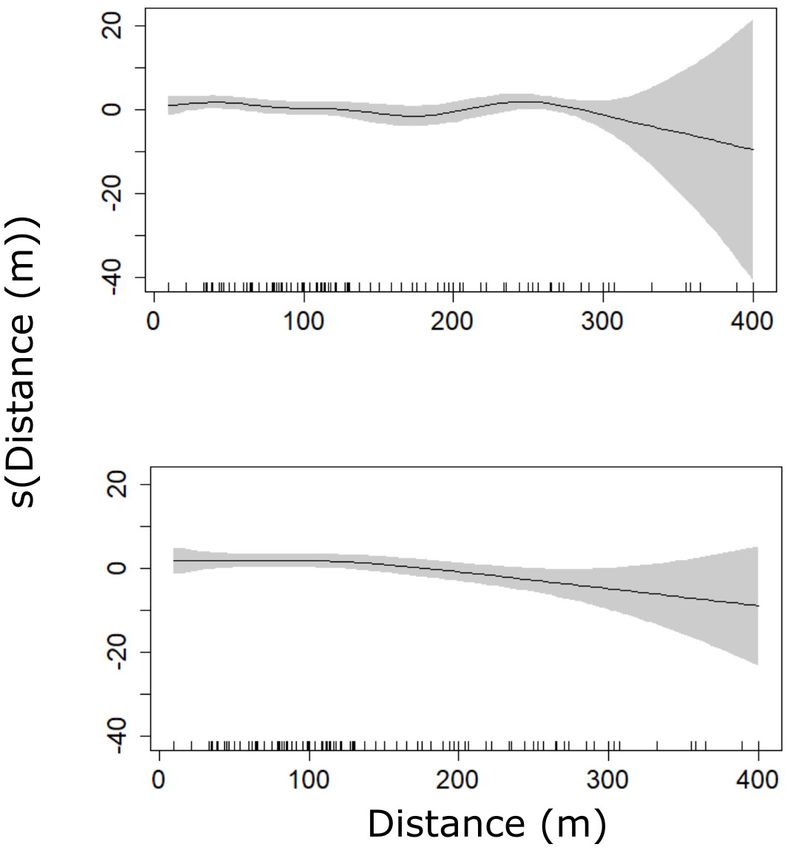
Stack et al. Swim-With-Whale Tourism Impacts
during < 0.001, after 0.015; Figure 2A), with an increase in
frequency of heading changes as the distance between the
vessel and whale(s) decreased in the during and after phases
(Table 2 and Figures 2B,C). The frequency of direction
changes/hour in the before phase varied with distance
(Figure 2A) and was lowest when the vessel was 250 m
from the whale group.
Surface activity was observed in 60% (25 of 42) of groups in
the before, during, and after observations. The best fit model for
the proportion of time that whale groups spent being surface
active explained 10.2% of the deviance and included a term for
year (Table 2). Surface activity was found to be significantly
lower in 2020 (p-value = 0.007) relative to other years (Table 2).
The phase, group size and distance from the vessel did not
have a significant effect on the proportion of time spent surface
active (Table 2).
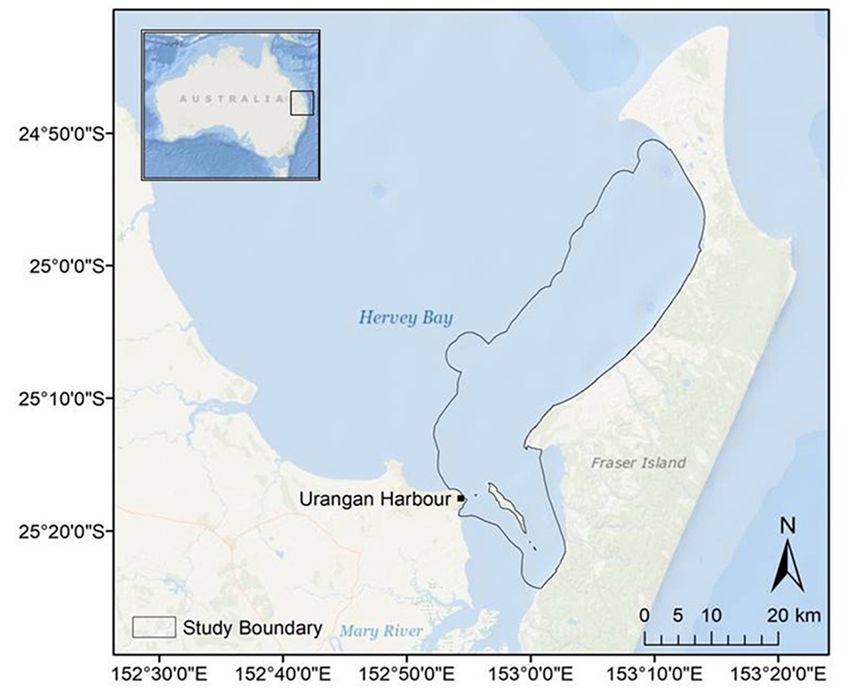
Resting behaviour was observed in 24% (10 of 42) of groups
in the before, during, and after observations. The best fit model
explaining the proportion of time spent resting within swim-
with-whale tours explained 25% of the deviance and included
the interaction term between phase and distance between whale
groups and vessel (Table 2). The proportion of time resting varied
with distance throughout swim-with-whale tours (Figures 3A–C)
and significantly decreased (p-value = 0.048) with distance after
the vessel left (Figure 3C). The year, phase, and group size
FIGURE 2 | Results from the best fit generalized additive model for the did not have a significant effect on the proportion of time
frequency of direction changes/hour made by humpback whales [Freq. Direct. resting (Table 2).
Chang. = β0 + s(phase:distance) + Error] showing model parameter estimates Diving was observed in 90% (38 of 42) of groups in the
for the interaction between distance from the whale and phase type before, during, and after observations. The best fit model for the
(A) before, (B) during, and (C) after. The dashed lines and shaded area
represent the 95% confidence intervals of the parameter estimate. The vertical
proportion of time diving included terms for group size and the
lines represent the data points combined for before, during, and after phases interaction term between phase and distance between whale and
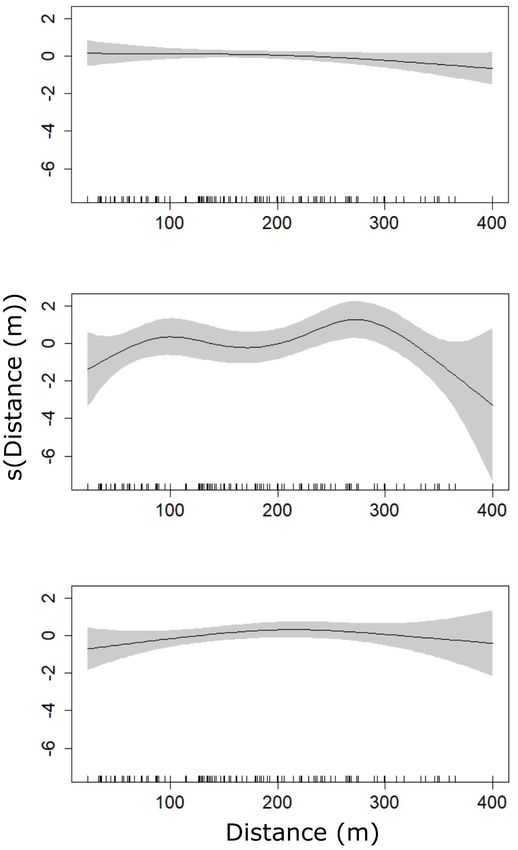
(rug-plot). vessel, which explained 20% of the deviance (Table 2). Group
size had a significant effect on the proportion of time diving
(p-value = 0.014); as group size increased, the proportion of time
individual whales photographed during swim-with-whale tours diving decreased (Table 2). The proportion of time diving varied
of which none were re-sighted during swim-with-whale tours with distance throughout swim-with-whale tours (Figures 4A–C)
within each field season. and was most variable during swim-with-whale tours however
there was an equal chance of diving (Figure 4B). Phase, year, and
Comparison Among Phases (Before, distance from the vessel did not have a significant effect on the
During, After) Within Swim-With-Whale proportion of time spent diving (Table 2).
Tours Socialising was observed in 38% (16 of 42) of groups in
The frequency of direction changes/hour and the proportion the before, during, and after observations. The best fit model
of time spent resting, diving, and travelling were found to be explaining the proportion of time socialising within swim-with-
significantly impacted by the interaction between phase (before, whale tours included a term for year, and explained 9% deviance
during, and after) and distance from whale to vessel (Table 2). (Table 2). The time spent socialising varied significantly between
There were no detectable changes in the proportion of time spent years (p-value = 0.025), while phase, group size, and distance
socialising or being surface active among phases of swim-with- from the vessel did not have a significant effect (Table 2).
whale tours (Table 2). Travelling was observed in 33% (14 of 42) of groups in
Direction changes were observed in 71% (30 of 42) of the before, during, and after observations. The best fit model
groups in the before, during, and after observations. The best explaining the proportion of time spent travelling within swim-
fit model explaining the frequency of direction changes/hour with-whale tours explained 10% of the deviance and included
observed within swim-with-whale tours explained 56.0% the interaction term between phase and distance between whale
of the deviance and included the interaction term between and vessel (Figure 5 and Table 2). The proportion of time spent
phase and distance between whale and vessel (Table 2). The travelling varied significantly with distance during swim-with-
frequency of direction changes/hour varied significantly whale tours (p-value = 0.007), with whales travelling more when
with distance for all phases (p-value = before < 0.001, vessels remained further away (Figure 5B). The phase, year,
Frontiers in Marine Science | www.frontiersin.org 8 August 2021 | Volume 8 | Article 696136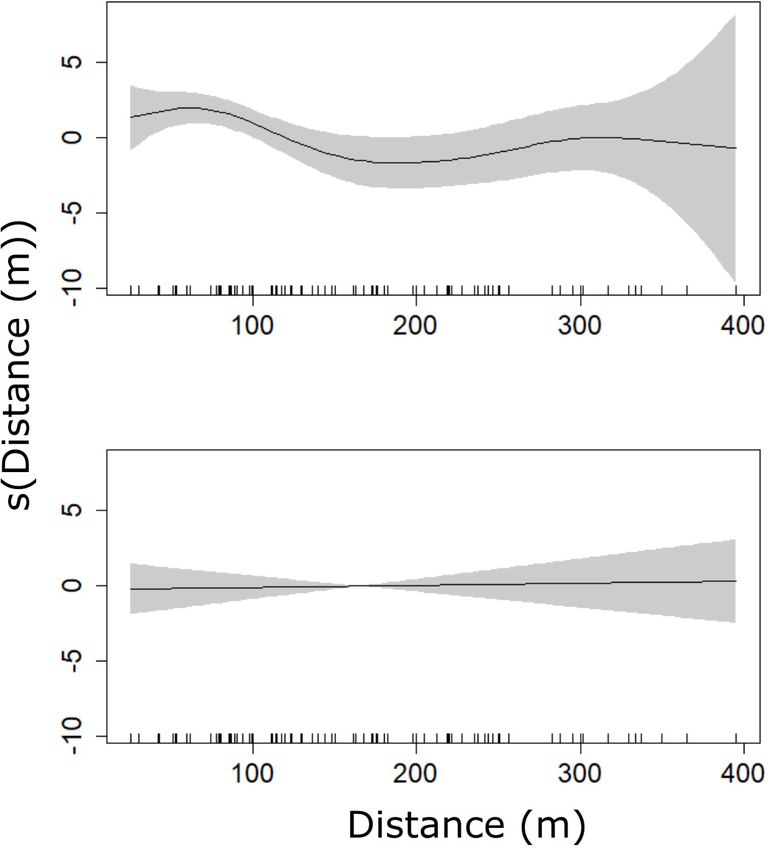
Stack et al.                                                                                                                         Swim-With-Whale Tourism Impacts

                                                                                        FIGURE 4 | Results from the best fit generalised additive model for the
  FIGURE 3 | Results from the best fit generalised additive model for the               proportion of time humpback whales spent diving [Prop. Div. = β0 + group
  proportion of time humpback whales spent resting [Prop.                               size + s(phase:distance) + Error] showing model parameter estimates for the
  Rest. = β0 + s(phase:distance) + Error] showing model parameter estimates             interaction between distance from the whale and phase type (A) before,
  for the interaction between distance from the whale and phase type (A) before         (B) during, and (C) after. The dashed lines and shaded area represent the
  (note beyond 300 m there are fewer data points thus the confidence intervals          95% confidence intervals of the parameter estimate. The solid horizontal lines
  are larger and interpretation beyond 300 m is cautioned), (B) during, and             represent the mean. The vertical lines represent the data points combined for
  (C) after (linear). The shaded area represents the 95% confidence intervals of        before, during, and after phases (rug-plot).
  the parameter estimate. The vertical lines represent the data points combined
  for before, during, and after phases (rug-plot).

                                                                                       active, diving, or socialising were detected between whale watch
group size, and distance from the vessel did not have a significant                    and swim-with-whale tours (Table 3).
effect on the proportion of time spent travelling (Table 2).                              Whale direction changes were observed in 70 whale groups,
                                                                                       with 94 occurrences during whale watch tours and 121
                                                                                       occurrences during swim-with-whale tours. The best fit model
Comparison Between Whale Watch and                                                     explained 49.2% of the deviance and included terms for year and
Swim-With-Whale Tours                                                                  the interaction between tour type and distance between whale(s)
The average distance between whale groups and the vessel during                        and vessel (Table 3). The frequency of direction changes/hour
whale watch tours was 157 m (SD = 98, range = 12–400 m,                                decreased with distance for both tour types (Figures 6A,B), and
n = 85). The distance between whales and the vessel in the during                      was found to be significant (p-value = 0.028) for whale watch
phase of swim-with-whale tours averaged 212 m (SD = 188,                               tours (Figure 6A). The frequency of direction changes/hour was
range = 5–400 m, n = 42). Within swim-with-whale tours, the                            found to be significantly lower in 2020 (p-value = 0.013) relative
distance between whale groups and the vessel was on average                            to 2018 and 2019 (Table 3).
160 m (SD = 92 m, range = 5–400 m, n = 42) before, 212 m                                  Surface active behaviours were recorded in 61% (52 of 85) of
(SD = 115, range = 5–400 m, n = 42) during, and 170 m                                  groups observed from whale watch tours and 21% (9 of 42) of
(SD = 105 m, range = 3.5–400 m, n = 42) after approaches.                              groups during swim-with-whale tours. There was no detectable
Results from the best fit GAMs found the frequency of direction                        difference in the mean proportion of time spent conducting
changes/hour as well as the proportion of time spent resting and                       surface active behaviours between tour types (Z-test for two
travelling were significantly impacted by the interaction between                      proportions: Z = 2.58, p = 0.108). The best fit model for the
tour type and distance from whale groups to vessel (Table 3). No                       proportion of time that whale groups spent being surface active
detectable changes in the proportion of time spent being surface                       explained 23.8% of the deviance and included terms for tour

Frontiers in Marine Science | www.frontiersin.org                                  9                                           August 2021 | Volume 8 | Article 696136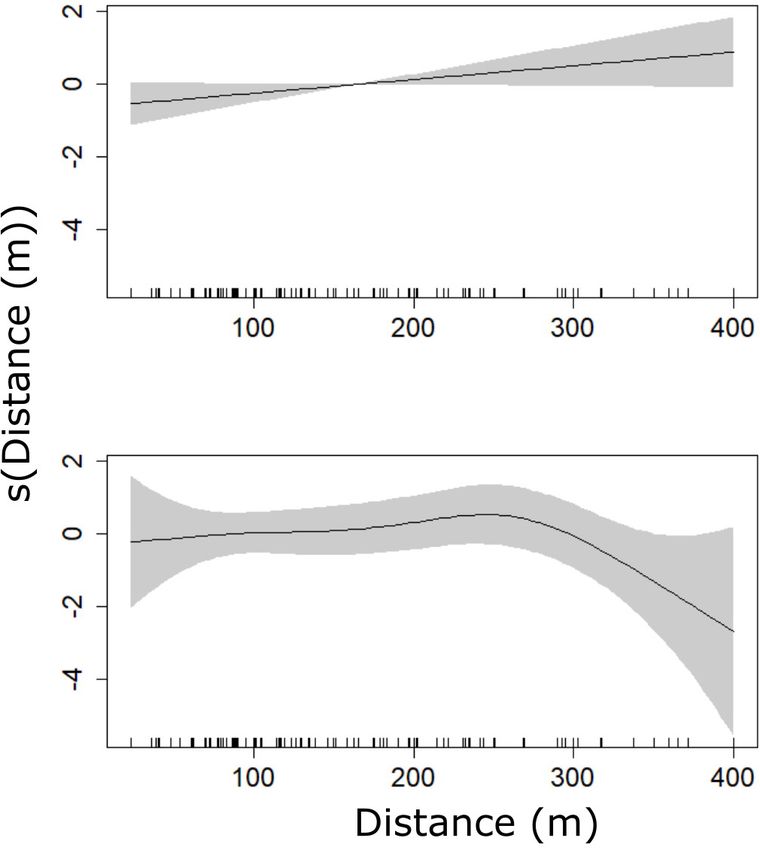
Stack et al.                                                                                                                             Swim-With-Whale Tourism Impacts

                                                                                             type, year, and the interaction between tour type and distance
                                                                                             between whale(s) and vessel (Table 3 and Figures 7A–C). During
                                                                                             swim-with-whale tours, the amount of time spent surface active
                                                                                             decreased when compared to whale watch tours (p-value = 0.09,
                                                                                             Table 3 and Figure 7A). On whale watch tours, surface activity
                                                                                             increased as vessel distance from the whale group increased
                                                                                             (p-value = 0.065; Figure 7B). The proportion of time conducting

  FIGURE 5 | Results from the best fit generalised additive model for the                     FIGURE 6 | Results from the best fit generalized additive model for the
  proportion of time humpback whales spent travelling [Prop.                                  frequency of direction changes/hour made by humpback whales [Freq. Direct.
  Travel. = β0 + s(phase:distance) + Error] showing model parameter estimates                 Chang. = β0 + year + s(tour type:distance) + Error] showing model parameter
  for the interaction between distance from the whale and phase type (A) before               estimates for the interaction between distance from the whale and tour type
  (linear), (B) during (linear), and (C) after. The dashed horizontal lines represent         for (A) whale watch and (B) swim-with-whale tours. Note beyond 300 m there
  the 95% confidence intervals of the parameter estimate. The solid horizontal                are fewer data points thus the confidence intervals are larger and
  lines represent the mean. The vertical lines represent the data points                      interpretation beyond 300 m is cautioned. The dashed horizontal lines
  combined for before, during, and after phases (rug-plot).                                   represent the 95% confidence intervals of the parameter estimate. The solid
                                                                                              horizontal lines represent the mean. The vertical lines represent the data
                                                                                              points combined for whale watch and swim-with-whale tours (rug-plot).

TABLE 3 | Summary of top GAM models showing the relationship between the number of direction changes, and the proportion of time spent surface active, resting,
diving, socialising, and travelling during swim-with-whale tours and whale watch tours.

                                               Number of           Proportion of time          Proportion of      Proportion of        Proportion of       Proportion of
                                           direction changes         surface active            time resting        time diving       time socialising     time travelling

Intercept                                           0.83                  –0.96***                –4.02***            –0.79*              –3.90***            –1.58***
Year                                              –1.29*                  –1.52**                  0.98               –1.06**                –                   –
Group size                                           –                       –                       –                –0.43**             0.60***                –
Trip type                                            –                     –1.09                     –                   –                   –                   –
Distance between vessel and whale(s)                 –                       –                       –                   –                   –                   –
Interaction between distance to whale(s)         S(6.32)*                 s(3.45)                 s(4.12)*            s(1.00)                –                s(1.84)
and trip type (whale watch vessel)
Interaction between distance to whale(s)          S(2.40)                 s(1.00)                 s(1.00)             s(2.82)                –               s(1.00)**
and trip type (swim with vessel)
Deviance explained (%)                              49.2                   23.8                    27.2                25.6                15.4                11.6
Number of observations                              127                    127                     127                 127                 127                 127
Rows represent candidate explanatory variables and columns represent response variables for each of the six separate models. Cells with a “–” represent terms dropped
from the final model. Values represent the parametric coefficient estimates for factors and the degree of smoothing [s(EDF)] for smooth terms included in the final model.
The significance value is represented as ***p = 0–0.001; **p = 0.001–0.01; *p = 0.01–0.05.

Frontiers in Marine Science | www.frontiersin.org                                       10                                          August 2021 | Volume 8 | Article 696136
Stack et al. Swim-With-Whale Tourism Impacts FIGURE 7 | Results from the best fit generalised additive model for the proportion of time humpback whales spent surface active [Prop. Surf. Activ. = β0 + tour type + year + s(tour type:distance) + Error] showing model parameter estimates for (A) tour type and (B) distance between whale watch vessel and whale(s) (note < 100 m and >250 m there are fewer data points thus the confidence intervals are larger and interpretation is cautioned), and (C) distance between swim-with-whale vessel and whale(s) (linear; edf = 1). The dashed horizontal lines represent the 95% confidence intervals of the parameter estimate. The solid horizontal lines represent the mean. The vertical lines represent the data points combined for whale watch and swim-with-whale tours (rug-plot). surface active behaviours was found to be significantly lower in was significantly lower in 2020 (p-value = 0.002) relative to other 2020 (p-value = 0.005) relative to other years (Table 3). years (Table 3). Resting behaviour was recorded in 22% (19 of 85) of groups Socialising was recorded in 39% (33 of 85) of groups observed observed from whale watch tours and 12% (5 of 42) of groups from whale watch tours and 17% (7 of 42) of groups during during swim-with-whale tours. There was a 50% reduction in the swim-with-whale tours. The mean proportion of time spent proportion of time spent resting during swim-with-whale tours socialising was not significantly different during swim-with- compared to whale watch tours, with the proportion of time spent whale tours compared to whale watch tours (Z-test for two resting found to be significantly less during swim-with-whale proportions: Z = 0.262, p = 0.61). The best fit model for tours (Z-test for two proportions: Z = 4.287, p-value = 0.038). the proportion of time that whale groups spent socialising The best fit GAM model for the mean proportion of time resting explained 15.4% of the deviance and found a significant increase explained 27.2% of the deviance, and included terms for year (p-value < 0.0001) with increasing group size (Table 3). and the interaction term between tour type and distance between Travelling was recorded in 71% (60 of 85) of groups observed whale and vessel (Figures 8A,B and Table 3). The proportion of from whale watch tours and 26% (11 of 42) of groups during time resting was influenced significantly by distance of the whale swim-with-whale tours. No detectable difference was found watch vessel (p-value = 0.012; Table 3), with resting times ranging between the proportion of time spent travelling between tour from 0 to 92% of the encounter and lowest when distances were types (Z-test for two proportions: Z = 2.36, p = 0.13). The beyond 100 m (Figure 8A). best fit model for the proportion of time that whale groups Diving behaviour was recorded in 74% (63 of 85) of groups spent travelling explained 11.6% of the deviance and included observed from whale watch tours and 47% (20 of 42) of an interaction term between tour type and distance between groups during swim-with-whale tours. The proportion of time whale(s) and vessel (Table 3 and Figures 10A,B). During swim- spent diving was not significantly different during swim-with- with-whale tours, whales spent significantly more time travelling whale tours compared to whale watch tours (Z-test for two (p-value = 0.003) when vessels remained further away (Table 3 proportions: Z = 0.32, p = 0.57). The best fit model for the and Figure 10B). proportion of time that whale groups spent diving explained 25.6% of the deviance and included terms for year, group size, and the interaction between tour type and distance between the DISCUSSION whale(s) and vessel (Table 3). The proportion of time spent diving varied with distance between tour types (Table 3 and In this study, we examined short-term behavioural responses of Figure 9) however, was not significant (p-value = 0.07) for whale humpback whales to swim-with-whale tours on a resting ground watch tours. The proportion of time spent diving significantly in Hervey Bay. A before, during, and after study design was decreased with an increase in group size (p-value = 0.006), and implemented where the during phase constituted of swimmers Frontiers in Marine Science | www.frontiersin.org 11 August 2021 | Volume 8 | Article 696136
Stack et al.                                                                                                                        Swim-With-Whale Tourism Impacts

  FIGURE 8 | Results from the best fit generalised additive model for the               FIGURE 9 | Results from the best fit generalised additive model for the
  proportion of time humpback whales spent resting [Prop.                               proportion of time humpback whales spent diving [Prop.
  Rest. = β0 + year + s(tour type:distance) + Error] showing model parameter            Div. = β0 + year + group size + s(tour type:distance) + Error] showing model
  estimates for the interaction between distance from the whale and tour type           parameter estimates for the interaction between distance from the whale and
  for (A) whale watch (note beyond 300 m there are fewer data points thus the           tour type for (A) whale watch (linear; edf = 1) and (B) swim-with-whale tours
  confidence intervals are larger and interpretation beyond 300 m is cautioned)         (note beyond 350 m there are fewer data points thus the confidence intervals
  and (B) swim-with-whale tours (linear; edf = 1). The dashed horizontal lines          are larger and interpretation beyond 350 m is cautioned). The dashed
  represent the 95% confidence intervals of the parameter estimate. The solid           horizontal lines represent the 95% confidence intervals of the parameter
  horizontal lines represent the mean. The vertical lines represent the data            estimate. The solid horizontal lines represent the mean. The vertical lines
  points combined for whale watch and swim-with-whale tours (rug-plot).                 represent the data points combined for whale watch and swim-with-whale
                                                                                        tours (rug-plot).

being placed in the water holding a mermaid line. Additionally,
humpback whale behaviours in the during phase of swim-with-                            but the low proportion of time spent resting overall is of concern
whale tours were compared to behaviours exhibited during                               and should be investigated further.
traditional boat-based whale watch tours. Within the swim-                                 It is unclear if the presence of the swimmers is the factor that
with-whale tours, behavioural changes were detected in the                             the whales are responding to and/or to the closer distance of the
before, during, and after phases, with the majority of significant                     vessel. One caveat to this study is that the experimental design
changes occurring in the during and after phases. Whales                               did not allow for data collection on humpback whale behaviour
also exhibited a higher frequency of direction changes and a                           in the absence of boat-based tourism (i.e., control data), therefore
50% reduction in resting during swim-with tours compared                               behavioural changes could not be declared different from their
to whale watch tours, demonstrating clear differences in the                           natural behaviour, and should not be definitively attributed to
behavioural responses to the two tour types. These results                             boat approaches and/or swimmer placement. Some additional
support the conclusion that the natural behaviour of humpback                          factors to consider when evaluating swim-with-whale impacts
whales in Hervey Bay was altered in response to swim-with-                             include the type of vessel approach, the sound level of the
whale tourism.                                                                         engine(s), the group composition and reproductive status of
    Comparison between tour types (swim-with-whale and whale                           the whales, and the geographic location (i.e., calving ground,
watch) demonstrated that the behavioural changes in the whales                         migration route, feeding ground). In this study, we used the
were largely related to the distance between whale(s) and the                          same vessel platform and captains in order to minimise these
vessel, with an interaction term between tour type and distance to                     differences and replicate the tour types as closely as possible.
whale present in five of the six models investigated. The average                          Our findings add to the growing body of literature that
vessel distance in the during phase of swim-with-whale tours was                       show impacts on whale behaviour arising from commercial
212 m and during whale watch tours was 157 m. Given that                               swim-with-whale tourism (e.g., Lundquist et al., 2013;
this area has been described as a resting ground, resting is the                       Fiori et al., 2019; Hoarau et al., 2020; Sprogis et al., 2020).
predominant behaviour that is expected however the proportion                          Here, we offer a comparison of how whale behavioural responses
of time spent resting during both tour types was low (6% of time                       to swim-with-whale tours differ from those observed during
during whale watch tours and 3% during swim-with-whale tours).                         traditional boat-based whale watch tours. There are several
These results suggest that humpback whales were more disturbed                         short-term behavioural responses reported on whales from the
during swim-with-whale tours than during whale watch tours,                            swim-with tourism industry (reviewed in Machernis et al., 2018),

Frontiers in Marine Science | www.frontiersin.org                                 12                                           August 2021 | Volume 8 | Article 696136
Stack et al. Swim-With-Whale Tourism Impacts
is a mid-migratory stopover where a portion of the population
segment diverts and spends time during the southern migration,
after departing the breeding grounds (Franklin et al., 2011;
Stack et al., 2019). Humpback whales use Hervey Bay to rest,
socialise, and nurse their calves prior to their migration to
their Antarctic feeding grounds. Adult whales may also use
this region for mating opportunities based on observations
of competition pods (Bryden et al., 1989; Corkeron, 1995).
Given this, it is unsurprising that the behavioural changes
observed differed to those reported in other studies that examined
behavioural responses to swim-with-whales tourism (Lundquist
et al., 2013; Fiori et al., 2019; Sprogis et al., 2020). Furthermore,
demonstrating any kind of vertical avoidance would be difficult
in this environment given the low depth profile of Hervey Bay.
In Hervey Bay, placing swimmers in the water with a
humpback whale calf is not permitted. This decision is based
on the Marine Park Act 2004, where it is specified “there
is no swimming with whales at any time where a calf has
been identified” (Marine Parks Act 2004, 2017). This decision
is in alignment with the International Whaling Commission
FIGURE 10 | Results from the best fit generalised additive model for the (International Whaling Commission, 2014) and Australian
proportion of time humpback whales spent travelling [Prop. National Guidelines (Department of the Environment and
Travel. = β0 + s(tour type:distance) + Error] showing model parameter Energy, 2017), which do not endorse swimming with mother
estimates for the interaction between distance from the whale and tour type
for (A) whale watch (note < 100 m and > 250 m there are fewer data points
and calves. Accordingly, no swimming with calves was observed
thus the confidence intervals are larger and interpretation is cautioned) and (B) by researchers in Hervey Bay during this study. This is,
swim-with-whale tours (linear; edf = 1). The dashed horizontal lines represent however, not the case in other locations in Australia (e.g.,
the 95% confidence intervals of the parameter estimate. The solid horizontal Sprogis et al., 2020), and around the world (e.g., Fiori et al.,
lines represent the mean. The vertical lines represent the data points
2019), where swimming with calves occurs, even in areas
combined for whale watch and swim-with-whale tours (rug-plot).
where it has been advised against. It is of great importance
to limit disturbance on mother-calf pairs as they are the
most sensitive to disturbance (Sprogis et al., 2020) and, over
including an increase in surface active behaviours, respiration extended periods of time, increases in energy expenditure could
rate and swim speed, and a less direct path of travel (Kessler become biologically significant for mothers with a dependent calf
et al., 2013; Fiori et al., 2019, 2020; Hoarau et al., 2020; Sprogis (Cartwright and Sullivan, 2009; Ejrnæs and Sprogis, 2021). Thus,
et al., 2020). Changes in the amount of time spent resting and in Hervey Bay it is of importance to retain best practice guidelines
travelling have been described as a direct sign of disturbance, but on not swimming with calves to reduce disturbance to the whales,
changing direction has also been noted as a tactic for humpback but also to avoid injury to humans from high-risk situations with
whales to avoid predators and evade a perceived threat (Schaffar mother and calves (as documented in Sprogis et al., 2017, 2020;
et al., 2013). The results in Hervey Bay are different to previous Fiori et al., 2019; Barra et al., 2020; Hoarau et al., 2020).
studies for resting, travelling, and surface active behaviours,
but still show an alteration in behaviour is occurring during
swim-with-whale tours. Previous research has shown that Management Recommendations
behavioural changes can be energetically costly for whales If the swim-with industry was to grow in areas where swimming
(e.g., Lusseau and Bejder, 2007; Braithwaite et al., 2015; with whales is not yet permitted, we recommend a precautionary
Villagra et al., 2021), therefore the observed high frequency approach to developing this activity. Resource managers should
of direction changes may mean that humpback whales in Hervey assume that disturbance is taking place unless it can be proven
Bay are experiencing an increase in their energy expenditure in otherwise. The results of this study demonstrate that, when
response to swim-with-whale tours. Further research is needed to following all legal regulations and the Code of Conduct, swim-
quantify these energetic impacts and if long-term consequences with-whale tourism causes humpback whales to change their
are apparent. The responses observed to swim-with-whale tours behaviour and is generally more invasive than traditional boat-
may not only require additional energetic costs, but also indicate based whale watching. Developing a Code of Conduct among
an increased level of physiological disturbance that could operators is an admirable step, however, the existence of
interfere with normal whale behaviour (Schaffar et al., 2013; guidelines alone is not sufficient at mitigating the potential
Fiori et al., 2019). for disturbance (Wiley et al., 2008). It is recommended that
Our results highlight the importance of studying the impacts guidelines be accompanied by annual trainings with permit
of swim-with-whale tourism in each region where it is offered, holders and a commitment to review and refresh the guidelines
because the effects on the target animals likely differ for each at a particular interval of time and/or when new information
species, population segment, and geographic area. Hervey Bay becomes available. In addition to education about the guidelines,
Frontiers in Marine Science | www.frontiersin.org 13 August 2021 | Volume 8 | Article 696136You can also read