Blue whale (Balaenoptera musculus musculus) genome: population structure and history in the North Atlantic - Authorea

Page created by Tyler Smith
 
CONTINUE READING
Blue whale (Balaenoptera musculus musculus) genome: population structure and history in the North Atlantic - Authorea
Posted on Authorea 14 Apr 2021 — The copyright holder is the author/funder. All rights reserved. No reuse without permission. — https://doi.org/10.22541/au.161842590.09830459/v1 — This a preprint and has not been peer reviewed. Data may be preliminary.

                                                                                                                                                                                                                                                               Blue whale (Balaenoptera musculus musculus) genome: population
                                                                                                                                                                                                                                                               structure and history in the North Atlantic
                                                                                                                                                                                                                                                               Sushma Jossey1 , Oliver Haddrath1 , Livia Loureiro2 , Burton Lim1 , Jacqueline Miller3 , Si
                                                                                                                                                                                                                                                               Lok2 , Stephen Scherer2 , Anders Goksoyr4 , Roger Lille-Langøy4 , K Kovacs5 , Christian
                                                                                                                                                                                                                                                               Lydersen5 , Heli Routti5 , and Mark Engstrom1
                                                                                                                                                                                                                                                               1
                                                                                                                                                                                                                                                                 Royal Ontario Museum
                                                                                                                                                                                                                                                               2
                                                                                                                                                                                                                                                                 The Hospital for Sick Children
                                                                                                                                                                                                                                                               3
                                                                                                                                                                                                                                                                 Royal Ontario Museum Department of Natural History
                                                                                                                                                                                                                                                               4
                                                                                                                                                                                                                                                                 University of Bergen
                                                                                                                                                                                                                                                               5
                                                                                                                                                                                                                                                                 Norwegian Polar Institute

                                                                                                                                                                                                                                                               April 14, 2021

                                                                                                                                                                                                                                                               Abstract
                                                                                                                                                                                                                                                               Knowledge of genetic diversity and structure is essential for developing conservation strategies for endangered species. The
                                                                                                                                                                                                                                                               advances in museum genomics can assist in better understanding the effects of over-hunting on the genome by comparing
                                                                                                                                                                                                                                                               historical to present-day samples. Blue whales were hunted to the point of near extinction in the mid-twentieth century.
                                                                                                                                                                                                                                                               Herein, we use whole genome sequencing to elucidate the poorly understood population structure of North Atlantic (NA) blue
                                                                                                                                                                                                                                                               whales (Balaenoptera musculus musculus). We generated a de novo genome assembly of 2.49 Mbp for a NA blue whale (N50
                                                                                                                                                                                                                                                               of 1.46 Mb) to analyze 19 whole genomic sequences and 28 complete mitochondrial genomes. We included present-day and
                                                                                                                                                                                                                                                               historical samples (earliest from 1900) from the Atlantic and Antarctica to understand the impact of whaling on the genetic
                                                                                                                                                                                                                                                               diversity. We found low population structuring, but high genetic diversity, suggesting a single, panmictic population in the
                                                                                                                                                                                                                                                               NA. We identified gene flow from fin whale to blue whales, accounting for ˜3.5% of the genome. Introgression between blue
                                                                                                                                                                                                                                                               and fin whales was observed in all the present-day samples but were lacking in some whales sampled early in the 20th century,
                                                                                                                                                                                                                                                               which suggests increasing disruption in mate choice concomitant with decline in blue whale population. We also assembled and
                                                                                                                                                                                                                                                               analyzed the transcriptome and revealed positive selection of oncogenes, which may be involved in reduced cancer rates in this
                                                                                                                                                                                                                                                               largest of mammals ever known. Our sequencing and population structuring studies provide a genomic framework to guide
                                                                                                                                                                                                                                                               ongoing conservation strategies for this iconic species.

                                                                                                                                                                                                                                                               1 INTRODUCTION
                                                                                                                                                                                                                                                               Many wildlife populations are currently under threat from climate change, pollution, loss of habitat and in
                                                                                                                                                                                                                                                               some cases exploitation. Genomic approaches in non-model organisms are becoming an important tool to
                                                                                                                                                                                                                                                               study population structure and history that can help protect endangered species (Hohenlohe et al., 2020).
                                                                                                                                                                                                                                                               The analysis of whole genomes can help provide detailed information on demographic changes, genetic
                                                                                                                                                                                                                                                               diversity, detection of introgression in organisms (Miller et al., 2012) and the population structure in species
                                                                                                                                                                                                                                                               with wide ranges (Foote et al., 2019; Sinding et al., 2018). These genomic tools are also ideal to develop an
                                                                                                                                                                                                                                                               understanding of global population histories in whales with limited barriers to movement across the oceans
                                                                                                                                                                                                                                                               (Foote et al., 2019). Temporal sampling of genomic data from historical specimens held in museum collections
                                                                                                                                                                                                                                                               can provide valuable baselines to accurately quantify genetic threats and can help decipher genomic changes
                                                                                                                                                                                                                                                               in endangered species (Dı́ez-del-Molino et al., 2018; Ewart et al., 2019; Mikheyev, Tin, Arora, & Seeley.,
                                                                                                                                                                                                                                                               2015). Advances in genomic approaches can moreover help identify genes that affect the fitness of a species

                                                                                                                                                                                                                                                                                                                             1
Blue whale (Balaenoptera musculus musculus) genome: population structure and history in the North Atlantic - Authorea
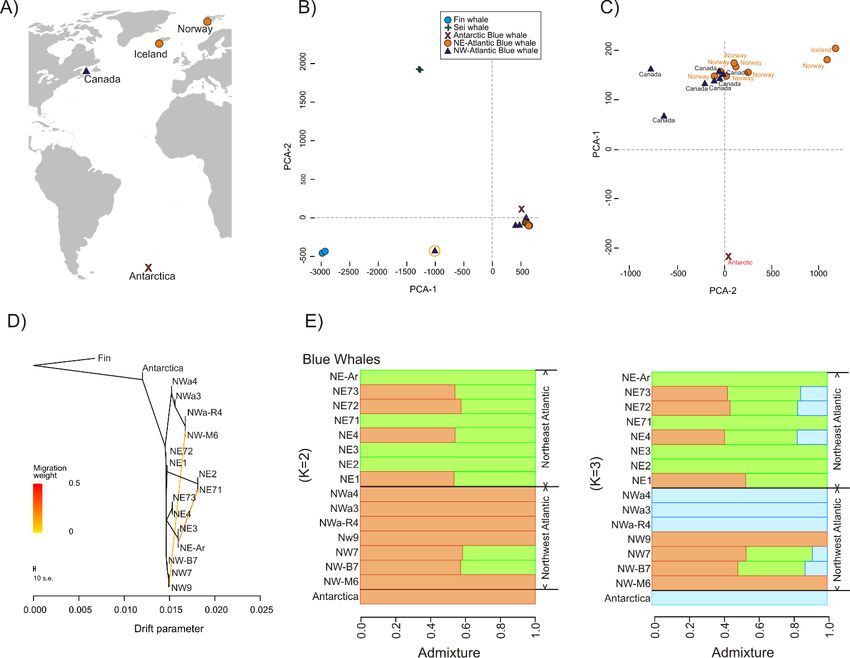
in relation to anthropogenic threats (Meyer et al., 2018).
Posted on Authorea 14 Apr 2021 — The copyright holder is the author/funder. All rights reserved. No reuse without permission. — https://doi.org/10.22541/au.161842590.09830459/v1 — This a preprint and has not been peer reviewed. Data may be preliminary.

                                                                                                                                                                                                                                                               The blue whale (Balaenoptera musculus musculus ) is the largest animal that has ever lived, with individuals
                                                                                                                                                                                                                                                               reaching 30 m in length and weighing up to 150 tonnes (Sears & Perrin, 2018). Blue whales are found in
                                                                                                                                                                                                                                                               oceans across the globe, but were historically most abundant in the Southern Ocean (Sears & Perrin, 2018).
                                                                                                                                                                                                                                                               Commercial hunting of these whales started in the North Atlantic (NA) in 1860 and spread to all other oceans
                                                                                                                                                                                                                                                               (Thomas et al., 2016). The large size of blue whales made them a prime target for the commercial whaling
                                                                                                                                                                                                                                                               industry during the 20th century and they were hunted to the brink of extinction with an estimated 379,185
                                                                                                                                                                                                                                                               whales taken globally (Rocha et al., 2014). Whether blue whales in the NA represent a single population or
                                                                                                                                                                                                                                                               two distinct populations, separated between the west and east is unresolved (Lesage et al., 2016; McDonald
                                                                                                                                                                                                                                                               et al., 2006). The Northwest Atlantic (NWA) has a lower number of blue whales, with some 250 adults
                                                                                                                                                                                                                                                               (COSEWIC, 2012. ), whereas in the Northeast Atlantic (NEA) there are ˜3000 individuals (Pike et al., 2019).
                                                                                                                                                                                                                                                               The movement patterns of blue whales in the NA and the location(s) of their wintering sites and breeding
                                                                                                                                                                                                                                                               areas are still elusive (Lesage et al., 2017). The blue whales’ distribution in the NWA, based on sightings
                                                                                                                                                                                                                                                               and photo-identification studies, ranges from the mid Atlantic westward to the Davis Strait and west coast
                                                                                                                                                                                                                                                               of Greenland in the north and southward along the eastern coasts of Canada and USA (COSEWIC, 2012;
                                                                                                                                                                                                                                                               Lesage et al., 2017). In the NEA, blue whale sightings occur from Svalbard, Norway (Storrie et al. 2018)
                                                                                                                                                                                                                                                               in the north to the Azores in the south, with rare sightings off Mauritania (Pike et al. 2019). Vocalization
                                                                                                                                                                                                                                                               records indicate the presence of blue whales near the Mid-Atlantic Ridge in winter (Nieukirket al., 2004),
                                                                                                                                                                                                                                                               but it is not known whether these animals are from the NEA or NWA. The small number of NA blue whales
                                                                                                                                                                                                                                                               that have been followed using satellite tracking show no evidence of east-west movements across the North
                                                                                                                                                                                                                                                               Atlantic (Lesage et al., 2017; Silva et al., 2013). Comparison of blue whale photo-identifications taken near
                                                                                                                                                                                                                                                               Iceland and the Azores (NEA) to NWA blue whales also suggests two distinct populations in the Northwest
                                                                                                                                                                                                                                                               and Northeast (Lesage et al., 2017; Ramp & Sears, 2013). However, blue whale songs recorded from the NEA
                                                                                                                                                                                                                                                               and NWA are similar to each other and distinct from blue whales in other oceans, suggesting that the NA
                                                                                                                                                                                                                                                               may represent a single population (McDonald et al., 2006).
                                                                                                                                                                                                                                                               Blue whale bones exposed to the elements have been used to extract mitochondrial DNA (Tebbutt et al.,
                                                                                                                                                                                                                                                               2000) and the potential for historical blue whale bone samples t can help decipher population structure
                                                                                                                                                                                                                                                               (Rosenbaum et al., 1997), as well as to study changes in the genome, from changes in levels of heterozygosity
                                                                                                                                                                                                                                                               to interspecific hybridization among other things. Purported blue whale/fin whale hybrids were reported by
                                                                                                                                                                                                                                                               early whalers from the coast of Norway, Gulf of Alaska, Icelandic waters and the coast of Spain (Pampoulie
                                                                                                                                                                                                                                                               et al., 2020). In the last few decades, the identification of hybrids has been conclusively demonstrated using
                                                                                                                                                                                                                                                               molecular evidence (Pampoulie et al., 2020). But it is not clear if this hybridization has led to significant
                                                                                                                                                                                                                                                               gene flow between the two species (Westbury et al., 2019). Significant levels of gene flow from fin whales
                                                                                                                                                                                                                                                               (population size >80,000, Pampoulie et al., 2020) to blue whales could represent a threat to the maintenance
                                                                                                                                                                                                                                                               of a genetically distinct NA population(s) of blue whales.
                                                                                                                                                                                                                                                               In the NA, blue whales are classified as being Endangered in Europe (IUCN Red List, Pampoulie et al.,
                                                                                                                                                                                                                                                               2020) and in North America they are listed under the Canadian Species at Risk Act and the US Endangered
                                                                                                                                                                                                                                                               Species Act (Lesage et al., 2017). Blue whales are threatened by ship strikes, fishing gear entanglement,
                                                                                                                                                                                                                                                               marine pollutants and the impacts of climate change (COSEWIC, 2012). Knowledge of the genetic structure
                                                                                                                                                                                                                                                               and distribution of blue whales in the NA is essential for the protection of this vulnerable species. Challenges
                                                                                                                                                                                                                                                               to the study of movement of large marine mammals includes attaching instruments to these fast swimming
                                                                                                                                                                                                                                                               animals and retaining the tracking devices on the animals long enough to document seasonal patterns (Lesage
                                                                                                                                                                                                                                                               et al., 2017). This has left a gap in our understanding of NA blue whale population structuring. Therefore,
                                                                                                                                                                                                                                                               the principal goals of this study were to construct a highly accuratede novo assembly of a NWA blue whale
                                                                                                                                                                                                                                                               genome and to use it to study our unique collection of present-day and historical specimens to gain insights
                                                                                                                                                                                                                                                               into population structure, introgression, historic population size and dynamics of the world’s largest animal.
                                                                                                                                                                                                                                                               2 MATERIALS AND METHODS
                                                                                                                                                                                                                                                               2.1 Genome assembly and annotation

                                                                                                                                                                                                                                                                                                                      2
Blue whale (Balaenoptera musculus musculus) genome: population structure and history in the North Atlantic - Authorea
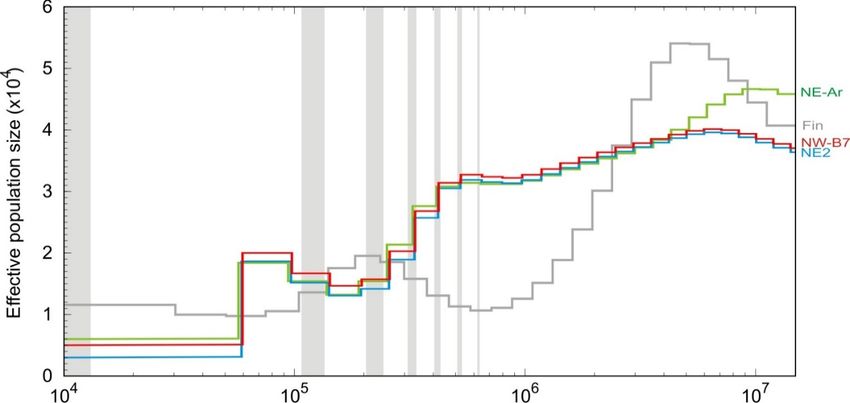
Muscle tissue for the genome assembly was collected by the Royal Ontario Museum (ROM), Toronto, ON,
Posted on Authorea 14 Apr 2021 — The copyright holder is the author/funder. All rights reserved. No reuse without permission. — https://doi.org/10.22541/au.161842590.09830459/v1 — This a preprint and has not been peer reviewed. Data may be preliminary.

                                                                                                                                                                                                                                                               with the approval of the Minister of Fisheries and Oceans, Canada (SARA permit ref: NLSAR-003-14) from
                                                                                                                                                                                                                                                               a female blue whale that died close to Newfoundland in 2014 (NW-M6, Fig. 1, Table 1). The Illumina
                                                                                                                                                                                                                                                               and Pacbio reads for the genome assembly were generated at The Centre for Applied Genomics (TCAG),
                                                                                                                                                                                                                                                               The Hospital for Sick Children, Toronto, Canada. The genome was assembled using the hybrid assembler
                                                                                                                                                                                                                                                               MASURCA v 3.2.8 (Koren et al., 2012; see Supplemental Information for more details).
                                                                                                                                                                                                                                                               RNA for the transcriptome assembly was collected from a skin biopsy of a blue whale sampled in the
                                                                                                                                                                                                                                                               Svalbard Archipelago (79°N), Norway (Fig. 1). The paired-end RNAseq data were generated using HiSeq
                                                                                                                                                                                                                                                               2500 at TCAG. The transcripts were assembled with TRINITY (Grabherr et al., 2011) and TOPHAT
                                                                                                                                                                                                                                                               (Trapnell et al., 2009) as elaborated in Supplemental Information. The masked genome was annotated using
                                                                                                                                                                                                                                                               the MAKER2 (Holt & Yandell, 2011) pipeline with the blue whale transcriptome, NCBI proteins for cow and
                                                                                                                                                                                                                                                               all cetaceans as explained in Supplemental Information. Functional annotations of the predicted genes were
                                                                                                                                                                                                                                                               done by BLASTp (Altschul et al., 1997) hits to UNIPROT (UniProt Consortium 2015) using an E-value of
                                                                                                                                                                                                                                                               20 (-q 20). The first and last two
                                                                                                                                                                                                                                                               bases of the merged reads were trimmed to remove DNA damage in historical bone samples. The paired-end
                                                                                                                                                                                                                                                               reads were aligned using BWA 0.7.17 (Li & Durbin, 2009) and variant discovery was conducted as described
                                                                                                                                                                                                                                                               in the Supplementary Information.

                                                                                                                                                                                                                                                                                                                      3
Posted on Authorea 14 Apr 2021 — The copyright holder is the author/funder. All rights reserved. No reuse without permission. — https://doi.org/10.22541/au.161842590.09830459/v1 — This a preprint and has not been peer reviewed. Data may be preliminary.

                                                                                                                                                                                                                                                               Fig. 1. A flow chart representing the genome assembly, transcriptome assembly, whole genome and complete
                                                                                                                                                                                                                                                               mitochondrial genome analysis of North Atlantic blue whales.
                                                                                                                                                                                                                                                               Table 1. Present day and historical museum blue whale samples with the average coverage (short reads)
                                                                                                                                                                                                                                                               compared to the repeat masked autosomal North Atlantic nuclear (N) or mitochondrial (M) genome.

                                                                                                                                                                                                                                                               Samples     Collection and Collection Number    Collection Locality         Collection Date   Gender       Coverage Nucl
                                                                                                                                                                                                                                                               NW-M6       ROMP ; ROMM125066                   Newfoundland, Canada        2014              Female       99X (N)
                                                                                                                                                                                                                                                               NW-B7       ROMP ; ROMM125065                   Newfoundland, Canada        2014              Female       33X (N); 71kX
                                                                                                                                                                                                                                                               NW7         ROMP ; MARS2017                     Newfoundland, Canada        2017              Female       19X (N); 45kX
                                                                                                                                                                                                                                                               NW9         ROMP ; MARS2019                     Nova Scotia, Canada         2019              Male         28X (N); 8.5kX
                                                                                                                                                                                                                                                               NWa-R4      ROMH ; 108281                       Magdalen Islands, Canada    1931              Unknown      3X (N); 390X(
                                                                                                                                                                                                                                                               NWa1        NMNHH ; USNM124326                  Newfoundland, Canada        1903              Male         32X(M)
                                                                                                                                                                                                                                                               NWa2        NMNH H ; USNMA49784                 Newfoundland, Canada        1903              Female       82X(M)
                                                                                                                                                                                                                                                               NWa3        NMNH H ; USNMA49785                 Newfoundland, Canada        1903              Unknown      5X (N); 956X(
                                                                                                                                                                                                                                                               NWa4        NMNH H ; USNMA49786                 Newfoundland, Canada        1903              Unknown      3X (N); 338X(
                                                                                                                                                                                                                                                               NWa5        NMNH H ; USNMA49787                 Newfoundland, Canada        1903              Male         2X (N) 1.4kX(
                                                                                                                                                                                                                                                               NWa6        NMNH H ; USNMA49788                 Newfoundland, Canada        1903              Male         0.5X (N) 1.4kX
                                                                                                                                                                                                                                                               NWa-CM1     CMNH ; CMNMA55059                   Newfoundland, Canada        1974              Unknown      3X (N) 60X(M
                                                                                                                                                                                                                                                               NWa-CM2     CMNH ; CMNMA55060                   Newfoundland, Canada        1975              Male         56X(M)
                                                                                                                                                                                                                                                               NWa-CM3     CMNH ; CMNMA56549                   Newfoundland, Canada        1966              Female       264X(M)
                                                                                                                                                                                                                                                               NE1         NPIP ; BM1401                       Svalbard, Norway            2014              Female       18X (N) 2.2kX
                                                                                                                                                                                                                                                               NE2         NPIP ; BM1602                       Svalbard, Norway            2016              Male         36X (N) 15.8k
                                                                                                                                                                                                                                                               NE3         NPIP ; BM1603                       Svalbard, Norway            2016              Male         19X (N) 2.2kX
                                                                                                                                                                                                                                                               NE4         NPIP ; BM1604                       Svalbard, Norway            2016              Female       21X (N) 13.9k
                                                                                                                                                                                                                                                               NE71        NPIP ; BM1701                       Svalbard, Norway            2017              Male         4X (N) 1.4kX(
                                                                                                                                                                                                                                                               NE72        NPIP ; BM1702                       Svalbard, Norway            2017              Female       18X (N) 2.8kX
                                                                                                                                                                                                                                                               NE73        NPIP ; BM1703                       Svalbard, Norway            2017              Male         19X (N) 2kX(
                                                                                                                                                                                                                                                               NE-Ar       SRR5665644P                         Iceland                                       Unknown      22X (N) 22kX
                                                                                                                                                                                                                                                               NEa-I2      SlMH ; TB2                          Iceland                     1900              Male         7.7X(M)
                                                                                                                                                                                                                                                               SAa1        WMH ; HS0171 (SF1)                  South Atlantic              1934/35           Unknown      475X(M)
                                                                                                                                                                                                                                                               Atla1       WMH ; HS.01102 (SF2)                Atlantic Ocean              pre-1917          Male         15X(M)
                                                                                                                                                                                                                                                               Antarctic   NMNHH ; USNM268731                  Antarctica                  1938              Female       6X (N) 219X(M

                                                                                                                                                                                                                                                                                                                  4
NW Northwest Atlantic
Posted on Authorea 14 Apr 2021 — The copyright holder is the author/funder. All rights reserved. No reuse without permission. — https://doi.org/10.22541/au.161842590.09830459/v1 — This a preprint and has not been peer reviewed. Data may be preliminary.

                                                                                                                                                                                                                                                               NE Northeast Atlantic
                                                                                                                                                                                                                                                               SA South Atlantic
                                                                                                                                                                                                                                                               P
                                                                                                                                                                                                                                                                   Present day sample from frozen tissues
                                                                                                                                                                                                                                                               H
                                                                                                                                                                                                                                                                   Historical sample from bone samples
                                                                                                                                                                                                                                                               ROM Royal Ontario Museum, Toronto, ON, CA.
                                                                                                                                                                                                                                                               NMNH Smithsonian National Museum of Natural History, Washington DC.
                                                                                                                                                                                                                                                               CMNMA Canadian Museum of Nature, Ottawa, ON.
                                                                                                                                                                                                                                                               NPI Norwegian Polar Institute, Tromsø, Norway
                                                                                                                                                                                                                                                               SlM Slottsfjells Museum, Tønsberg, Norway
                                                                                                                                                                                                                                                               WM The Whaling Museum, Sandefjord, Norway
                                                                                                                                                                                                                                                               2.4 Mitochondrial genome assembly
                                                                                                                                                                                                                                                               For the comparisons of the mitochondrial genomes of present-day and historical blue whales, the trimmed
                                                                                                                                                                                                                                                               and merged Illumina paired-end reads for all samples were aligned to a reference mitogenome (NC 00160136)
                                                                                                                                                                                                                                                               using BOWTIE2 2.3.3.1 (Langmead & Salzberg, 2012). This was done for 25 of the blue whales sequenced
                                                                                                                                                                                                                                                               herein (Table 1), including individuals for which DNA was too degraded for whole genome sequencing.
                                                                                                                                                                                                                                                               2.5 Population structure analysis
                                                                                                                                                                                                                                                               To study if blue whales in the NWA represent a separate population from the NEA, genomic population
                                                                                                                                                                                                                                                               structure analyses were conducted on present-day tissue samples of four NWA (NW-M6, NW-B7, NW7,
                                                                                                                                                                                                                                                               NW9) and eight NEA (NE1, NE2, NE3, NE4, NE71, NE72, NE73, NE-Ar) blue whales. One sample (NW-
                                                                                                                                                                                                                                                               M6) with high coverage of short read (99X) was adjusted to ˜ 30X for this analysis to help SNP filtering and
                                                                                                                                                                                                                                                               avoid any bias due to large differences in depth of coverage. To deduce the population structure of the NA
                                                                                                                                                                                                                                                               blue whales prior to whaling and contrast it to present-day population structure, six NWA (NWa-R4, NWa3,
                                                                                                                                                                                                                                                               NWa4, NWa5, NWa6, NWa-CM1) blue whales dating from the early days of blue whale whaling through
                                                                                                                                                                                                                                                               to post-whaling and one Antarctic blue whale (Table 1) were included in the analyses. Population structure
                                                                                                                                                                                                                                                               was investigated using principal component analysis (PCA) and other population structure analyses such as
                                                                                                                                                                                                                                                               TREEMIX (Pickrell & Pritchard, 2012). and NGSADMIX (Skotte et al., 2013).
                                                                                                                                                                                                                                                               2.5.1 Principal component analysis
                                                                                                                                                                                                                                                               PCA was performed using LASER v 2.04 (Wang et al., 2015) which uses projection Procrustes analysis for
                                                                                                                                                                                                                                                               the samples with low depth of coverage were placed in the context of a reference PCA space constructed using
                                                                                                                                                                                                                                                               genotypes of a set of reference individuals with higher coverage depth. The first PCA analysis with blue, fin
                                                                                                                                                                                                                                                               and sei whale samples which included 18 NA blue whales (four present-day and six historical samples from
                                                                                                                                                                                                                                                               NWA, and eight present-day samples from NEA); one historical sample from an Antarctic blue whale (Table
                                                                                                                                                                                                                                                               1); seven present-day fin whales from NA and two sei whales (SRR5665645 and SRR5665646). Historical
                                                                                                                                                                                                                                                               samples, NWa-R4, NWa3, NWa4, NWa5, NWa6, NWa-CM1 were included in this analysis. The second PCA
                                                                                                                                                                                                                                                               analysis visualized the genetic relationship among blue whales, which included 12 present-day blue whales
                                                                                                                                                                                                                                                               sampled from both sides of the NA, three historical samples from the NWA (NWa-R4, NWa3 & NWa4) and
                                                                                                                                                                                                                                                               the historical sample from Antarctica. The trimmed sequences of the blue, fin and sei whales were reference
                                                                                                                                                                                                                                                               aligned to the assembled NA blue whale genome autosomes, variant detected and VCF format files were
                                                                                                                                                                                                                                                               generated. The biallelic SNPs for the PCA were filtered for sites present in at least 50% of the samples, >10
                                                                                                                                                                                                                                                               bases apart, with a quality score of >30, mapping quality >30, coverage depth of between 3X and 130X
                                                                                                                                                                                                                                                               and MAF of >0.1. The sites were filtered for linkage disequilibrium by eliminating sites with a correlation
                                                                                                                                                                                                                                                               coefficient (r2 ) > 0.8 within a 1kb window and 4,136,458 and 2,620,383 sites were used for the first and second

                                                                                                                                                                                                                                                                                                                      5
PCA analysis, respectively. The ancestry reference PCA space for the first PCA analysis was constructed
Posted on Authorea 14 Apr 2021 — The copyright holder is the author/funder. All rights reserved. No reuse without permission. — https://doi.org/10.22541/au.161842590.09830459/v1 — This a preprint and has not been peer reviewed. Data may be preliminary.

                                                                                                                                                                                                                                                               using 11 present-day NA blue whales with >20X coverage (Table 1), two present-day fin whales with >20X
                                                                                                                                                                                                                                                               coverage and two sei whales with ˜10X coverage. Four NWA and six NEA present-day blue whales with high
                                                                                                                                                                                                                                                               coverage and a sei whale (SRR5665645) were included to compute the reference PCA space for the second
                                                                                                                                                                                                                                                               PCA analysis.
                                                                                                                                                                                                                                                               2.5.2 Treemix
                                                                                                                                                                                                                                                               Genetic relationships were visualized for the 12 present-day blue whale samples from the NA, three historical
                                                                                                                                                                                                                                                               samples from the NA and one historical sample from Antarctica using TREEMIX v1.13 setting a NA fin
                                                                                                                                                                                                                                                               whale as the root. The blue whale samples included here showed low levels of introgression from fin whales.
                                                                                                                                                                                                                                                               Each individual whale was plotted with a maximum likelihood graph (with option -nos) using genome-wide
                                                                                                                                                                                                                                                               allele frequencies and a Gaussian distribution to account for genetic drift, allowing for two migration events.
                                                                                                                                                                                                                                                               Treemix was run independently 10 times to verify that the edges were consistent across runs. Migration edges
                                                                                                                                                                                                                                                               were fitted iteratively by analyzing the residual plots and confirming gene flow events with D-statistics.
                                                                                                                                                                                                                                                               2.5.3 NGSadmix
                                                                                                                                                                                                                                                               The individual admixture proportions for the blue whale samples from the Treemix analysis were estimated
                                                                                                                                                                                                                                                               by NGSADMIX, a maximum-likelihood method based on genotype likelihoods in ANGSD v0.9 (Korneliussen
                                                                                                                                                                                                                                                               et al., 2014). NGSADMIX was run with clusters (k) of 2-5, and each k value was run 10 times to look for
                                                                                                                                                                                                                                                               convergence. The variant sites were filtered to include only those covered in at least 11 individuals with a
                                                                                                                                                                                                                                                               SNP p-value of < 1e-6 and a MAF >0.01.
                                                                                                                                                                                                                                                               The genetic divergence between blue whales in the NA was also investigated using Weir and Cockerham
                                                                                                                                                                                                                                                               weighted Fst (Weir & Cockerham, 1984). The Fst was estimated with 21,81,260 SNPs filtered as in the PCA
                                                                                                                                                                                                                                                               analysis for four NWA and seven NEA present-day samples with at least >20X coverage.
                                                                                                                                                                                                                                                               2.5.4 Network Analysis
                                                                                                                                                                                                                                                               Haplotype median-joining networks were created using the program POPART (Leigh & Bryant, 2015) with
                                                                                                                                                                                                                                                               the default settings. This was carried out for 28 whole mitochondrial genomes including 14 from the NWA
                                                                                                                                                                                                                                                               (four present-day and ten historical samples), eleven from the NEA (one historical, seven present-day from
                                                                                                                                                                                                                                                               this study, and three from GenBank MF409242, X72204 and assembled from SRR5665644), a South Atlantic
                                                                                                                                                                                                                                                               historical sample, an Antarctic historical sample and one of uncertain North Atlantic origins.
                                                                                                                                                                                                                                                               The median-joining network for the control region was examined for the 28 samples described above along
                                                                                                                                                                                                                                                               with an additional 126 mitochondrial partial control region sequences available in GenBank (Supplemen-
                                                                                                                                                                                                                                                               tary Information). Additional haplogroups available from GenBank were not included due to their shorter
                                                                                                                                                                                                                                                               sequence length as the algorithm collapses sites that are missing or ambiguous. The consensus length of the
                                                                                                                                                                                                                                                               control region sequence examined was 413 base pairs.
                                                                                                                                                                                                                                                               2.6 Heterozygosity
                                                                                                                                                                                                                                                               To estimate heterozygosity, ten present-day NA blue whale samples with sequence coverage of >20X were
                                                                                                                                                                                                                                                               aligned to masked autosomal contigs of NA blue whales as described above and the resulting alignments
                                                                                                                                                                                                                                                               were analyzed with default settings of MLRHO (Haubold et al., 2010). MLRHO gives a maximum likelihood
                                                                                                                                                                                                                                                               estimate of the population mutation rate (4Neμ) from individual whole genome sequencing data, which
                                                                                                                                                                                                                                                               approximates expected heterozygosity under the infinite sites model. The heterozygosity of the Antarctic
                                                                                                                                                                                                                                                               historical sample (˜6X) was determined using ANGSD based on site frequency spectrum (SFS) using infinite
                                                                                                                                                                                                                                                               sites model. The trimmed paired-end reads from the Antarctic sample were also aligned to the NA blue
                                                                                                                                                                                                                                                               whale masked autosomal contigs and ANGSD analysis was performed with filtering for quality score of >20,
                                                                                                                                                                                                                                                               mapping quality >20 and options: -noTrans (to remove deaminated cytosine residues in historical samples)
                                                                                                                                                                                                                                                               and -fold 1.
                                                                                                                                                                                                                                                               2.7 Pairwise sequentially Markovian coalescent (PSMC) model

                                                                                                                                                                                                                                                                                                                     6
The PSMC model was used to estimate changes in effective population size (Ne) through time (Li & Durbin,
Posted on Authorea 14 Apr 2021 — The copyright holder is the author/funder. All rights reserved. No reuse without permission. — https://doi.org/10.22541/au.161842590.09830459/v1 — This a preprint and has not been peer reviewed. Data may be preliminary.

                                                                                                                                                                                                                                                               2012). To infer population size history, whole genome sequences of an individual from the NWA (NW-B7)
                                                                                                                                                                                                                                                               and whales from the NEA (NE2 and NE-Ar) were aligned to the masked NA blue whale assembly. The
                                                                                                                                                                                                                                                               trimmed reads were aligned with BWA 0.7.17 and bam format files were generated following GATK best
                                                                                                                                                                                                                                                               practices. A fin whale (˜20X) was also included to infer its population history. The diploid consensus file
                                                                                                                                                                                                                                                               for each individual was generated using SAMTOOLS MPILEUP version 1.5 following Li and Durbin (2012),
                                                                                                                                                                                                                                                               and minimum and maximum depth of coverage thresholds were set to between 10X and 100X for all samples.
                                                                                                                                                                                                                                                               The software PSMC v 0.6.5 was used with plots scaled by the mutation rates and generation times for the
                                                                                                                                                                                                                                                               two different species of whales from Árnason et al., (2018).
                                                                                                                                                                                                                                                               2.8 Introgression
                                                                                                                                                                                                                                                               Gene flow between blue and fin whale genomes was investigated for present-day and historical samples and
                                                                                                                                                                                                                                                               gene flow between blue whales and humpback/sei whale genomes was also explored. Sei whales are the most
                                                                                                                                                                                                                                                               closely related species to blue whales, and humpback whales are the closest related species to fin whales
                                                                                                                                                                                                                                                               based on the species tree by Árnason et al. (2018). The gene flow between these large baleen whales was
                                                                                                                                                                                                                                                               examined using D-statistics (Green et al., 2010) in the present-day and historical whale samples to assess if
                                                                                                                                                                                                                                                               there have been any changes in frequency of hybridization and introgression through time.
                                                                                                                                                                                                                                                               The D-statistics or ABBA/BABA test was used to study introgression between blue and fin whales. A four-
                                                                                                                                                                                                                                                               taxon phylogeny of (((Antarctic Blue, NA Blue), Fin), Minke) was analyzed for present-day and historical
                                                                                                                                                                                                                                                               samples. D-statistics’ were estimated for each of the NA blues, compared to an Antarctic blue, as they are
                                                                                                                                                                                                                                                               from distinct genetic clusters identified by the PCA and TREEMIX analysis. Additionally, blue-fin hybrids
                                                                                                                                                                                                                                                               have been reported mostly from the NA and the North Pacific (Pampoulie et al., 2020) and not from
                                                                                                                                                                                                                                                               Antarctica making the Antarctic sample better for comparisons with respect to introgression analysis in blue
                                                                                                                                                                                                                                                               whales. The minke whale (SRR896642, Yim et al. 2014) was the outgroup. The whole genome sequences
                                                                                                                                                                                                                                                               aligned to the masked autosomal NA blue whale assembly were used in this analysis. The ABBA/BABA
                                                                                                                                                                                                                                                               tests, where “A” is the ancestral allele and “B” is the derived allele, were performed in ANGSD. The sites
                                                                                                                                                                                                                                                               were filtered for quality score of >20 and mapping quality >30. The SNPs from the historical samples
                                                                                                                                                                                                                                                               were further filtered to remove deaminated cytosine residues using the -rmTrans parameter. The jackknife
                                                                                                                                                                                                                                                               procedure was used for standard error estimations. Similarly, to study blue-humpback (Tollis et al., 2019)
                                                                                                                                                                                                                                                               whale and blue-sei (SRR5665645) whale introgression, the analyses were conducted for (((Antarctic Blue,
                                                                                                                                                                                                                                                               NA Blue), Humpback), Minke) and (((Antarctic Blue, NA Blue), Sei), Minke).
                                                                                                                                                                                                                                                               To detect the direction of gene flow and quantify introgression the statistic Dfoil (Pease & Hahn, 2014) was
                                                                                                                                                                                                                                                               employed. Dfoil is a five-taxon test and the phylogenetic relationship tested here was (((Sei, NA Blue), (Fin,
                                                                                                                                                                                                                                                               Humpback)), Minke). The Dfoil analyses included VCF format files from whole genome sequences of blue,
                                                                                                                                                                                                                                                               sei (SRR5665645), fin, humpback (Tollis et al., 2019) and minke (SRR896642) whales aligned to masked
                                                                                                                                                                                                                                                               autosomal NA blue whale assembly that were processed as described above. The SNPs were filtered for
                                                                                                                                                                                                                                                               missing >0.50, >10 bases apart, quality score of >30, mapping quality >30, coverage depth of between 3X
                                                                                                                                                                                                                                                               and 130X and MAF >0.1 using VCFTOOLS and PLINK (Purcell et al., 2007). The fin whale used in the
                                                                                                                                                                                                                                                               introgression analysis was also tested against another known fin whale to verify its genetic identity, which
                                                                                                                                                                                                                                                               was consistent with the PCA analysis (Fig.2B) wherein it clustered with the other seven NA fin whales.
                                                                                                                                                                                                                                                               Dfoil analyses with a phylogeny of (((NA Blue 1, NA Blue 2), (Fin, Humpback)), Minke) were also examined.
                                                                                                                                                                                                                                                               The historical whale samples and a low coverage sample were not included in Dfoil analysis due to shallow
                                                                                                                                                                                                                                                               genome coverage.
                                                                                                                                                                                                                                                               3. Results
                                                                                                                                                                                                                                                               3.1 Genome assembly.
                                                                                                                                                                                                                                                               The NA blue whale genome of 2.49 Mbp DNA was assembled with paired-end Illumina HiSeq X (˜110X)
                                                                                                                                                                                                                                                               and Pacbio (˜50X) sequencing technologies using DNA from a female blue whale (NW-M6, Table 1) that
                                                                                                                                                                                                                                                               washed ashore in Newfounland in 2014 (Fig. 1). The assembly had a total of 11,400 contigs and a N50 of

                                                                                                                                                                                                                                                                                                                     7
1.46 Mb (L50 of 449). The completeness of the assembly was assessed using BUSCO (Simão et al., 2015)
Posted on Authorea 14 Apr 2021 — The copyright holder is the author/funder. All rights reserved. No reuse without permission. — https://doi.org/10.22541/au.161842590.09830459/v1 — This a preprint and has not been peer reviewed. Data may be preliminary.

                                                                                                                                                                                                                                                               analysis that showed 94.8% complete genes and 2.6% fragmented genes of the 4,104 reference mammalian
                                                                                                                                                                                                                                                               single-copy genes tested. The 255 sex chromosome linked contig was identified as well as one contig aligned
                                                                                                                                                                                                                                                               to the blue whale mitochondrial DNA (Árnason & Gullberg, 1993). The size of the genome was estimated
                                                                                                                                                                                                                                                               from Illumina reads to be ˜2.7Gb indicating 92.6% of genome assembled.
                                                                                                                                                                                                                                                               Upon scanning the blue whale genome for repeats, we identified that 46.2 % of the genome was composed
                                                                                                                                                                                                                                                               of repetitive elements. The most abundant transposable elements were LINES (Long interspersed nuclear
                                                                                                                                                                                                                                                               elements) comprising 23.21 % of the genome and SINEs (Short interspersed nuclear elements) constituting
                                                                                                                                                                                                                                                               about 6.86 % of the genome. The other repeat elements included LTR (Long terminal repeats, 6.05 %), DNA
                                                                                                                                                                                                                                                               elements (3.53%), unclassified (0.05 %), small RNA (3.70 %), satellites (3.98 %), simple repeats (1.00 %),
                                                                                                                                                                                                                                                               low complexity sequences (0.2 %) and 1.33 % de novo repeats.
                                                                                                                                                                                                                                                               Transcriptome assembly annotation predicted 30,867 protein coding genes and 25,736 genes were functionally
                                                                                                                                                                                                                                                               annotated (Fig. 1). The assessment of the quality of the annotation showed that 65.7% of predicted proteins
                                                                                                                                                                                                                                                               had known Pfam (Finn et al., 2010) domains.
                                                                                                                                                                                                                                                               3.2 Positive selection
                                                                                                                                                                                                                                                               Comparison of the genomes of the blue whale, the largest whale, with one of the smallest baleen whales, the
                                                                                                                                                                                                                                                               minke whale identified several oncogenes undergoing positive selection. Using a pairwise positive selection
                                                                                                                                                                                                                                                               assay of single gene orthologs (SGO), we identified 72 positively selected SGO in NA blue whales. Positively
                                                                                                                                                                                                                                                               selected genes included; apoptotic signalling pathway (GO:0097190); programmed cell death (GO:0097468,
                                                                                                                                                                                                                                                               GO:0010421, GO:0097190) genes XBP1, C17ORF47, PTH, SCG2 and PAWR ; genes that may have a role in
                                                                                                                                                                                                                                                               the evolution of large body size such as the positive regulation of cell population proliferation (GO:0008284),
                                                                                                                                                                                                                                                               growth genes (GO:0040007) and cell adhesion related genes. The positive regulator of cell population proli-
                                                                                                                                                                                                                                                               feration genes under positive selection included PDCD10 and CGA ; growth genes CCL28 , TROAP and
                                                                                                                                                                                                                                                               STRC ; and cell adhesion related genes BASP1 , GAP43 , NPPA andCRLF3 . Further examination of the
                                                                                                                                                                                                                                                               positively selected genes revealed that 69 of the 72 genes identified are associated with somatic mutation in
                                                                                                                                                                                                                                                               cancer cells (COSMIC v90 fasta file, Forbes et al., 2015; also see Supplementary Information).
                                                                                                                                                                                                                                                               We further evaluated genomic regions under positive selection in the 12 present-day NA blue whales using
                                                                                                                                                                                                                                                               Tajima’s D, and identified 52 additional genes under positive selection (Supplementary Information). The
                                                                                                                                                                                                                                                               functional pathway analysis of the genes identified enrichment of nicotinic acetylcholine receptor (nAChR)
                                                                                                                                                                                                                                                               signaling pathway, a pathway that regulates neurotransmitters that control cancer growth (Schuller, 2009)
                                                                                                                                                                                                                                                               and genes, MYO6 , MYO1C and MYO10 (P00044) involved in hearing (Adamek, Geeves, & Coluccio, 2011;
                                                                                                                                                                                                                                                               Heimsath et al., 2017; Roux et al., 2009). The enrichment of these genes can impact acoustic communication
                                                                                                                                                                                                                                                               and may signal adaptation to low frequency sound amplification and detection in blue whales.
                                                                                                                                                                                                                                                               Functional analysis of positively selected genes also identified CEACAM1 (Takeuchi et al., 2019) and HAV-
                                                                                                                                                                                                                                                               CR2 (Gayden et al., 2018) which are involved in negative regulation of response to tumor cells (GO:0002835).
                                                                                                                                                                                                                                                               Positively selected genes in the NA blue whales included GNAS, a regulator of insulin secretion in the mTOR
                                                                                                                                                                                                                                                               signaling pathway which is involved in growth and diseases of aging (Blagosklonny et al., 2013).
                                                                                                                                                                                                                                                               3.3 Population structure
                                                                                                                                                                                                                                                               We further wanted to investigate and visualize the genetic relationship of NA blue whales with whole genome
                                                                                                                                                                                                                                                               sequences and mitochondrial genomes.
                                                                                                                                                                                                                                                               3.3.1 Principal component analysis
                                                                                                                                                                                                                                                               Our initial PCA performed on blue, fin and sei whales which grouped into distinct clusters when Principal
                                                                                                                                                                                                                                                               Component 1 (PC1) and PC2 were plotted (Fig. 2B). One of the historical samples (NWa-CM1) was inter-
                                                                                                                                                                                                                                                               mediate between the blue and fin whale cluster indicating it was a blue-fin hybrid which was also confirmed
                                                                                                                                                                                                                                                               with D-statistics test. Two other historical samples (NWa5 and NWa6) also showed significant fin whale
                                                                                                                                                                                                                                                               introgression from D-statistics analysis and were removed from further population studies.

                                                                                                                                                                                                                                                                                                                     8
The second PCA using LASER was performed for blue whale samples that did not show high fin whale
Posted on Authorea 14 Apr 2021 — The copyright holder is the author/funder. All rights reserved. No reuse without permission. — https://doi.org/10.22541/au.161842590.09830459/v1 — This a preprint and has not been peer reviewed. Data may be preliminary.

                                                                                                                                                                                                                                                               introgression (Fig. 2C). Most NA samples clustered together, with the Antarctica sample being distinct
                                                                                                                                                                                                                                                               on PC1. PC2 indicated that two blue whale samples from NEA (NE-Ar and NE3) and NWA (NW-M6 and
                                                                                                                                                                                                                                                               NW9) were outliers to the main cluster of NA samples, which can be attributed to genomic variability within
                                                                                                                                                                                                                                                               the NA samples and the low total variability accounted by PC2. PC2 accounted for ˜9% of total variability
                                                                                                                                                                                                                                                               of reference samples analyzed whereas PC1 accounted for ˜16% of total variability.
                                                                                                                                                                                                                                                               3.3.2 Treemix
                                                                                                                                                                                                                                                               The genetic relationship visualized using TREEMIX (Fig. 2D) indicated that all of the NA blue whales were
                                                                                                                                                                                                                                                               allied and distinct from the Antarctic blue whale. The NEA and the NWA blue whales formed a single group.
                                                                                                                                                                                                                                                               Four of the NWA blue whales (NW-M6, NWa-R4, NWa3 and NWa4) were more closely related to each other
                                                                                                                                                                                                                                                               than to the other NA blue whales. The Antarctic blue whale did not share significant alleles with any of the
                                                                                                                                                                                                                                                               present-day NA whales as indicated from the lack of migration events between the Antarctic and any of the
                                                                                                                                                                                                                                                               NA blue whales. The migration events show gene flow between NW-M6 to NW9 and NE-Ar to NE71, which
                                                                                                                                                                                                                                                               indicates that blue whales share more alleles with individuals within the same geographic regions. The gene
                                                                                                                                                                                                                                                               flow indicated by the migration events between the whales were also confirmed using D-statistics.
                                                                                                                                                                                                                                                               3.3.3 Admixture
                                                                                                                                                                                                                                                               The NGSADMIX analysis reaffirmed that many samples (Fig. 2E) from the NA show evidence of admixture.
                                                                                                                                                                                                                                                               The Antarctic sample clustered with the NWA when two ancestral populations were considered (k=2),
                                                                                                                                                                                                                                                               which was also observed in the mitochondrial network analysis. The analysis with k=3 populations indicated
                                                                                                                                                                                                                                                               that many of the NA blue whales have mixed ancestry. The k=3 analysis suggested that all of the blue
                                                                                                                                                                                                                                                               whale historical samples had a common ancestry, which can be a possible effect of post-mortem damage not
                                                                                                                                                                                                                                                               corrected despite application of methods to remove deaminated sites.
                                                                                                                                                                                                                                                               3.3.4 Fst
                                                                                                                                                                                                                                                               Genetic divergence estimated by the Weir and Cockerham weighted Fst suggested low (0.0093) differentiation
                                                                                                                                                                                                                                                               between NEA and NWA blue whales.
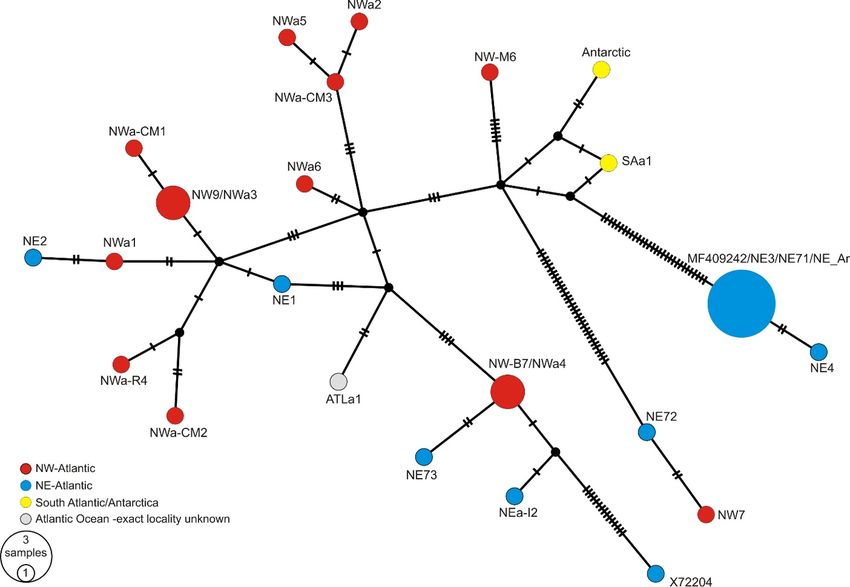
                                                                                                                                                                                                                                                               3.3.5 Mitochondrial Network Analysis
                                                                                                                                                                                                                                                               The median joining network analysis using mitochondrial genomes and a larger sampling of historical whales
                                                                                                                                                                                                                                                               produced similar results to the nuclear sequences in showing an absence of clustering of haplogroups based
                                                                                                                                                                                                                                                               on the NA geographic origin of the samples (Fig. 3). Additionally, there appears to be continuity through
                                                                                                                                                                                                                                                               time as haplogroups are shared between two of the four present-day NWA samples with whales killed in the
                                                                                                                                                                                                                                                               same waters over a century ago. The Antarctic and South Atlantic whales cluster within the NA blue whales
                                                                                                                                                                                                                                                               closest to the NWA blue whale NW-M6. Global geographic structuring using a larger sampling of whales
                                                                                                                                                                                                                                                               (154) but a smaller amount of sequence (mitochondrial control region) was weak or nonexistent (Fig. S1).

                                                                                                                                                                                                                                                                                                                    9
Posted on Authorea 14 Apr 2021 — The copyright holder is the author/funder. All rights reserved. No reuse without permission. — https://doi.org/10.22541/au.161842590.09830459/v1 — This a preprint and has not been peer reviewed. Data may be preliminary.

                                                                                                                                                                                                                                                               Figure 2. Population structure of present-day and historical blue whales from North Atlantic A . Map of
                                                                                                                                                                                                                                                               sampling locations of blue whales B. Principal component analysis (PCA) ten Northwest Atlantic (NWA)
                                                                                                                                                                                                                                                               blue whales, eight Northeast Atlantic (NEA) blue whales, one Antarctic blue whale, seven fin whales from
                                                                                                                                                                                                                                                               North Atlantic and two sei whales using LASER. The circled sample represents the blue-fin hybrid historical
                                                                                                                                                                                                                                                               sample (NWa-CM1) C. PCA of seven NWA blue whales, eight NEA blue whales and one Antarctic blue
                                                                                                                                                                                                                                                               whale with LASER.D. Maximum likelihood tree using TREEMIX for NE, NW and Antarctic blue whales
                                                                                                                                                                                                                                                               with two migration edges, considering each individual as a separate population and fin whale as the root.
                                                                                                                                                                                                                                                               The horizontal branch lengths are proportional to genetic drift along that branch and the scale bar shows
                                                                                                                                                                                                                                                               ten times the average standard error of the entries in the sample covariance matrix. E. Individual admixture
                                                                                                                                                                                                                                                               proportions using NGSadmix for a single run from 10 runs of k=2 and k=3 for present-day and historical
                                                                                                                                                                                                                                                               sample from NWA, NEA and Antarctic). The X-axis displays the proportion of ancestry and the Y-axis
                                                                                                                                                                                                                                                               displays blue whale samples.

                                                                                                                                                                                                                                                                                                                   10
Posted on Authorea 14 Apr 2021 — The copyright holder is the author/funder. All rights reserved. No reuse without permission. — https://doi.org/10.22541/au.161842590.09830459/v1 — This a preprint and has not been peer reviewed. Data may be preliminary.

                                                                                                                                                                                                                                                               Figure 3. Median-joining network for blue whale mitochondrial genome haplotypes. Haplotypes are coloured
                                                                                                                                                                                                                                                               according to the region of the Atlantic Ocean where the whale was sampled. The number of ticks denote
                                                                                                                                                                                                                                                               nucleotide differences between haplogroups.
                                                                                                                                                                                                                                                               3.3.6 Heterozygosity and population history of NA blue whales
                                                                                                                                                                                                                                                               Genome-wide heterozygosity for the ten present-day samples (> ˜20X) and the historical sample from Antarc-
                                                                                                                                                                                                                                                               tica (˜6X) was high. Genetic variation within the NA population was also high ˜0.0025 (other whale species
                                                                                                                                                                                                                                                               have ˜0.001 (Árnason et al., 2018)). The Antarctic blue whale had the highest heterozygosity within our
                                                                                                                                                                                                                                                               samples (0.0053).
                                                                                                                                                                                                                                                               Our PSMC results suggest that blue whale population size was relatively stable until approximately 400,000
                                                                                                                                                                                                                                                               years ago, when it began a decline that continued during the subsequent glacial and interglacial. There is also
                                                                                                                                                                                                                                                               a suggestion of a precipitous decline during the latest glacial maximum (approximately 14,000 to 115,000
                                                                                                                                                                                                                                                               years ago). The trajectory of the fin whale population size through time is distinct from the blue whales, in
                                                                                                                                                                                                                                                               that there is an initial decline beginning with the onset of the Pleistocene epoch approximately 2.5 million
                                                                                                                                                                                                                                                               years ago, and a population rebound coinciding roughly with the onset of the decline in blue whales. The
                                                                                                                                                                                                                                                               rebound ended and the fin whale population began to decline again during the interglacial ˜220,000 years
                                                                                                                                                                                                                                                               ago. The population then plateaued shortly after the onset of the last glacial maximum.

                                                                                                                                                                                                                                                                                                                     11
Posted on Authorea 14 Apr 2021 — The copyright holder is the author/funder. All rights reserved. No reuse without permission. — https://doi.org/10.22541/au.161842590.09830459/v1 — This a preprint and has not been peer reviewed. Data may be preliminary.

                                                                                                                                                                                                                                                               Figure 4. Inferred effective population sizes through time estimated from three blue whales (NWA and NEA
                                                                                                                                                                                                                                                               whales and NE-Ar) and a fin whale using the PSMC analyses on genome sequences. The X-axis displays time
                                                                                                                                                                                                                                                               (years) going backward from the present (log scale) and the Y-axis denotes the effective population size. The
                                                                                                                                                                                                                                                               plot is scaled by a generation time of 30.8 years for the blue whales and 25.9 years for the fin whale with a
                                                                                                                                                                                                                                                               mutation rate of 1.39 X 10 -8 substitutions per nucleotide per generation (Árnason et al., 2018). Grey shaded
                                                                                                                                                                                                                                                               areas demarcate interglacial periods in years before present: 0–14,000; 115,000–130,000; ˜220,000–243,000;
                                                                                                                                                                                                                                                               ˜320,000–337,000; and ˜400,000–424,000.
                                                                                                                                                                                                                                                               3.3.7 Introgression
                                                                                                                                                                                                                                                               All NA blue whale samples showed significant introgression (Z-score >3) with fin whales (Table 2). Four of
                                                                                                                                                                                                                                                               six historical blue whale samples also showed evidence of introgression with the fin whale genome. The late
                                                                                                                                                                                                                                                               twentieth century sample, NWa-CM1 (1974), had a high D-statistic value (0.94), indicating that it originated
                                                                                                                                                                                                                                                               from a recent hybridization between a fin and blue whale. The mitochondria of this whale indicated that
                                                                                                                                                                                                                                                               the hybrid had a blue whale mother. Two other early-1900s bone samples (NWa5 and NWa6) also had high
                                                                                                                                                                                                                                                               D-statistics values, 0.54 and 0.64 respectively, which indicate hybridization in the more distant past. Blue
                                                                                                                                                                                                                                                               whales from NA and the humpback whale failed to show significant interspecific introgression. Likewise, all
                                                                                                                                                                                                                                                               NA blue whales, except for NE-Ar (an Icelandic sample sequenced in an earlier study (Árnason et al., 2018)),
                                                                                                                                                                                                                                                               failed to show introgression with the sei whale.
                                                                                                                                                                                                                                                               Unidirectional gene flow from fin whale to blue whale was detected via Dfoil statistics in all present-day blue
                                                                                                                                                                                                                                                               whale samples (Supplementary Information, Table S1). The gene flow from fin whales accounted for ˜3.5 %
                                                                                                                                                                                                                                                               of the present-day blue whale genome.
                                                                                                                                                                                                                                                               Table 2. D-statistics analysis to detect presence of gene flow between the blue and fin whales with the
                                                                                                                                                                                                                                                               four-taxon phylogeny (((Antarctic Blue, NA Blue), Fin), Minke)

                                                                                                                                                                                                                                                                                             North-Atlantic Blue    D-Stat (SE)       Z-score
                                                                                                                                                                                                                                                                                             NW-M6                  0.035 (±0.004)    8.04*
                                                                                                                                                                                                                                                                                             NW-B7                  0.033 (±0.004)    7.67*
                                                                                                                                                                                                                                                                                             NW7                    0.027 (±0.004)    6.50*
                                                                                                                                                                                                                                                                                             NW9                    0.031 (±0.004)    7.08*
                                                                                                                                                                                                                                                                                             NWa3                   0.019 (±0.005)    3.74*
                                                                                                                                                                                                                                                                                             NWa4                   0.005 (±0.005)    0.93
                                                                                                                                                                                                                                                                                             NWa5                   0.57 (±0.006)     99.56*
                                                                                                                                                                                                                                                                                             NWa6                   0.64 (±0.006)     102.88*
                                                                                                                                                                                                                                                                                             NWa-CM1                0.94 (±0.0006)    1386.90*
                                                                                                                                                                                                                                                                                             NWa-R4                 0.014 (±0.005)    2.80

                                                                                                                                                                                                                                                                                                                     12
North-Atlantic Blue    D-Stat (SE)        Z-score
Posted on Authorea 14 Apr 2021 — The copyright holder is the author/funder. All rights reserved. No reuse without permission. — https://doi.org/10.22541/au.161842590.09830459/v1 — This a preprint and has not been peer reviewed. Data may be preliminary.

                                                                                                                                                                                                                                                                                             NE1                    0.036   (±0.004)   8.16*
                                                                                                                                                                                                                                                                                             NE2                    0.049   (±0.004)   11.25*
                                                                                                                                                                                                                                                                                             NE3                    0.032   (±0.004)   7.55*
                                                                                                                                                                                                                                                                                             NE4                    0.048   (±0.004)   11.01*
                                                                                                                                                                                                                                                                                             NE71                   0.016   (±0.004)   3.59*
                                                                                                                                                                                                                                                                                             NE72                   0.035   (±0.004)   8.09*
                                                                                                                                                                                                                                                                                             NE73                   0.033   (±0.004)   7.57*
                                                                                                                                                                                                                                                                                             NE-Ar                  0.017   (±0.002)   7.54*

                                                                                                                                                                                                                                                               4. Discussion
                                                                                                                                                                                                                                                               Genomic approaches are gaining importance in conservation biology. Lower costs of sequencing and improve-
                                                                                                                                                                                                                                                               ments in data analysis in non-model organism has made these genetic tools more accessible. We present
                                                                                                                                                                                                                                                               a gold-standard draft genome of a NA blue whale assembled using integrated second generation short-read
                                                                                                                                                                                                                                                               and third generation long-read sequencing data. The genome was used herein to discern for the first time
                                                                                                                                                                                                                                                               the population structure and demographic history of blue whales in the NA using samples from present-day
                                                                                                                                                                                                                                                               whales and whales collected in the early 1900’s through the 20th century, with the earliest samples repre-
                                                                                                                                                                                                                                                               senting the blue whale population at the onset of industrial whaling. Additionally, we investigated genes
                                                                                                                                                                                                                                                               that appear to be under positive selection in blue whales.
                                                                                                                                                                                                                                                               Our analysis of whole genome and mitochondrial DNA from present-day (latitudes ˜ 44°N to 79°N) and
                                                                                                                                                                                                                                                               historic samples revealed low population structuring among NA blue whales, indicating that the NA blue
                                                                                                                                                                                                                                                               whales comprise a single panmictic population. This is in contrast to evidence gathered from satellite tracking
                                                                                                                                                                                                                                                               and observational studies (Lesage et al., 2017; Ramp & Sears, 2013, Silva et al., 2013), and points to the
                                                                                                                                                                                                                                                               complexities of studying large marine mammals in situ and the importance of whole genome analyses to
                                                                                                                                                                                                                                                               better understand population structure. The full mitochondrial analysis suggests that the historical samples
                                                                                                                                                                                                                                                               from the South Atlantic and Antarctica are not as genetically distinct from North Atlantic whales as nuclear
                                                                                                                                                                                                                                                               DNA analyses suggest. Further studies, with larger sample sizes, particularly for Antarctic blue whales are
                                                                                                                                                                                                                                                               needed including nuclear and mitochondrial DNA analyses allowing us to test different aspects of population
                                                                                                                                                                                                                                                               demography
                                                                                                                                                                                                                                                               We observed relatively high genome-wide heterozygosity in present-day NA blue whales and one historical
                                                                                                                                                                                                                                                               Antarctic whale sample, consistent with reports of high heterozygosity observed in Chilean and other Antarc-
                                                                                                                                                                                                                                                               tic whales (Torres-Florez et al., 2014). Despite being hunted to the brink of extinction, with the population
                                                                                                                                                                                                                                                               size being reduced by more than 96%, blue whales have retained high genetic variability. Thus, possible long-
                                                                                                                                                                                                                                                               term effects of severe bottlenecking may not be fully evident in extant populations. High genetic diversity
                                                                                                                                                                                                                                                               within the species is promising for species recovery, if low population numbers do not persist for an exten-
                                                                                                                                                                                                                                                               ded period of time. Similar high genetic diversity has been observed in other species that have experienced
                                                                                                                                                                                                                                                               extreme overexploitation, such as Antarctic fur seals, but have since begun to recover through conservation
                                                                                                                                                                                                                                                               efforts (Paijmans et al., 2020). Our examination of the demographic history of NA blue whales modeled on
                                                                                                                                                                                                                                                               genome wide heterozygous sites found a decline in blue whale numbers in the North Atlantic over the last
                                                                                                                                                                                                                                                               several hundreds of thousands of years during multiple periods of glaciation. The PSMC methodology loses
                                                                                                                                                                                                                                                               resolution in relatively recent time periods and thus does not reveal the impact of 19th and 20th century
                                                                                                                                                                                                                                                               whaling. Our results are similar to observations from an earlier study by Árnason et al., (2018), although
                                                                                                                                                                                                                                                               use of our blue whale de novoassembly allowed for a better estimation of the effective population size at the
                                                                                                                                                                                                                                                               end of the last glaciation providing an estimate of what the NA blue whale population size may have been
                                                                                                                                                                                                                                                               prior to whaling.
                                                                                                                                                                                                                                                               Blue and fin whales are the two largest animals on earth and can hybridize even though they are not sibling
                                                                                                                                                                                                                                                               species (˜8.35 million years since divergence) (Árnason et al., 2018). Interspecific hybridization can occur
                                                                                                                                                                                                                                                               naturally or result from disruption of breeding due to anthropogenic effects. Hybridization with introgression

                                                                                                                                                                                                                                                                                                                     13
can in some cases lead to the extinction of distinct species through swamping of the genome of one of the
Posted on Authorea 14 Apr 2021 — The copyright holder is the author/funder. All rights reserved. No reuse without permission. — https://doi.org/10.22541/au.161842590.09830459/v1 — This a preprint and has not been peer reviewed. Data may be preliminary.

                                                                                                                                                                                                                                                               hybrid pairs. We demonstrated gene flow between blue and fin whales in all of our present-day and four (of
                                                                                                                                                                                                                                                               six) historical samples; two whales from the early 20th century lacked introgression. While our sample size
                                                                                                                                                                                                                                                               is very limited, this possible increase in the rate of introgression might be related to reduced mate choice in
                                                                                                                                                                                                                                                               blue whales due to their reduced population size after industrial whaling. This hypothesis should be further
                                                                                                                                                                                                                                                               tested with larger sample sizes of whales from pre- and post-whaling. The gene flow that we recorded between
                                                                                                                                                                                                                                                               fin whales and NA blue whales was not evident in previous studies (Árnason et al., 2018; Westbury et al.,
                                                                                                                                                                                                                                                               2019) that were done without the blue whale genome as a reference. The direction of gene flow was fin
                                                                                                                                                                                                                                                               to blue whale in all present-day blue whales analyzed from NA, consistent with the observation of several
                                                                                                                                                                                                                                                               interspecific hybrids resulting from mating of a male fin whales and female blue whales (Pampoulie et al.,
                                                                                                                                                                                                                                                               2020).
                                                                                                                                                                                                                                                               We also assembled and annotated the NA blue whale transcriptome, allowing for functional analysis of
                                                                                                                                                                                                                                                               positively selected blue whale genes. We identified several nAChR signaling pathway genes that are associated
                                                                                                                                                                                                                                                               with cancer development (Schuller, 2009) and also the selection of genes involved in apoptosis. Earlier studies
                                                                                                                                                                                                                                                               of suppression of cancer in marine mammals detected positive selection of another apoptosis pathway gene
                                                                                                                                                                                                                                                               (ETNK1 ) in humpback whales (Tollis et al., 2019) and positive selection of genes regulating nucleotide
                                                                                                                                                                                                                                                               repair, chromatin structure and transcription in bowhead whales (Keane et al., 2015). Sperm whale gene
                                                                                                                                                                                                                                                               analysis has revealed several cancer genes (MMP7, CASP12 and PRSS33 ) that were positively selected
                                                                                                                                                                                                                                                               (Warren et al., 2017). Diseases like cancer which are associated with age and large body size, surprisingly do
                                                                                                                                                                                                                                                               not affect large aquatic mammals (Keane et al., 2015; Tollis et al., 2019). The gene pathways involved are not
                                                                                                                                                                                                                                                               fully understood. Our analysis indicates functional enrichment of genes in the nAChR pathway that might
                                                                                                                                                                                                                                                               further elucidate the underlying mechanism of cancer suppression. This might be a useful tool in medical
                                                                                                                                                                                                                                                               research.
                                                                                                                                                                                                                                                               In summary, the results from our study suggest that the blue whales in the NA comprise a single population.
                                                                                                                                                                                                                                                               Thus, future conservation assessment and planning should be conducted in a holistic framework viewing
                                                                                                                                                                                                                                                               NA blue whales as a single population. Hybridization of blue whales with fin whales is frequent in the NA
                                                                                                                                                                                                                                                               and introgression might be increasing in the present population. Future rates of introgression should be
                                                                                                                                                                                                                                                               monitored. The genetic variability in NA blue whales is high and the slow recovery of blue whales in the
                                                                                                                                                                                                                                                               NA is not associated with reduction of heterozygosity via bottlenecking in extant populations. However, it
                                                                                                                                                                                                                                                               may become a factor in the future if populations do not increase from their current low levels. Rates of
                                                                                                                                                                                                                                                               introgression with fin whales should be monitored. Further studies with a larger sample size for present-day
                                                                                                                                                                                                                                                               and historical blue whales from around the world could be used to examine changes in levels of heterozygosity
                                                                                                                                                                                                                                                               and resolve questions regarding gene flow among populations of blue whales from different oceans to enhance
                                                                                                                                                                                                                                                               conservation planning efforts.
                                                                                                                                                                                                                                                               Acknowledgments
                                                                                                                                                                                                                                                               Thanks to Lois A. Harwood and Jack Lawson (Department of Fisheries and Oceans) for alerting us to the
                                                                                                                                                                                                                                                               presence of the blue whale strandings in Newfoundland and for facilitating the process of allowing us to
                                                                                                                                                                                                                                                               recover the whales. Many thanks to the people of Trout River, Rocky Harbour and Woody Point who we-
                                                                                                                                                                                                                                                               re instrumental in partnering with us to salvage the two blue whales that are central to this study. The
                                                                                                                                                                                                                                                               authors also acknowledge the support of Tonya Wimmer (Marine Animal Rescue Society) for blue whale tis-
                                                                                                                                                                                                                                                               sues and Kamal Khidas (Canadian Museum of Nature), Michael McGowen, Darrin Lunde and John Ososky
                                                                                                                                                                                                                                                               (Smithsonian National Museum of Natural History) for allowing us to sample their museum collections, and
                                                                                                                                                                                                                                                               Veronica Chevasco in assisting in optimizing protocols for ancient DNA recovery. Additionally, we thank
                                                                                                                                                                                                                                                               Hanne Garmel (The Whaling Museum, Sandefjord, Norway), Haakon Livland (Slottsfjellsmuseet, Tønsberg,
                                                                                                                                                                                                                                                               Norway), and Hanneke Meijer (University Museum Bergen, Norway) for help in providing historical samples
                                                                                                                                                                                                                                                               and David William Peter Dolan (Dept. of Informatics, University of Bergen) for bioinformatic/infrastructure
                                                                                                                                                                                                                                                               support. The genome sequencing and bioinformatic analysis was made possible by the generous support of
                                                                                                                                                                                                                                                               the Alan and Patricia Koval Foundation, The Centre for Applied Genomics at The Hospital for Sick Children,
                                                                                                                                                                                                                                                               CanSeq150 by Canada’s Genomics Enterprise (a Canada Foundation of Innovation Major Science Initiative

                                                                                                                                                                                                                                                                                                                     14
award), and a computing grant ‘Resource for Research Groups’ from Compute Canada (2018-2020). The Nor-
Posted on Authorea 14 Apr 2021 — The copyright holder is the author/funder. All rights reserved. No reuse without permission. — https://doi.org/10.22541/au.161842590.09830459/v1 — This a preprint and has not been peer reviewed. Data may be preliminary.

                                                                                                                                                                                                                                                               wegian Research Council ICE-whales programme (no. 244488/E10) and Norwegian Polar Institute supported
                                                                                                                                                                                                                                                               collections of NE Atlantic blue whale tissues. The sequencing activities at the Genomics Core Facility of the
                                                                                                                                                                                                                                                               University of Bergen was supported by the Fram Center Hazardous Substances Flagship Program (grant no.
                                                                                                                                                                                                                                                               602018), the Research Council of Norway (grant no. 245979/F50) and the Trond Mohn Foundation (grant
                                                                                                                                                                                                                                                               no. BFS2016-genom). The bioinformatic analysis at the University of Bergen was provided through ELIXIR
                                                                                                                                                                                                                                                               Norway, Research Council of Norway grant 270068 (to the University of Bergen, the University of Oslo,
                                                                                                                                                                                                                                                               the Arctic University of Norway in Tromsø, the Norwegian University of Science and Technology and the
                                                                                                                                                                                                                                                               Norwegian University of Life Sciences: NMBU). The funding for salary of S.J. was provided by a Rebanks
                                                                                                                                                                                                                                                               post-doctoral fellowship and the Koval foundation. S.W.S. was funded by the GlaxoSmithKline Endowed
                                                                                                                                                                                                                                                               Chair in Genome Sciences at the Hospital for Sick Children and University of Toronto. L.L. is currently
                                                                                                                                                                                                                                                               funded by the Lap-Chee Tsui Fellowship for Research Excellence, though this work was started while she
                                                                                                                                                                                                                                                               was at the ROM.
                                                                                                                                                                                                                                                               References
                                                                                                                                                                                                                                                               Adamek, N., Geeves, M. A., & Coluccio, L. M. (2011). Myo1c mutations associated with hearing loss cause
                                                                                                                                                                                                                                                               defects in the interaction with nucleotide and actin. Cellular Molecular Life Sciences,68, 139-150. Altschul, S.
                                                                                                                                                                                                                                                               F., Madden, T. L., Schäffer, A. A., Zhang, J., Zhang, Z., Miller, W., Lipman, D. J. (1997). Gapped BLAST
                                                                                                                                                                                                                                                               and PSI-BLAST: a new generation of protein database search programs. Nucleic Acids Research, 25, 3389-
                                                                                                                                                                                                                                                               3402. Árnason, Ú., & Gullberg, A. (1993). Comparison between the complete mtDNA sequences of the blue
                                                                                                                                                                                                                                                               and the fin whale, two species that can hybridize in nature. Jourmal of Molecular Evolution, 37, 312-322.
                                                                                                                                                                                                                                                               Árnason, Ú., Lammers, F., Kumar, V., Nilsson, M. A., & Janke, A. (2018). Whole-genome sequencing of
                                                                                                                                                                                                                                                               the blue whale and other rorquals finds signatures for introgressive gene flow. Science Advances,4, eaap9873.
                                                                                                                                                                                                                                                               Bandelt, H. J., Forster, P. & Röhl, A. (1999). Median-joining networks for inferring intraspecific phylogenies.
                                                                                                                                                                                                                                                               Molecular Biology Evolution, 16, 37-48. Blagosklonny, M. V. (2013). Big mice die young but large animals
                                                                                                                                                                                                                                                               live longer. Aging, 5, 227–233. COSEWIC. 2012. COSEWIC status appraisal summary on the Blue Whale
                                                                                                                                                                                                                                                               Balaenoptera musculus, Atlantic population, in Canada. Committee on the Status of Endangered Wildlife in
                                                                                                                                                                                                                                                               Canada. Ottawa.xii pp. www.registrelep-sararegistry.gc.ca/default Dı́ez-del-Molino, D., Sánchez-Barreiro, F.,
                                                                                                                                                                                                                                                               Barnes, I., Gilbert, M. T. P., & Dalén, L. (2018). Quantifying temporal genomic erosion in endangered species.
                                                                                                                                                                                                                                                               Trend in Ecology & Evolution, 33, 176-185. Edgar, R. C. (2004). MUSCLE: multiple sequence alignment with
                                                                                                                                                                                                                                                               high accuracy and high throughput. Nucleic Acids Research, 32, 1792–1797. Ewart, K. M., Johnson, R. N.,
                                                                                                                                                                                                                                                               Ogden, R., Joseph, L., Frankham, G. J., & Lo, N. (2019). Museum specimens provide reliable SNP data
                                                                                                                                                                                                                                                               for population genomic analysis of a widely distributed but threatened cockatoo species. Molecular Ecology
                                                                                                                                                                                                                                                               Resources, 19, 1578-1592. Finn, R. D., Tate, J., Mistry, J., Coggill, P. C., Sammut, S. J, Hotz, H. R., . . .
                                                                                                                                                                                                                                                               Bateman, A. (2010). The Pfam protein families database.Nucleic Acids Research, 38, D211–D222. Foote, A.
                                                                                                                                                                                                                                                               D., Martin, M. D., Louis, M., Pacheco, G., Robertson, K. M., Sinding, M.-H. S., Amaral, A. R., Baird, R.W.,
                                                                                                                                                                                                                                                               Baker, C.S. . . . Morin, P. A. (2019). Killer whale genomes reveal a complex history of recurrent admixture
                                                                                                                                                                                                                                                               and vicariance. Molecular Ecology, 28, 3427-3444. Forbes, S. A., Beare, D., Gunasekaran, P., Leung, K.,
                                                                                                                                                                                                                                                               Bindal, N., Boutselakis, H., . . . Campbell, P. J. (2015). COSMIC: exploring the world’s knowledge of
                                                                                                                                                                                                                                                               somatic mutations in human cancer. Nucleic Acids Research, 43, D805–D811. Gayden, T., Sepulveda, F.
                                                                                                                                                                                                                                                               E., Quang, D. A. K., Pratt, J., Valera, E. T., Garrigue, A., . . . Jabado, N. (2018). Germline HAVCR2
                                                                                                                                                                                                                                                               mutations altering TIM-3 characterize subcutaneous panniculitis-like T cell lymphomas with hemophagocytic
                                                                                                                                                                                                                                                               lymphohistiocytic syndrome. Nature Genetics,50, 1650-1657. Grabherr, M. G., Haas, B. J., Yassour, M.,
                                                                                                                                                                                                                                                               Levin, J. Z., Thompson, D. A., Amit, I., . . . Regev, A., (2011). Trinity: reconstructing a full-length
                                                                                                                                                                                                                                                               transcriptome without a genome from RNA–Seq data.Nature Biotechnology, 29, 644–652. Green, R. E.,
                                                                                                                                                                                                                                                               Krause, J., Briggs, A. W., Maricic, T., Stenzel, U., Kircher, M. . . . Paabo, S. (2010). A draft sequence of
                                                                                                                                                                                                                                                               the Neanderthal genome. Science, 328, 710–722. Haubold, B., Pfaffelhuber, P., & Lynch, M. (2010). MlRho
                                                                                                                                                                                                                                                               - A program for estimating the population mutation and recombination rates from shotgun-sequenced diploid
                                                                                                                                                                                                                                                               genomes. Molecular Ecology, 15,356. Heimsath, E. G. J., Yim, Y., Mustapha, M., Hammer, J. A., & Cheney,
                                                                                                                                                                                                                                                               R. E. (2017). Myosin-X knockout is semi-lethal and demonstrates that myosin-X functions in neural tube
                                                                                                                                                                                                                                                               closure, pigmentation, hyaloid vasculature regression, and filopodia formation. Scientific Reports, 7, 17354.

                                                                                                                                                                                                                                                                                                                     15
Hohenlohe, P. A., Funk, W. C, & Rajora, O. P. (2020). Population genomics for wildlife conservation
Posted on Authorea 14 Apr 2021 — The copyright holder is the author/funder. All rights reserved. No reuse without permission. — https://doi.org/10.22541/au.161842590.09830459/v1 — This a preprint and has not been peer reviewed. Data may be preliminary.

                                                                                                                                                                                                                                                               and management. Molecular Ecology, 30, 62-82. Holt, C., & Yandell, M. (2011). MAKER2: an annotation
                                                                                                                                                                                                                                                               pipeline and genome-database management tool for second-generation genome projects.BMC Bioinformatics,
                                                                                                                                                                                                                                                               12, 491. Keane, M., Semeiks, J., Webb, A. E., Li, Y. I., Quesada, V., Craig, T., . . . Magalhaes, J. P. (2015).
                                                                                                                                                                                                                                                               Insights into the evolution of longevity from the bowhead whale genome. Cell Reports, 10, 112-122. Koren,
                                                                                                                                                                                                                                                               S., Schatz, M. C., Walenz, B. P., Martin, J., Howard, J. T., Ganapathy, G., . . . Phillippy, A. M. (2012).
                                                                                                                                                                                                                                                               Hybrid error correction and de novo assembly of single-molecule sequencing reads. Nature Biotechnology, 30,
                                                                                                                                                                                                                                                               693-700. Korneliussen, T. S., Albrechtsen, A., & Nielsen, R. (2014). ANGSD: Analysis of next generation
                                                                                                                                                                                                                                                               sequencing data. BMC Bioinformatics,15, 356. Langmead, B., & Salzberg, S. L. (2012). Fast gapped-read
                                                                                                                                                                                                                                                               alignment with Bowtie 2. Nature Methods, 9, 357. Leduc, R. G., Archer, F. I., Lang, A. R., Martien, K. K.,
                                                                                                                                                                                                                                                               Hancock-Hanser, B. Torres-Florez, J. P., . . . Taylor, B. L. (2017). Genetic variation in blue whales in the
                                                                                                                                                                                                                                                               eastern pacific: Implication for taxonomy and use of common wintering grounds. Molecular Ecology,26, 740-
                                                                                                                                                                                                                                                               751. Leigh, J. W., & Bryant, D. (2015). POPART: full-feature software for haplotype network construction.
                                                                                                                                                                                                                                                               Methods in Ecology and Evolution,6, 1110-1116. Lesage, V., Gavrilchuk, K., Andrews, R. D. & Sears, R.
                                                                                                                                                                                                                                                               (2017). Foraging areas, migratory movements and winter destinations of blue whales from the western North
                                                                                                                                                                                                                                                               Atlantic. Endangered Species Research,34, 27-43. Li, H., & Durbin, R. (2009). Fast and accurate short read
                                                                                                                                                                                                                                                               alignment with Burrows-Wheeler transform. Bioinformatics, 25, 1754-1760. Li, H. & Durbin, R. (2012).
                                                                                                                                                                                                                                                               Inference of human population history from whole genome sequence of a single individual. Nature, 475, 493-
                                                                                                                                                                                                                                                               496. McDonald, M. A., Mesnick, S. L., & Hildebrand, J. A. (2006). Biogeographic characterization of blue
                                                                                                                                                                                                                                                               whale song worldwide: Using song to identify populations. Journal of Cetacean Research and Management,
                                                                                                                                                                                                                                                               8, 55-65. Meyer, W. K., Jamison, J., Richter, R., Woods, S. E., Partha, R., Kowalczyk, A., . . . Clark, N. L.
                                                                                                                                                                                                                                                               (2018). Ancient convergent losses of Paraoxonase 1 yield potential risks for modern marine mammals.Science
                                                                                                                                                                                                                                                               361, 591-594. Mikheyev, A., Tin, M. M. Y., Arora, J., & Seeley, T. D. (2015). Museum samples reveal rapid
                                                                                                                                                                                                                                                               evolution by wild honeybees exposed to a novel parasite. Nature Communications, 6, 7991. Miller, M. R.,
                                                                                                                                                                                                                                                               Brunelli, J. P., Wheeler, P. A., Liu S., Rexroad 3rd , C. E., Palti, Y., . . . Thorgaard, G. H. (2012). A
                                                                                                                                                                                                                                                               conserved haplotype controls parallel adaptation in geographically distant salmonid populations. Molecular
                                                                                                                                                                                                                                                               Ecology, 21, 237-249 Nieukirk, S. L., Stafford, K. M., Mellinger, D. K., Dziak, R. P. & Fox, C. G. (2004).
                                                                                                                                                                                                                                                               Low-frequency whale and seismic airgun sounds recorded in the mid-Atlantic Ocean. Journal of Acoustic
                                                                                                                                                                                                                                                               Society of America,115, 1832-1843. Okada, H., & Mak, T. W. (2004). Pathways of apoptotic and non-
                                                                                                                                                                                                                                                               apoptotic death in tumour cells. Nature Reviews Cancer, 4, 592-603. Paijmans, A. J., Stoffel, M. A., Bester,
                                                                                                                                                                                                                                                               M. N., Cleary, A. C., De Bruyn, P. J. N., Forcada, J., . . . Hoffman, J. I. (2020). The genetic legacy
                                                                                                                                                                                                                                                               of extreme exploitation in a polar vertebrate. Scientific Reports, 10, 5089. Pampoulie, C., Gislason, D.,
                                                                                                                                                                                                                                                               Olafsdottir, G., Chosson, V., Halldorsson, S. D., Marianiet, S., . . . Vikingsson, G. A. (2020). Evidence of
                                                                                                                                                                                                                                                               unidirectional hybridization and second-generation adult hybrid between the two largest animals on Earth,
                                                                                                                                                                                                                                                               the fin and blue whales.Evolutionary Applications, 00, 1-8. Pease, J. B., & Hahn, M. W. (2014). Detection
                                                                                                                                                                                                                                                               and polarization of introgression in a five-taxon phylogeny. Systematic Biology,64, 651-662 Pickrell, J., &
                                                                                                                                                                                                                                                               Pritchard, J. (2012). Inference of population splits and mixtures from genome-wide allele frequency data.
                                                                                                                                                                                                                                                               PLoS Genetics, 8, e1002967. Pike, D. G., Gunnlaugsson, T., Mikkelsen, B., Halldorsson, S. D. & Vikingsson,
                                                                                                                                                                                                                                                               G. A. (2019). Estimates of the abundance of cetaceans in the Central North Atlantic based on the NASS
                                                                                                                                                                                                                                                               Icelandic and Faroese Shipboard surveys conducted in 2015. NAMMCO Scientific Publications 11. Purcell,
                                                                                                                                                                                                                                                               S., Neale, B., Todd-Brown, K., Thomas, L., Ferreira, M. A. R., Bender, D., . . . Sham, P. C., (2007). PLINK:
                                                                                                                                                                                                                                                               a toolset for whole-genome association and population-based linkage analysis.American Journal of Human
                                                                                                                                                                                                                                                               Genetics, 81, 559–575. Ramp, C. & Sears, R. Distribution, densities, and annual occurrence of individual
                                                                                                                                                                                                                                                               blue whales (Balaenoptera musculus) in the Gulf of St. Lawrence, Canada from 1980-2008. DFO Can. Sci.
                                                                                                                                                                                                                                                               Advis. Sec. Res. Doc. 2012/157. vii + 37 p (2013). Rocha, R. C., Clapham, P. J., & Ivashchenko, Y. V.
                                                                                                                                                                                                                                                               (2014). Emptying the oceans: a summary of industrial whaling catches in the 20th century.Marine Fisheries
                                                                                                                                                                                                                                                               Review, 76, 37-48. Rosenbaum, H. C., Egan, M., Clapham, P. J., Brownell, R. L. Jr, & DeSalle, R. (1997)
                                                                                                                                                                                                                                                               An effective method for isolating DNA from historical specimens of baleen. Molecular Ecology, 6, 677-681.
                                                                                                                                                                                                                                                               Roux, I., Hosie, S., Johnson, S. L., Bahloul, A., Cayet, N., Nouaille, S., . . . Safieddine, S. (2009). Myosin
                                                                                                                                                                                                                                                               VI is required for the proper maturation and function of inner hair cell ribbon synapses. Human Molecular
                                                                                                                                                                                                                                                               Genetics, 18, 4615-4628. Sabeti, P. C., Schaffner, S. F., Fry, B., Lohmueller, J., Varilly, P., Shamovsky, O.,

                                                                                                                                                                                                                                                                                                                     16
You can also read