A Mixture of ''Cheats'' and ''Co-Operators'' Can Enable Maximal Group Benefit
←
→
Page content transcription
If your browser does not render page correctly, please read the page content below
A Mixture of ‘‘Cheats’’ and ‘‘Co-Operators’’ Can Enable
Maximal Group Benefit
R. Craig MacLean1., Ayari Fuentes-Hernandez2,3., Duncan Greig4,5, Laurence D. Hurst2"*, Ivana Gudelj3"*
1 Department of Zoology, University of Oxford, Oxford, United Kingdom, 2 Department of Biology and Biochemistry, University of Bath, Bath, United Kingdom,
3 Department of Mathematics, Imperial College London, London, United Kingdom, 4 Research Department of Genetics, Evolution, and Environment, University College
London, London, United Kingdom, 5 Max Planck Institute for Evolutionary Biology, Plön, Germany

     Abstract
     Is a group best off if everyone co-operates? Theory often considers this to be so (e.g. the ‘‘conspiracy of doves’’), this
     understanding underpinning social and economic policy. We observe, however, that after competition between ‘‘cheat’’
     and ‘‘co-operator’’ strains of yeast, population fitness is maximized under co-existence. To address whether this might just
     be a peculiarity of our experimental system or a result with broader applicability, we assemble, benchmark, dissect, and test
     a systems model. This reveals the conditions necessary to recover the unexpected result. These are 3-fold: (a) that resources
     are used inefficiently when they are abundant, (b) that the amount of co-operation needed cannot be accurately assessed,
     and (c) the population is structured, such that co-operators receive more of the resource than the cheats. Relaxing any of
     the assumptions can lead to population fitness being maximized when cheats are absent, which we experimentally
     demonstrate. These three conditions will often be relevant, and hence in order to understand the trajectory of social
     interactions, understanding the dynamics of the efficiency of resource utilization and accuracy of information will be
     necessary.

  Citation: MacLean RC, Fuentes-Hernandez A, Greig D, Hurst LD, Gudelj I (2010) A Mixture of ‘‘Cheats’’ and ‘‘Co-Operators’’ Can Enable Maximal Group
  Benefit. PLoS Biol 8(9): e1000486. doi:10.1371/journal.pbio.1000486
  Academic Editor: Laurent Keller, University of Lausanne, Switzerland
  Received May 27, 2010; Accepted August 4, 2010; Published September 14, 2010
  Copyright: ß 2010 MacLean et al. This is an open-access article distributed under the terms of the Creative Commons Attribution License, which permits
  unrestricted use, distribution, and reproduction in any medium, provided the original author and source are credited.
  Funding: This work is funded by the Royal Society, Conacyt, NERC. The funders had no role in study design, data collection and analysis, decision to publish, or
  preparation of the manuscript.
  Competing Interests: The authors have declared that no competing interests exist.
  * E-mail: L.D.Hurst@bath.ac.uk (LDH); i.gudelj@imperial.ac.uk (IG)
  . These authors contributed equally to this work.
  " These authors also contributed equally to this work.

Introduction                                                                          operator has net effect S = b2c. Two defectors playing each other
                                                                                      gain no benefit and suffer no cost with net effect P = 0. Snowdrift
   Wild caught strains of yeast are polymorphic [1] for the ability                   dynamics require that T .R .S.P. Under these circumstances,
to produce the enzyme invertase. Strains with SUC2 secrete the                        the population payoff, assuming random encounters, is:
enzyme, which catalyses the hydrolysis of sucrose into glucose and
fructose. These are transported into the cell by hexose transporters
and metabolized through glycolysis [2]. By contrast, suc2 strains do                   Population payoff~x2 Rzxð1{xÞSzxð1{xÞTzð1{xÞ2 P,
not secrete invertase and, as a consequence, do not suffer the
manufacturing costs. Nonetheless, they consume the glucose and                        where x is the frequency of co-operators. Population payoff is
fructose. Both strains can also metabolize sucrose, taking it up                      maximal when:
through an active sucrose-H+ symport [3–5], but metabolism of
glucose is more efficient and preferred [6]. Those strains that                                        x~ð2P{S{T Þ=ð2ðR{S{TzPÞÞ:
secrete invertase are considered ‘‘co-operators,’’ while non-
producers are regarded as selfish ‘‘cheats’’ [2,7,8].                                 Incorporating the terms of cost and benefit, population fitness is
   The competition between these two strains has been configured                      maximal when all co-operate (x = 1). In this and related co-
as a snowdrift game [8], a sub-class of public goods game [7]. The                    operation games in the economic, social, and evolutionary sciences,
snowdrift game [9] envisages two parties stuck in a snowdrift that                    it is thus classically supposed (either explicitly or as a necessary
need to clear the snow (hydrolyze sucrose) to be able to move on                      consequence of assumed pay-offs) [10–12], and sometimes exper-
(grow). A co-operator helps shift the snow (makes invertase), while                   imentally reported [13–15], that population fitness is maximized
a defector doesn’t. There exists a benefit to clearing the way                        when cheats are absent. This understanding is encapsulated in the
(making glucose available) and a cost to shoveling snow (the cost of                  concept of the ‘‘conspiracy of doves,’’ the idea that in the hawk-dove
invertase). In its simplest form, we suppose the benefit to clearing                  game (a manifestation of the snowdrift game [16]), the population
the snow is b, the cost to removing all of the snow is c. A co-                       would be best off if all played the more cooperative non-aggressive
operator playing against a co-operator thus gains benefit b while                     dove strategy [17]. The same notion is commonly core to policy
suffering the cost c/2, with net effect R = b2c/2. A cheat playing a                  efforts aimed at maximization of co-operation and to modeling
co-operator gains the benefit b with net effect T = b, while the co-                  efforts aimed at understanding the dynamics of co-operation.

       PLoS Biology | www.plosbiology.org                                         1                        September 2010 | Volume 8 | Issue 9 | e1000486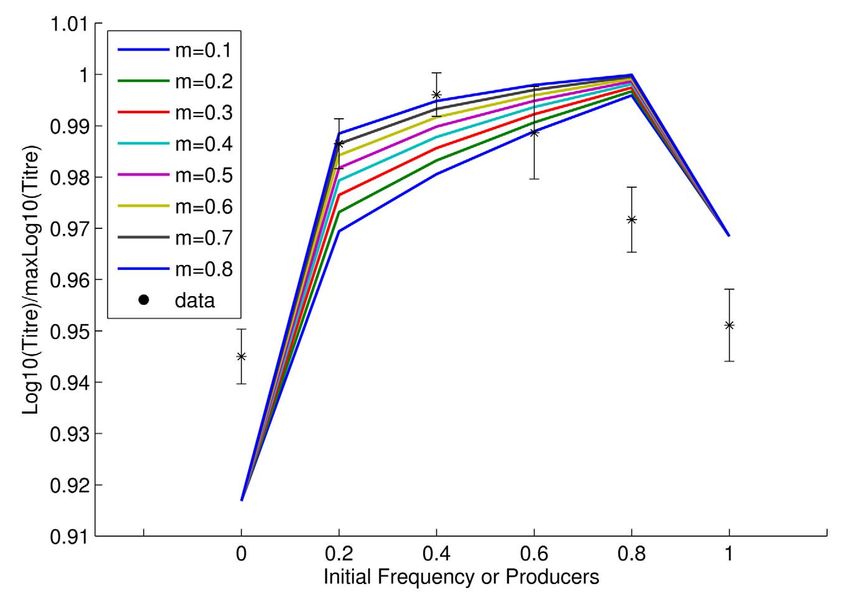
‘‘Cheats’’ Stimulate Growth

  Author Summary                                                             (w = 1.04, s.e. 0.014, n = 15, t14 = 2.72, p = 0.016). We conclude that
                                                                             invertase manufacture and secretion can be costly.
  The world is best off, it is usually presumed, when                           To test the hypothesis that invertase secretion increases mean
  everyone co-operates. However, we discovered in a                          fitness when sucrose is present, we assayed the pure culture growth
  laboratory experiment involving yeasts that a population                   rate of SUC2 and suc2 on agar plates containing sucrose (see
  can grow more and faster when there is a mix of ‘‘cheats’’                 Methods: Experimental Design B). Populations of producers have
  and ‘‘co-operators.’’ In this case ‘‘co-operator’’ cells                   a maximal growth rate of 0.56 doublings per hour (s.e. = 0.002,
  produce a protein (invertase) that breaks down sugar in                    n = 4), which is approximately 20% higher (t6 = 9.85, p,0.0001)
  the environment enabling it to be used by anyone.                          than the growth rate of non-producers grown in isolation (0.46
  ‘‘Cheats’’ eat the broken down sugar but don’t produce                     doublings per hour, s.e. = 0.01, n = 4). As the glucose produced by
  invertase and so have fewer costs. How can it be that yeast
                                                                             producers is accessible by all cells [8], we conclude that invertase
  populations do best when such apparently selfish cheats
                                                                             secretion can increase group fitness. Invertase production thus
  are common? To resolve this we constructed a mathe-
  matical model, used this to discover reasons why the                       appears to conform to the assumptions of a co-operative trait as
  classical result wasn’t found, and experimentally verified                 defined by social evolution theory.
  these conclusions. We find three conditions required to
  recover the unexpected result: (1) the ‘‘co-operators’’                    Population Fitness Is Maximal When Producers and Non-
  should get more food than ‘‘cheats’’ (e.g. if the two aren’t               Producers Co-Exist
  perfectly mixed together), (2) food is used more efficiently                  We established competition cultures of a SUC2 strain and a
  when there is a famine than when there is a feast, and (3)                 suc2 strain that were grown up overnight in YPD broth. Sucrose-
  the amount of ‘‘co-operation’’ given should not accurately                 limited 20 mL agar plates were inoculated with 20 20 mL
  match the amount needed. We argue that all three are                       aliquots of competition cultures (for more details see Methods:
  likely not to be peculiar to yeast, suggesting that ‘‘cheats’’             Experimental Designs C and D). Population fitness, measured
  may be good for a group in many cases.
                                                                             as titre of cells after all sugar is exhausted, peaks when both
                                                                             producers and non-producers are present (Figure 1). This result
                                                                             suggests a new reason why a diversity of strategies is seen in social
   The conspiracy of doves, while a commonly assumed notion, is,             interactions. In such situations, in both nature and in humans,
we note, not a necessary assumption. One can, in principle,                  it is quite common [2,7,19–21] to observe the co-existence of
consider versions of the snowdrift game in which the co-                     apparent cheats and co-operators. This is also the case for
occurrence of cheats and co-operators maximizes population                   invertase production: most strains of yeast secrete invertase, but
fitness. In examining competition between our two strains we                 approximately 10% of strains refrain [1]. Our results suggest that
indeed discovered that population net growth was not maximal                 competition between groups (the net productivity effect that we
when non-producers, the putative ‘‘cheats,’’ are absent. While this          observe) as well as within groups, mediated as negative frequency
is at odds with a considerable body of prior co-operation theory, it         dependent selection (Figure 2), can both select for a diversity of
is also necessary to ask whether what we have discovered has                 strategies. The independence of the within- and between-group
relevance beyond our system and, if so, under what conditions? To            effects needs emphasis. In a snowdrift game formulation of the
establish the underlying causes of the unexpected result, and in             yeast system, for example, co-operators and cheats can be stably
turn to understand whether it is likely to be just a curiosity of our        maintained even in approximately homogeneous environments
system, we construct a systems model of the interaction. Our                 [8]. In part this is because invertase is retained in the vicinity of
approach is to start by specifying a relatively complex and highly           SUC2 strains, ensuring that producer strains receive a dispropor-
parameterized model that can capture experimental results. This              tionate amount of free glucose. This, however, is independent
we benchmark by reference to experimental results. We then                   of any effect on population fitness, as the games predicting
attempt to modify the model across multiple parameters, so as to             polymorphism also predict maximal population fitness when
identify the necessary conditions for the recovery of the novel              cheats are absent [8].
result, as opposed to the classical result (maximal fitness when the
population consists exclusively of co-operators). We then experi-            A Systems Model
mentally confirm these conditions, where possible. Before this we
                                                                                To investigate the unexpected behavior we start by assembling
determine whether the interaction could be fairly considered a
                                                                             and validating a mathematical model of the condition, attempting
‘‘cheat-co-operator’’ system.
                                                                             where possible to respect the known biology of our experimental
                                                                             system.
Results                                                                        Growth kinetics. In our model, both strains take up
                                                                             resources R and convert it into ATP using a simple, unbranched
Invertase Production Is Costly But Can Increase Fitness
                                                                             metabolic pathway (see e.g. [22]). The rate of ATP production in
  If invertase secretion is a co-operative trait, we would expect
                                                                             the pathway is denoted by JATP and is given by:
that invertase secretion increases the average fitness of the group at
a direct cost to individuals that secrete the enzyme. To test the
                                                                                                       J ATP ~nR  : R
hypothesis of a direct cost, we competed a producer strain of yeast                                            ATP J ,
that carries a single active SUC2 gene against an isogenic non-
producer mutant that refrains from invertase secretion (suc2). We            where JR denotes the rate of the pathway which is a function of
make use of the fact that invertase production is conditional on             resource concentration R and is mathematically represented as
extra-cellular glucose levels [18]. By performing the competition in         JR(R). The term nRATP denotes the number of ATP molecules
a glucose-limited chemostat (see Methods: Experimental Design                produced in the pathway. The yield of ATP production is known
A), we can thus induce invertase secretion, without any possible             to depend on the rate of resource uptake, termed rate-yield trade-
                                                                                                                               R
benefit of invertase secretion, as no sucrose is present. In this            off; therefore, nR
                                                                                              ATP is a decreasing function of J . In Bauchop and
experiment the suc2 mutant strain enjoys a 4% fitness advantage              Elsden [23] it was observed that if microbes are limited by their

       PLoS Biology | www.plosbiology.org                                2                     September 2010 | Volume 8 | Issue 9 | e1000486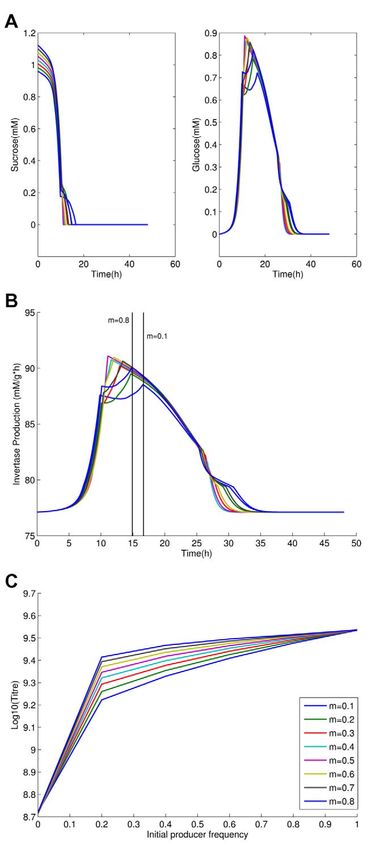
‘‘Cheats’’ Stimulate Growth

Figure 1. Final population size (Log(titre, normalized to maximum observed titre)) after exhaustion of resources as a function of
initial invertase producer frequency, in theory (lines) and practice (points (*); mean ± s.e.m.; n = 9). Observed data fit a quadratic
function better than a linear function (F2,3, = 41.3, p,0.01).
doi:10.1371/journal.pbio.1000486.g001

                                                                              energetic resource, the amount of biomass formed per unit of ATP
                                                                              is approximately constant and does not depend on the mode of
                                                                              ATP production. Therefore, as highlighted by Pfeiffer and
                                                                              Bonhoeffer [22], if the rate of ATP production increases, the
                                                                              rate of biomass formation and thus the growth rate of an organism
                                                                              also increases. This implies that the microbial growth rate can be
                                                                              represented as a linear function of the rate of ATP production,
                                                                              namely r?JATP, where r is some proportionality constant. Here we
                                                                              take r = 1.
                                                                                 In practice yield of ATP production nR   ATP is not as easy to
                                                                              measure as the efficiency, nRe whereby

                                                                                                             R :
                                                                                                        nR
                                                                                                         e ~nATP b,

                                                                              where b is a constant denoting the amount of biomass formed per
                                                                              unit of ATP. Therefore throughout the article, we consider rate-
                                                                              efficiency instead the rate-yield trade-off.
Figure 2. Relative producer fitness as a function of initial                     Sucrose utilization. Both yeast strains can take up sucrose (S)
frequency in theory (lines) and practice (points (*); mean ±
s.e.m.; n = 3). Asterisks represent poorly mixed cultures (m low) while       through an active sucrose-H+ symport, which is shown to be
data points marked with an x represent better mixed cultures (m high).        mediated by two different transport systems: high-affinity uptake
doi:10.1371/journal.pbio.1000486.g002                                         mediated by AGT1 permease and the low affinity pathway mediated

       PLoS Biology | www.plosbiology.org                                 3                    September 2010 | Volume 8 | Issue 9 | e1000486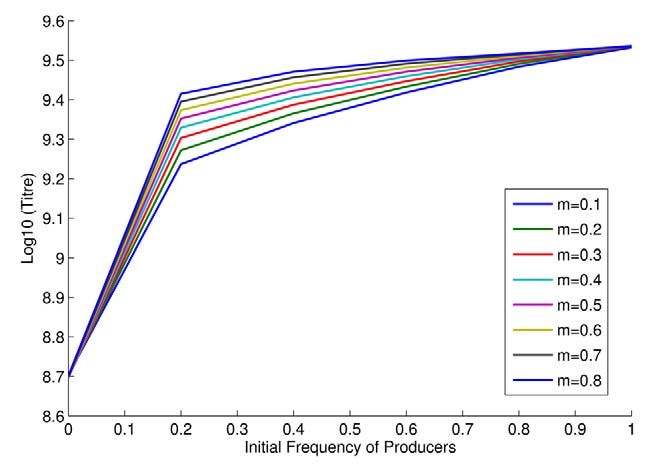
‘‘Cheats’’ Stimulate Growth

by MALx1 maltose transporters [5,24]. Sucrose is a disaccharide and                    G        F
                                                                              Here Vmax     (Vmax  ) denotes the maximal rate of the pathway for
is transported into the cell slowly and inefficiently. The rate of this       glucose (fructose), while KmG and KmF denote the respective
pathway is denoted by JS and its efficiency by nSe .                          Michaelis-Menten constants. The preferential uptake of glucose
   Note that while yeast SUC knockout strains do not use internal             over fructose [33–35] we model as competition for this site using
invertase to hydrolyses sucrose, they can nonetheless metabolize it           competition constants KcG and KcF . When there is no competition
efficiently using internal maltase [25], this being the normal mode           both F/KcG = 0 and G/KcF = 0 and the classical Michaelis-Menten
of sucrose utilization for yeast species lacking invertase [26–28]. A         kinetics are recovered.
further possibility that we don’t model, however, is that sucrose is             The pathway rate represents the rate at which product is
hydrolyzed under acidic conditions outside of the cell in a non-              formed, which in this case is the same as the rate at which
enzymic process, with glucose and fructose then taken up in the               substrate is consumed. Therefore throughout this article we refer
normal manner. Given both that we employ a buffered medium                          G
                                                                              to Vmax     F
                                                                                       (Vmax  ) as the maximal rate of glucose (fructose) uptake and
and that the half-life of sucrose under our experimental conditions           KmG (KmF ) as the measure of affinity for glucose (fructose). The
is 440 years [29], this doesn’t seem especially likely. Several points        efficiency of the pathway utilizing glucose and fructose is denoted
of evidence support this supposition. Notably, suc2D strains with-            by nHxt
                                                                                    e , which is a function of both glucose and fructose uptake
out maltase cannot grow on sucrose [25], while suc2D missing the              rate, and hence we write nHxt        G F
                                                                                                            e ( J +J ). Yeast exposed to abundant
hexose import channels (necessary for glucose/fructose uptake                 hexose convert it inefficiently into growth compared with those
from the exterior) grow well [4]. This suggests that internal                 exposed to lower hexose levels [36,37]. We term this a rate-
maltase metabolized sucrose is needed, while external acid-                   efficiency trade-off, where an increase in resource uptake rate
hydrolyzed sucrose is not sufficient to support the growth we                 leads to a decrease in the number of cells created per unit of
observe of non-producers.                                                     resource, and therefore nHxte   is a decreasing function of JG+JF. Note
   Invertase production. Invertase producers secrete invertase,               that ethanol production is negligible and is not considered when
which catalyzes the hydrolysis of sucrose (S) into glucose (G) and            modeling hexose metabolism.
fructose (F), monosaccharides which are transported into the cell                To predict densities of the co-operator/producer (Np) and
[30]. The rate of conversion of sucrose into glucose and fructose             cheat/non-producer (Nn) strains in a well-mixed environment, we
(Inv) is assumed to have the following form:                                  then use equation:

                     Inv~inv J G :S ðkzSÞ,                                         dS
                                                                                       ~{J S :(Np zNn ){Inv:Np ,
                                                                                   dt
where inv denotes invertase activity, which is known to be a
                                                                                   dG
function of glucose consumption rate [18]. Here we also assume                         ~{J G :(Np zNn )zInv:Np ,
that the rate of sucrose degradation is a saturating function of                   dt
sucrose concentration with k denoting a saturation constant and                    dF
                                                                                       ~{J F :(Np zNn )zInv:Np ,                   ð1Þ
we take k = 1024. Note that invertase production is conditioned                    dt
not on sucrose levels (as would seem optimal) but on local glucose                 dNp
levels, high glucose suppressing invertase production, an absence                       ~(1{cInv ):(nHxt  G  F : G    F   S: S :
                                                                                                     e (J zJ ) (J zJ )zne J ) Np ,
                                                                                    dt
of glucose resulting in a residual low level production and medium
levels stimulating invertase.                                                      dNn                F : G        S: S :
                                                                                        ~(nHxt  G             F
                                                                                           e (J zJ ) (J zJ )zne J ) Nn :
   Invertase is costly to produce and the cost function (cInv) varies               dt
with glucose level in the following way cInv = inv( JG)UInv, where UInv       In addition, to model our experimental setup, we consider both
denotes the unit cost of invertase, which is a function of invertase          the initial spatial structure of otherwise immotile yeast cells as well
activity. As invertase activity increases we assume that production           as the movement of sugars by diffusion. The spatial structure is
per unit invertase becomes more costly as every invertase molecule            modeled phenomenologically using the mixture parameter
made means one molecule of some other important protein is not                0#m#1. This parameter captures the extent to which cells of a
made [31,32].                                                                 given type have a different type as a possible neighbor, such that
   Glucose and fructose utilization. Glucose and fructose are                 when m = 0 the two strains are spatially segregated, while when
transported into the cell by hexose transporters. We assume that              m = 1 the two strains are perfectly well-mixed. For 0,m,1 the
there is one non-specific site available for glucose and fructose to          environment can be approximately considered as if consisting of
bind. Yeast utilizes glucose as a preferential carbon source and the          three different regions: region 1, where producers are surrounded
preferential uptake of glucose over fructose [33–35] is modeled as            only by their own type; region 2, where non-producers are
competition for this site in the following way. The rate of the               surrounded only by their own type; and region 3, where producers
hexose pathway when glucose is transported is defined by                      and non-producers are neighbors. The proportion of all cells in
                                                                              region 3 approximates to m. Our two mixing regimes on agar
                                   G :
                                  Vmax G                                      plates do not have precise representations as regards the
                      JG~                  ,                                  parameter m but can be considered m high or m low.
                                      F
                            KmG :(1z G )zG                                       As resources diffuse through the environment, the spatial
                                     Kc
                                                                              structure of the population is not alone enough to reflect the spatial
where the rate of the same pathway when fructose is transported is            distribution of resources. In our model the ‘‘movement’’ of
defined by                                                                    resources is dependent on the diffusion rate, D, which reflects the
                                                                              rate at which resources available to one strain become available to
                                                                              the other by moving through regions 1, 2, and 3. Note that
                                  V F :F                                      secreted invertase remains localized between the cell membrane
                     JF ~         max   :
                                      G                                       and the cell wall, and therefore the enzyme itself does not diffuse.
                            KmF : 1z F zF
                                     Kc                                       This leads to the expansion of the model (1) into

       PLoS Biology | www.plosbiology.org                                 4                     September 2010 | Volume 8 | Issue 9 | e1000486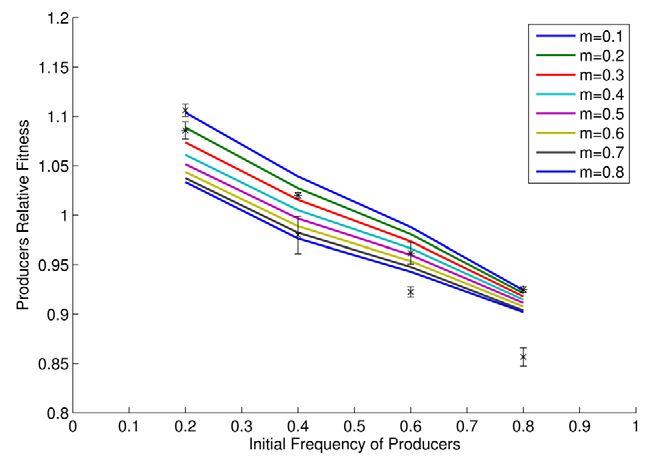
‘‘Cheats’’ Stimulate Growth

dS1                           D 1        1                                   our knowledge is unique to this model. Note too that the model
     ~{J S1 :N1p {Inv:N1p z ( :S2 z :S3 {S1 ),
 dt                           2 2        2                                   was not constructed in a manner designed to recover this result but
dS2                 D   1      1                                             rather to reflect known details of the biology and biochemistry of
     ~{J S2 :N2n z ( :S1 z :S3 {S2 ),                                        yeast. That such an ‘‘end-blind’’ model can capture unexpected
 dt                 2 2        2
                                                                             experimental results suggests it to be fit for purpose.
dS3                                  D 1          1
     ~{J S3 :(N3p zN3n ){Inv:N3p z ( :S1 z :S2 {S3 ),                           This result is also, at least in theory, independent of the
 dt                                   2 2         2                          definition of population fitness. The population fitness we defined
dG1                              1       1                                   above as the total cell productivity after all sucrose is exhausted.
          G1 :
     ~{J N1p zInv:N1p zD( :G2 z :G3 {G1 ),                                   This is equivalent to population fitness for K selected organisms.
 dt                              2       2
dG2                    1       1                                             Were r selection more relevant, one might prefer to consider
     ~{J G1 :N2n zD( :G1 z :G3 {G2 ),                                        population growth rate (per unit time) instead. Using this
 dt                    2       2                                             definition of population fitness does not, at least in theory,
dG3                                      1        1                          importantly affect our conclusion that population fitness is
     ~{J G3 :(N3p zN3n )zInv:N3p zD( :G1 z :G2 {G3 ),
 dt                                      2        2                          maximal when producers and non-producers co-exist (Supple-
dF1                              1      1                                    mentary Result 1a). Model results for the total population growth
     ~{J F1 :N1p zInv:N1p zD( :F2 z :F3 {F1 ),              ð2Þ              are reported in the article and for population growth rate in
 dt                              2      2
                                                                             Supporting Information (see Supplementary Results 1a–e).
dF2                    1      1
     ~{J F1 :N2n zD( :F1 z :F3 {F2 ),                                           We can further establish whether the model is fit for purpose by
 dt                    2      2                                              examining additional predictions. Our model, for example,
dF3                                     1        1                           predicts negative frequency dependence of relative fitness
     ~{J F3 :(N3p zN3n )zInv:N3p zD( :F1 z :F2 {F3 ),
 dt                                     2        2                           (Figure 2). Although in contrast to Hamilton’s theoretical result
dN1p                                               S1 : S :
                                                                             [38] that inclusive fitness of co-operators is not a function of co-
      ~(1{cInv ):(nHxt    G1   F1 : G 1     F1
                   e (J zJ ) (J zJ )zne J ) N1p ,
                                                         1                   operator frequency, this result is not without precedent (e.g.
  dt
                                                                             [8,39,40]). Our competition experiments between isogenic SUC2
dN2n                 F2 : G 2           S2 : S :                             and suc2 knock-out strains of yeast confirm that selection for
      ~(nHxt   G2                 F2
         e (J zJ ) (J zJ )zne J ) N2n ,
                                               2
  dt                                                                         invertase production is indeed negatively frequency-dependent
dN3p                                               S3 : S :                  (Figure 2; F1, 20 = 290, p,161024). Our model also predicts that
      ~(1{cInv ):(nHxt    G3   F3 : G 3     F3
                   e (J zJ ) (J zJ )zne J ) N3p ,
                                                         3
                                                                             increasing population structure modestly increases relative fitness
  dt
                                                                             of producers, as a higher proportion of glucose goes to the
dN3n                 F3 : G 3           S3 : S :
      ~(nHxt   G3                 F3
         e (J zJ ) (J zJ )zne J ) N3n ,
                                               3                             producers (note different intercepts of approximately parallel lines
  dt                                                                         in Figure 2). This result is also confirmed by our experiments
where the subscript i = 1, 2, 3 denotes the spatial region i discussed       (Figure 2; F1, 20 = 13.96, p = 0.0013).
                                                                                Given the observed negative frequency dependence, our model
above.
                                                                             can also predict the stable equilibrium frequencies of producers
   The model was parameterized where possible using known
                                                                             and non-producers under different experimental regimes, these
biochemical rate constants. Where the form of a curve was known
                                                                             occurring when the relative fitnesses are the same. By fitting a
but exact parameters unknown, these were estimated from simple
                                                                             quadratic function to the observed data in Figure 2, for high m the
growth experiments (see Supplementary Methods 1 in Text S1).
                                                                             experimental equilibrium is estimated to be around 0.38
For each simulation we consider the same starting concentration
                                                                             producers. The model predicts for m between 0.5 and 0.8 an
of sucrose Sin (2% unless stated otherwise) and the same starting            equilibrium in the range of 0.31–0.39. For low m the observed
number of cells Nin but vary both the ratio of producers to non-             equilibrium position is estimated to be around 0.46, the predicted
producers ( f ) and the degree of mixing (m). This leads to the              range (m from 0.4–0.1) is between 0.42 and 0.55. We conclude that
following initial conditions:                                                the model has a respectable ability to quantitatively predict
                                                                             equilibrium frequencies. At equilibrium the population is predict-
   S1 ð0Þ~ð1{mÞfSin ,S2 ð0Þ~ð1{mÞð1{f ÞSin ,S3 ð0Þ~mSin ,                    ed to have higher fitness than a population of all producers. The
                                                                             model equilibrium frequencies are not the same as those that
   N1p ð0Þ~ð1{mÞfNin ,N2n ð0Þ~ð1{mÞð1{f ÞNin ,N3p ð0Þ~                       maximize population fitness. At equilibrium, there thus remains a
   mfNin ,N3n ð0Þ~mð1{f ÞNin :                                               conflict between individual and group ‘‘best interests’’.

The simulations are run until resources are exhausted. This is the           Assumptions of Benefits and Costs and the Peculiar
relevant termination condition both for our circumstance and also            Behavior of Population Titre
more generally for consideration of finite resources. The model                 Why does this model find that apparent cheats promote
does not hence ask about evolutionary stability, as evolutionarily           population growth where a prior snowdrift formulation did not
stable conditions need not be found prior to the exhaustion of a             (for comparison of this prior model and experimental results with
limited resource (what may be considered immediate population                ours see Supplementary Results 2) [8]? Might it be a consequence
stability, in the sense that the population size is fixed and cannot         of features specific to yeast and incorporated in our model or
grow). The model can, however, predict when the starting                     might it be owing to factors that are likely to be more broadly
frequencies of producers and non-producers are the same (i.e.,               applicable? To approach this we modify the model so as to
when relative fitness = 1) and hence when stable equilibrium will            determine the necessary conditions for the maintenance of the
be seen after multiple iterations of seasonality.                            core result, namely that population growth is maximal in the
                                                                             presence of non-producers.
Benchmarking the Model                                                          Our model makes assumptions about costs and benefits that are
  The model captures the population fitness maximization when                appropriate for our situation but that are typically not configured
non-producers are present (Figure 1), a property that to the best of         in the more general-purpose heuristic models of co-operation

       PLoS Biology | www.plosbiology.org                                5                    September 2010 | Volume 8 | Issue 9 | e1000486
‘‘Cheats’’ Stimulate Growth
discussed above. We highlight two evident differences. First, assumption that population fitness is highest in the absence of
snowdrift assumes the benefit to be fixed and constant, such that cheats (Figure 3a). We can test the proposal that the rate-efficiency
the b term is the same for all players gaining a benefit. More trade-off is important by making use of a particular feature of
generally, game theoretical models usually presume that each unit yeast’s metabolism, namely that at very low sucrose levels the rate
of resource gained represents one unit of benefit. This is not true in efficiency trade-off is very weak or non-existent [37]. We thus
yeast. While the growth rate is dependent on glucose concentra- repeated our experiments at a very low sucrose level (0.01%)
tions, high local concentrations lead to inefficient utilization on a (Experimental Design E) and observe just the predicted behavior
per molecule basis. (Supplementary Results 3a). This does not, however, mean that
Similarly, the snowdrift game considers costs to be equally shared the space in which maximal population fitness is associated with a
by all co-operators, that cost is linearly proportional to work done, mixture of producers and non-producers need be limited. If we
and that there is a fixed total cost to removal of snow, this dictated consider an intermediate sucrose level, for example, we experi-
by the amount of snow to be shoveled (e.g. co-operators stop mentally recover the humped distribution (Supplementary Results
shoveling when the road is cleared). Importantly, yeast are prone 3b), as predicted.
to violating this last assumption as they adjust their invertase The rate-efficiency trade-off matters most if one considers the
production to the local glucose level, not to the sucrose level, temporal trajectory of co-operation and population growth. When
ensuring a disconnect between the amount of ‘‘co-operation’’ producers are especially common, the invertase production results
needed (sucrose to be digested; snow to be shoveled) and the amount in a large immediate spike, both spatial and temporal, in glucose.
of ‘‘co-operation’’ offered (invertase production; snow shoveled). This would enable rapid but inefficient growth. If we replace a few
Might modification of either of these biologically verified producers with non-producers, the glucose spike would be smaller,
assumptions explain why non-producers stimulate population so the population burns the finite resource more efficiently. The
growth? Leaving the observed costs in place, we find that removal net effect then is to ensure sucrose is more efficiently converted to
of the assumption of the rate-efficiency trade-off restores the usual growth, but only if there is a rate-efficiency trade-off.
Figure 3. The role of the rate-efficiency trade-off and the dynamics of sugar metabolism. (a) Expected final population size (Log(titre))
after exhaustion of resources as a function of initial producer frequency in the absence of rate-efficiency trade-off. The temporal glucose spike, with
glucose measured in mM/agar and time represented in hours, (b) when initially all the population are producers and (c) when 80% are producers with
glucose measured in mM/agar and time is in hours. Note that the spike in (c) is lower and longer-lived, hence glucose is used more efficiently. (d)
Efficiency of hexose usage by producers (g protein/mM hexose) when non-producers are present (80:20 ratio: left hand panel) and when they are
absent, i.e. 100% producers (right hand panel). Here we average across spatial structures.
doi:10.1371/journal.pbio.1000486.g003
PLoS Biology | www.plosbiology.org 6 September 2010 | Volume 8 | Issue 9 | e1000486‘‘Cheats’’ Stimulate Growth
Consistent with this explanation, when producers are common,
a high but short-lived temporal (and spatial) peak in free-glucose is
observed in the model (Figure 3b), compared with the rather
slower and more protracted production seen when producers are a
little less common (Figure 3c). An even lower level of producers
ensures, however, that internally metabolized sucrose is the
predominant nutrient and this is also inefficient. As then expected,
the efficiency (conversion of hexose to protein) of producers is
radically degraded when the spike in glucose is observed, while a
relatively small reduction is seen when cheats are present, even in
an 80:20 mix (Figure 3d).
From examination of the time course we also observe that
sucrose is typically exhausted early on, but with invertase
production being conditional on low glucose import rates, the
producers make expensive, but useless, invertase through much of
the latter part of the experiment (Figure 4a–b). To employ the
metaphor of the snowdrift game, they are shoveling snow after the
path is cleared. If invertase production is costly, producers thus
retard population growth rates once all the sucrose has been
hydrolyzed. We should then expect that the population titre peak
is more likely to disappear as costs tend to zero. Indeed, we
observe this in the model (Figure 4c).
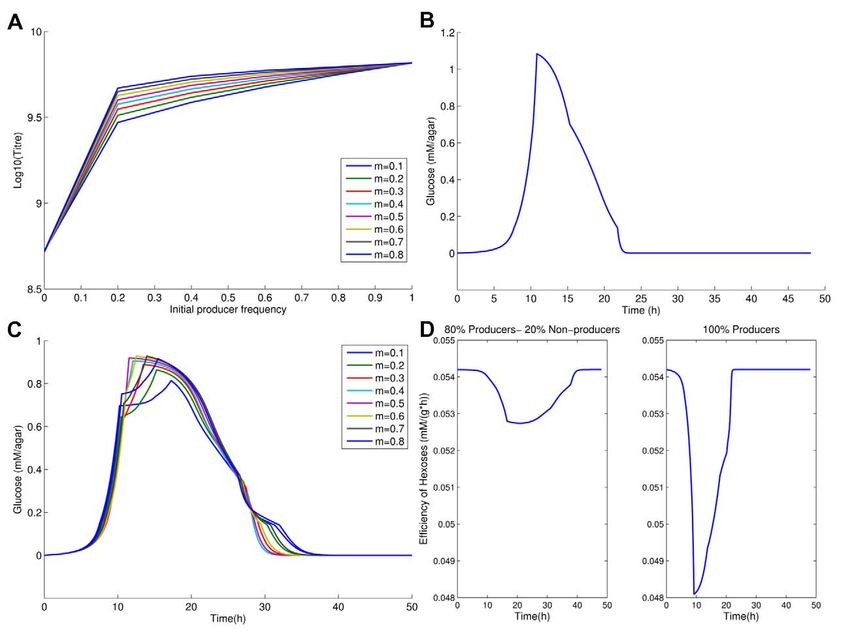
Moreover, if yeast make invertase at a rate dependent upon the
amount of sucrose available (and don’t make invertase when
sucrose is absent), we might also expect to find the classical result
of maximum productivity when cheats are absent. To examine this
we consider a model in which invertase production follows
Michealis-Menten dynamics as a function of sucrose levels, rather
than glucose levels, with zero production when sucrose is absent.
This is equivalent to yeast having perfect information. As expected
we find that, even with a rate-efficiency trade-off and costly
invertase production, maximum population productivity occurs in
the model when cheats are absent (Figure 5). Thus imperfect
information can also yield the unexpected result. While we provide
an experimental test of the other predictions of our model (see
above and below) this one is not obviously amenable to
experimental manipulation.
Aside from these two assumptions, we also model a spatially
structured population. This is expected to be important as well-
mixed populations share resources equally. To this end we can
consider what happens when m = 1. When this occurs the model
again recovers the classical result. This prediction we test by
considering what happens in very well shaken flasks (Experimental
Design F), this providing the best approximation of an absence of
population structure. As predicted, in well-mixed populations
there is no evidence (to any measureable degree) that population
fitness is highest when producers and non-producers co-exist
(Supplementary Results 4).
The Economics of Inefficiency
The above demonstrates that three features are required to
recover our non-classical result, that population fitness is maximal
in the presence of non-producers. Modifications of some of these Figure 4. The importance of costly invertase production and its
features can be seen as removal of an inefficiency that would coupling with sucrose levels. (a) Sucrose and glucose levels (mM/
otherwise retard population group when producers are especially agar) across the time course of the experiment (in the vicinity of region
common: the rate-efficiency trade-off ensures that glucose isn’t 3); (b) corresponding invertase production levels (mM glucose/g
used as efficiently as it might be; the costly invertase production protein/hour); time of sucrose exhaustion is indicated by vertical black
lines for m = 0.8 and m = 0.1. Note sucrose has disappeared relatively
being uncoupled to sucrose levels provides an evident inefficiency.
early but invertase is still produced thereafter; (c) expected final
Population structure contributes to inefficiency by ensuring that population size (Log(titre)) after exhaustion of resources as a function of
some cells suffer costs while reaping poor benefits, owing the rate- initial co-operator frequency when cost of invertase production is
efficiency trade-off and being exposed to the spike in glucose. reduced from 4% to 2% for invertase production of 86.7 mM glucose/g
Given this, why is it that removal of just one inefficiency, leaving protein/hour that is 12% higher than the base-level invertase
others, can restore the classical result? To see this consider that, production.
doi:10.1371/journal.pbio.1000486.g004
while producers may be inefficient in some regards, they also
PLoS Biology | www.plosbiology.org 7 September 2010 | Volume 8 | Issue 9 | e1000486‘‘Cheats’’ Stimulate Growth
constraints may apply elsewhere. That yeast invest in invertase
production when such production isn’t needed may not reflect an
underlying inability of yeast to sense sucrose. Evidence suggests
that yeast can sense sucrose through GPR1 [45,46]. However, the
same receptor is used to sense glucose. The problem may thus be a
constraint whereby they cannot discriminate sucrose concentra-
tions from glucose levels. Others sources of constraint-based
informational inaccuracy would include an inability to directly
detect the amount of invertase needed (i.e. absence of sucrose
sensing) and, if they had a means to sense sucrose alone, error in
any such assessment. Constraints of the above form may well be
commonplace in non-conscious beings and in any circumstance
where perfect information is lacking.
Alternatively invertase over-production may have an individual-
level adaptive explanation, rather than a constraint-based
explanation. That, for example, yeast secrete invertase in the
absence of sucrose and glucose may be an adaptation to ensure a
Figure 5. Theoretical expectations for titre when invertase rapid response should sucrose become available. If an adaptive
production matches sucrose levels (perfect information). explanation for an uncoupling between the amount of co-
doi:10.1371/journal.pbio.1000486.g005 operation needed and the amount offered is of some validity,
then inappropriate levels of co-operation may well be common-
place. For the reasons above, we consider informational
diminish an inefficiency, as they convert inefficiently used sucrose
inaccuracy (or an uncoupling between level of co-operation
into more efficiently used glucose. The question is not whether
needed and the level offered) to be of broad relevance. For similar
there are any inefficiencies but rather whether their net braking
reasons, we note a necessary caveat that, as with all experimental
effects outweigh their net accelerating effects (removal of
evolution, what we observe in the laboratory setting need not
inefficiency). Importantly modification of just one cost/inefficiency
reflect what happens in the wild, i.e. in the context where the
has consequences for the others, potentially amplifying effects. For
pattern of invertase production is expected in some manner to be
example, removal of cost has the direct consequence of faster
optimal.
growth of producers. However, as a knock-on effect, the
The assumption that the population is structured is likely to
population uses less sucrose, thus diminishing a further inefficien-
almost always be the case. Indeed, in the case of yeast, invertase is
cy. The effect is non-trivial, however, as it is further modulated by
maintained in proximity of the producing cells [8]. There could
the rate-efficiency trade-offs.
thus be population structure as regards access to glucose, even if
not as regards cell proximity, even in liquid culture. It was this that
Discussion in part motivated our choice of vigorously shaken flasks for
While the dynamics of the situation are rather too complex to be examination of the absence of population structure.
captured fully by the above simple verbal explanations, these Another way to consider the generality of the result is to ask about
results do show that to understand the dynamics of social behavior the changes needed to the assumptions of simple snowdrift game to
in this circumstance it was helpful to have started by considering a possibly recover our result. From the equation for population fitness,
model incorporating the details of the biology of our given we can establish that for population fitness to be maximal when
circumstance. Moreover, the above can be seen as a successful case cheats and co-operators co-exist requires that S+T.2R. Why then
history for a modeling approach in which fitness is permitted to might this be so? Our circumstance suggests a few possible
emerge from the underlying biochemistry, rather than being generalizable extensions. First, the findings suggest the relevance
imposed or assumed. That this, in addition, captures new insight of permitting different benefit terms for co-operators when meeting
into co-operation dynamics suggests that our approach may be co-operators, for defectors meeting co-operators, and for co-
worth exploring in other contexts. operators meeting defectors. The last two are different not least
We should, however, also ask whether there are lessons from because of the spatial structure ensuring different exposure to
yeast that might be relevant elsewhere? In circumstances where sucrose and glucose of the two cell types. The net effects on S, T,
growth is dependent upon a finite resource, a trade-off between and R are not trivial. However, we can see why T might be
the availability of publicly accessible resources and the efficiency increased while R is decreased. If both producers and non-
with which they are used is likely to be commonplace. This is true producers see the same net amount of glucose, but the temporal
for social scientific, economic, and evolutionary conditions. In the dynamics are such that producers have this all in one brief shot, then
case of microbial metabolism, a trade-off between rate of resource we expect, from the rate-efficiency trade-off, that the benefit going
uptake and efficiency will always exist because of thermodynamic to the producers would be lower than to the ‘‘cheats.’’ The former
constraints on metabolism [40–42], ensuring that resources will burn it up rapidly and inefficiently, while the latter use it more
always be used less efficiently when they are abundant (see also slowly and more economically. Such a trend would act to increase T
[43]). Rate-efficiency trade-offs are also known to be a feature of and decrease R and S. However, simple extrapolation is not
human societies: food is wasted less when there is a famine. A rate- obviously warranted, as making the assumption that all cells see
efficiency trade-off, we suggest, would be a valuable assumption equal net amounts of glucose is hard to defend. Nonetheless, it is
for heuristic models to make (see also [44]). clear that b should not be considered a constant and that rate-
What about yeast’s inability to shut down invertase production efficiency trade-offs will have effects on the dynamics.
immediately upon sucrose exhaustion? Does this have general We should also not assume that the cost suffered by a co-
relevance? To approach this issue, it is helpful to understand why operator when playing a fellow co-operator must be c/2, c being
yeast behave in the manner they do and whether similar the cost suffered by a co-operator when playing a defector. This is
PLoS Biology | www.plosbiology.org 8 September 2010 | Volume 8 | Issue 9 | e1000486‘‘Cheats’’ Stimulate Growth
equivalent to saying that the net cost of co-operation is not fixed. filter was removed from each agar plate after 4 h, 24 h, 30 h, and
In our case, as invertase is produced dependent upon glucose levels 48 h. Filters were vortexed in sterile saline for approximately 30 s to
and more of the sucrose is converted to glucose when everyone is a form a cell suspension that was diluted down and plated out YPD
producer (otherwise sucrose is just consumed directly), the cost plates to determine cell titre on each disk. Growth rate was
term for the co-operators against the co-operators may well be calculated as the slope of population doublings against time during
greater than c/2. If so, the difference in the cost terms in functions the exponential phase of growth. Results from the 10% and 2%
R and S relatively is reduced, effectively raising S and reducing R sucrose plates were combined because growth rates were equal on
from the simple formulations. these two media for both strains.
The above all suggest rather general cases where it becomes
more likely that S+T.2R. These game theoretical formulations Experimental Design C
are, however, too inexact to make precise specifications for our We established competition cultures of a SUC2 strain and a suc2
current context, as costs and benefit terms are both frequency strain that were grown up overnight in YPD broth. 20 mL agar
dependent and the temporal dynamics of sugar usage seem also to plates, containing 20 g/L (2%) sucrose, were inoculated with 20
be important. Indeed, in our example and perhaps in others, the 20 mL aliquots of competition cultures in a standardized 5 by 4
language of ‘‘cheat’’ and ‘‘co-operator’’ obscures the reality. When array. We consider two population structures. In the mixed
the addition of more invertase producers reduces the fitness of all, population treatment, each aliquot on a plate consisted of the same
it is hard to see invertase production as co-operation, even if it mix of both SUC2 and suc2. In the structured treatment each
behaves in a more classical co-operative manner, benefitting all, aliquot on a plate consisted of either SUC2 or suc2. In total 12
when rare. We suggest that incorporation of both resource competitions were carried out on mixed as well as structured
utilization efficiency (see e.g. [44]) and inaccuracy of information plates. For the mixed treatment, starter cultures were mixed to
(see e.g. [47]) is likely to be both more realistic for multiple form competition cultures where each aliquot consisted of a fixed
circumstances and potentially important to understand the proportion of SUC2, with the following cases being considered
dynamics of putatively co-operative social interactions under a 20%, 40%, 60%, and 80% of SUC2. For the structured treatment,
broad range of circumstances. cases considered were 20%, 40%, 60%, and 80% of aliquots
containing only SUC2 while the rest of respective aliquots
Materials and Methods contained suc2. In this treatment, the position of suc2 and SUC2
aliquots on the array was randomized.
The experiments have been conducted using a yeast model After all sugar was exhausted (population growth had ceased)
system developed in Greig and Travisano [2]. It consists of two the content of each agar plate was homogenized by washing cells
isogenic yeast strains, SUC2 (a/a, leu2/leu2, his5/his5, ura3/ura3, off of the plate in 3 mL of sterile saline. The fitness of SUC2 and
SUC2/SUC2) and suc2, an isogenic diploid strain in which both suc2 was determined by quantitative PCR on DNA extracted from
copies of SUC2 have been replaced by KanMX. SUC2 secretes the samples taken before and after competition. To estimate net titre,
enzyme invertase required to catalyze hydrolysis of sucrose into cells were serially diluted and spread on YPD plates to accurately
glucose and fructose and is therefore termed producer or co- determine cell numbers at the end of the experiment.
operator, while the other strain suc2 refrains from secreting invertase
and is termed non-producer or cheat. For all experiments, yeast Experimental Design D
were grown in supplemented minimal medium (5 g/L ammonium The methods for this experiment were the same as for
sulphate, 1.7 g/L yeast nitrogen base, 50 mg/L uracil, 20 mg/L Experiment C with the following exceptions. 20 mL agar plates,
histidine, 50 mg/L leucine) containing agar (16g/L), sucrose, and containing 2% sucrose, were inoculated with single aliquot of
glucose when necessary. All cultures were grown at a temperature of competition culture containing 1.26105 cells evenly spread across
30uC and liquid cultures were shaken using an orbital incubator the entire plate. We considered the cases where each aliquot
(150 rpm). For further details of strains see [2,7]. contained SUC2 at an initial frequency of 0%, 20%, 40%, 60%,
80%, and 100%. After 2 d of incubation, the content of the agar
Experimental Design A plate was homogenized by washing off cells in 3 mL of sterile
SUC2 and suc2 were competed against each other for 24 h in 16 saline. To determine titre, we plated serial dilutions of this
chemostats supplied with glucose-limited culture medium (0.8 g/L) homogenized sample on YPD agar plates.
incubated with continuous shaking and aeration. Dilution rate The titre data from Experiments C and D were subsequently
varied between 0.2 and 0.4 per hour. Using these conditions, normalized to maximum observed titre in each set-up before
glucose uptake rate is between 0.2 and 0.4 mmol/gram/hour [37], presenting in Figure 1.
which induces the secretion of invertase in SUC2 cells [18] so that
invertase makes up approximately 0.1% of cell protein. Quantita- Experimental Design E
tive PCR and DNA extracted from samples taken from each Starter cultures of SUC2 and suc2 were grown up for 2 d in
chemostat before and after competition was used to measure the liquid YPD medium, and then samples were diluted down and
change in the abundance of suc2 and SUC2 during competition. plated to yield single colonies on YPD agar, which were counted to
Fitness was calculated as the ratio of population doublings during determine the original cell density in the starter cultures. Mixtures
competition (w). of these starter cultures were made corresponding to 100%, 80%,
60%, 40%, 20%, and 0% by volume of the SUC2 culture, and
Experimental Design B these were diluted 10-fold with sterile water. 13 ml of each of these
Starter cultures of SUC2 and suc2 were grown up overnight in diluted mixtures was pipetted onto the centre of 20 ml plates
liquid YPD medium. Starter cultures were then diluted down 1024 containing 0.1% or 0.01% sucrose. These plates were incubated
and each strain was inoculated onto 2 mM filters (Milipore, UK) that for 7 d, then the patch of cells in the middle of each plate was cut
were placed on agar plates containing 100 g/L sucrose (10%) or out of the agar using a sterile scalpel and placed into 5 ml of sterile
20 g/L sucrose (2%). Each strain was spread onto four filters on two water in a capped test-tube. These test-tubes were vortexed
agar plates of each sucrose concentration. One randomly selected vigorously to wash the yeast cells from the agar, and the resulting
PLoS Biology | www.plosbiology.org 9 September 2010 | Volume 8 | Issue 9 | e1000486‘‘Cheats’’ Stimulate Growth
suspension was diluted down and plated out on YPD medium to reaction was determined by comparison with standard curves of
determine the number of cells in each patch. DNA extracted from known reference strains. Each amplification
reaction from a competition culture was carried out with at least 2-
Experimental Design F to 4-fold replication. Fitness was measured as ratio of doublings of
For the experiment in liquid culture, 1.3 ml of each of the the two strains during competition, such that a value of 1
diluted cell mixtures, as described in Design E, was pipetted into represents equal competitive ability. Quantitative-PCR based
2 ml liquid 2% sucrose medium in 25 mm wide test-tubes. These methods have previously been used to measure fitness of yeast
were incubated for 2 d with shaking, before the cultures were during competition, and preliminary experiments revealed that
diluted down and plated to determine the number of cells in each this protocol gives equivalent results to measuring the abundance
culture. The experiments were replicated three times. of SUC2 and suc2 by plating samples of competition cultures on
YPD and YPD supplemented with geneticin, which selects for the
Quantitative PCR suc2 strain.
DNA for use in quantitative PCR was extracted using a Wizard
genomic DNA extraction kit (Promega, UK) as per the Supporting Information
manufacturer’s instructions. DNA was amplified using SYBR Text S1 Supplementary information incorporating Sup-
Green Master Mix (Applied Biosystems International) or TaqMan plementary Methods 1 (parameter estimation), Supple-
Universal PCR master mix (Applied Biosystems International), mentary Results 1 (alternative fitness measure), Sup-
depending on whether or not a dual-labeled probe was used in the plementary Results 2 (comparison with Gore et al. 2009
amplification reaction. Amplification reactions contained each [8]), Supplementary Results 3 (experimental results for
primer at a concentration of 900 nM and a dual labeled probe low sucrose), and Supplementary Results 4 (experimen-
(where appropriate) at a concentration of 62.5 nM. SYBR Green tal results for homogeneous environments).
chemistry was used to detect the SUC2 strain using forward (59- Found at: doi:10.1371/journal.pbio.1000486.s001 (0.64 MB PDF)
CGATGATTTGACTAATTGGGAAGA-39) and reverse primers
(59-CCAGAGAAAGCACCTGAATCGT-39) that amplify a sec-
tion of the SUC2 gene. The suc2 strain was detected using a Acknowledgements
dual-labeled probe (FAM-CGGGCAATCAGGTGCGACAATC- We would like to thank Jeff Gore and Karin Elbing for helpful discussions.
TATC-TAM) that binds between forward (59-GTATAAATG-
GGCTCGCGATAATG-39) and reverse primers (59-CATC- Author Contributions
GGGCTTCCCATACAAT-39) of the KanMX gene. Amplifica-
The author(s) have made the following declarations about their
tions were carried out in an ABI 7000 sequence detection under contributions: Conceived and designed the experiments: RCM LDH IG.
the following reaction conditions: 10 min at 95uC followed by 40 Performed the experiments: RCM AFH DG IG. Analyzed the data: RCM
cycles or 95uC for 30 s followed by 60uC for 30 s. The relative AFH LDH IG. Contributed reagents/materials/analysis tools: RCM AFH
copy number of a particular sequence in a given amplification DG LDH IG. Wrote the paper: LDH IG.
References
1. Naumov GI, Naumova ES, Sancho ED, Korhola MP (1996) Polymeric SUC 19. Hughes WO, Boomsma JJ (2008) Genetic royal cheats in leaf-cutting ant
genes in natural populations of Saccharomyces cerevisiae. FEMS Microbiol Lett societies. Proc Natl Acad Sci U S A 105: 5150–5153.
135: 31–35. 20. Frank SA (1998) Foundations of social evolution. Princeton, USA: Princeton
2. Greig D, Travisano M (2004) The Prisoner’s Dilemma and polymorphism in University Press.
yeast SUC genes. Proc Biol Sci 271 Suppl 3: S25–S26. 21. Crampton WGR, Hurst LD (1994) True kin recognition, in the form of somatic
3. Santos E, Rodriguez L, Elorza MV, Sentandreu R (1982) Uptake of sucrose by incompatibility, has multiple independent origins. Anim Behav 47: 230–234.
Saccharomyces cerevisiae. Arch Biochem Biophys 216: 652–660. 22. Pfeiffer T, Bonhoeffer S (2004) Evolution of cross-feeding in microbial
4. Badotti F, Batista AS, Stambuk BU (2006) Sucrose active transport and populations. Am Nat 163: E126–E135.
fermentation be Saccharomyces cerevisiae. Braz Arch Biol Technol 49: 23. Bauchop T, Elsden SR (1960) The growth of micro-organisms in relation to
115–123. their energy supply. J Gen Microbiol 23: 457–469.
5. Stambuk BU, Batista AS, De Araujo PS (2000) Kinetics of active sucrose 24. Stambuk BU, de Araujo PS (2001) Kinetics of active alpha-glucoside transport in
transport in Saccharomyces cerevisiae. J Biosci Bioeng 89: 212–214. Saccharomyces cerevisiae. FEMS Yeast Res 1: 73–78.
6. Mwesigye PK, Barford JP (1996) Mechanism of sucrose utilisation by 25. Khan NA, Zimmermann FK, Eaton NR (1973) Genetic and biochemical
Saccharomyces cerevisiae. J Gen Appl Microbiol 42: 297–306. evidence of sucrose fermentation by maltase in yeast. Mol Gen Genet 123:
7. Maclean RC, Brandon C (2008) Stable public goods cooperation and dynamic 43–50.
social interactions in yeast. Journal of Evolutionary Biology 21: 1836–1843. 26. Williamson PR, Huber MA, Bennett JE (1993) Role of maltase in the utilization
8. Gore J, Youk H, van Oudenaarden A (2009) Snowdrift game dynamics and of sucrose by Candida albicans. Biochem J 291(Pt 3): 765–771.
facultative cheating in yeast. Nature 459: 253–256. 27. Kaliterna J, Weusthuis RA, Castrillo JI, Vandijken JP, Pronk JT (1995)
9. Sugden R (1986) The economics of rights, co-operation and welfare. Oxford, Coordination of sucrose uptake and respiration in the yeast Debaryomyces
UK: Blackwell. yamadae. Microbiology 141: 1567–1574.
10. Hardin G (1968) The tragedy of the commons. Science 162: 1243–1248. 28. Barnett J (1981) The utilization of disaccharides and some other sugars by yeasts.
11. Axelrod R, Hamilton WD (1981) The evolution of cooperation. Science 211: Adv Carb Chem Biochem 39: 347–404.
1390–1396. 29. Wolfenden R, Yuan Y (2008) Rates of spontaneous cleavage of glucose, fructose,
12. Fehr E, Schmidt KM (1999) A theory of fairness, competition and cooperation. sucrose, and trehalose in water, and the catalytic proficiencies of invertase and
Quart J Econ 114: 817–868. trehalas. J Am Chem Soc 130: 7548–7549.
13. Rainey PB, Rainey K (2003) Evolution of cooperation and conflict in 30. Dickinson JR, Schweizer M (2004) The metabolism and molecular physiology of
experimental bacterial populations. Nature 425: 72–74. Saccharomyces cerevisiae. London: CRC Press.
14. Turner PE, Chao L (1999) Prisoner’s dilemma in an RNA virus. Nature 398: 31. Kudla G, Murray AW, Tollervey D, Plotkin JB (2009) Coding-sequence
441–443. determinants of gene expression in Escherichia coli. Science 324: 255–258.
15. Griffin AS, West SA, Buckling A (2004) Cooperation and competition in 32. Dong H, Nilsson L, Kurland CG (1995) Gratuitous overexpression of genes in
pathogenic bacteria. Nature 430: 1024–1027. Escherichia coli leads to growth inhibition and ribosome destruction. J Bacteriol
16. Hauert C, Doebeli M (2004) Spatial structure often inhibits the evolution of 177: 1497–1504.
cooperation in the snowdrift game. Nature 428: 643–646. 33. Barford JP, Phillips PJ, Orlowski JH (1992) A new model of uptake of multiple
17. Dawkins R (1976) The selfish gene. Oxford: Oxford University Press. sugars by S. cerevisiae Part I. Bioproc Biosyst Eng 7: 297–302.
18. Elbing K, Stahlberg A, Hohmann S, Gustafsson L (2004) Transcriptional 34. Berthels NJ, Cordero Otero RR, Bauer FF, Thevelein JM, Pretorius IS (2004)
responses to glucose at different glycolytic rates in Saccharomyces cerevisiae. Discrepancy in glucose and fructose utilisation during fermentation by
Eur J Biochem 271: 4855–4864. Saccharomyces cerevisiae wine yeast strains. FEMS Yeast Res 4: 683–689.
PLoS Biology | www.plosbiology.org 10 September 2010 | Volume 8 | Issue 9 | e1000486You can also read