Pharmacokinetic Investigation of Commercially Available Edible Marijuana Products in Humans: Potential Influence of Body Composition and Influence ...
←
→
Page content transcription
If your browser does not render page correctly, please read the page content below
Preprints (www.preprints.org) | NOT PEER-REVIEWED | Posted: 16 July 2021                   doi:10.20944/preprints202107.0365.v1

             Pharmacokinetic Investigation of Commercially Available
             Edible Marijuana Products in Humans: Potential Influence
             of Body Composition and Influence on Glucose Control
             Taylor Russell Ewell1, Kieran Shay Struebin Abbotts1, Natasha N. Bondareva Williams1,
             Hannah Michelle Butterklee1, Matthew Charles Bomar1, Kole Jerel Harms1, Jordan Douglas
             Rebik1, Sarah Margaret Mast1, Natalie Akagi2, Gregory P. Dooley2, and Christopher Bell1*

             1
               Department of Health and Exercise Science, Colorado State University, Fort Collins, CO
             80523-1582, USA
             2
               Department of Environmental and Radiological Health Sciences, Colorado State University,
             Fort Collins, CO 80523-1680, USA

             *Corresponding Author:
             Christopher Bell, Ph.D., Department of Health and Exercise Science, Colorado State University,
             Fort Collins, CO 80523-1582, USA. Email: christopher.bell@colostate.edu Telephone: 970-
             491-7522

             Funding: Stillwater Brands, Colorado, USA

             The purpose of the study was to describe and compare the pharmacokinetics of five commercial
             edible marijuana products, determine the influence of body composition on pharmacokinetics,
             and, in light of epidemiology suggesting marijuana may offer diabetes protection, explore the
             influence of edible marijuana on glucose tolerance. Seven regular users of marijuana self-
             administered five edible products in a randomized crossover design; each product contained
             10mg of delta-9-tetrahydrocannabinol (THC). 30-minutes following marijuana ingestion,
             participants imbibed a 75g glucose beverage. Time-to-peak plasma THC concentration ranged
             between 35 and 90 minutes; maximal plasma THC concentration (C max) ranged between 3.2 and
             5.5 ng/mL. Differences between products in plasma THC concentration during the first 20-to-30
             minutes were detected (P=0.019). Relations were identified between body composition and
             pharmacokinetic parameters for some products; however, none of these body composition
             characteristics were consistently related to pharmacokinetics across all five of the products.
             Edible marijuana had no effect on oral glucose tolerance compared with a marijuana-free control
             (Matsuda Index; P>0.395). Commercially available edible marijuana products evoke different
             plasma THC concentrations shortly after ingestion, but do not appear to influence acute glucose
             regulation. These data may allow marijuana users to make informed decisions pertaining to rates
             of edible marijuana ingestion and avoid overdose.

             Keywords: cannabis, cannabinoid, diabetes, insulin

            © 2021 by the author(s). Distributed under a Creative Commons CC BY license.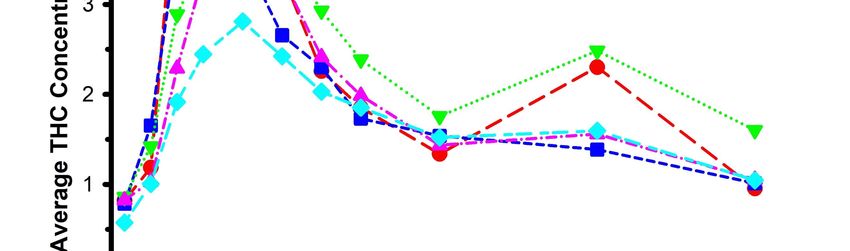
Preprints (www.preprints.org) | NOT PEER-REVIEWED | Posted: 16 July 2021        doi:10.20944/preprints202107.0365.v1

                      Legal access to marijuana, derived from the plant Cannabis sativa L. is increasing. To
             illustrate, within the USA, at the time of manuscript submission, marijuana is approved for
             recreational and medicinal use in 18 and 36 of the 50 states, respectively. Internationally,
             recreational use of marijuana is permitted in Uruguay, Canada, Georgia and South Africa, and
             marijuana possession has been decriminalized in many countries, including most throughout
             South America. Accompanying increased access to marijuana are the number of options for
             mode of consumption. While inhalation of combusted marijuana remains common [1,2], the
             consumption of marijuana via commercially available edible (oral) products is becoming more
             prevalent. This increase in edible consumption is not without implication. The incidence of
             edible marijuana overdose reported to United States poison centers is also increasing (e.g. ~5-
             fold increase between 2013 and 2015), the symptoms of which range in severity from mild
             anxiety and lethargy, to respiratory depression [3]. The increase in overdose prevalence has been
             attributed to two factors: accidental/unintentional ingestion (i.e. the patient was unaware they
             were ingesting marijuana) most common in children [4,5], and repeated premature dosing
             because of the absence of an immediate sensation of altered psychoactive state [6,7]. That is,
             compared with inhalation, the time to perceived effects of the edible marijuana are appreciably
             delayed [8]. Unfortunately, detailed studies describing the variability in the pharmacokinetics of
             the psychoactive component (∆-9-Tetrahydrocannabinol (THC)) and its metabolites (11-
             hydroxytetrahydrocannabinol (THC-OH) and 11-nor-9-carboxytetrahydrocannabinol (THC-
             COOH)) from commercially available edible marijuana products are lacking.
                      Studies that have quantified circulating THC concentration following marijuana ingestion
             have yielded highly variable results [8-10]. Several explanations have been proposed to explain
             this variability, one of which includes differences in the composition of the edible product. For
             example, while additional ingredients and/or macro-nutrients within the product, such as the fat
             and/or protein in marijuana brownies, may enhance the flavor, they may also influence the rate
             of THC absorption from the gut. Additionally, the body composition of the edible marijuana
             consumer may have an influence on pharmacokinetics. Case in point, cannabidiol (CBD) is a
             non-psychoactive component of Cannabis sativa L.; the time to maximal circulating CBD
             concentration (Tmax) following ingestion of a commercial oral CBD preparation is related to fat
             free mass (R2 = 0.365) [11]. Further, adiposity may also influence the pharmacokinetics of THC
             absorption on account of the lipophilic properties of THC [12].
                      Aside from recreational use, marijuana and other Cannabis sativa L. products have been
             purported to have multiple medicinal benefits [13,14]. These include pain management[15], the
             treatment of Inflammatory Bowel Disease [16] and epilepsy [17], decreased nausea associated
             with some cancer medications [18], and potential protection from diabetes [19-23]. The latter
             claim is based on large epidemiological studies reporting on decreased incidence of diabetes in
             habitual and former marijuana users. With the exception of three conflicting studies completed
             in the 1970’s [24-26], very few carefully controlled and laboratory-based investigations exploring
             the direct influence of marijuana on glucose control have been completed. These older studies
             involved intravenous THC administration, and inhalation of combusted marijuana. Compared
             with Cannabis sativa L. plants grown in the 1970’s, present day genetically-modified strains and
             modern cannabis products typically have greater THC potency [27]. Further, intravenous
             administration is not reflective of contemporary marijuana use [1,2]. Additional explanations for
             the relative paucity of controlled, laboratory-based studies include the current legal and ethical
             complications associated with the administration of marijuana to human research participants.
             However, several investigators have developed creative solutions for the study of marijuana use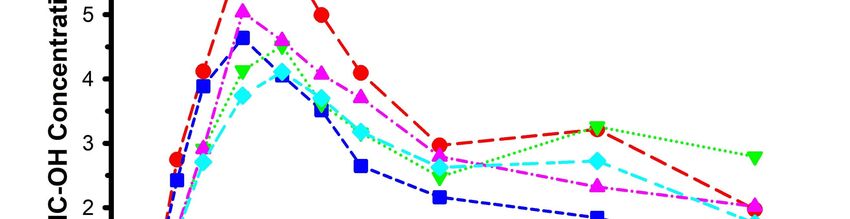
Preprints (www.preprints.org) | NOT PEER-REVIEWED | Posted: 16 July 2021          doi:10.20944/preprints202107.0365.v1

             in humans while remaining compliant with local and federal laws [28]. These have typically
             involved field-based studies of self-administration of marijuana, or “naturalistic observation”
             studies.
                     The current study has several aims: (1) To describe the pharmacokinetics of circulating
             THC, two of its metabolites (THC-OH and THC-COOH), and the metabolite to parent ratio,
             following ingestion of commercially available edible marijuana products. This information will
             provide the marijuana consumer with guidelines as to the timing of marijuana absorption and
             thereby may prevent overdose. (2) To compare the pharmacokinetics of several different
             commercially available edible marijuana products. This will also provide the consumer with
             potentially important information as to differences between the strength and the
             pharmacokinetics of different products, even when standardized for THC content. (3) To
             determine the influence of body composition on THC pharmacokinetics. (4) To explore the
             potential acute influence of edible marijuana on glucose regulation.

             RESULTS
             Participants
                     The progress of all participants throughout the trial (from screening and enrollment
             through to completion) is presented in Figure 1. A total of 15 participants were enrolled in the
             study, but only 7 completed all procedures associated with the crossover design. 8 participants
             either withdrew or were excluded from the study for a variety of reasons that were not
             necessarily mutually exclusive. These included difficulties with phlebotomy (n=2), an accident
             unrelated to the study requiring corrective surgery (n=1), inability to refrain from marijuana use
             prior to study visits (n=1), and voluntary withdrawal on account of poor tolerance of the research
             protocol (n=4). Selected physiological characteristics of the remaining participants are
             presented in Table 1. Consistent with inclusion and exclusion criteria, the physiological
             characteristics were unremarkable.

             Table 1. Selected physiological characteristics of study participants.
                                                        Mean ± SD                             Range
              Sex (M/F)                                     4/3                                  -
              Age (years)                                  31 ± 5                             24 - 39
              Height (cm)                                 170 ± 11                          159 – 193
              Body Mass (kg)                            82.3 ± 17.7                       62.7 – 113.9
              Body Mass Index (kg/m2)                    28.6 ± 6.5                        23.0 – 40.8
              Fat Mass (kg)                             28.1 ± 13.5                        16.3 – 55.6
              Body Fat (%)                              33.4 ± 10.1                        21.2 – 48.9
              Lean Mass (kg)                            52.2 ± 10.0                        38.1 – 66.0
              Bone Mineral Content (kg)                   2.3 ± 0.4                          2.0 – 3.1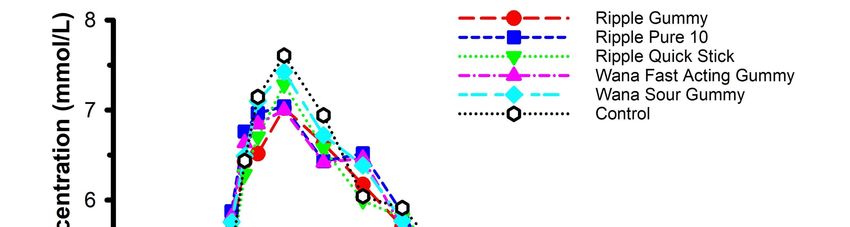
Preprints (www.preprints.org) | NOT PEER-REVIEWED | Posted: 16 July 2021      doi:10.20944/preprints202107.0365.v1

                     Figure 1. Consolidated Standards of Reporting Trials (CONSORT) flow diagram.

             Pharmacokinetics
                     Features of each of the edible marijuana products are presented in Table 2. The mean
             circulating concentrations of THC, THC-OH and THC-COOH are displayed in Figures 2, 3 and
             4, respectively. For THC (Figure 2), there was a product x time interaction (P=0.019). Post-hoc
             analysis revealed circulating THC concentration was greater in Ripple Blood Orange Gummies
             vs. Wana Fast Acting Gummies (P=0.003) and Wana Sour Gummies (P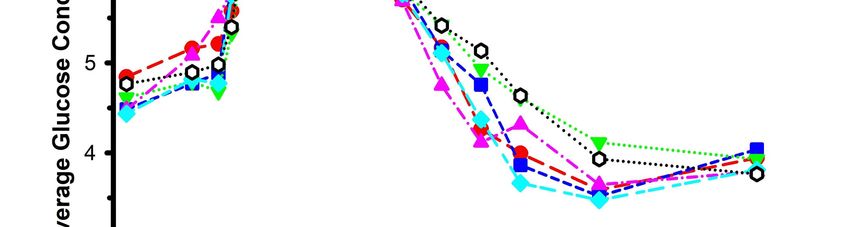
Preprints (www.preprints.org) | NOT PEER-REVIEWED | Posted: 16 July 2021              doi:10.20944/preprints202107.0365.v1

             Table 2. Features of the commercially available edible marijuana products
                  Product and                 Nutrition                                Ingredients
                 manufacturer
              Ripple Blood Orange    20 kcal per serving: 2          Glucose syrup, sugar, water, fruit juice
              Gummies (Stillwater    gummies; (Fat 0 g, Total        concentrates (Apple, Pear), gelatin, modified
              Brands, Commerce       carbohydrate 4 g, Protein 0     food starch, Ripple (water, modified food
              City, CO, USA)         g)                              starch, cannabinoid extracts, MCT oil), contains
                                                                     2% or less of: natural flavors, malic acid, citric
                                                                     acid, carnauba wax, vegetable juice for color

              Ripple Pure 10         0 kcal per serving (Fat 0 g,    Sorbitol, modified food starch, cannabinoid
              (Stillwater Brands,    Total carbohydrate 0 g,         extracts, MCT oil
              Commerce City, CO,     Protein 0 g)
              USA)

              Ripple Quick Sticks    5 kcal per individual           Ripple (Sorbitol, Modified Food Starch,
              Blueberry              serving (Fat 0 g, Total         Cannabinoid Extracts, MCT Oil), Sugar,
              Pomegranate            carbohydrate 1 g, Protein 0     Fructose, Natural Flavors, Citric Acid, Malic
              (Stillwater Brands,    g)                              Acid
              Commerce City, CO,
              USA)

              Wana Fast Acting       30 kcal per serving: 2          Organic Cane Sugar, Organic Tapioca Syrup,
              Gummies, Pina          gummies (Fat 0 g, Total         Pectin (Pectin, Potassium Sodium Tartrate,
              Colada Indica (Wana    carbohydrate 8 g, Protein 0     Polyphosphate, Sucrose), Citric Acid, Natural
              Brands, Boulder, CO,   g)                              Flavoring, Sodium Citrate, Modified Food
              USA)                                                   Starch, Xanthan Gum, THC.

              Wana Sour Gummies      15 kcal per serving (Fat 0 g,   Organic Sugar, Organic Tapioca Syrup, Pectin
              (Wana Brands,          Total carbohydrate 4 g,         (Pectin, Potassium Sodium Tartrate,
              Boulder, CO, USA)      Protein 0 g)                    Polyphosphate, Sucrose), Citric Acid, Natural
                                                                     Flavoring and Coloring, Sodium Citrate,
                                                                     Marijuana Concentrate, and Botanical Terpenes
                                                                     for Flavor.

              Welch’s Fruit Snacks   15 kcal per serving (Fat 0 g,   Fruit puree (grape, peach, orange, strawberry,
              (Park Ridge, NJ,       Carbohydrate 2 g, Sugar 3       and raspberry), corn syrup, sugar, modified corn
              USA)*                  g, Protein 0 g)                 starch, gelatin, concord grape juice from
                                                                     concentrate, citric acid, lactic acid, natural and
                                                                     artificial flavors, ascorbic acid (vitamin C),
                                                                     alpha tocopherol acetate (vitamin E), vitamin A
                                                                     palmitate, sodium citrate, coconut oil, carnauba
                                                                     wax, annatto (color), turmeric (color), red 40,
                                                                     and blue 1.
             All self-administered doses of edible marijuana products contained 10 mg THC.
             *Marijuana-free control product.
             MCT: Medium chain triglycerides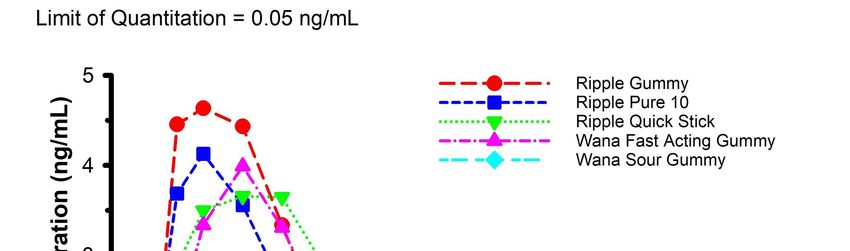
Preprints (www.preprints.org) | NOT PEER-REVIEWED | Posted: 16 July 2021    doi:10.20944/preprints202107.0365.v1

             Figure 2. Mean circulating concentrations of THC following ingestion of commercially
             available edible marijuana (10 mg of THC). There was a product x time interaction (P=0.019).
             Post-hoc analysis revealed circulating THC concentration was greater in Ripple Blood Orange
             Gummies vs. Wana Fast Acting Gummies (P=0.003) and Wana Sour Gummies (P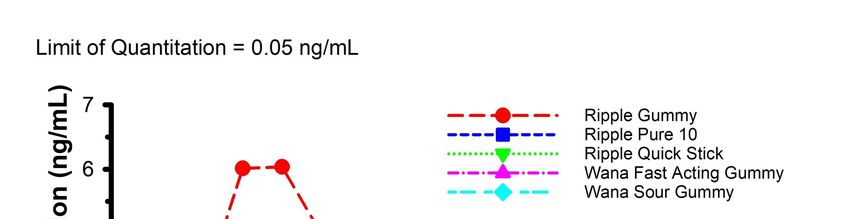
Preprints (www.preprints.org) | NOT PEER-REVIEWED | Posted: 16 July 2021    doi:10.20944/preprints202107.0365.v1

             Figure 3. Mean circulating concentrations of THC-OH following ingestion of commercially
             available edible marijuana (10 mg of THC). There were no product x time interactions
             (P=0.415). Error bars have been omitted for clarity.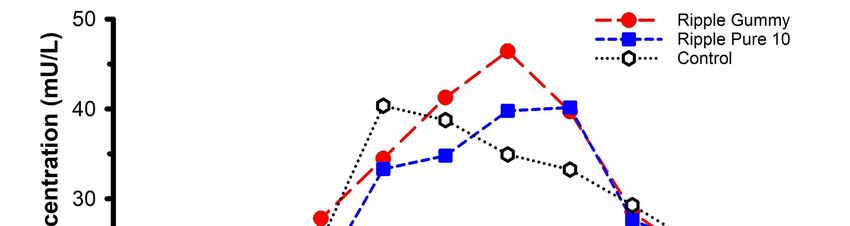
Preprints (www.preprints.org) | NOT PEER-REVIEWED | Posted: 16 July 2021 doi:10.20944/preprints202107.0365.v1
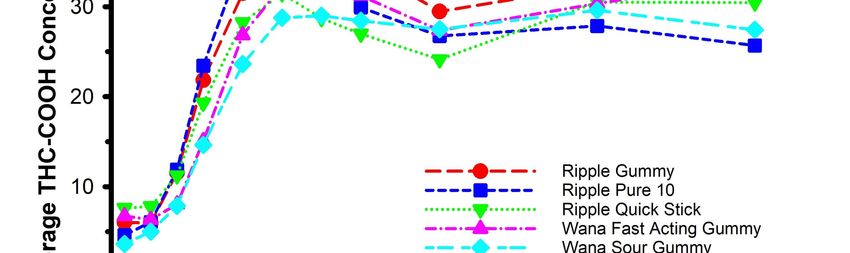
Figure 4. Mean circulating concentrations of THC-COOH following ingestion of commercially
available edible marijuana (10 mg of THC). There were no product x time interactions
(P=0.485). Error bars have been omitted for clarity.
Pharmacokinetic parameters for THC, THC-OH and THC-COOH are displayed in Tables
3, 4, and 5, respectively. None of the comparisons between edible products yielded appreciable
differences for any of the pharmacokinetic parameters (all P>0.06). Metabolite-to-parent ratios
for Cmax and AUC0-240 are presented in Table 6. There were no appreciable differences (all
P>0.13) for any of the comparisons.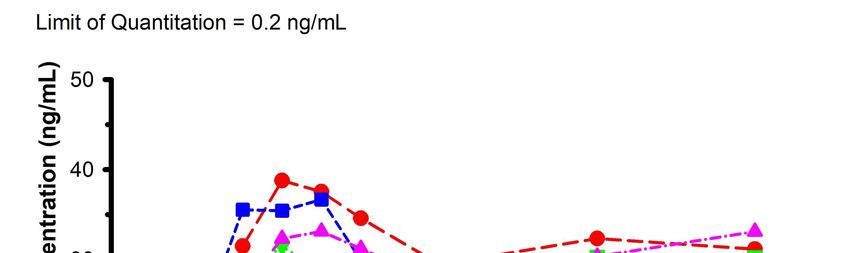
Preprints (www.preprints.org) | NOT PEER-REVIEWED | Posted: 16 July 2021               doi:10.20944/preprints202107.0365.v1

             Table 3. Pharmacokinetic parameters for THC
                                                               Tmax       Cmax          AUC0-240               Vd              CL/F0-240       ke          t1/2
                         Product
                                                              (min)     (ng/mL)       (min*ng/mL)             (mL)            (mL/min)      (L/min)       (min)
                                                   n               7            7                   7                7                7             7          7
                                                 Mean           35.7         5.54                 533          4534900            19313         0.005      268.3
                    Ripple Gummies
                                                  SD            12.1         3.10                 286          4406250            20443         0.003      267.0
                                                 Median         45.0         5.22                 463          2979599            14131          0.00      152.7
                                                   n               7            7                   7                6                6             6          6
                                                 Mean           40.7         4.31                 447          4397542            23966         0.005      152.4
                      Ripple Pure 10
                                                  SD            11.3         3.01                 301          2282851            17028         0.002       47.1
                                                 Median         45.0         2.37                 271          4531448            22193         0.000      148.6
                                                   n               7            7                   7                5                5             5          5
                                                 Mean           90.7         4.56                 570          2648627            11844         0.006      215.5
                   Ripple Quick Sticks
                                                  SD            84.6         1.80                 268          1272398             5691         0.004      175.0
                                                 Median         60.0         5.17                 632          2369956            12915         0.000      206.3
                                                   n               7            7                   7                6                6             6          6
                                                 Mean           51.4         4.39                 455          4989024            19431         0.005      158.8
               Wana Fast Acting Gummies
                                                  SD            31.1         2.91                 248          4898405            14590         0.002       75.5
                                                 Median         45.0         4.29                 421          2401279            14491         0.010      133.5
                                                   n               7            7                   7                6                6             6          6
                                                 Mean           62.1         3.22                 406          3960415            16420         0.004      180.0
                  Wana Sour Gummies
                                                  SD            53.0         2.04                 296          1463937             7526         0.001       68.3
                                                 Median         45.0         2.57                 305          4462147            15837         0.000      165.5

                                                 P-Value      0.548         0.110                0.210            0.468            0.446        0.697      0.684

             Tmax: the time to maximum concentration. Cmax: the maximum concentration. AUC0-240: the area under the curve representing total THC exposure
             between time 0 and end of data collection. Vd: the volume of distribution, an estimate of the degree to which THC is distributed in the body tissue
             vs. the plasma. CL/F0-240: the apparent total clearance of the THC from plasma after oral administration. Ke: the rate at which the THC is removed
             from the body. t½: the amount of time it takes to decrease the circulating concentration to half of its initial value. All product servings contained
             10 mg of THC.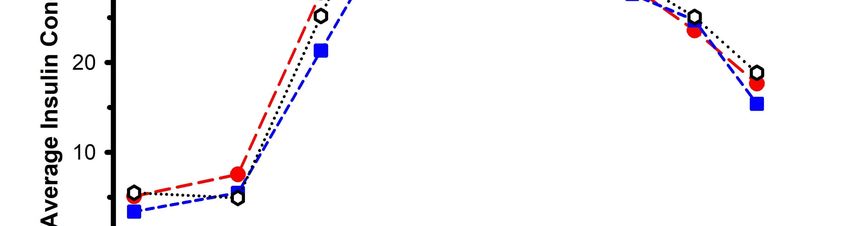
Preprints (www.preprints.org) | NOT PEER-REVIEWED | Posted: 16 July 2021              doi:10.20944/preprints202107.0365.v1

             Table 4. Pharmacokinetic parameters for THC-OH
                                                              Tmax        Cmax           AUC0-240              Vd             CL/F0-240       ke          t1/2
                         Product
                                                             (min)      (ng/mL)        (min*ng/mL)            (mL)           (mL/min)      (L/min)       (min)
                                                  n               7             7                    7              7                7             7          7
                                                Mean           55.7          6.60                  816        2993411             7138         0.005      512.8
                    Ripple Gummies
                                                 SD            16.7          3.42                  361        3760404             2809         0.002      989.6
                                                Median         45.0          7.97                  950        1284652             7100         0.000      149.3
                                                  n               7             7                    7              7                7             7          7
                                                Mean           53.6          5.05                  560        3628286            17124         0.005      159.4
                     Ripple Pure 10
                                                 SD            17.0          4.20                  359        2117850            13390         0.001       49.0
                                                Median         45.0          3.32                  447        3804011            11432         0.000      145.8
                                                  n               7             7                    7              5                5             5          5
                                                Mean          100.7          5.33                  700        3036162             8389         0.003      403.7
                   Ripple Quick Sticks
                                                 SD            77.3          2.71                  381        1634370             6850         0.003      335.4
                                                Median         60.0          4.62                  747        3076976             8413         0.000      267.9
                                                  n               7             7                    7              5                5             5          5
                                                Mean           83.6          5.40                  669        1773924             6703         0.005      213.1
               Wana Fast Acting Gummies
                                                 SD            49.6          3.71                  361         783269             2218         0.002      154.4
                                                Median         60.0          4.83                  753        1633620             6014         0.000      138.8
                                                  n               7             7                    7              6                6             6          6
                                                Mean           72.9          4.45                  626        2141277             8860         0.005      234.0
                  Wana Sour Gummies
                                                 SD            48.6          2.25                  310         956697             5405         0.005      199.8
                                                Median         60.0          4.36                  544        1811579             7708         0.000      189.1

                                                P-Value       0.369         0.390                0.065           0.758            0.169        0.975      0.778

             Tmax: the time to maximum concentration. Cmax: the maximum concentration. AUC0-240: the area under the curve representing total THC-OH
             exposure between time 0 and end of data collection. Vd: the volume of distribution, an estimate of the degree to which THC-OH is distributed in
             the body tissue vs. the plasma. CL/F0-240: the apparent total clearance of the THC-OH from plasma after oral administration. Ke: the rate at which
             the THC-OH is removed from the body. t½: the amount of time it takes to decrease the circulating concentration to half of its initial value. All
             product servings contained 10 mg of THC.
Preprints (www.preprints.org) | NOT PEER-REVIEWED | Posted: 16 July 2021 doi:10.20944/preprints202107.0365.v1
Table 5. Pharmacokinetic parameters for THC-COOH
Tmax Cmax AUC0-240 Vd CL/F0-240 ke t1/2
Product
(min) (ng/mL) (min*ng/mL) (mL) (mL/min) (L/min) (min)
n 7 7 7 4 4 4 4
Mean 105.0 44.01 7047 266200 484 0.002 365.3
Ripple Gummies
SD 75.0 21.32 3264 140158 147 0.000 97.3
Median 60.0 34.28 6251 241269 514 0.000 325.7
n 7 7 7 6 6 6 6
Mean 87.9 40.24 6311 360519 569 0.001 846.3
Ripple Pure 10
SD 67.9 19.44 3137 194482 420 0.001 986.7
Median 60.0 34.15 5154 299004 568 0.000 487.8
n 7 7 7 3 3 3 3
Mean 130.7 42.25 6195 288446 802 0.003 272.2
Ripple Quick Sticks
SD 86.0 22.51 3667 28675 344 0.001 80.7
Median 75.0 35.63 5870 301043 674 0.000 309.4
n 7 7 7 3 3 3 3
Mean 145.7 39.36 6467 312251 363 0.001 611.4
Wana Fast Acting Gummies
SD 84.3 15.12 2798 201295 247 0.000 73.8
Median 180.0 41.04 6203 208977 262 0.000 585.7
n 7 7 7 2 2 2 2
Mean 145.7 35.78 6009 297051 758 0.003 677.6
Wana Sour Gummies
SD 68.6 18.89 3324 81970 789 0.003 780.3
Median 180.0 29.09 5119 297051 758 0.000 677.6
P-Value 0.514 0.746 0.642 0.134 0.680 0.107 0.860
Tmax: the time to maximum concentration. Cmax: the maximum concentration. AUC0-240: the area under the curve representing total THC-COOH
exposure between time 0 and end of data collection. Vd: the volume of distribution, an estimate of the degree to which THC-COOH is distributed
in the body tissue vs. the plasma. CL/F0-240: the apparent total clearance of the THC-COOH from plasma after oral administration. Ke: the rate at
which the THC-COOH is removed from the body. t½: the amount of time it takes to decrease the circulating concentration to half of its initial
value. All product servings contained 10 mg of THC.Preprints (www.preprints.org) | NOT PEER-REVIEWED | Posted: 16 July 2021 doi:10.20944/preprints202107.0365.v1
Table 6. Metabolite-to-parent ratios for Cmax and AUC0-240
THC-OH/THC THC-COOH/THC
Product Cmax AUC0-240 Cmax AUC0-240
n 7 7 7 7
Ripple Mean 1.22 1.64 10.54 17.10
Gummies SD 0.26 0.45 7.14 12.49
Median 1.26 1.51 6.53 11.12
n 7 7 7 7
Ripple Pure Mean 1.11 1.35 11.46 16.06
10 SD 0.24 0.53 5.31 5.53
Median 1.02 1.21 10.52 14.55
n 7 7 7 7
Ripple
Mean 1.28 2.06 10.84 11.76
Quick
SD 0.58 2.35 6.63 4.58
Sticks
Median 1.21 1.33 8.83 10.81
n 7 7 7 7
Wana Fast
Mean 1.27 1.53 13.24 17.02
Acting
SD 0.29 0.44 7.99 7.24
Gummies
Median 1.17 1.57 11.52 18.05
n 7 7 7 7
Wana Sour Mean 1.44 1.68 12.64 16.43
Gummies SD 0.25 0.51 5.19 4.32
Median 1.46 1.82 11.37 16.77
P-Value 0.344 0.195 0.772 0.137
Body Composition
Correlations between parameters of body composition and pharmacokinetics are
presented in Table 7. While significant relations were identified between body composition and
pharmacokinetic parameters for some products, none of these body composition characteristics
were consistently related to pharmacokinetic parameters across all five of the products.
Table 7. Pearson correlations between parameters of body composition and THC
pharmacokinetics
Fat Lean Total %
Age Ht BMC BMI
Mass Mass Mass Fat
r 0.61 0.54 0.65 0.22 0.90 0.71 -0.24 0.42
Ripple Gummies
p 0.15 0.21 0.12 0.63 0.01 0.07 0.61 0.35
r -0.16 0.91 0.87 -0.63 0.66 -0.08 -0.90 -0.54
Ripple Pure 10
p 0.74 0.01 0.01 0.13 0.11 0.87 0.01 0.21
Tmax r -0.62 -0.20 -0.33 0.07 -0.33 -0.12 0.21 0.00
Ripple Quick Sticks
p 0.13 0.67 0.48 0.89 0.47 0.79 0.65 1.00
Wana Fast Acting r 0.50 0.01 0.03 0.09 0.33 0.13 -0.14 0.10
Gummies p 0.25 0.98 0.95 0.85 0.47 0.79 0.76 0.83
Wana Sour Gummies r -0.32 0.87 0.87 -0.35 0.58 0.09 -0.53 -0.36Preprints (www.preprints.org) | NOT PEER-REVIEWED | Posted: 16 July 2021 doi:10.20944/preprints202107.0365.v1
p 0.47 0.01 0.01 0.45 0.17 0.85 0.22 0.43
r -0.24 -0.68 -0.77 0.30 -0.80 -0.25 0.58 0.10
Ripple Gummies
p 0.61 0.09 0.04 0.51 0.03 0.58 0.17 0.82
r -0.21 -0.48 -0.60 0.35 -0.62 -0.12 0.58 0.13
Ripple Pure 10
p 0.65 0.28 0.15 0.44 0.14 0.80 0.17 0.79
r -0.21 0.03 -0.04 -0.19 -0.31 -0.34 -0.10 -0.36
Cmax Ripple Quick Sticks
p 0.65 0.95 0.93 0.68 0.50 0.45 0.84 0.43
Wana Fast Acting r -0.07 -0.36 -0.46 0.29 -0.38 -0.00 0.31 0.18
Gummies p 0.89 0.43 0.30 0.53 0.40 0.99 0.51 0.69
r 0.21 -0.63 -0.66 0.73 -0.42 0.29 0.84 0.60
Wana Sour Gummies
p 0.65 0.13 0.11 0.06 0.34 0.53 0.02 0.16
r 0.05 -0.63 -0.75 0.65 -0.49 0.20 0.74 0.52
Ripple Gummies
p 0.92 0.13 0.05 0.12 0.27 0.67 0.06 0.23
r -0.12 -0.34 -0.54 0.56 -0.32 0.23 0.59 0.40
Ripple Pure 10
p 0.80 0.46 0.21 0.19 0.49 0.62 0.17 0.38
AUC r -0.17 -0.06 -0.23 0.03 -0.25 -0.13 0.04 -0.10
Ripple Quick Sticks
0-240 p 0.71 0.89 0.62 0.95 0.58 0.78 0.93 0.83
Wana Fast Acting r 0.07 -0.43 -0.52 0.39 -0.34 0.10 0.38 0.32
Gummies p 0.88 0.34 0.24 0.39 0.46 0.83 0.40 0.49
r 0.35 -0.47 -0.52 0.89 -0.13 0.59 0.83 0.82
Wana Sour Gummies
p 0.44 0.29 0.23 0.01 0.79 0.16 0.02 0.02
n=7 for all cells. Ht: Height. BMC: Bone Mineral Content. BMI: Body Mass Index. AUC 0-240:
Area under the concentration curve between time 0 and 240-minutes (4-hours). Statistically
significant correlations have been bolded for clarity.
Oral Glucose Tolerance
Mean circulating glucose concentrations across the six conditions (including marijuana-
free control) during an oral glucose tolerance test (OGTT) are displayed in Figure 5. 75g of
glucose was imbibed as a beverage 30-minutes after ingestion of marijuana (or control). Fasting
glucose was not different across laboratory visits (P=0.40). Circulating glucose was not different
from fasting glucose 30-minutes after product ingestion (P=0.88), implying that the carbohydrate
content of the edible products was too low to evoke an appreciable hyperglycemic response.
Compared with marijuana-free control, none of the edible marijuana products influenced
circulating glucose throughout each of the trials (product x time interaction P=0.98). Consistent
with this observation, none of the edible marijuana products influenced other indices of the
glucose response, including 2-hour AUC (P=0.98; data not shown) and 3.5-hour AUC (P=0.92;
data not shown).Preprints (www.preprints.org) | NOT PEER-REVIEWED | Posted: 16 July 2021 doi:10.20944/preprints202107.0365.v1
Figure 5. Mean circulating glucose concentrations following ingestion of commercially
available edible marijuana (10 mg of THC) and one marijuana-free control product. 75 g of
glucose was ingested at 30-minutes. Fasting glucose was not different across study sessions
(P=0.40). Circulating glucose was not different from fasting glucose 30-minutes after product
ingestion (P=0.88). Compared with placebo, none of the edible marijuana products influenced
circulating glucose throughout each of the trials (product x time interaction P=0.98). Error bars
have been omitted for clarity.
An absence of difference in circulating glucose does not necessarily imply an absence of
difference in glucose regulation. Accordingly, circulating insulin concentration was determined
for two of the products, Ripple Blood Orange Gummies and Ripple Pure 10, and compared
against the marijuana-free control (Figure 6). These two specific products were selected on
account of the higher plasma THC concentrations evoked by their ingestion (Figure 2).
Consistent with the glucose data, there were no differences in circulating insulin between
products (product x time interaction P=0.74) and 2-hour AUC (P=0.70) nor were there any
differences in glucose/insulin derived indices of glucose regulation, including HOMA-IR
(P=0.30; data not shown) and the Matsuda Index (P=0.40; data not shown).Preprints (www.preprints.org) | NOT PEER-REVIEWED | Posted: 16 July 2021 doi:10.20944/preprints202107.0365.v1
Figure 6. Mean circulating insulin concentrations following ingestion of two commercially
available edible marijuana (10 mg of THC) and one marijuana-free control product. 75 g of
glucose was ingested at 30-minutes. There were no differences in circulating insulin between
products (product x time interaction P=0.74). Error bars have been omitted for clarity.
DISCUSSION
The aims of the current study were: (1) To describe the pharmacokinetics of circulating
THC, two of its metabolites (THC-OH and THC-COOH), and the metabolite to parent ratio,
following ingestion of five commercially available edible marijuana products. (2) To compare
the pharmacokinetics of five different commercially available edible marijuana products. (3) To
determine the influence of body composition on THC pharmacokinetics. (4) To explore the
potential acute influence of edible marijuana on glucose regulation. Our primary findings were:
(1) THC Tmax ranged between 35 and 90 minutes, and THC C max ranged between 3.2 and 5.5
ng/mL. (2) Differences between products in plasma THC concentration during the first 20-30
minutes were detected (P=0.019). There were no differences between products in the
metabolite-to-parent Cmax and AUC ratios for THC-COOH and THC-OH (all P>0.13). (3)
Significant relations were identified between body composition and pharmacokinetic parameters
for some products, however none of these body composition characteristics were consistently
related to pharmacokinetic parameters across all five of the products. (4) Compared with a
control condition, edible marijuana had no effect on any of the indices of glucose regulation,
including Matsuda Index, and 2.0 and 3.5-hour AUC.
Commercially available edible marijuana products are becoming increasingly popular
alternatives to inhaled combusted marijuana, in part due to the perceived lower cardiopulmonary
risk associated with protecting lungs from exposure to smoke. However, as with marijuana
prepared for burning/smoking, considerable pharmacokinetic variability exists between edible
marijuana products, even when standardized for THC content. For example, in two recent
studies of cannabis-infused brownies containing 50-mg of THC, THC C max ranged between 2.5Preprints (www.preprints.org) | NOT PEER-REVIEWED | Posted: 16 July 2021 doi:10.20944/preprints202107.0365.v1
ng/mL and 4 ng/mL, and Tmax between 1 and 2 hours [9,10]. In contrast, in the present study
research participants self-administered commercially available edible marijuana containing only
10 mg of THC, and Cmax ranged between 3.2 and 5.5 ng/mL, while Tmax ranged between 35 and
90 minutes. Thus, several of the commercially available preparations containing only 20% of the
THC content of the brownies evoked greater circulating concentrations of THC, and in a shorter
period. To account for these discrepancies between studies, we have considered several potential
explanations. In addition to cannabis, the brownies contained additional ingredients, including
fats and sugars, that contributed to a greater caloric load compared with a single (10 mg THC)
serving of any of the commercial edible marijuana studied in the current investigation; we
conservatively estimate 100 vs. 0-30 kcal, respectively. It is plausible that the additional caloric
load of the brownies interfered with the rate and amount of THC absorption from the gut [29].
Second, the brownies were typical/normal food supplemented with cannabis, whereas the
commercial products under investigation were engineered to provide superior delivery of THC.
This engineering includes the development of water-soluble THC and marijuana concentrate, and
controlled addition of solubility agents, such as gum arabic and medium-chain triglycerides
(MCTs), that have been shown to promote delivery and bioavailability of dietary supplements
[30,31]. Third, in a separate brownie study [8], approximately 50 mg of THC incorporated within
a brownie produced a THC Cmax (measured in whole blood) of 4.7-34.8 ng/mL in frequent
marijuana users (>5 times per week) and 3.6-22.5 ng/mL in occasional marijuana users (< 3
times per week). In the same study, THC Tmax was 1.5-3.5 hours for both frequent and
occasional users. These data imply that the degree of habitual marijuana use may promote THC
Cmax independent of Tmax., thus when comparing across studies, data must be interpreted with
caution if habitual marijuana use is not reported. In the current study, a repeated measures
crossover design was employed, thus comparison within the study should not be compromised
by heterozygous habitual cannabis/marijuana use.
Previously, it has been reported that parameters of oral CBD pharmacokinetics, including
Tmax, were associated with anthropometric variables, including fat free mass and body mass
index [11]. A number of explanations were proposed, such as the positive relationship between
fat free mass and blood volume [32,33], representing a greater reservoir in which to dilute
circulating metabolites; greater perfusion of metabolically active tissues, thereby leading to
enhanced clearance of circulating metabolites; and, the lipophilic nature of CBD. In the current
study we extend these observations and arguments to consider a potential role of body
composition specific to THC pharmacokinetics. To our knowledge, our data are the first to
directly address this issue. While significant relations were identified between body composition
and pharmacokinetic parameters for some of the edible marijuana products (Table 7), none of
these body composition characteristics were consistently related to pharmacokinetic parameters
across all five of the studied products. Similar to CBD, THC is thought to be lipophilic and
consequently absorbed by adipose tissue. Two lines of evidence from frequent marijuana users
support this claim: THC is quantifiable in fat biopsies taken 4-weeks after previous marijuana
use [12], and circulating THC concentration is increased following 35-minutes of lipolysis-
inducing moderate intensity stationary cycle ergometer exercise [34]. Similar exercise-mediated
observations have been reported in exercising rats pre-treated with THC [35], but not reproduced
in a smaller follow-up study of humans with low-to-recommended BMI (range: 19-to-23 kg/m 2)
[36]. Our analysis revealed inconsistent correlations for absolute and/or % fat mass for T max,
Cmax and AUC0-240 for only some of the products. Although our study population was small, the
range in adiposity and BMI was large, ranging from lean-to-obese. The heterozygous nature ofPreprints (www.preprints.org) | NOT PEER-REVIEWED | Posted: 16 July 2021 doi:10.20944/preprints202107.0365.v1
the body composition data should have facilitated the identification of potentially significant
correlations. While it appears likely that in vivo THC is lipophilic and absorbed by adipose
tissue, adipose may not appreciably contribute to short-term edible marijuana pharmacokinetics.
The final aim of the current study was to explore the potential acute influence of edible
marijuana on glucose regulation. The connection between marijuana use and the development of
insulin resistance and diabetes is not clearly understood. On one hand, there exists an intuitive
link: marijuana use is associated with increased appetite [37], leading to increased dietary intake,
and in particular increased purchase of foods of high caloric but poor nutritional value (“junk
food”) [38]. If this behavior is chronic then weight (fat) gain typically ensues, and the overweight
and obese states are causally tied to insulin resistance and diabetes. However, on the other hand,
most of the epidemiological research suggests that marijuana use either has no effect on diabetes
risk, or in many cases lowers the risk of diabetes, even when taking into account other potential
confounding variables such as body composition [19-23]. The collective concluding
recommendation provided by the authors of these studies was the need for randomized controlled
trials to provide definitive insight. To our knowledge, aside from some preliminary work
completed in the 1970’s [24-26], there have been no human intervention studies to support the
epidemiology. The early preliminary work involved intravenous marijuana administration and
inhalation of combusted marijuana, and resulted in either impaired or unaltered acute glucose
regulation. Inhalation of combustible materials typically leads to temporarily decreased oxygen
transport (i.e. relative hypoxia) and increased sympathoadrenal activity, two conditions known to
unfavorably modify glucose control [39,40]. Further, since these early studies, the THC potency
of marijuana products has increased [27] and the methods of marijuana consumption have
become more diverse [1], thus our goal in the present study was to update the paradigm using
commercially available edible marijuana with THC doses reflective of contemporary use. The
gold-standard measurement of glucose regulation and insulin sensitivity is the hyperinsulinemic
euglycemic clamp technique, involving the intravenous co-administration of insulin and glucose.
Unfortunately, on account of state laws and institutional regulations, marijuana is not permitted
in our university clinical research facility, thus we compromised by studying glucose regulation
using a modified OGTT in a field-setting. None of the five commercially available edible
marijuana products influenced the acute circulating glucose response to standardized glucose
ingestion (P=0.98). The variability in circulating glucose across conditions was akin to desirable
studies of test-re-test reliability [41]. The primary hormone involved in glucose regulation is
insulin. Improvements in glucose control are not always necessarily reflected by lower
circulating glucose concentrations [42]; improved glucose regulation may be reflected by lower
insulin in the absence of modified glucose values. For this reason, we compared the OGTT
insulin response in the control condition to the OGTT insulin response to two of the five edible
marijuana products. There were no differences in circulating insulin between products, nor were
there any differences in glucose/insulin derived indices of glucose regulation, including the
Matsuda Index. Based on our data and in light of the epidemiological studies [19-23], we suggest
that edible marijuana does not affect acute glucose regulation, but potentially may exert a
favorable chronic influence via long-term physiological responses such as decreased adiposity
[43], and improved gut [44] and/or liver health [45].
In summary, knowledge of pharmacokinetics associated with different commercially
available edible marijuana products may prevent accidental overdose due to premature repeat
dosing. THC Tmax and Cmax ranged between 35 and 90 minutes, and between 3.2 and 5.5 ng/mL,
respectively. Differences exist between commercial products with respect to plasma THCPreprints (www.preprints.org) | NOT PEER-REVIEWED | Posted: 16 July 2021 doi:10.20944/preprints202107.0365.v1
concentration during the first 20-30 minutes following ingestion. Body composition does not
appear to be an acute determinant of edible marijuana pharmacokinetics. Edible marijuana does
not appear to affect acute glucose regulation, but in light of epidemiological data, marijuana
potentially may exert a favorable influence on long-term glucose regulation and diabetes-risk.
MATERIALS AND METHODS
The study was conducted according to the guidelines of the Declaration of Helsinki and
approved by the Institutional Review Board of Colorado State University (Protocol #20-10278H,
8th of October 2020). This study utilized a randomized, repeated measures crossover design. All
participants provided written informed consent prior to commencement of the study.
Participants
Adult men and women aged 21 or over were invited to participate. Inclusion criteria
included body mass greater than 50 kg, regular use of marijuana (≥ four times in the previous
month), willingness to abstain from all products derived from Cannabis sativa L. during the four
days prior to each data collection, and previous use of a Cannabis sativa L. product containing
>10 mg of THC without a significant adverse reaction. Exclusion criteria included pregnancy,
breastfeeding, treatment for psychosis, bipolar disorder or schizophrenia, current or previous use
of medication for treatment or prevention of diabetes, previous diagnoses of heart disease,
peripheral vascular disease, high blood pressure, stroke, or heart murmur, and/or use of
medication contraindicated for concurrent use with marijuana, or known to influence glycemic
control.
Protocol Overview
To remain compliant with institutional and state laws pertaining to marijuana, an
observational approach was employed in a manner inspired by previous reports [28]. Following
screening, on six mornings, each separated by a minimum of 1-week, participants self-
administered one of five edible marijuana products or a marijuana-free control product in a
randomized crossover design; each marijuana product contained 10 mg of THC. 30-minutes
following marijuana (or marijuana-free control) ingestion, participants imbibed a carbohydrate
beverage containing 75g of glucose. Venous blood was sampled repeatedly over 4-hours and
was analyzed for circulating concentrations of THC, THC-COOH, THC-OH, glucose, and
insulin.
Procedures
Prior to study enrollment, potential participants completed a detailed electronic medical
history questionnaire. Responses requiring additional query were addressed either in-person, via
telephone or video conference. Body size and composition were assessed at Colorado State
University using dual energy x-ray absorptiometry (DEXA; Hologic, DiscoveryW, QDR Series,
Bedford, MA, USA), and a physician’s digital scale and stadiometer.
The remaining data collection sessions were completed off-campus on six mornings, each
separated by 1-2 weeks depending on participant schedules. The time of protocol initiation was
kept constant for each participant. Every data collection was preceded by a 12-hour fast, 24-hour
abstention from alcohol and exercise, and 96-hour abstention from any products derived from
Cannabis sativa L., including CBD and marijuana.Preprints (www.preprints.org) | NOT PEER-REVIEWED | Posted: 16 July 2021 doi:10.20944/preprints202107.0365.v1
A venous catheter was introduced to an antecubital or dorsal hand vein and blood (~10
mL) was collected for analysis of baseline circulating concentrations of THC, THC-COOH,
THC-OH, glucose, and insulin. Immediately following baseline blood collection, participants
self-administered one of five edible marijuana products or a marijuana-free control product
(described in detail in a subsequent section). 30-minutes following marijuana (or marijuana-free
control) ingestion, participants imbibed a beverage consisting of 75g of glucose dissolved in 250
mL of water (i.e. an oral glucose tolerance test (OGTT)).
Relative to marijuana ingestion (Time 0), venous blood was sampled for subsequent
analysis of circulating concentrations of THC, THC-COOH, and THC-OH at minutes 10, 20, 30,
45, 60, 75, 90, 120, 180, and 240. Blood was immediately transferred into chilled tubes coated
with ethylenediaminetetraacetic acid (K3 EDTA) and placed on ice for up to 30 minutes before
isolation of plasma via chilled (4 °C) centrifugation. One mL aliquots of plasma were then
placed on ice while being transported to the research facility for storage at -80 °C prior to
subsequent analysis.
Relative to marijuana ingestion (Time 0), the carbohydrate beverage was imbibed at
minute 30. Venous blood was sampled for subsequent analysis of circulating concentrations of
glucose at minutes 25 (i.e. post-marijuana but pre-glucose), 35, 40, 45, 50, 60, 75, 90, 105, 120,
135, 150, 180 and 240, and at minutes 25, 45, 75, 105, 135, and 150 for subsequent analysis of
plasma insulin concentration. Blood intended for glucose analysis was transferred to chilled
tubes containing sodium fluoride (potassium oxalate), and then immediately placed on ice for
transport to the research facility where it was evaluated, in duplicate, without delay using an
automated analyzer (YSI 2900 STAT Glucose Lactate Analyzer, YSI Inc., Yellow Springs, OH,
USA). Blood intended for insulin analysis was processed in an identical manner to the blood
used for THC, THC-COOH, and THC-OH analysis. Plasma insulin concentration was
determined in triplicate via enzyme-linked immunosorbent assay ((ELISA) Crystal Chem, Inc.,
Elk Grove Village, IL, USA).
Commercially Available Edible Marijuana Products
Five commercially available edible marijuana products were selected for study. These
products were made and sold at licensed stores throughout Colorado, USA. Participants were
requested to purchase each of the identified products using their personal funds. Confirmation of
purchase was verified by inspection of retail receipt. Features of each of the edible marijuana
products are presented in Table 1. Each of the products contained 10 mg of THC, except for the
marijuana-free control product. The marijuana-free control product was provided by the
research team (i.e. purchase by participants was not required). All products were consumed
within 30-seconds of self-administration. The order of self-administration was dictated by the
research team based on a random generator.
Reagents and Supplies
THC, THC-COOH, THC-OH, THC-D3, THC-COOH-D3, and THC-OH-D9 were
purchased from Cerilliant (Round Rock, TX, USA). A second set of THC, THC-OH, THC-
COOH were purchased from Lipomed (Cambridge, MA) to be used for quality control samples.
Water and acetonitrile (LC–MS grade) were obtained from Millipore (Burlington, MA, USA).
Dansyl chloride, sodium bicarbonate, sodium carbonate, acetic acid, and formic acid (LC-MS-
grade) were obtained from Sigma-Aldrich (St. Louis, MO, USA). Captiva EMR-Lipid columns
(1mL, 40 mg) were purchased from Agilent Technologies (Santa Clara, CA, USA).Preprints (www.preprints.org) | NOT PEER-REVIEWED | Posted: 16 July 2021 doi:10.20944/preprints202107.0365.v1
Chromatography was performed with a Kinetex Phenyl Hexyl column (3.0 x 50 mm, 2.6 μm)
purchased from Phenomenex Inc. (Torrance, CA, USA).
Calibrators, Quality Controls, and Internal Standard Preparation
Matrix matched calibrators and controls were prepared by the addition of appropriate
volumes of methanolic stock standard mixes to 300 μL of cannabinoid free plasma. Working
standard mixes containing 0.01, 0.1, or 1.0 μg/mL of THC, THC-OH and THC-COOH were
prepared from stock standards obtained from Cerilliant. They were used to produce calibrators
for THC and THC-OH at 0.05, 0.1, 0.2 0.5, 1, 5, 10, and 50 ng/mL and calibrators for THC-
COOH at 0.2, 0.5, 1, 5, 10, and 50 ng/mL. Quality control samples were prepared at 0.7, 7, and
20 ng/mL for each analyte using working standard mixes of 0.01, 0.1, or 1.0 μg/mL of THC,
THC-OH and THC-COOH. These working standards were prepared from stock standard
obtained from Lipomed to verify the calibrators prepared from Cerilliant stock standards. Quality
control samples were run after every 20 subject samples with an expected accuracy of +/- 20%.
The internal standard mix solution contained 30 ng/mL THC-D3, 100 ng/mL THC-OH-D3, and
300 ng/mL THC-COOH-D9 in methanol.
Cannabinoid Analysis by LC-MS/MS
Plasma samples and matrix matched standards and quality controls were prepared for LC-
MS/MS analysis by protein precipitation, lipid removal, and derivatization with dansyl chloride.
10 μL of internal standard solution was added to 300 μL of plasma sample and mixed in a
microcentrifuge tube. 900 μL of acetonitrile containing 1% formic acid was added and vortexed
for 30 seconds to precipitate proteins. Samples were centrifuged and supernatants transferred to
Captiva EMR-Lipid columns for lipid removal. Using a positive pressure manifold, 3 psi of
pressure was applied to the samples to elute through columns. Eluents were collected into a clean
glass test tube and dried under nitrogen at 40oC prior derivatization. Dried eluents were
reconstituted in 100 μL of 1 mg/mL dansyl chloride in acetonitrile and transferred to autosampler
vials fitted with 400 μL glass inserts. 100 μL of a 0.1 M sodium carbonate-bicarbonate buffer
(pH 10) was added and the sample incubated at 55oC for 20 minutes to derivatize the analytes.
Samples were cooled to room temperature and neutralized with 10 μL of acetic acid prior to LC-
MS/MS analysis.
Samples were analyzed with an Agilent 1290 UHPLC coupled to an Agilent 6460 triple
quadruple mass spectrometer equipped with an Agilent Jet Stream electrospray ionization source
(Agilent, Santa Clara, CA). Cannabinoids were first chromagraphically separated on a
Phenomenex Phenyl Hexyl column (3.0 x 50 mm, 2.6 μm) held at 40°C. A sample volume of 10
μL was injected and a mixture of water with 0.1% formic acid (A) and acetonitrile with 0.1%
formic acid (B) at a flow rate of 0.4 mL/min. The gradient elution used was 40% B for 0.5
minutes, increasing to 80% B at 2 minutes, increasing to 100% B at 4.5 minutes, and held at
100% B for 1.5 minutes. The ionization source conditions used were as follows: positive
polarity, nebulizer 45 psi; gas flow of 10 L/min at 300°C; sheath gas flow of 12 L/min at 390°C;
capillary voltage of 3500 V; nozzle voltage of 200 V. The ion transitions monitored are
displayed in Table 8. Analytes were confirmed by retention time and the product ion ratio
correlation between the sample peaks and corresponding standards (± 20%). The data collection
and processing were performed by using Agilent MassHunter Quantitative software (v.B.08.01).
Quantitation was performed with linear regression using 8-point calibration curves from 0.05
ng/mL to 50 ng/mL for THC and THC-OH. A 6-point calibration curves from 0.2 ng/mL to 50Preprints (www.preprints.org) | NOT PEER-REVIEWED | Posted: 16 July 2021 doi:10.20944/preprints202107.0365.v1
ng/mL was used for THC-COOH. Analytical staff were naïve as to the edible marijuana
products (i.e. blind to specific products and conditions).
Table 8. LC-MS/MS ion transitions monitored for danysl derivatives of cannabinoids in human
plasma.
Precursor Frag CE Cell Acc
Analyte Name Product Ion Polarity
Ion (V) (V) (V)
Dansyl-THC-COOH 343.2 532 156 20 4 Positive
Dansyl-THC-COOH 343.2 227 156 56 4 Positive
Dansyl-THC-COOH-D9 587.3 233 156 56 4 Positive
Dansyl-THC-COOH-D9 587.3 170 156 40 4 Positive
Dansyl-THC-OH 564.3 241 139 64 4 Positive
Dansyl-THC-OH 564.3 256 139 36 4 Positive
Dansyl-THC-OH-D3 567.3 241 139 64 4 Positive
Dansyl-THC-OH-D3 567.3 256 139 36 4 Positive
Dansyl-THC 548.3 171 160 44 4 Positive
Dansyl-THC 548.3 156 160 80 4 Positive
Dansyl-THC-D3 551.3 171 160 44 4 Positive
Dansyl-THC-D3 551.3 156 160 80 4 Positive
Pharmacokinetic and Oral Glucose Tolerance Test Analysis
Pharmacokinetic analysis of the circulating concentrations of THC, THC-OH and THC-
COOH for each of the products was completed using dedicated software (PhoenixWinNonlin
v8.3, Certara, NJ, USA). Areas under the concentration curves were calculated using the linear
trapezoidal method.
Glucose and insulin data were processed using established methods. These included
calculation of Homeostatic Model Assessment for Insulin Resistance (HOMA-IR) [46] and
Matsuda Index [47]. Areas under the concentration curves for 2-hours (standard practice) and for
3.5 hours (practice specific to the current study) were calculated using the trapezoidal method.
Statistical Analyses
All data, unless otherwise stated, are expressed as mean and standard deviation.
Statistical calculations were performed using dedicated software (SigmaStat 3.0, Systat Software
Inc., San Jose, CA, USA). Differences in circulating concentrations of THC, THC-OH and THC-
COOH, glucose, and insulin over time and between products were examined using 2-way
analysis of variance (ANOVA; product x time), with repeated measures (time). Differences in
the pharmacokinetic properties between the edible marijuana products were examined using 1-
way ANOVA, with repeated measures. When criteria for parametric statistics were not satisfied
(i.e. normality and equal variance), a non-parametric alternative, Friedman Repeated Measures
ANOVA on ranks, was used. Tukey tests were employed to further interrogate identified main
effects. Relations between THC pharmacokinetic parameters and body size and composition
values were explored using Pearson correlations. The level of statistical significance was set at
PPreprints (www.preprints.org) | NOT PEER-REVIEWED | Posted: 16 July 2021 doi:10.20944/preprints202107.0365.v1
FUNDING:
Stillwater Brands (Colorado, USA) provided financial support for this study.
ACKNOWLEDGMENTS:
We are grateful to Keith Woelfel and Marian Van Vlack for administrative and logistical
support.
AUTHOR CONTRIBUTIONS
Conceptualization, T.R.E. and C.B.; Methodology, T.R.E. and C.B.; Formal Analysis, T.R.E.,
N.A., G.P.D., C.B.; Investigation, T.R.E., K.S.S.A., N.N.B.W., H.M.B., M.C.B., K.J.H., J.D.R.,
S.M.M., and C.B.; Resources, G.P.D. and C.B.; Data Curation, T.R.E., N.A., G.P.D., and C.B.;
Writing – Original Draft Preparation, T.R.E., and C.B.; Writing – Review & Editing, T.R.E.,
K.S.S.A., N.N.B.W., H.M.B., M.C.B., K.J.H., J.D.R., S.M.M., N.A., G.P.D., and C.B.;
Resources, G.P.D. and C.B.; Visualization, T.R.E. and C.B.; Supervision, C.B.; Project
Administration, C.B.; Funding Acquisition, C.B.
INSTITUTIONAL REVIEW BOARD STATEMENT:
The study was conducted according to the guidelines of the Declaration of Helsinki and
approved by the Institutional Review Board of Colorado State University (Protocol #20-10278H,
8th of October 2020).
INFORMED CONSENT STATEMENT:
Informed consent was obtained from all subjects involved in the study.
DATA AVAILABILITY STATEMENT:
The data presented in this study are available on request from the corresponding author.
CONFLICTS OF INTEREST:
The authors declare no conflict of interest.
REFERENCES
1. Borodovsky, J.T.; Crosier, B.S.; Lee, D.C.; Sargent, J.D.; Budney, A.J. Smoking, vaping,
eating: Is legalization impacting the way people use cannabis? Int J Drug Policy 2016,
36, 141-147, doi:10.1016/j.drugpo.2016.02.022.
2. Knapp, A.A.; Lee, D.C.; Borodovsky, J.T.; Auty, S.G.; Gabrielli, J.; Budney, A.J.
Emerging Trends in Cannabis Administration Among Adolescent Cannabis Users. J
Adolesc Health 2019, 64, 487-493, doi:10.1016/j.jadohealth.2018.07.012.
3. Cao, D.; Srisuma, S.; Bronstein, A.C.; Hoyte, C.O. Characterization of edible marijuana
product exposures reported to United States poison centers. Clin Toxicol (Phila) 2016,
54, 840-846, doi:10.1080/15563650.2016.1209761.
4. Richards, J.R.; Smith, N.E.; Moulin, A.K. Unintentional Cannabis Ingestion in Children:
A Systematic Review. J Pediatr 2017, 190, 142-152, doi:10.1016/j.jpeds.2017.07.005.Preprints (www.preprints.org) | NOT PEER-REVIEWED | Posted: 16 July 2021 doi:10.20944/preprints202107.0365.v1
5. Wang, G.S.; Le Lait, M.C.; Deakyne, S.J.; Bronstein, A.C.; Bajaj, L.; Roosevelt, G.
Unintentional Pediatric Exposures to Marijuana in Colorado, 2009-2015. JAMA Pediatr
2016, 170, e160971, doi:10.1001/jamapediatrics.2016.0971.
6. White, A.E.; Van Tubbergen, C.; Raymes, B.; Contreras, A.E.; Scallan Walter, E.J.
Cannabis-Infused Edible Products in Colorado: Food Safety and Public Health
Implications. Am J Public Health 2020, 110, 790-795, doi:10.2105/AJPH.2020.305601.
7. Kaczor, E.E.; Mathews, B.; LaBarge, K.; Chapman, B.P.; Carreiro, S. Cannabis Product
Ingestions in Pediatric Patients: Ranges of Exposure, Effects, and Outcomes. J Med
Toxicol 2021, 10.1007/s13181-021-00849-0, doi:10.1007/s13181-021-00849-0.
8. Newmeyer, M.N.; Swortwood, M.J.; Barnes, A.J.; Abulseoud, O.A.; Scheidweiler, K.B.;
Huestis, M.A. Free and Glucuronide Whole Blood Cannabinoids' Pharmacokinetics after
Controlled Smoked, Vaporized, and Oral Cannabis Administration in Frequent and
Occasional Cannabis Users: Identification of Recent Cannabis Intake. Clin Chem 2016,
62, 1579-1592, doi:10.1373/clinchem.2016.263475.
9. Schlienz, N.J.; Spindle, T.R.; Cone, E.J.; Herrmann, E.S.; Bigelow, G.E.; Mitchell, J.M.;
Flegel, R.; LoDico, C.; Vandrey, R. Pharmacodynamic dose effects of oral cannabis
ingestion in healthy adults who infrequently use cannabis. Drug Alcohol Depend 2020,
211, 107969, doi:10.1016/j.drugalcdep.2020.107969.
10. Vandrey, R.; Herrmann, E.S.; Mitchell, J.M.; Bigelow, G.E.; Flegel, R.; LoDico, C.;
Cone, E.J. Pharmacokinetic Profile of Oral Cannabis in Humans: Blood and Oral Fluid
Disposition and Relation to Pharmacodynamic Outcomes. J Anal Toxicol 2017, 41, 83-
99, doi:10.1093/jat/bkx012.
11. Williams, N.N.B.; Ewell, T.R.; Abbotts, K.S.S.; Harms, K.J.; Woelfel, K.A.; Dooley,
G.P.; Weir, T.L.; Bell, C. Comparison of Five Oral Cannabidiol Preparations in Adult
Humans: Pharmacokinetics, Body Composition, and Heart Rate Variability.
Pharmaceuticals (Basel) 2021, 14, doi:10.3390/ph14010035.
12. Johansson, E.; Noren, K.; Sjovall, J.; Halldin, M.M. Determination of delta 1-
tetrahydrocannabinol in human fat biopsies from marihuana users by gas
chromatography-mass spectrometry. Biomed Chromatogr 1989, 3, 35-38,
doi:10.1002/bmc.1130030109.
13. Schlag, A.K.; O'Sullivan, S.E.; Zafar, R.R.; Nutt, D.J. Current controversies in medical
cannabis: Recent developments in human clinical applications and potential therapeutics.
Neuropharmacology 2021, 191, 108586, doi:10.1016/j.neuropharm.2021.108586.
14. Breijyeh, Z.; Jubeh, B.; Bufo, S.A.; Karaman, R.; Scrano, L. Cannabis: A Toxin-
Producing Plant with Potential Therapeutic Uses. Toxins (Basel) 2021, 13,
doi:10.3390/toxins13020117.
15. Cuttler, C.; LaFrance, E.M.; Craft, R.M. A Large-Scale Naturalistic Examination of the
Acute Effects of Cannabis on Pain. Cannabis and cannabinoid research 2020,
10.1089/can.2020.0068, doi:10.1089/can.2020.0068.
16. Buckley, M.C.; Kumar, A.; Swaminath, A. Inflammatory Bowel Disease and Cannabis:
A Practical Approach for Clinicians. Adv Ther 2021, 10.1007/s12325-021-01805-8,
doi:10.1007/s12325-021-01805-8.
17. Buchanan-Peart, K.R.; Oribhabor, G.I.; Khokale, R.V.; Nelson, M.L.; Cancarevic, I.
Cannabis, More Than the Euphoria: Its Therapeutic Use in Drug-Resistant Epilepsy.
Cureus 2020, 12, e9299, doi:10.7759/cureus.9299.Preprints (www.preprints.org) | NOT PEER-REVIEWED | Posted: 16 July 2021 doi:10.20944/preprints202107.0365.v1
18. Dell, D.D.; Stein, D.P. Exploring the Use of Medical Marijuana for Supportive Care of
Oncology Patients. J Adv Pract Oncol 2021, 12, 188-201,
doi:10.6004/jadpro.2021.12.2.6.
19. Sidney, S. Marijuana Use and Type 2 Diabetes Mellitus: a Review. Curr Diab Rep 2016,
16, 117, doi:10.1007/s11892-016-0795-6.
20. Penner, E.A.; Buettner, H.; Mittleman, M.A. The impact of marijuana use on glucose,
insulin, and insulin resistance among US adults. Am J Med 2013, 126, 583-589,
doi:10.1016/j.amjmed.2013.03.002.
21. Ngueta, G.; Ndjaboue, R. Lifetime marijuana use in relation to insulin resistance in lean,
overweight, and obese US adults. J Diabetes 2020, 12, 38-47, doi:10.1111/1753-
0407.12958.
22. Imtiaz, S.; Rehm, J. The relationship between cannabis use and diabetes: Results from the
National Epidemiologic Survey on Alcohol and Related Conditions III. Drug Alcohol Rev
2018, 37, 897-902, doi:10.1111/dar.12867.
23. Barre, T.; Nishimwe, M.L.; Protopopescu, C.; Marcellin, F.; Carrat, F.; Dorival, C.;
Delarocque-Astagneau, E.; Larrey, D.; Bourliere, M.; Petrov-Sanchez, V., et al. Cannabis
use is associated with a lower risk of diabetes in chronic hepatitis C-infected patients
(ANRS CO22 Hepather cohort). J Viral Hepat 2020, 27, 1473-1483,
doi:10.1111/jvh.13380.
24. Podolsky, S.; Pattavina, C.G.; Amaral, M.A. Effect of marijuana on the glucose-tolerance
test. Ann NY Acad Sci 1971, 191, 54-60, doi:10.1111/j.1749-6632.1971.tb13986.x.
25. Hollister, L.E.; Reaven, G.M. Delta-9-tetrahydrocannabinol and glucose tolerance. Clin
Pharmacol Ther 1974, 16, 297-302, doi:0009-9236(74)90441-X [pii].
26. Permutt, M.A.; Goodwin, D.W.; Schwin, R.; Hill, S.Y. The effect of marijuana on
carbohydrate metabolism. Am J Psychiatry 1976, 133, 220-224.
27. Cinnamon Bidwell, L.; YorkWilliams, S.L.; Mueller, R.L.; Bryan, A.D.; Hutchison, K.E.
Exploring cannabis concentrates on the legal market: User profiles, product strength, and
health-related outcomes. Addict Behav Rep 2018, 8, 102-106,
doi:10.1016/j.abrep.2018.08.004.
28. Bidwell, L.C.; Ellingson, J.M.; Karoly, H.C.; YorkWilliams, S.L.; Hitchcock, L.N.;
Tracy, B.L.; Klawitter, J.; Sempio, C.; Bryan, A.D.; Hutchison, K.E. Association of
Naturalistic Administration of Cannabis Flower and Concentrates With Intoxication and
Impairment. JAMA Psychiatry 2020, 77, 787-796,
doi:10.1001/jamapsychiatry.2020.0927.
29. Stott, C.G.; White, L.; Wright, S.; Wilbraham, D.; Guy, G.W. A phase I study to assess
the single and multiple dose pharmacokinetics of THC/CBD oromucosal spray. Eur J
Clin Pharmacol 2013, 69, 1135-1147, doi:10.1007/s00228-012-1441-0.
30. Feng, J.; Huang, M.; Chai, Z.; Li, C.; Huang, W.; Cui, L.; Li, Y. The influence of oil
composition on the transformation, bioaccessibility, and intestinal absorption of curcumin
in nanostructured lipid carriers. Food Funct 2020, 11, 5223-5239,
doi:10.1039/d0fo00473a.
31. Lamsen, M.R.L.; Wang, T.; D'Souza, D.; Dia, V.; Chen, G.; Zhong, Q. Encapsulation of
vitamin D3 in gum arabic to enhance bioavailability and stability for beverage
applications. J Food Sci 2020, 10.1111/1750-3841.15340, doi:10.1111/1750-3841.15340.You can also read