Ecological Specialization Within a Carnivorous Fish Family Is Supported by a Herbivorous Microbiome Shaped by a Combination of Gut Traits and ...
←
→
Page content transcription
If your browser does not render page correctly, please read the page content below
ORIGINAL RESEARCH
                                                                                                                                      published: 15 February 2021
                                                                                                                                 doi: 10.3389/fmars.2021.622883

                                            Ecological Specialization Within a
                                            Carnivorous Fish Family Is Supported
                                            by a Herbivorous Microbiome
                                            Shaped by a Combination of Gut
                                            Traits and Specific Diet
                                            Arthur Escalas* , Jean-Christophe Auguet, Amandine Avouac, Raphaël Seguin,
                                            Antoine Gradel, Lucie Borrossi and Sébastien Villéger
                                            MARBEC, Université de Montpellier, CNRS, IRD, IFREMER, Montpellier, France

                                            Animals have been developing key associations with micro-organisms through
                                            evolutionary processes and ecological diversification. Hence, in some host clades,
                                            phylogenetic distance between hosts is correlated to dissimilarity in microbiomes, a
                           Edited by:
                                            pattern called phylosymbiosis. Teleost fishes, despite being the most diverse and
                Alfonso Benítez-Páez,
      Principe Felipe Research Center       ancient group of vertebrates, have received little attention from the microbiome
                         (CIPF), Spain      perspective and our understanding of its determinants is currently limited. In this
                      Reviewed by:          study, we assessed the gut microbiome of 12 co-occurring species of teleost
          Konstantinos Ar. Kormas,
      University of Thessaly, Greece        representing a large breadth of ecological diversity and originating from a single family
                       Fotini Kokou,        (i.e., the Sparidae). We tested how host evolutionary history, diet composition and
Wageningen University and Research,
                                            morphological traits are related to fish gut microbiome. Despite fish species having
                        Netherlands
                                            different microbiomes, there is no phylosymbiosis signal in this fish family, but gut
                  *Correspondence:
                        Arthur Escalas      length and diet had a strong influence on the microbiome. We revealed that the only
            arthur.escalas@gmail.com        species with a specialized herbivorous diet, Sarpa salpa had a 3.3 times longer gut than
                   Specialty section:
                                            carnivorous species and such a long gut favor the presence of anaerobic bacteria typical
         This article was submitted to      of herbivorous gut microbiomes. Hence, dietary uniqueness is paired with both unique
                 Microbial Symbioses,       gut anatomy and unique microbiome.
               a section of the journal
          Frontiers in Marine Science       Keywords: fish gut microbiome, Sparidae, phylosymbiosis, morphological traits, diet, herbivory, ecological outlier
       Received: 11 November 2020
        Accepted: 25 January 2021
       Published: 15 February 2021          INTRODUCTION
                              Citation:
    Escalas A, Auguet J-C, Avouac A,        All animals evolved and diversified within a microbial world, and consequently developed a
   Seguin R, Gradel A, Borrossi L and       myriad of associations with micro-organisms (McFall-Ngai et al., 2013). The abundant and diverse
           Villéger S (2021) Ecological     microbial communities present within and on the surface of animal bodies, i.e., the microbiomes,
   Specialization Within a Carnivorous      play a central role in the fitness of their host, providing benefits that include successful development
          Fish Family Is Supported by
                                            of the immune system and protection against pathogens, but also enhanced food processing and
a Herbivorous Microbiome Shaped by
           a Combination of Gut Traits
                                            nutrient absorption (McKenney et al., 2018a; Moran et al., 2019). These long histories of animal-
                     and Specific Diet.     microbes interactions resulted for many clades in phylosymbiosis, i.e., the eco-evolutionary pattern
            Front. Mar. Sci. 8:622883.      where phylogenetically related hosts tend to have more similar microbiomes than distantly related
    doi: 10.3389/fmars.2021.622883          ones (Brooks et al., 2016; Lim and Bordenstein, 2019). Further, phylosymbiosis signal in the

Frontiers in Marine Science | www.frontiersin.org                               1                                        February 2021 | Volume 8 | Article 622883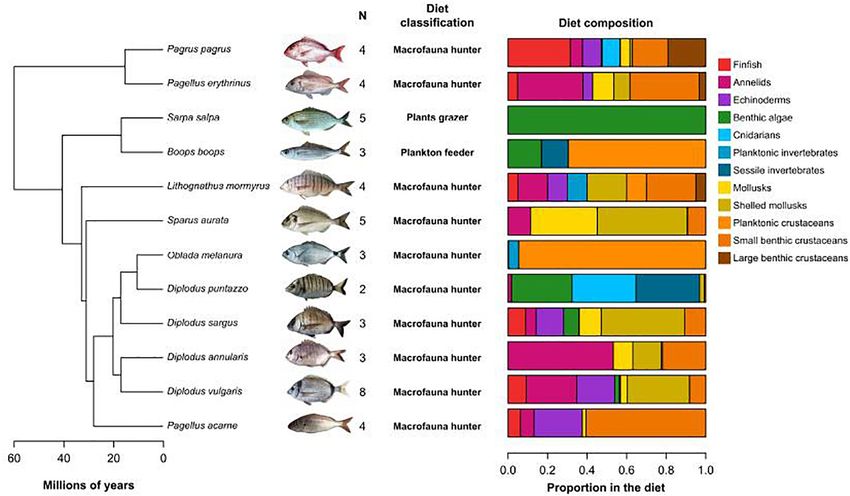
Escalas et al.                                                                                                 Ecological Outlier in Sparidae Fishes

gut microbiome was shown to be stronger when hosts share                     In this study, we assessed the gut microbiome of 12 species
a recent common ancestor (i.e., intra clade) than when shared             from a single family (Sparidae) representing a large breadth of
ancestry is more ancient (i.e., inter clades) (Groussin et al.,           diet and sampled from a single location (i.e., the North-Western
2017). Phylosymbiosis has been evidenced in many animals,                 Mediterranean Sea). We then assessed how host evolutionary
notably those for which vertical transmission of the microbiome           history, diet and gut anatomy are related to gut microbiome.
has been reported, such as in the gut of insects (Brucker and
Bordenstein, 2012; Haddow et al., 2013; Sanders et al., 2014;
Brooks et al., 2016), and mammals (Phillips et al., 2012; Sanders         MATERIALS AND METHODS
et al., 2014), or on the skin of mammals (Ross et al., 2018)
and elasmobranchs (Doane et al., 2020). However, evidences                Samples Collection
are far less pronounced in animals with horizontal microbiome             Fishes were collected in the shallow habitats (2–10 m) of
transmission, with the report of weak to no support for skin              the North-Western coast of Gulf of Lions (Hérault, France,
phylosymbiosis in amphibians (Bletz et al., 2017) and marine              Mediterranean Sea) between June 2018 and February 2019. Fishes
fishes (Chiarello et al., 2018, 2019; Doane et al., 2020).                were caught at night by artisanal fishermen at the end of the night
    Marine teleost fishes gather >10,000 species and >100                 using gillnets, stored on ice on the boat and were processed within
families, and a large range of ecological strategies, with for            3 h after being caught. Fish were dissected using tools cleaned
instance diet ranging from herbivory to top-predators even                with 70◦ ethanol, the gut was stretched and a picture was taken
within some families (e.g., Labridae, Sparidae). However, to              for morphometric measurements. The last third of the gut, before
date only a few studies have assessed the microbiome of                   the cloaca, was squeezed out on a piece of parafilm paper using
several fish species from a single ecosystem using sequencing-            a sterile pipette. If this gut content was made of digested food
based approaches (Givens et al., 2015; Miyake et al., 2015;               (i.e., not only mucus) it was then homogenized and collected in a
Sullam et al., 2015; Sylvain et al., 2019; Ruiz-Rodríguez                 3 mL cryotube before storage at −80◦ C until DNA extraction. Gut
et al., 2020). Consequently, the presence or absence of gut               microbiome from a total of 48 adult individuals from 12 Sparidae
phylosymbiosis in the gut microbiome of marine fishes has                 species were sampled (2 to 8 individuals per species, Figure 1 and
never been tested. However, a case of co-phylogeny, i.e.,                 Supplementary Table 1).
congruent phylogeny between hosts and individual members
of their microbiome, has been reported between Acanthuridae               Phylogenetic, Dietary and Morphological
(i.e., surgeonfishes) and the bacteria Epulopiscium spp., a genus         Dissimilarity Between Hosts
from the class Clostridia in the Firmicutes phylum (Miyake                Phylogenetic distances between fish species were estimated as the
et al., 2015, 2016). This specific host-microbes association              cophenetic distance extracted from the only multi-locus time-
between a bacterial clade and a fish family could still be                calibrated phylogeny of Sparidae (Santini et al., 2014; Figure 1).
coupled with low association between the whole microbiome                    Diet of all species was recovered from food items listed in
and host phylogeny, especially when considering fishes from               FishBase (Froese and Pauly, 2003), selecting only reports from
different families.                                                       the Mediterranean Sea and only included adults records. FishBase
    Beside hosts identity and long term association with micro-           uses different levels of food items classification and we used the
organisms that result in phylosymbiosis, the composition of the           level that allows discriminating between groups of plants and
gut microbiome in marine teleosts is influenced by many factors           invertebrates. This included the following food items: benthic
(Sullam et al., 2012; Nikouli et al., 2020). Environment plays            algae, finfish, planktonic crustaceans, planktonic invertebrates,
a role by influencing bacterioplankton communities, notably               small benthic crustaceans, large benthic crustaceans, sessile
for marine fishes who continuously drink seawater to maintain             invertebrates, echinoderms, annelids, cnidarians, mollusks, and
osmolarity (Baldisserotto et al., 2019). This flow of environmental       shelled mollusks (Figure 1). The records were averaged for each
micro-organisms contributes to the early stages of gut microbial          species and resulted in a matrix containing the proportions of
colonization and will influence microbiome composition at later           each item in the diet of each species. Species were classified
stages (Egerton et al., 2018; Nikouli et al., 2019). Hosts diet           into three groups according to their main type of prey (plants,
also shapes the gut microbiome of fishes as food composition              plankton, and macrofauna). The prey proportion matrix was
influences the type of resources available to gut micro-organisms         used to compute diet dissimilarity between species using the
and places the hosts in contact with the microbiomes of their             Bray-Curtis index.
prey (Sullam et al., 2012). Additionally, fishes have specific               Gut morphology was characterized using gut length (mm) and
gut morphological traits that depend on their diet with, for              gut length relative to fish standard length (from snout to basis
instance, the presence of a gizzard in some species that consume          of the caudal fin). Fishes morphological features were measured
sediment or a differentiated hindgut in herbivores which result           at the individual level and species-level traits were estimated
in anaerobic conditions that favor certain micro-organisms                as the average across individuals from that species (Figure 1).
(Mountfort et al., 2002; Clements et al., 2009; Egerton et al.,           Inter-species morphological dissimilarity was computed using
2018). Despite these recent advances, the overall role of diet            Euclidean distance. Phylogenetic conservatism of gut traits was
and anatomy in shaping the gut microbiome still remains                   tested using Abouheif test (Abouheif, 1999), which is designed
to be unfolded, especially within families where ecological               to detect phylogenetic autocorrelation in a quantitative trait, as
diversification occurred.                                                 implemented in the adephylo package (Jombart et al., 2010).

Frontiers in Marine Science | www.frontiersin.org                     2                                   February 2021 | Volume 8 | Article 622883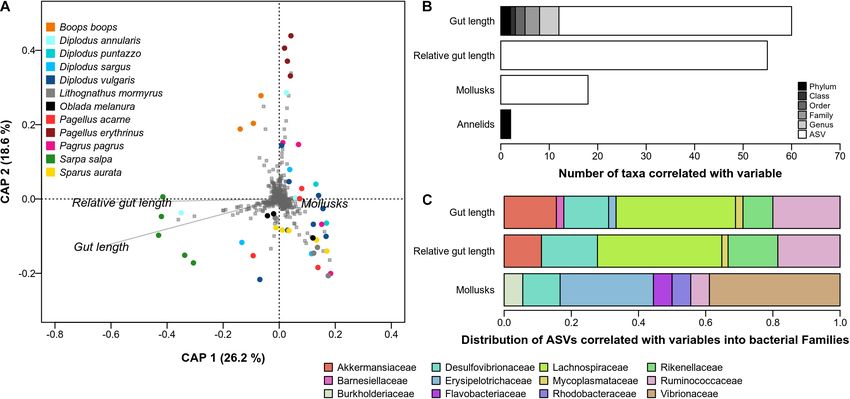
Escalas et al.                                                                                                                        Ecological Outlier in Sparidae Fishes

    FIGURE 1 | Phylogenetic relatedness and diet of the 12 studied species. Phylogeny of the Sparidae used in this study (from Santini et al., 2014). N is the number of
    individuals analyzed per species. Diet classification and proportions of food items in the diet were collected in FishBase.

DNA Extraction                                                                           DNA was stored at 4◦ C until PCR amplification, which was
DNA extractions were performed in the molecular biology                                  done the next day.
platforms of the MARBEC laboratory (UMR 9190)1 and at
the GenSeq platform2 , using the Qiagen MagAttract PowerSoil                             PCR Amplification
DNA KF Kit, selected for its compliance with the Earth                                   PCR amplification was done using primers selected for their
Microbiome Project (Marotz et al., 2017). Extractions were                               compliance with the Earth Microbiome Project (Parada et al.,
performed in 96 wells plates in which three wells were left                              2016): 515F-Y (50 -GTGYCAGCMGCCGCGGTAA) and 926R
empty to serve as negative controls and three wells were                                 (50 -CCGYCAATTYMTTTRAGTTT). The targeted sequence was
loaded using standard mock communities (ZymoBIOMICS                                      411 bp and corresponded to the V3–V4 regions of the prokaryotic
Microbial Community DNA Standards II, Zymo Research).                                    16S rRNA gene. PCR amplification was carried out in 96 well
These standards were used to evaluate the quality of our sample                          plates in triplicate for each DNA extract and was done in a
processing pipeline and to identify potential contaminants                               25 µL reaction volume. The PCR mix consisted of 9.75 µL of
from the reagents. Extraction wells were loaded with one                                 water, 0.75 µL of DMSO, 0.5 µL of each primer (concentration),
spatula of homogenized gut content (∼0.25 g). DNA extraction                             12.5 µL of Phusion ready-to-use Taq mix (Phusion High-Fidelity
protocol followed the manufacturer instructions. It included a                           PCR Master Mix with GC Buffer), and 1 µL of DNA. The
chemical lysis consisting of 60 µL of manufacturer provided                              PCR cycle consisted of 35 cycles of 10 s denaturation at 98◦ C,
SL solution heated at 60◦ C and added before a bead beating                              1 min annealing at 58◦ C, and 1 min 30 s of extension at 72◦ C.
step, which corresponded to 10 min at 20 Hz using a Tissue                               Final extension was held for 10 min at 72◦ C before keeping the
Lyzer, then the plate was flipped and shake again for 10 min                             reaction at 4◦ C. The success of PCR amplification was checked
at 20 Hz. DNA recovery was based on magnetic beads and                                   on 2% agarose gel in TAE buffer and using a 100 bp DNA
automated with a Kingfisher Flex robot. DNA was eluted in                                ladder. The wells left empty during DNA extraction served as
200 µL of elution buffer before quantification of DNA quantity                           negative controls for contamination of the PCR reactions. PCR
and quality using a NanoDrop 8000 spectrometer. Extracted                                triplicates were pooled and stored at −20◦ C before sequencing.
                                                                                         Amplicons library was constructed by the Genotoul platform3
1
    www.umr-marbec.fr
2                                                                                        3
    genseq.umontpellier.fr                                                                   get.genotoul.fr

Frontiers in Marine Science | www.frontiersin.org                                    3                                          February 2021 | Volume 8 | Article 622883
Escalas et al. Ecological Outlier in Sparidae Fishes
and sequencing was carried out using an Illumina MiSeq ASVs across samples and ASVs identified as core are presented
(2 × 250 bp) sequencer. in Supplementary Figure 1.
Amplicon Sequencing and Sequences Relationships Between Microbiome
Processing Dissimilarity and Host Ecological,
The demultiplexed reads were processed using the R software Morphological and Phylogenetic
environment and the package dada2 (Callahan et al., 2016). Dissimilarities
Briefly, the quality of the reads for each sample was inspected In order to test for phylosymbiosis signal and identify the
using graphic representations of their quality scores and reads determinants of the core microbiome in Sparidae fishes,
were filtered based on their length and quality. Amplicon we computed microbiome dissimilarity using complementary
sequence variants (ASVs) were inferred using the dada diversity indices at several ranks of the bacterial taxonomy. Inter-
algorithm (Divisive Amplicon Denoising Algorithm) after species dissimilarities were estimated after taking the average taxa
pooling dereplicated reads from all samples. Then, forward abundance across all the individuals from each species.
and reverse reads were merged and chimeric sequences were We used six dissimilarity indices from the Hill numbers
removed. After these steps, a third of the original sequences framework (Chao et al., 2014), as these combine taxonomic
were kept for further analyses, on average. The taxonomic and phylogenetic dissimilarities within a common mathematical
classification of ASVs was performed with the naive Bayesian framework. In addition, Hill numbers allow the estimation
RDP classifier implemented in dada2 and using the SILVA of composition and structure dissimilarity by giving more or
reference database nr_V132 (10.5281/zenodo.1172783). As many less weight to taxa abundances, depending on the value of a
ASVs were not affiliated at the genus level, ASVs sequences parameter, the order q. These six indices were computed for
were blasted against the NCBI 16S rRNA bacterial and archaeal six ranks across the bacterial taxonomy (Phylum, Class, Order,
database, and the best hit was used to assign ASVs at Family, Genus, and ASVs). For that, all the ASVs were aggregated
the genus level. at a given taxonomic rank and we computed dissimilarity on
Several data cleaning steps were performed to remove poorly aggregated data. In a second approach, we tested whether intra-
characterized and rare ASVs. First, the mock communities and taxa dissimilarity was related with host dissimilarity. Here, the
blank samples were used to identify contamination from the dataset was split into individual bacterial taxa for the highest
reagents (e.g., extraction kit, polymerase), and these ASVs were taxonomic ranks (Phylum, Class, and Order) and dissimilarity
removed from the data set (e.g., Ralstonia, Rhizobium). Second, was computed using only the ASVs from the focus taxa. For
ASVs not assigned to the bacterial domain, unclassified at the this analysis we used only the taxa that were represented by
Class level, assigned to chloroplasts or mitochondria were filtered at least 10 ASVs (N = 31 taxa corresponding to 7 phyla, 10
out. Third, ASVs present in less than two samples were removed. classes, and 14 orders).
Amplicon sequence variants sequences were aligned using We used Mantel tests implemented in the R package ecodist
mafft implemented in Qiime2 before being inserted in the (Goslee and Urban, 2007) to test the relationships between
Greengene reference phylogenetic tree (Janssen et al., 2018). The microbiome and host (phylogenetic, dietary, and morphological)
tree was then ultrametricized using pathd84 . dissimilarity matrices.
Identification of the Core Microbiome Identification of Gut Microbiome
The core microbiome of Sparidae fishes, i.e., the most frequent Determinants in Sparidae Fishes
and/or abundant bacterial members of their microbiome, was Differences between species and diet types in terms of gut
estimated for the 12 Sparidae species altogether using the core microbiome structure were tested using multivariate Welch
identification algorithm from Magurran and Henderson (2003). MANOVA (Wd test, Hamidi et al., 2019) implemented in
This method accounts for both ASVs occurrence and abundance the R package MicEco (Russel, 2020). This approach has the
across communities and is based on the comparison of the advantage, over classically used PERMANOVA, of being robust
observed abundance-occurrence distribution of ASVs with a to heteroscedasticity in the data, i.e., differences in multivariate
random distribution under a stochastic Poisson model. We groups dispersion. Association of host species and diet types with
selected two individuals from each species in order to give particular bacterial taxa was assessed using the LEfSe approach
equal weight to each species and the procedure was repeated (Segata et al., 2011).
1000 times using different combinations of individuals for the We used constrained analysis on principal coordinates (CAP
species represented by more than two individuals. Then, we analysis, Anderson and Willis, 2003) to determine which of the
defined the size of the core as the median number of core ASVs diet, gut anatomy and host phylogeny explained the better the
(n = 842 ASVs) observed across all 1000 combinations and thus differences in microbiome structure. Then, we identified which
the core microbiome of Sparidae was defined as the 842 ASVs microbial taxa correlated with particular diet items or traits.
that were considered as core the highest number of times across Again, this was done for all the combinations of dissimilarity
the 1000 replicates. The abundance-occurrence distribution of indices and bacterial taxonomic ranks. CAP models were defined
to explain microbiome dissimilarity by (i) the proportions of
4
www2.math.su.se/PATHd8 the 12 dietary items, (ii) the values of the two morphological
Frontiers in Marine Science | www.frontiersin.org 4 February 2021 | Volume 8 | Article 622883Escalas et al. Ecological Outlier in Sparidae Fishes
traits, and (iii) the phylogenetic relatedness of the hosts. This by Bacteroidia (19.4%), Clostridia (18.3%), Deltaproteobacteria
later was included as phylogenetic eigenvectors resulting from the (8.7%), Alphaproteobacteria (5.5%), Verrucomicrobiae (4.1%),
decomposition of the cophenetic distance matrix between hosts Bacilli (3.8%), Mollicutes (3.2%), Erysipelotrichia (3.3%), and
performed using the R package PVR (Diniz-Filho et al., 1998; Oxyphotobacteria (2.6%). Dominant bacterial family and genus
Santos, 2018). The individual effect of each explaining variable markedly varied among species with only no genus and four
was tested using ANOVA and the anova.cca function in R. families (Rikenellaceae, Lachnospiraceae, Desulfovibrionaceae,
and Vibrionaceae) that reached 10% of relative abundance
in more than two species (Table 1). Hence, gut microbiome
RESULTS structure differed significantly between host species, with
26 out of 36 tests (6 bacterial taxonomic ranks times 36
Phylogenetic Relationships and dissimilarity indices) being significant (Wd test, p-value < 0.05,
Morphological Similarity of Supplementary Figure 4). The F-values associated were low,
2.5 ± 1.9 on average, and the p-values tended to decrease
Mediterranean Sparidae at lower bacterial taxonomic ranks. Gut microbiome structure
The 12 studied Sparidae species shared a common ancestor also differed significantly between the three diet types with 32
around 60 million years ago and separated in two main out of 36 tests being significant (Wd test, p-value < 0.05, 29
branches which do not contain recent ( 0.05, Figure 2). Diet dissimilarity
(40), Verrucomicrobia (35), Tenericutes (17), and Actinobacteria was related to microbiome dissimilarity in only one out
(13). The eight remaining phyla were represented by 1 to 8 ASVs. of 36 tests, i.e., using taxonomic microbiome dissimilarity
Three dominant phyla represented 84.3% of the sequences, computed on presence-absence data at the bacterial order
with 39.7% for Proteobacteria, 25.2% for Firmicutes, and level (q = 0). Morphological dissimilarity based on gut traits
19.4% for Bacteroidetes (Supplementary Figure 3). All the was significantly related to microbiome dissimilarity in five
other phyla represented less than 5%. At the class level, instances (out of 72 Mantel tests, p-values < 0.05), all
Gammaproteobacteria was the most abundant (25.5%), followed with abundance-weighted phylogenetic dissimilarity (q = 2)
Frontiers in Marine Science | www.frontiersin.org 5 February 2021 | Volume 8 | Article 622883Escalas et al. Ecological Outlier in Sparidae Fishes
Pagrus Sarpa Sparus
erythrinus pagrus salpa aurata
computed at higher ranks of bacterial taxonomy (Phylum = 1,
1.2
3.1
4.0
2.5
3.1
1.9
2.9
6.9
5.9
50.2
Class = 2, Order = 2).
We found 11 significant relationships between intra-
7.4
40.4
13.5
1.6
5.8
12.7
taxa abundance-weighted (q = 2) phylogenetic dissimilarity
(Supplementary Figure 5) and host dissimilarity (phylogenetic,
2.6
4.7
4.5
6.8
7.2
1.1
2.3
1.8
8.7
8.7
17.6
1.0
diet and morphological). Half of these relationships were
negative (6/13) and, overall, the strength of the relationships
was weak. Only one significant relationship involved host
Pagellus
1.9
3.0
19.3
5.9
7.4
34.7
phylogenetic distance, which was found to be negatively related
with dissimilarity in the order Desulfovibrionales. The strongest
association was found between phylogenetic dissimilarity within
Pagellus
acarne
4.9
18.8
1.9
5.3
3.5
6.8
4.8
10.7
5.5
the Bacillales order and Bacilli class (Firmicutes phylum) and
Relative abundance (% of sequences)
dissimilarity in gut traits.
melanura
Oblada
5.6
4.0
1.8
1.1
4.2
1.9
9.1
11.2
24.5
Association Between Sparidae
Microbiome, Gut Morphological Traits,
Boops Diplodus Diplodus Diplodus Diplodus Lithognathus
mormyrus
Diet Items, and Host Phylogeny
14.5
2.5
2.2
10.9
2.3
10.6
16.8
12.6
More than half (n = 19, 53%) of the CAP models testing the
relationship between gut traits, diet composition, host phylogeny,
and microbiome structure were significant (i.e., p-value < 0.05
vulgaris
2.1
4.8
3.8
2.3
4.1
2.8
2.4
1.0
19.8
9.7
6.6
4.2
1.7
in 19 out of 36 models, Supplementary Table 4). The first
two axes of the significant CAP models explained between 41
and 91% of the variation in gut microbiome (Supplementary
sargus
29.6
9.2
4.8
8.8
6.9
5.1
4.1
Figure 6). Among these 19 significant CAP models, the most
influential variable was by far gut length, as it exhibited the
highest number of significant relationships with microbiome
boops annularis puntazzo
1.3
10.6
14.6
3.4
6.4
6.0
components (n = 19) and the highest F-values (Supplementary
TABLE 1 | Relative abundance of the main bacterial families in the gut microbiome of Mediterranean Sparidae.
Table 4). The proportion of Echinoderms and Mollusks in
Only the bacterial families with a relative abundance higher than 10% in at least one species are represented.
the diet was the second and third most influential traits,
4.4
1.9
11.1
7.9
13.7
8.7
8.3
2.0
1.5
followed by relative gut length. Phylogenetic eigenvectors did
not explain significant proportion of the variance in any
of the CAP models.
27.9
13.6
13.4
6.9
16.5
11.6
Hereafter, we focus on the results obtained using abundance-
weighted taxonomic dissimilarity (q = 1) as this method yielded
Endozoicomonadaceae
a significant CAP model five out of six taxonomic ranks
Desulfovibrionaceae
Entomoplasmatales Entomoplasmatales
Ruminococcaceae
Flavobacteriaceae
(i.e., not at the Class) and explained a high proportion of
Burkholderiaceae
Lachnospiraceae
Cyanobiaceae
Rikenellaceae
variance in microbiome composition, on average (88 ± 8%).
Marinifilaceae
Vibrionaceae
Pirellulaceae
Listeriaceae
The first CAP axis explained 26.2% of the variation and
Family
mostly separated the species with a long gut that do not
consume Mollusks, i.e., S. salpa, from the other species
(Figure 3A). The second CAP axis explained 18.6% of the
Empty cells means relative abundance was lower than 1%.
Desulfovibrionales
Synechococcales
Gammaproteobacteria Oceanospirillales
Flavobacteriales
variation and separated two species, P. erythrinus and B. boops,
Burkholderiales
Bacteroidales
Clostridiales
from the others.
Vibrionales
Pirellulales
Bacillales
We found 131 significant correlations between gut traits
Order
or the proportions of diet items and the abundance of
bacterial taxa at different ranks. Only four were negative, which
corresponded to the negative association between gut length
Deltaproteobacteria
Betaproteobacteria
Oxyphotobacteria
Planctomycetes Planctomycetacia
and Proteobacteria, Betaproteobacteriales and Burkholderiaceae,
and between Annelids and Firmicutes. Gut length was the
Bacteroidia
Mollicutes
Clostridia
variable that correlated with the highest number of bacterial
Class
Bacilli
taxa (Figure 3B), i.e., 60 including 48 ASVs, and was the only
variable associated with taxa across all the taxonomic ranks
Proteobacteria
Cyanobacteria
(i.e., phylum to ASVs). The strongest correlations included
Bacteroidetes
Tenericutes
Taxonomy
Firmicutes
those with the Clostridia class and the Clostridiales order
Phylum
(r = 0.83, p-value < 0.001), the Lachnospiraceae family (r = 0.81,
p-value < 0.001) and one of its ASV (r = 0.87, p-value < 0.001).
Frontiers in Marine Science | www.frontiersin.org 6 February 2021 | Volume 8 | Article 622883Frontiers in Marine Science | www.frontiersin.org
Escalas et al.
TABLE 2 | Bacterial taxa associated with Sparidae species and diet types.
Phylum Class Order Family Genus Number of Average Kruskal Group in which taxa
associated ASVs test FDR is the most abundant
corrected p-value
Species Diet type
Actinobacteria Coriobacteriia Coriobacteriales Coriobacteriales Incertae Sedis Raoultibacter 1 0.0306 MH
Bacteroidetes Bacteroidia Bacteroidales Barnesiellaceae 4 0.0135 APG
Bacteroidetes Bacteroidia Bacteroidales Burkholderiaceae 1 0.0069 SPF
1 0.0047 APG
Bacteroidetes Bacteroidia Bacteroidales Rikenellaceae 3 0.0012 SPF
Alistipes 7 0.0031 APG
5 0.0056 SPF
1 0.0495 B. boops
1 0.0296 MH
1 0.0208 S. salpa
Rikenella 9 0.0096 APG
9 0.0033 SPF
3 0.0166 B. boops
1 0.0219 MH
1 0.0208 D. sargus
Bacteroidetes Bacteroidia Flavobacteriales Flavobacteriaceae Actibacter 2 0.0495 S. aurata
7
Muriicola 1 0.0421 SPF
Chloroflexi Anaerolineae Anaerolineales Anaerolineaceae UTCFX1 1 0.0001 D. puntazzo
Firmicutes Bacilli Bacillales Planococcaceae Caryophanon 5 0.0021 APG
Clostridia Clostridiales Clostridiales vadinBB60 group 1 0.0027 SPF
1 0.0010 APG
Family XIII 1 0.0238 SPF
Lachnospiraceae 16 0.0012 APG
9 0.0251 S. salpa
1 0.0010 SPF
Parasporobacterium 1 0.0014 S. salpa
1 0.0000 APG
February 2021 | Volume 8 | Article 622883
Tyzzerella 8 0.0005 APG
Ecological Outlier in Sparidae Fishes
7 0.0055 SPF
1 0.0446 B. boops
Peptostreptococcaceae Romboutsia 1 0.0030 SPF
Ruminococcaceae 21 0.0065 APG
9 0.0012 SPF
7 0.0214 S. salpa
3 0.0001 B. boops
(Continued)Frontiers in Marine Science | www.frontiersin.org
Escalas et al.
TABLE 2 | Continued
Phylum Class Order Family Genus Number of Average Kruskal Group in which taxa
associated ASVs test FDR is the most abundant
corrected p-value
Species Diet type
Aerofilm 1 0.0010 APG
Angelakisella 3 0.0105 APG
1 0.0027 SPF
HydrogenoAerobacterium 1 0.0002 SPF
Intestinimos 2 0.0284 SPF
1 0.0005 APG
Pygmaiobacter 1 0.0010 APG
Ruminiclostridium 5 2 0.0024 APG
Ruminococcaceae UCG-005 2 0.0227 APG
Ruminococcaceae UCG-008 6 0.0022 SPF
Ruminococcaceae UCG-014 1 0.0296 MH
Ruminococcus 1 0.0055 APG
Planctomycetes Planctomycetacia Pirellulales Pirellulaceae 4 0.0324 P. erythrinus
Blastopirellula 2 0.0018 P. erythrinus
Rhodopirellula 1 0.0281 P. erythrinus
Rubripirellula 1 0.0495 D. puntazzo
8
1 0.0251 D. annularis
Proteobacteria Alphaproteobacteria Rhizobiales Rhizobiaceae 1 0.0499 P. erythrinus
Ahrensia 1 0.0028 P. erythrinus
Rhodobacterales Rhodobacteraceae 1 0.0001 P. erythrinus
Roseobacter 1 0.0446 P. erythrinus
Sphingomonadales Sphingomonadaceae Sphingomonas 1 0.0053 SPF
Deltaproteobacteria Desulfobacterales Desulfovibrionaceae 7 0.0488 S. salpa
1 0.0001 B. boops
Desulfovibrio 8 0.0031 B. boops
8 0.0055 SPF
7 0.0001 APG
Desulfovibrio 8 0.0000 SPF
February 2021 | Volume 8 | Article 622883
Erysipelotrichaceae 4 0.0024 APG
Ecological Outlier in Sparidae Fishes
Gammaproteobacteria Cellvibrionales Microbulbiferaceae Microbulbifer 1 0.0267 D. puntazzo
Vibrionales Vibrionaceae 3 0.0409 SPF
Photobacterium 1 0.0006 SPF
Vibrio 1 0.0296 SPF
Tenericutes Mollicutes Mycoplasmatales Mycoplasmataceae Ureaplasma 1 0.0048 S. salpa
1 0.0000 APG
The associations between ASVs and groups of samples (species or diet categories) were estimated using LEfSe analysis and the differences between groups were tested using Kruskal–Wallis test (FDR corrected). SPF,
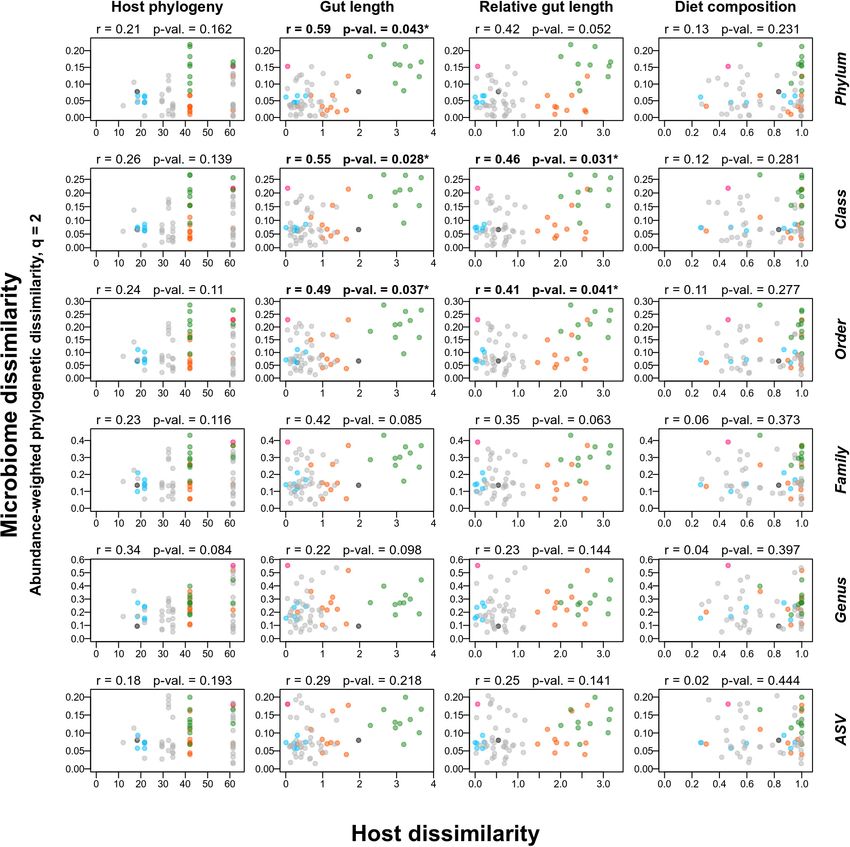
selective plankton feeder; APG, aquatic plants grazer; MH, macrofauna hunter.Escalas et al. Ecological Outlier in Sparidae Fishes FIGURE 2 | Gut traits explain differences in the phylogenetic structure of the microbiome better than host phylogeny or diet. Relationships between dissimilarity of the gut microbiome (Y axes) and phylogenetic, morphological, and dietary dissimilarity (columns) between host fishes (X axis) using Mantel tests (for each subplot: r = correlation between X and Y variables and p-value = p-value of the Mantel test, bolded r and p-values correspond to significant relationships). Gut microbiome dissimilarity, here estimated using abundance-weighted Hill numbers phylogenetic index with q = 2, was computed at six different levels of taxonomic resolution (row names on the right of the figure). Each point represents a pair of fish species. Pairs within the Diplodus genus are depicted in blue, pair within the Pagellus genus is depicted in pink, pair between Sarpa salpa and Boops boops is depicted in black and other pairs that included S. salpa or B. boops are depicted in green and orange, respectively. The other traits/items were mostly associated with ASVs, 55 for (6 ASVs). Mollusks were associated with two main phyla. relative gut length and 18 for Mollusks. Firmicutes, mostly from the Erysipelotrichaceae (5 ASVs), and Gut length was mostly associated with Firmicutes from Gammaproteobacteria (8 ASVs). the Clostridia class (Figure 3C), notably the Lachnospiraceae Tyzerella (8 ASVs), and several Ruminococcaceae (9 ASVs). The genera Akkermansia (7 ASVs, Verrucomicrobia) and DISCUSSION Alistipes (4 ASVs, Bacteroidetes) were also well represented. Desulfovibrionaceae (6 ASVs, Deltaproteobacteria) and Composition of the Core Microbiome of Rikenellaceae (4 ASVs) were also identified. Relative gut Sparidae From the Mediterranean Sea length was associated with ASVs from similar families and The core microbiome of the 12 Sparidae species studied genus: Tyzerella (12 ASVs), Alistipes (7 ASVs), Akkermansia here was typical of what is reported for marine fishes Frontiers in Marine Science | www.frontiersin.org 9 February 2021 | Volume 8 | Article 622883
Escalas et al.                                                                                                                       Ecological Outlier in Sparidae Fishes

  FIGURE 3 | Association between microbiome, gut morphological traits and diet items in Sparidae. (A) Constrained analysis on principal coordinates (CAP) analysis.
  Fish individuals are represented by colored dots, gut traits and diet items are represented by italicized labels and arrows, bacterial ASVs are represented by gray
  squares. Dissimilarity between microbiomes was estimated using abundance-weighted taxonomic dissimilarity (Hill diversity with q = 1). Only the variables identified
  as explaining a significant proportion of total microbiome variation are depicted (ANOVA.CCA, p-value < 0.05). (B) Number of taxa whose abundance are
  significantly correlated with variables that explained a significant proportion of microbiome variation. ASVs correspond to panel (A) while other ranks correspond to
  plots in Supplementary Figure 4. (C) The ASVs associated with explaining variables (white bars in panel B) were taxonomically assigned at the Family level and
  their proportion were estimated.

(Sullam et al., 2012; Egerton et al., 2018), i.e., a dominance of                       abundance-occurrence distribution of ASVs (Fillol et al., 2016;
Proteobacteria, Bacteroidetes, and Firmicutes, with these three                         Jeanbille et al., 2016) and not on arbitrarily defined occurrence
phyla representing more than 84% of the sequences. Our results                          or abundance thresholds. This could explain the high number of
also confirm that the genus Vibrio, albeit dominant on the mucus,                       ASVs identified as core (n = 842) compared with other studies
skin and gills of teleost (Chiarello et al., 2018; Ruiz-Rodríguez                       (e.g., n = 15 in Sullam et al., 2015; 0 < n < 110 in Chiarello
et al., 2020), represents only a small proportion of their gut                          et al., 2018; n = 7 in Nikouli et al., 2020). Indeed, in our method,
microbiome. Regarding Sparidae’ microbiome, the literature is                           even ASVs observed in a low number of species (low occurrence)
highly skewed toward one species, Sparus aurata, which is used                          but that were consistently abundant within individuals from these
as a model in aquaculture (Dimitroglou et al., 2010; Estruch et al.,                    species were identified as core.
2015; Nikouli et al., 2019; Rosado et al., 2019), while microbiomes
of most other Sparidae have not been described in the wild, with
the exception of a recent study (Ruiz-Rodríguez et al., 2020). To                       Weak Support for Phylosymbiosis in the
our knowledge, our study provides the first report of the gut                           Gut Microbiome of Sparidae Fishes
microbiome composition for five species: B. boops, D. puntazzo,                         Overall, we found little support for the existence of gut
Diplodus sargus, Lithognathus mormyrus, and Pagellus acarne.                            phylosymbiosis in Sparidae fishes, i.e., we did not observe
The structure of the gut microbiome significantly differed                              significant relationships between host phylogenetic relatedness
between the 12 studied species, with no genus and only four                             and microbiome dissimilarity (using both Mantel tests and CAP
families (Rikenellaceae, Lachnospiraceae, Desulfovibrionaceae,                          analysis). Such result is in agreement with the observation of
and Vibrionaceae) representing more than 10% of the sequences                           weak phylosymbiosis signal in skin microbiome of teleost fishes
in more than two host species. Species-specific gut microbiomes                         (Chiarello et al., 2018; Doane et al., 2020; Sylvain et al., 2020).
have been reported for other marine fishes both within and                              In our case, the absence of phylosymbiosis, despite inter-species
between families (Miyake et al., 2015; Ruiz-Rodríguez et al.,                           differences, is driven by the fact that the 10 carnivorous species
2020), but some studies also reported the absence of inter-specific                     are spread on the two main branches of the Sparidae phylogeny
difference because of high inter-individual variability in the gut                      while they have similar gut traits and microbiome. For instance,
microbiome (Nikouli et al., 2020).                                                      P. erythrinus and Pagrus pagrus are phylogenetically distant
   It is worth mentioning that the method used here to                                  but have a microbiome similar to those of most of the other
identify the members of the core microbiome was based on the                            Mediterranean Sparidae (i.e., the Diplodus cluster, the other

Frontiers in Marine Science | www.frontiersin.org                                  10                                          February 2021 | Volume 8 | Article 622883
Escalas et al.                                                                                                   Ecological Outlier in Sparidae Fishes

Pagellus species, S. aurata and L. mormyrus). This microbiome               for their anaerobic lifestyle, Akkermansia and Alistipes, and
convergence in carnivorous Sparidae resulted in species pairs               more generally with their respective phyla, Verrucomicrobia
with small microbiome dissimilarity despite high phylogenetic               and Bacteroidetes, also known to be abundant in the gut of
distance (i.e., points in the bottom right of the plots in Figure 2)        herbivorous fishes (Sullam et al., 2012; Miyake et al., 2015;
that blurred the phylosymbiosis signal. On the contrary, the                Ruiz-Rodríguez et al., 2020).
outlier regarding diet, gut traits and microbiome (S. sarpa) is not            Herbivory in general is associated with modifications of the
a phylogenetic outlier, which resulted in species pairs with small          gut to accommodate the microbes involved in the digestion
phylogenetic distance and strong microbiome dissimilarity (i.e.,            of plant-based material (Moran et al., 2019), either with
green points in Figure 2).                                                  differentiated parts (e.g., rumen, hindgut) or more simply
                                                                            through an elongation of the digestive tract that favor
                                                                            more anaerobic conditions within the distal part of the gut.
Determinants of the Gut Microbiome in                                       Longer guts also increase food transit time, a necessary
Mediterranean Sparidae                                                      step to allow the fermentation process to take place and
Gut morphology and diet were the strongest determinants                     extract nutrients from plant material (Clements and Choat,
of the gut microbiome in Mediterranean Sparidae. These                      1995). In these regards, S. salpa is truly unique among the
relationships were mostly driven by the fact that S. salpa, and             studied Sparidae as its gut is twice longer than the one
to a lesser extent B. boops, were simultaneously microbiome                 of its closest, and yet distant, relative B. boops (divergence
and gut outliers. The importance of gut features in shaping                 ∼18.4 Mya), allowing a long transit time (∼18 h, Goldenberg
the microbiome has been proposed to explain the observation                 and Erzini, 2014). Furthermore, contrarily with B. boops
of similar microbiome composition in wild and domesticated                  that only consumes a limited proportion of plants/algae,
populations of zebrafish that experienced very different dietary            S. salpa is specialized on these resources and consequently
and environmental conditions (Roeselers et al., 2011). Here,                provides the raw material required for fermentation of plant
gut length and relative gut length were found to be conserved               polysaccharides to SCFAs (butyrate, acetate) by gut anaerobes
in host phylogeny, with one clade composed of S. salpa an                   (Boutard et al., 2014). As a result, Clostridiales represented
B. boops having significantly longer guts than other Sparidae.              56% of the microbiome in S. salpa and only 30% in B. boops,
While the relative gut length of these two species are 2.5 and              while Lachnospiraceae represented 40 and 14% of the total,
2.1 times higher than those of carnivorous species, respectively,           respectively. Lachnospiraceae is the most abundant taxa in the
their absolute gut length are 3.3 times longer for S. salpa                 cow rumen where it represents more than a third of the sequences
(591 mm against an average of 177 ± 56 mm for the ten                       (Seshadri et al., 2018) and participates to plant fermentation as
carnivores) and only 1.8 times longer for B. boops (329 mm)                 they are particularly efficient in cellulose degradation (Schwarz,
which is a much smaller species. These two species also appeared            2001; Biddle et al., 2013).
as outliers regarding their trophic ecology, with uncommon                     The multifaceted ecological uniqueness exhibited by S. salpa
diet classification and a low diversity diet compared with the              has been reported in other clades such as the giant and red
other studied species, along with the consumption of algae in               pandas, that are bamboo-eating specialists within a group of
S. salpa.                                                                   carnivores. Similarly, recent studies revealed that their typical
    One limitation of our study lies in the use of stomach                  straight, short and non-differentiated carnivore guts limit their
content data collected in other studies from the same region                ability to host the typical diversified microbiome of herbivores
and recovered from FishBase. Individual analysis of stomach                 (Guo et al., 2020), contrarily with the bamboo lemur (Hapalemur
content was not feasible as the studied species are mostly diurnal          griseus), a bamboo specialist hosting a much more diversified
and the fishes were caught during the night so their stomach                microbiome (McKenney et al., 2018b) thanks to its omnivorous
was empty. Another approach to get the identity of ingested                 digestive tract and a very long transit time (>30 h).
preys at the individual level corresponds to the metabarcoding
of the gut content and feces (Soininen et al., 2009; Kartzinel
et al., 2015), but this approach does not provide quantitative              CONCLUSION
estimates of the ingested preys, contrarily with gut content
analyses (Parravicini et al., 2020).                                        In this study, we highlight the presence of a dietary, anatomical
    Sarpa salpa and B. boops, with their unique diet specialization         and microbiological outlier within a carnivorous family of teleost
(plant grazer and plankton feeder, respectively) and their                  fishes, the Sparidae. We revealed that the diet originality of the
extremely long guts, host bacterial taxa that were scarce                   strict herbivore S. salpa is supported by a longer gut which
in the other ten species (classified as macrofauna hunters).                increases the food transit time as well as anaerobic conditions
These taxa belong to three families of the Clostridiales order              favoring bacteria clades able to degrade plant materials. A key
in particular (Lachnospiraceae and Ruminococcaceae), which                  challenge is now to assess whether S. salpa’ microbiome is
are obligate anaerobes well-known for their associations with               comparable with the one of typically herbivorous fish clades
several herbivorous hosts (Llewellyn et al., 2014; Moran et al.,            such as Kyphosidae, Acanthuridae or Siganidae, both in terms of
2019) including fishes (Clements et al., 2009; Sullam et al.,               composition and efficiency to help the host assimilate nutrients.
2012; Jones et al., 2018). In addition, S. salpa and B. boops               This comparison is particularly urgent to address because two
traits and microbiome were associated with two genera known                 Lessepsian rabbitfishes are spreading in the Eastern part of the

Frontiers in Marine Science | www.frontiersin.org                      11                                   February 2021 | Volume 8 | Article 622883
Escalas et al. Ecological Outlier in Sparidae Fishes
Mediterranean basin and led in many places to overgrazing of for publication and agreed to be held accountable for the work
macrophytes (Vergés et al., 2014). performed therein.
DATA AVAILABILITY STATEMENT FUNDING
The datasets presented in this study can be found in online This project was funded by the French ANR (grant ANR-
repositories. The names of the repository/repositories and 17-CE32-0003) through the EXOFISHMED project (https://
accession number(s) can be found below: Data Dryad, with the exofishmed.cnrs.fr).
following doi: 10.5061/dryad.kprr4xh35.
ACKNOWLEDGMENTS
ETHICS STATEMENT
We are grateful to Denis Pons and Jean-Pierre Gritti for their help
Ethical review and approval was not required for the animal study with fish sampling, Marie Gislard from the GenoToul sequencing
because the fish individuals used for this study were already dead platform and Corinne Bouvier, Elsa Gadoin, and Marie-Charlotte
when collected from local fishermen. Cheutin for their assistance in samples preparation. We would
like to thank the two reviewers and the editor who helped to
improve this manuscript.
AUTHOR CONTRIBUTIONS
AE, J-CA, AA, RS, and SV collected the samples. RS, AG, and SUPPLEMENTARY MATERIAL
LB provided fish traits data. AA and AE performed the molecular
lab work. AE analyzed the data, performed the statistical analyses, The Supplementary Material for this article can be found
and wrote the manuscript with the help of J-CA and SV. SV, AE, online at: https://www.frontiersin.org/articles/10.3389/fmars.
and J-CA conceived the study. All authors gave final approval 2021.622883/full#supplementary-material
REFERENCES measures through hill numbers. Annu. Rev. Ecol. Evol. Syst. 45, 297–324. doi:
10.1146/annurev-ecolsys-120213-091540
Abouheif, E. (1999). A method for testing the assumption of phylogenetic Chiarello, M., Auguet, J. C., Bettarel, Y., Bouvier, C., Claverie, T., Graham, N. A. J.,
independence in comparative data. Evol. Ecol. Res. 1, 895–909. doi: 10.1007/ et al. (2018). Skin microbiome of coral reef fish is highly variable and driven by
s11295-009-0238-5 host phylogeny and diet. Microbiome 6:147. doi: 10.1186/s40168-018-0530-4
Anderson, M. J., and Willis, T. J. (2003). Canonical analysis of principal Chiarello, M., Paz-Vinas, I., Veyssière, C., Santoul, F., Loot, G., Ferriol, J.,
coordinates: a useful method of constrained ordination for ecology. Ecology 84, et al. (2019). Environmental conditions and neutral processes shape the skin
511–525. doi: 10.1890/0012-9658(2003)084[0511:caopca]2.0.co;2 microbiome of European catfish (Silurus glanis) populations of Southwestern
Baldisserotto, B., Mancera, J. M., and Kapoor, B. G. (2019). Fish Osmoregulation. France. Environ. Microbiol. Rep. 11, 605–614. doi: 10.1111/1758-2229.12774
Boca Raton, FL: CRC Press. doi: 10.1201/b10994 Clements, K. D., and Choat, J. H. (1995). Fermentation in tropical marine
Biddle, A., Stewart, L., Blanchard, J., and Leschine, S. (2013). Untangling the genetic herbivorous fishes. Physiol. Zool. 68, 355–378. doi: 10.1086/physzool.68.3.
basis of fibrolytic specialization by lachnospiraceae and ruminococcaceae in 30163774
diverse gut communities. Diversity 5, 627–640. doi: 10.3390/d5030627 Clements, K. D., Raubenheimer, D., and Choat, J. H. (2009). Nutritional ecology of
Bletz, M. C., Archer, H., Harris, R. N., McKenzie, V. J., Rabemananjara, F. C. E., marine herbivorous fishes: ten years on. Funct. Ecol. 23, 79–92. doi: 10.1111/j.
Rakotoarison, A., et al. (2017). Host ecology rather than host phylogeny 1365-2435.2008.01524.x
drives amphibian skin microbial community structure in the biodiversity Dimitroglou, A., Merrifield, D. L., Spring, P., Sweetman, J., Moate, R., and Davies,
hotspot of Madagascar. Front. Microbiol. 8:1530. doi: 10.3389/fmicb.2017.0 S. J. (2010). Effects of mannan oligosaccharide (MOS) supplementation on
1530 growth performance, feed utilisation, intestinal histology and gut microbiota
Boutard, M., Cerisy, T., Nogue, P. Y., Alberti, A., Weissenbach, J., Salanoubat, M., of gilthead sea bream (Sparus aurata). Aquaculture 300, 182–188. doi: 10.1016/
et al. (2014). Functional diversity of carbohydrate-active enzymes enabling a j.aquaculture.2010.01.015
bacterium to ferment plant biomass. PLoS Genet. 10:e1004773. doi: 10.1371/ Diniz-Filho, J. A. F., De SanT’Ana, C. E. R., and Bini, L. M. (1998). An eigenvector
journal.pgen.1004773 method for estimating phylogenetic inertia. Evolution (N.Y.) 52, 1247–1262.
Brooks, A. W., Kohl, K. D., Brucker, R. M., van Opstal, E. J., and Bordenstein, doi: 10.1111/j.1558-5646.1998.tb02006.x
S. R. (2016). Phylosymbiosis: relationships and functional effects of microbial Doane, M. P., Morris, M. M., Papudeshi, B., Allen, L., Pande, D., Haggerty, J. M.,
communities across host evolutionary history. PLoS Biol. 14:e2000225. doi: et al. (2020). The skin microbiome of elasmobranchs follows phylosymbiosis,
10.1371/journal.pbio.2000225 but in teleost fishes, the microbiomes converge. Microbiome 8:93. doi: 10.1186/
Brucker, R. M., and Bordenstein, S. R. (2012). The roles of host evolutionary s40168-020-00840-x
relationships (genus: Nasonia) and development in structuring microbial Egerton, S., Culloty, S., Whooley, J., Stanton, C., and Ross, R. P. (2018). The gut
communities. Evolution (N.Y.) 66, 349–362. doi: 10.1111/j.1558-5646.2011. microbiota of marine fish. Front. Microbiol. 9:873. doi: 10.3389/fmicb.2018.
01454.x 00873
Callahan, B. J., McMurdie, P. J., Rosen, M. J., Han, A. W., Johnson, A. J. A., and Estruch, G., Collado, M. C., Peñaranda, D. S., Tomás Vidal, A., Jover Cerdá,
Holmes, S. P. (2016). DADA2: high-resolution sample inference from Illumina M., Pérez Martínez, G., et al. (2015). Impact of fishmeal replacement in diets
amplicon data. Nat. Methods 13, 581–583. doi: 10.1038/nmeth.3869 for gilthead sea bream (Sparus aurata) on the gastrointestinal microbiota
Chao, A., Chiu, C.-H., and Jost, L. (2014). Unifying species diversity, phylogenetic determined by pyrosequencing the 16S rRNA gene. PLoS One 10:e0136389.
diversity, functional diversity, and related similarity and differentiation doi: 10.1371/journal.pone.0136389
Frontiers in Marine Science | www.frontiersin.org 12 February 2021 | Volume 8 | Article 622883Escalas et al. Ecological Outlier in Sparidae Fishes
Fillol, M., Auguet, J. C., Casamayor, E. O., and Borrego, C. M. (2016). Insights in number of low-abundance gut microbes. Microb. Ecol. 76, 272–284. doi: 10.
the ecology and evolutionary history of the miscellaneous crenarchaeotic group 1007/s00248-017-1114-8
lineage. ISME J. 10, 665–677. doi: 10.1038/ismej.2015.143 Miyake, S., Ngugi, D. K., and Stingl, U. (2015). Diet strongly influences the gut
Froese, R., and Pauly, D. (2003). Fish Base 2000: Concepts, Design and Data Sources. microbiota of surgeonfishes. Mol. Ecol. 24, 656–672. doi: 10.1111/mec.13050
Los Banos: ICLARM, 344. Miyake, S., Ngugi, D. K., and Stingl, U. (2016). Phylogenetic diversity, distribution,
Givens, C. E., Ransom, B., Bano, N., and Hollibaugh, J. T. (2015). Comparison of and cophylogeny of giant bacteria (Epulopiscium) with their surgeonfish hosts
the gut microbiomes of 12 bony fish and 3 shark species. Mar. Ecol. Prog. Ser. in the Red Sea. Front. Microbiol. 7:285. doi: 10.3389/fmicb.2016.00285
518, 209–223. doi: 10.3354/meps11034 Moran, N. A., Ochman, H., and Hammer, T. J. (2019). Evolutionary and ecological
Goldenberg, S. U., and Erzini, K. (2014). Seagrass feeding choices and digestive consequences of gut microbial communities. Annu. Rev. Ecol. Evol. Syst. 50,
strategies of the herbivorous fish Sarpa salpa. J. Fish Biol. 84, 1474–1489. doi: 451–475. doi: 10.1146/annurev-ecolsys-110617-062453
10.1111/jfb.12371 Mountfort, D. O., Campbell, J., and Clements, K. D. (2002). Hindgut fermentation
Goslee, S. C., and Urban, D. L. (2007). The ecodist package for dissimilarity-based in three species of marine herbivorous fish. Appl. Environ. Microbiol. 68,
analysis of ecological data. J. Stat. Softw. 22, 1–19. doi: 10.18637/jss.v022.i07 1374–1380. doi: 10.1128/AEM.68.3.1374-1380.2002
Groussin, M., Mazel, F., Sanders, J. G., Smillie, C. S., Lavergne, S., Thuiller, W., Nikouli, E., Meziti, A., Antonopoulou, E., Mente, E., and Kormas, K. A. (2019).
et al. (2017). Unraveling the processes shaping mammalian gut microbiomes Host-associated bacterial succession during the early embryonic stages and first
over evolutionary time. Nat. Commun. 8:14319. doi: 10.1038/ncomms14319 feeding in farmed gilthead sea bream (Sparus aurata). Genes (Basel) 10:483.
Guo, W., Chen, Y., Wang, C., Ning, R., Zeng, B., Tang, J., et al. (2020). The doi: 10.3390/genes10070483
carnivorous digestive system and bamboo diet of giant pandas may shape their Nikouli, E., Meziti, A., Smeti, E., Antonopoulou, E., Mente, E., and Kormas, K. A.
low gut bacterial diversity. Conserv. Physiol. 8:coz104. doi: 10.1093/conphys/ (2020). Gut microbiota of five sympatrically farmed marine fish species in the
coz104 Aegean Sea. Microb. Ecol. 81, 460–470. doi: 10.1007/s00248-020-01580-z
Haddow, A. D., Guzman, H., Popov, V. L., Wood, T. G., Widen, S. G., Haddow, Parada, A. E., Needham, D. M., and Fuhrman, J. A. (2016). Every base matters:
A. D., et al. (2013). First isolation of Aedes flavivirus in the Western Hemisphere assessing small subunit rRNA primers for marine microbiomes with mock
and evidence of vertical transmission in the mosquito Aedes (Stegomyia) communities, time series and global field samples. Environ. Microbiol. 18,
albopictus (Diptera: Culicidae). Virology 440, 134–139. doi: 10.1016/j.virol. 1403–1414. doi: 10.1111/1462-2920.13023
2012.12.008 Parravicini, V., Casey, J., Schiettekatte, N. M., Brandl, S., Pozas-Schacre, C., Carlot,
Hamidi, B., Wallace, K., Vasu, C., and Alekseyenko, A. V. (2019). W d∗ -test: J., et al. (2020). Global gut content data synthesis and phylogeny delineate reef
robust distance-based multivariate analysis of variance. Microbiome 7:51. doi: fish trophic guilds. bioRxiv [Preprint] doi: 10.1101/2020.03.04.977116
10.1186/s40168-019-0659-9 Phillips, C. D., Phelan, G., Dowd, S. E., McDonough, M. M., Ferguson, A. W.,
Janssen, S., McDonald, D., Gonzalez, A., Navas-Molina, J. A., Jiang, L., Xu, Z. Z., Delton Hanson, J., et al. (2012). Microbiome analysis among bats describes
et al. (2018). Phylogenetic placement of exact amplicon sequences improves influences of host phylogeny, life history, physiology and geography. Mol. Ecol.
associations with clinical information. mSystems 3, e00021–18. doi: 10.1128/ 21, 2617–2627. doi: 10.1111/j.1365-294X.2012.05568.x
msystems.00021-18 Roeselers, G., Mittge, E. K., Stephens, W. Z., Parichy, D. M., Cavanaugh, C. M.,
Jeanbille, M., Gury, J., Duran, R., Tronczynski, J., Agogué, H., Ben Saïd, O., Guillemin, K., et al. (2011). Evidence for a core gut microbiota in the zebrafish.
et al. (2016). Response of core microbial consortia to chronic hydrocarbon ISME J. 5, 1595–1608. doi: 10.1038/ismej.2011.38
contaminations in coastal sediment habitats. Front. Microbiol. 7:1637. doi: 10. Rosado, D., Pérez-Losada, M., Severino, R., Cable, J., and Xavier, R. (2019).
3389/fmicb.2016.01637 Characterization of the skin and gill microbiomes of the farmed seabass
Jombart, T., Balloux, F., and Dray, S. (2010). adephylo: new tools for investigating (Dicentrarchus labrax) and seabream (Sparus aurata). Aquaculture 500, 57–64.
the phylogenetic signal in biological traits. Bioinformatics 26, 1907–1909. doi: doi: 10.1016/j.aquaculture.2018.09.063
10.1093/bioinformatics/btq292 Ross, A. A., Müller, K. M., Scott Weese, J., and Neufeld, J. D. (2018).
Jones, J., DiBattista, J. D., Stat, M., Bunce, M., Boyce, M. C., Fairclough, D. V., et al. Comprehensive skin microbiome analysis reveals the uniqueness of
(2018). The microbiome of the gastrointestinal tract of a range-shifting marine human skin and evidence for phylosymbiosis within the class Mammalia.
herbivorous fish. Front. Microbiol. 9:2000. doi: 10.3389/fmicb.2018.02000 Proc. Natl. Acad. Sci. U.S.A. 115, E5786–E5795. doi: 10.1073/pnas.18013
Kartzinel, T. R., Chen, P. A., Coverdale, T. C., Erickson, D. L., Kress, W. J., 02115
Kuzmina, M. L., et al. (2015). DNA metabarcoding illuminates dietary niche Ruiz-Rodríguez, M., Scheifler, M., Sanchez-Brosseau, S., Magnanou, E., West,
partitioning by African large herbivores. Proc. Natl. Acad. Sci. U.S.A. 112, N., Suzuki, M., et al. (2020). Host species and body site explain the
8019–8024. doi: 10.1073/pnas.1503283112 variation in the microbiota associated to wild sympatric mediterranean
Lim, S. J., and Bordenstein, S. R. (2019). An introduction to phylosymbiosis. PeerJ teleost fishes. Microb. Ecol. 80, 212–222. doi: 10.1007/s00248-020-
7:e27879v2. doi: 10.7287/peerj.preprints.27879v2 01484-y
Llewellyn, M. S., Boutin, S., Hoseinifar, S. H., and Derome, N. (2014). Teleost Russel, J. (2020). MicEco: Various Functions for Microbial Community Data.
microbiomes: the state of the art in their characterization, manipulation and Sanders, J. G., Powell, S., Kronauer, D. J. C., Vasconcelos, H. L., Frederickson,
importance in aquaculture and fisheries. Front. Microbiol. 5:207. doi: 10.3389/ M. E., and Pierce, N. E. (2014). Stability and phylogenetic correlation in gut
fmicb.2014.00207 microbiota: lessons from ants and apes. Mol. Ecol. 23, 1268–1283. doi: 10.1111/
Magurran, A. E., and Henderson, P. A. (2003). Explaining the excess of rare mec.12611
species in natural species abundance distributions. Nature 422, 714–716. doi: Santini, F., Carnevale, G., and Sorenson, L. (2014). First multi-locus timetree of
10.1038/nature01547 seabreams and porgies (Percomorpha: Sparidae). Ital. J. Zool. 81, 55–71. doi:
Marotz, C., Amir, A., Humphrey, G., Gaffney, J., Gogul, G., and Knight, 10.1080/11250003.2013.878960
R. (2017). DNA extraction for streamlined metagenomics of diverse Santos, T. (2018). PVR: Phylogenetic Eigenvectors Regression and Phylogentic Signal-
environmental samples. Biotechniques 62, 290–293. doi: 10.2144/0001 Representation Curve. Available online at: https://cran.r-project.org/package=
14559 PVR (accessed May 30, 2018).
McFall-Ngai, M., Hadfield, M. G., Bosch, T. C. G., Carey, H. V., Domazet-Lošo, T., Schwarz, W. H. (2001). The cellulosome and cellulose degradation by anaerobic
Douglas, A. E., et al. (2013). Animals in a bacterial world, a new imperative for bacteria. Appl. Microbiol. Biotechnol. 56, 634–649. doi: 10.1007/s002530100710
the life sciences. Proc. Natl. Acad. Sci. U.S.A. 110, 3229–3236. doi: 10.1073/pnas. Segata, N., Izard, J., Waldron, L., Gevers, D., Miropolsky, L., Garrett, W. S.,
1218525110 et al. (2011). Metagenomic biomarker discovery and explanation. Genome Biol.
McKenney, E. A., Koelle, K., Dunn, R. R., Yoder, A. D., and Yoder, 12:R60. doi: 10.1186/gb-2011-12-6-r60
K. K. R. R. D. A. D. (2018a). The ecosystem services of animal microbiomes. Seshadri, R., Leahy, S. C., Attwood, G. T., Teh, K. H., Lambie, S. C., Cookson,
Mol. Ecol. 27, 2164–2172. doi: 10.1111/mec.14532 A. L., et al. (2018). Cultivation and sequencing of rumen microbiome members
McKenney, E. A., Maslanka, M., Rodrigo, A., and Yoder, A. D. (2018b). Bamboo from the Hungate1000 collection. Nat. Biotechnol. 36, 359–367. doi: 10.1038/
specialists from two mammalian orders (Primates, Carnivora) share a high nbt.4110
Frontiers in Marine Science | www.frontiersin.org 13 February 2021 | Volume 8 | Article 622883You can also read