Haplotype resolved genome assembly enables gene discovery in the red palm weevil Rhynchophorus ferrugineus - Nature
←
→
Page content transcription
If your browser does not render page correctly, please read the page content below
www.nature.com/scientificreports
OPEN Haplotype‑resolved genome
assembly enables gene
discovery in the red palm weevil
Rhynchophorus ferrugineus
Guilherme B. Dias 1*, Musaad A. Altammami 2, Hamadttu A. F. El‑Shafie 3,
Fahad M. Alhoshani2, Mohamed B. Al‑Fageeh 4, Casey M. Bergman 1 & Manee M. Manee
2*
The red palm weevil Rhynchophorus ferrugineus (Coleoptera: Curculionidae) is an economically-
important invasive species that attacks multiple species of palm trees around the world. A better
understanding of gene content and function in R. ferrugineus has the potential to inform pest control
strategies and thereby mitigate economic and biodiversity losses caused by this species. Using 10x
Genomics linked-read sequencing, we produced a haplotype-resolved diploid genome assembly
for R. ferrugineus from a single heterozygous individual with modest sequencing coverage (∼ 62x).
Benchmarking against conserved single-copy Arthropod orthologs suggests both pseudo-haplotypes
in our R. ferrugineus genome assembly are highly complete with respect to gene content, and do not
suffer from haplotype-induced duplication artifacts present in a recently published hybrid assembly
for this species. Annotation of the larger pseudo-haplotype in our assembly provides evidence for
23,413 protein-coding loci in R. ferrugineus, including over 13,000 predicted proteins annotated
with Gene Ontology terms and over 6000 loci independently supported by high-quality Iso-Seq
transcriptomic data. Our assembly also includes 95% of R. ferrugineus chemosensory, detoxification
and neuropeptide-related transcripts identified previously using RNA-seq transcriptomic data, and
provides a platform for the molecular analysis of these and other functionally-relevant genes that can
help guide management of this widespread insect pest.
The insect order Coleoptera (beetles) is one of the most diverse groups of organisms on earth, with over 350,000
species currently described and an estimated 1.5 million species in t otal1. Despite this unrivaled organismal diver-
sity, there has not yet been an inordinate fondness for studying beetle genomes2, with only ∼ 50 species having
genome assemblies in NCBI in early 2021. The family Curculionidae (“true” weevils) is one of the largest beetle
groups, containing over 80,000 described species including many important agricultural pests. Among these,
the red palm weevil (RPW) Rhynchophorus ferrugineus is a widespread invasive species that attacks a variety of
palm tree species. The RPW is of particular interest since it is the major arthropod pest of the date palm (Phoenix
dactylifera), resulting in economic losses in the order of tens of millions of dollars a nnually3.
RPW adult females bore into palm trees to deposit their eggs, wherein larvae hatch and consume the sur-
rounding trunk tissue causing extensive damage as they develop. This trait of being a “concealed tissue borer”
makes infestation hard to detect in its early stages and often results in the death of infected plants. Concealed bor-
ing also protects developing larvae from abiotic stressors, and facilitates weevil dispersion across large distances
during the commercialization of palm offshoots for farming and ornamental p urposes4. These factors, together
5
with polyphagy and strong flight ability , contribute to the invasive potential and economic impact of the RPW.
To reduce the economic and biodiversity losses caused by the RPW, there has been growing interest to identify
RPW genes that can be used to guide strategies for pest management in this species. Previous gene discovery
efforts for the RPW have mainly relied on transcriptome data, using different sequencing platforms, as well as a
1
Department of Genetics and Institute of Bioinformatics, University of Georgia, Athens, GA 30602,
USA. 2National Center for Biotechnology,, King Abdulaziz City for Science and Technology, Riyadh 11442, Saudi
Arabia. 3Date Palm Research Center of Excellence, King Faisal University, Al‑Ahsa 31982, Saudi Arabia. 4Life
Sciences and Environment Research Institute, King Abdulaziz City for Science and Technology, Riyadh 11442,
Saudi Arabia. *email: guilherme.dias@uga.edu; malmanee@kacst.edu.sa
Scientific Reports | (2021) 11:9987 | https://doi.org/10.1038/s41598-021-89091-w 1
Vol.:(0123456789)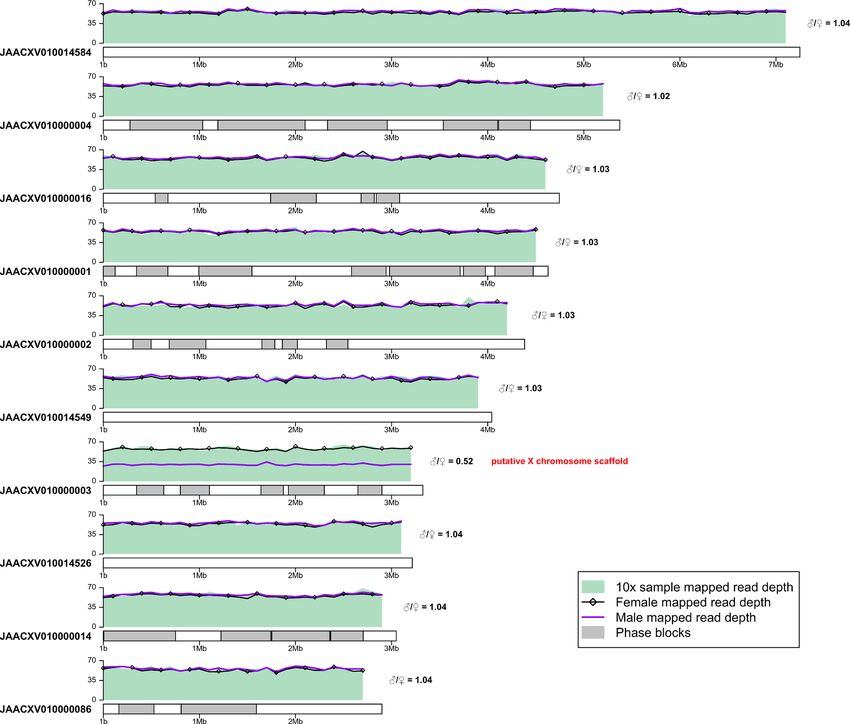
www.nature.com/scientificreports/
range of tissues, developmental stages, and strains6–11. Transcriptomics is a cost-effective strategy of gene discov-
ery compared to whole-genome sequencing since only a fraction of the genome is represented in mature tran-
scripts. However, the time- and tissue-specificity of gene expression makes it hard to capture all protein-coding
genes in an organism using a limited number of RNA-seq samples. In addition, aspects of transcript structure
and gene organization cannot be inferred from transcriptome data alone, and reference-guided transcriptome
assembly generally outperforms de novo a pproaches12. Genome assemblies also unlock many avenues of research
that would otherwise be inaccessible or severely limited such as population and comparative g enomics13, 14, and
high throughput genetic screening with CRISPR and RNAi15, 16.
Like many agriculturally important non-model species, efforts to generate a genome assembly for the RPW to
aid gene discovery have been hampered by the heterozygosity inherent in diploid organisms. However, advances
in genomics now allow resolution of both haplotypes in de novo assemblies of diploid organisms, typically using
either linked (e.g. 10x Genomics) or long (e.g. PacBio or Oxford Nanopore) reads17. Recently, a hybrid assembly
using a combination of Illumina and 10x Genomics sequencing was reported for the RPW that was used for gene
discovery and analysis of gene family evolution18. This hybrid assembly was obtained by merging and scaffolding
different primary assemblies created with DNA from several RPW individuals of both sexes. Hazzouri et al.18
reported an unusually high rate of gene family expansion in the RPW genome relative to other beetle species,
as well as a very high number of duplicated genes in the BUSCO gene set, which are expected to be present in
a single copy in most organisms19. To overcome limitations of previous transcriptome-based gene discovery
PW6–11 and to evaluate the correctness of the previously-reported RPW genome a ssembly18,
efforts in the R
here we report a haplotype-resolved (“phased”) diploid genome assembly from an independent RPW sample
generated using 10x Genomics linked-read sequencing. We provide evidence that the previously-reported RPW
genome hybrid assembly contains a large proportion of artifactually duplicated sequences that have arisen from
multiple haplotypes being scaffolded into a single haploid representation of the g enome20. We demonstrate that
our haplotype-resolved diploid assembly is more complete according to BUSCOs and does not suffer from a
high degree of artifactual duplications, and therefore provides a more accurate resource for understanding the
genome and gene content of this important agricultural pest.
Materials and methods
Sample, library preparation and sequencing. A single 3-week-old RPW larvae was selected randomly
for sequencing from a colony of RPW reared on date palms of the ‘Khalas’ cultivar in the shade house at the Date
Palm Research Center of Excellence at King Faisal University. This colony was established from multiple indi-
viduals sampled in February 2017 using insecticide-free pheromone traps in the Al-Ahsa oasis in Saudi Arabia.
The individual larvae selected for sequencing was sectioned into 4–8 mg pieces, one of which was used for
DNA extraction following the 10x Genomics recommended protocol for single insect DNA purification (https://
support.10xgenomics.com/permalink/7HBJeZucc80CwkMAmA4oQ2). This protocol uses a salting out method
adapted from Miller et al.21. We chose larval tissue for sequencing since the recommended 10x Genomics DNA
extraction protocol for insects yielded longer molecules for larval relative to adult tissues. As a consequence, the
sex of the individual sequenced here was initially unknown but was later determined to most likely be female
(see “Results and discussion”).
Purified genomic DNA was size selected to remove fragments shorter than 20 kb using the BluePippin
instrument (Sage Science). After size selection, 0.6 ng of DNA was loaded onto the 10x Genomics Chromium
Genome Chip for gel bead-in-emulsion generation, barcoding, and library construction using the 10x Genomics
Chromium Genome Reagent Kit Protocol v2 (RevB). DNA sequencing was carried out on a Illumina NextSeq
500 mid-output flow cell with 150 bp paired-end (PE) read layout.
Genome assembly. Raw sequencing reads were assembled using the Supernova assembler v2.1.1 with
default parameters and exported to fasta format using the ‘pseudohap2’ style22. This output mode generates two
pseudo-haplotype assemblies that differ in genomic regions where maternal and paternal haplotypes can be
phased (“phase blocks”) but are identical in homozygous and unphased blocks of the genome (Supplementary
Figure S1). Pseudo-haplotype1 was selected as the main assembly for analysis and annotation since it is slightly
longer than pseudo-haplotype2. Both pseudo-haplotypes were deposited in GenBank (see Data availability sec-
tion for accession numbers). To better understand differences between our pseudo-haplotype assemblies and the
hybrid assemblies of Hazzouri et al.18, we also exported our RPW Supernova assembly in ‘megabubbles’ s tyle22
which includes maternal and paternal phase blocks together with unphased blocks in a single file (Supplemen-
tary Figure S1).
Contigs in 11 scaffolds from both pseudo-haplotypes were trimmed to remove small (< 50 bp) internal adapter
sequences flanking assembly gaps that were identified in NCBI’s contamination screen report. Redundancy in
the Supernova assembly was eliminated using the ‘sequniq’ command from GenomeTools v1.5.923. These filter-
ing steps resulted in the removal of two contaminated and 3694 redundant scaffolds spanning 10,665,716 bp, or
1.78% of the original Supernova assembly size.
Genome annotation. Prior to genome annotation, a custom repeat library was generated from pseudo-
haplotype1 using RepeatModeler v1.0.11 (-engine ncbi) and used to soft mask the pseudo-haplotype1 assembly
with RepeatMasker v4.0.9 (-gff -u -a -s -no_is -xsmall -e ncbi) (http://www.repeatmasker.org/). Protein-coding
gene annotation of pseudo-haplotype1 was performed with BRAKER v2.1.524, an automated gene annotation
pipeline that uses extrinsic evidence in the form of spliced alignments from RNA-seq data and protein sequences
to train and predict gene structures with AUGUSTUS25–27.
Scientific Reports | (2021) 11:9987 | https://doi.org/10.1038/s41598-021-89091-w 2
Vol:.(1234567890)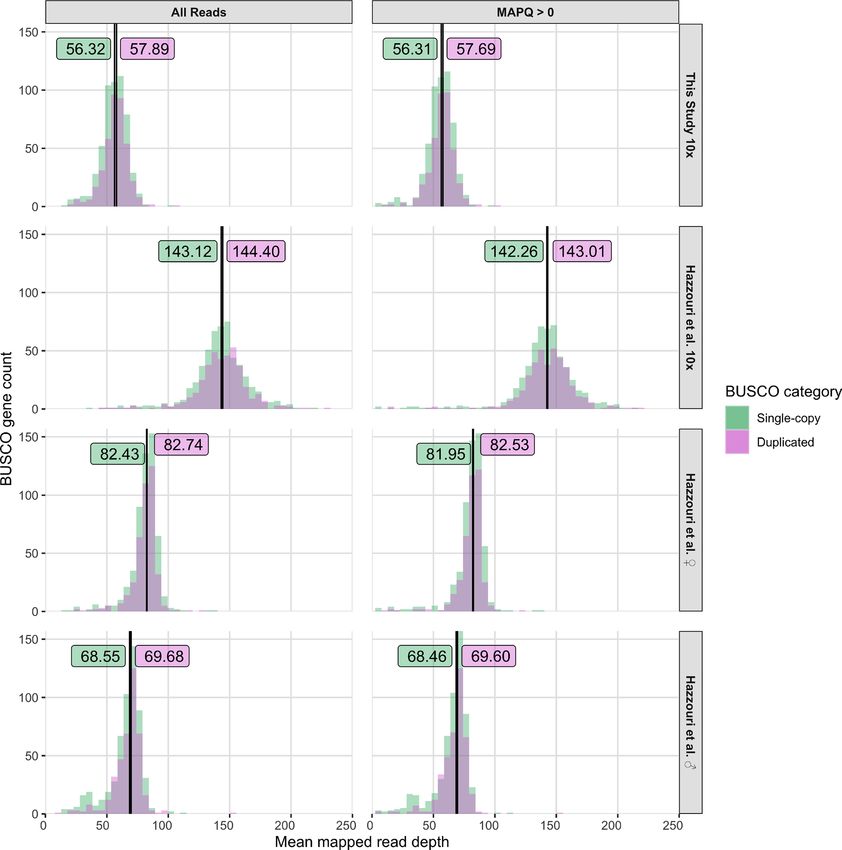
www.nature.com/scientificreports/
Short-read RNA-seq data from R. ferrugineus for training BRAKER was obtained from the NCBI SRA
database. Three different datasets were used consisting of Illumina short-read sequencing of: (1) polyA+ RNA
from pooled male and female adults (PRJDB3020)7, (2) total RNA from pooled male and female antennae
(PRJNA275430)9, and (3) total RNA from RPW larvae, pupae and adults of both sexes (PRJNA598560)10. Raw
RNA-seq reads were quality filtered with fastp v0.20.028 using default parameters, and aligned to pseudo-hap-
lotype1 using HiSat2 v2.1.0 (--dta)29. Resulting alignments were position sorted and converted to BAM format
using SAMtools v1.930. Spliced alignments of predicted protein sequences from 15 Coleopteran species plus
Drosophila melanogaster to the RPW pseudo-haplotype1 assembly were obtained with ProtHint v2.4.0 p ipeline31,
and were also used to train BRAKER. Species names and NCBI accession numbers of genomes used as sources of
predicted protein sequences for BRAKER training are listed in Supplementary Table S1. Genome-wide protein
coding gene annotation was performed using BRAKER v2.1.5 (--prg=ph --etpmode --softmasking)24 and the
gene set was based on AUGUSTUS predictions only. Five genes with internal stop codons were then removed
from the BRAKER AUGUSTUS predictions to generate the final annotation submitted to NCBI.
Protein-coding gene models from BRAKER output were functionally annotated through protein signature
scanning and sequence similarity searches against multiple databases. InterProScan v5.32-71.032 was used to
search the InterPro v71.0 member databases, and Diamond v0.9.3233 was used to search the non-redundant (nr)
protein database from NCBI (from June 2020). The resulting similarity hits from InterPro and nr were imported
to Blast2GO v5.2.534 for final annotation with Gene Ontology (GO) t erms35. Blast2GO was used to: (1) retrieve
GO terms associated with nr protein similarity hits (mapping pipeline), (2) annotate sequences with the most
specific and reliable GO terms available from the mapping step, (3) merge InterProScan associated GO IDs to
the annotation, and (4) augment the final annotation with the newly incorporated InterProScan GO IDs. All
Blast2GO pipelines were run with default settings.
Evaluation of assembly quality. General metrics for unmasked versions of both pseudo-haplotypes of
our phased genome assembly, the megabubbles version of our phased genome assembly, assemblies from Haz-
zouri et al.18 (David Nelson, personal communication; GCA_012979105.1) and the Tribolium castaneum refer-
ence genome (GCF_000002335.3)36 were collected with the ‘stats.sh’ utility script from BBMap v38.7637. Com-
pleteness of unmasked genome assemblies was assessed with BUSCO v4.0.6 (-m genome -l arthropoda_odb10
--augustus_species tribolium2012)19 using the Arthropoda gene set from OrthoDB v1038. Nucleotide differences
between pseudo-haplotypes in our RPW assembly were computed by aligning orthologous scaffolds with mini-
map2 v2.17 (-cx asm20 --cs --secondary=no)39 and extracting variants with paftools.js call across alignments
at different minimal length cutoffs (-L) of 1 kb, 10 kb, and 50 kb. The total length of phased blocks from each
pseudo-haplotype was calculated from the Supernova index files. To visualize heterozygosity along phase blocks
we aligned the raw 10x data produced here to pseudo-haplotype1 with BWA-MEM v0.7.17-r118, removed align-
ments with MAPQ = 0 using SAMtools v1.930, called variants with BCFtools v1.930 (call -v -m) and VCFtools
v0.1.1640 (--remove-indels --remove-filtered-all --recode --recode-INFO-all), and calculated the B-allele fre-
quency of variants using the information in the DP4 field from the resulting VCF file. Single-nucleotide variants
and phase blocks were visualized for the 10 longest scaffolds using karyoploteR v1.10.241. To identify potential
sex chromosome scaffolds and determine the sex of the individual sequenced, we subsampled male and female
Illumina reads from Hazzouri et al.18 (SRX5416728, SRX5416729) and the 10x Genomics reads produced here
(SRX7520800) to ∼ 39 Gb using seqtk v1.3 (https://github.com/lh3/seqtk), aligned to pseudo-haplotype1 using
BWA-MEM v0.7.17-r118842, removed alignments contained within repeat-masked regions or with MAPQ=0
using SAMtools v1.930, calculated the mapped read depth using BEDtools v2.29.043 (genomecov -dz), and finally
calculated the ratio of male/female mean mapped read depth for each scaffold. The mean mapped read depth
across the 10 longest scaffolds in pseudo-haplotype1 was visualized with karyoploteR v1.10.241. Estimates of
total genome size from unassembled Illumina reads were generated using findGSE v1.9444 and GenomeScope
v1.0.045. Frequency histograms for 21-mers were obtained with Jellyfish v2.3.0 with a max k-mer coverage of
1,000,00046.
To test whether unassembled Illumina DNA-seq datasets supported the high proportion of BUSCO genes
that are classified as duplicated in the final Hazzouri et al.18 hybrid assembly (M_pseudochr; GCA_012979105.1),
we first classified arthropod BUSCO genes as being single-copy or duplicated in the M_pseudochr assem-
bly using BUSCO v4.0.6 (-m genome -l arthropoda_odb10 --augustus_species tribolium2012)19. Next, we
aligned unassembled DNA-seq reads generated in this study (SRX7520800) and Hazzouri et al.18 (SRX5416727,
SRX5416728, SRX5416729) to our unmasked pseudo-haplotype1 assembly using BWA-MEM v0.7.17-r1188
with default p arameters42. The resulting alignments were position sorted and low quality mappings (MAPQ =
0) were removed using SAMtools v1.930. Mean depth of all mapped reads or only high-quality mapped reads
were then calculated using BEDtools v2.29.0 (bedtools coverage -mean)43 across the complete genomic range
of each BUSCO gene in our pseudo-haplotype1 assembly. Finally, histograms of mean read depth for BUSCO
genes in our pseudo-haplotype1 assembly (partitioned as being single-copy or duplicated based on classification
in the M_pseudochr assembly) were plotted for each DNA-seq dataset using R and ggplot247, 48. The cumulative
distribution functions for mean mapped read depth were compared between single-copy and duplicated gene
sets for each DNA-seq dataset using the Kolmogorov–Smirnov test in R v3.6.3 with the alternative hypothesis
that the mean mapped read depth of duplicated BUSCO genes is greater than the mean mapped read depth of
single-copy BUSCO genes ( α = 0.05).
Evaluation of annotation quality. Support for exon–intron junctions in gene models from our BRAKER
annotation was evaluated against the spliced RNA-seq alignments using paftools.js from minimap2 v2.1739.
Completeness of the following RPW and T. castaneum gene sets was evaluated using BUSCO v4.0.6 (-m tran-
Scientific Reports | (2021) 11:9987 | https://doi.org/10.1038/s41598-021-89091-w 3
Vol.:(0123456789)www.nature.com/scientificreports/
scriptome -l arthropoda_odb10 --augustus_species tribolium2012)19: BRAKER annotation of our pseudo-hap-
lotype1 assembly, a re-processed version of the long read transcriptome dataset from Yang et al.10 (see below), the
Funannotate annotation of the M_v.1 hybrid assembly from Hazzouri et al.18 (Khaled Hazzouri, personal com-
munication), BRAKER re-annotation of the M_pseudochr from Hazzouri et al.18 using the same procedure used
for our pseudo-haplotype1 (see above), and the T. castaneum v5.2 reference genome annotation from Shelton
et al.36. Two BUSCO analyses were performed for each gene set, one using all transcripts and one using a single
randomly chosen isoform per locus after clustering BRAKER transcripts into distinct loci using GffRead 0.11.7
(--cluster-only)49. Clustering transcripts with GffRead takes into account strand orientation and exon–intron
structure, and although this process might group transcripts that only partially overlap it its more specific than
a simple interval overlap. The “all transcripts” BUSCO analysis provides an upper bound estimate of BUSCO
recovery in a gene set, since one isoform of a locus might fit a BUSCO gene profile better than another isoform,
but can falsely classify BUSCO genes as being duplicated due to the identification of multiple isoforms of the
same locus. The “one isoform per locus” BUSCO analysis provides a conservative estimate of BUSCO gene
recovery which more accurately represents the true degree of duplication in the gene set that is not biased by
alternative isoform usage.
Our BRAKER genome annotation was also evaluated against two external datasets of RPW genes. First, we
used a dataset of full-length cDNA transcripts reported in Yang et al.10 generated using PacBio long-read isoform
sequencing (Iso-Seq) from mixed tissues (larvae, pupae, and adults of both sexes). We observed anti-sense arti-
facts in the processed Iso-Seq transcriptomes reported by Yang et al.10 (High quality: SRX7519788; Low quality:
SRX8694670) (Supplementary Figure S3). Thus, we re-processed the original circular consensus sequences (CCS)
from Yang et al.10 (SRX7495110) using default parameters of the isoseq3 pipeline in SMRT Link v8.0.0.79519.
Unpolished isoform consensus sequences output from isoseq3 cluster were polished with Illumina RNA-seq
reads from Yang et al.10 using Lordec v0.950 based on best performing parameters from Hu et al.51 (-k 21 -t 15 -b
1000 -e 0.45 -s 5). Polished isoform consensus sequences were then aligned to our pseudo-haplotype1 assembly
using minimap2 v2.17 (-ax splice --cs --secondary=no)39. Supplementary alignments were then removed using
SAMtools v1.9 to retain only primary and representative alignments. The resulting spliced alignments were posi-
tion sorted and converted to GTF2 format using SAMtools v1.9, BEDtools v2.29.0, and UCSC tools v 37730, 43, 52.
Finally, we clustered re-processed Iso-Seq transcripts into distinct loci using GffRead v0.11.7 (--cluster-only),
then compared Iso-Seq loci with BRAKER loci using GffCompare v0.11.249. GffCompare identifies multiple
types of overlaps between a reference set of transcripts and a query. These include overlaps representing the
perfect concordance of the exon–intron structure, but also partial intronic and exonic overlaps as well as the
containment of query transcripts by reference transcripts and vice-versa. Exonic overlaps between reference and
query transcripts in opposite strands are flagged but do not contribute to the final statistics of overlapped loci49.
Second, we compared our BRAKER genome annotation against curated sets of RPW genes that are potentially
relevant for pest mitigation s trategies9, 11, 53. Transcript identifiers for chemosensory genes were obtained from
Antony et al.9 and parsed from their transcriptome assembly (GDKA01000000). Transcripts for cytochrome P450
monooxygenases were obtained from Antony et al.53. Transcripts for neuropeptides and their G-protein coupled
receptors (GPCRs) were obtained from Zhang et al.11 (MK751489–MK751534, MK751535–MK751576). All tran-
scripts for curated gene sets were aligned to our pseudo-haplotype1 assembly, converted to GTF2, and clustered
into distinct loci as for the Iso-Seq transcripts above. Transcripts for curated genes that could not be mapped
to the RPW pseudo-haplotype1 assembly were further analyzed by directly querying DNA-seq data generated
in this study (SRX7520800) and Hazzouri et al.18 (SRX5416727, SRX5416728, SRX5416729). DNA-seq reads
were mapped directly to the transcript contigs using minimap2 v2.17 (-ax sr)39, sorted and converted to BAM
format using SAMtools v1.930. Mean mapped read depth over each entire transcript was then calculated using
BEDtools v2.29.0 (coverage -mean)43. To correct strand orientation errors observed in the mapped RPW curated
gene sets from Antony et al.9 (Supplementary Figure S3), we used the combined RNA-seq dataset (used above
as input to BRAKER) to assemble a reference-guided transcriptome using StringTie v2.012. We removed genes
for which no strand could be computed by StringTie (mostly single-exon genes), then overlapped the location
of mapped transcripts from Antony et al.9, Antony et al.53 and Zhang et al.11 with our StringTie transcripts using
GffCompare v0.11.2 to obtain the corresponding StringTie transcript for each curated gene in order to evaluate
their consistency with BRAKER gene models. Finally, we compared StringTie transcripts for curated genes with
BRAKER loci using GffCompare v0.11.249. We note that while both StringTie transcripts and BRAKER annota-
tions use the same underlying mapped RNA-seq data as input, StringTie transcripts were not used as evidence in
BRAKER training nor were BRAKER gene models used in StringTie assembly, and thus BRAKER and StringTie
annotations represent independent predictions of transcript structure.
Results and discussion
Haplotype‑resolved diploid assembly using 10x Genomics linked reads provides an accurate
representation of RPW genome content. We prepared a 10x Genomics linked-read sequencing library
from a single RPW individual originating from Al-Ahsa, Saudi Arabia and used this library to generate over 145
million 150-bp PE Illumina reads, totaling ∼ 40.4 Gb after adapter trimming. Using this data, we assembled a
draft phased diploid genome assembly for R. ferrugineus using Supernova22. We exported our diploid assem-
bly in ‘pseudohap2’ format (Supplementary Figure S1), which produces two output files each having a phased
‘pseudo-haplotype’ assembly. In regions where haplotype phasing can be achieved, maternal and paternal phase
blocks are randomly assigned to one of the two pseudo-haplotype assemblies. In regions where phasing cannot
be achieved, either because low heterozygosity or insufficient linked-read data, the two pseudo-haplotypes are
identical.
Scientific Reports | (2021) 11:9987 | https://doi.org/10.1038/s41598-021-89091-w 4
Vol:.(1234567890)www.nature.com/scientificreports/
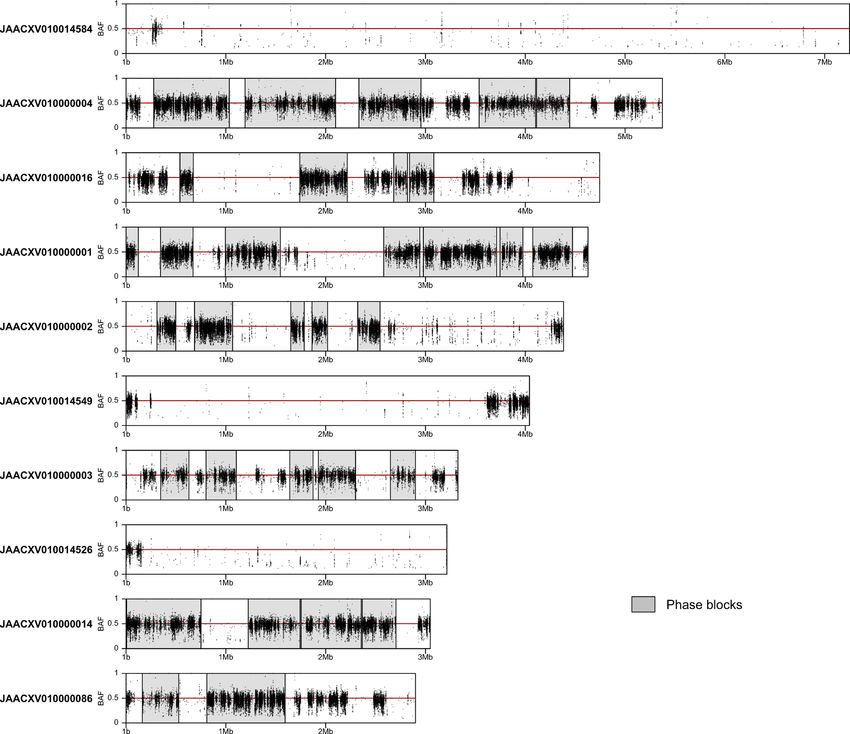
Figure 1. Phase blocks and B-allele frequency (BAF) of single-nucleotide variants (SNVs) in the 10 largest
scaffolds of the RPW pseudo-haplotype1 assembly. Phased regions are shown as gray highlighted boxes and
SNVs as black dots. Regions with white background represent unphased segments of the genome where both
pseudo-haplotype assemblies are identical. SNVs in a diploid genome are expected to display BAF values of ∼
0.5.
Assembly statistics and BUSCO scores for both pseudo-haplotypes in our assembly are presented in Table 1.
The total length of each pseudo-haplotype is approximately 590 Mb, with contig N50’s of nearly 38 kb, and scaf-
fold N50’s of over 470 kb. Approximately 98% of Arthropod BUSCOs are found completely represented in both
pseudo-haplotypes, ∼ 96% of which are single copy and only ∼ 2% are duplicated. The completeness of our RPW
pseudo-haplotype assemblies is comparable to the current reference genome of the best studied beetle species
T. castaneum36, which has 99.1% complete BUSCOs with 98.6% being single-copy. Over 140 Mb (∼ 24%) of
each pseudo-haplotype is phased (Supplementary Files 1 and 2), with the two pseudo-haplotypes differing by
< 0.4% at aligned orthologous sites, and the majority of differences being single nucleotide polymorphisms and
short indels (Supplementary Table S2). Because the two pseudo-haplotypes produced in our assembly are very
similar, we arbitrarily chose pseudo-haplotype1—the slightly longer of the two assemblies—as our main focus
for further analysis.
Unphased regions can represent true lack of heterozygosity but can also be the result of insufficient linked-
read data, and thus differences observed between the pseudo-haplotypes in our assembly possibly underestimate
the true heterozygosity in the individual sequenced. To evaluate this possibility, we re-aligned the 10x data
generated here to our pseudo-haplotype1 assembly, called single nucleotide variants (SNVs), and visualized the
phase blocks together with the B-allele frequency (BAF) of SNVs across the length of each scaffold (Fig. 1). This
analysis demonstrated that although phased regions largely coincide with blocks of heterozygosity with BAF ∼ 0.5
there are heterozygous regions that remained unphased (e.g. in JAACXV010000004; Fig. 1), indicating that our
assembly is incompletely phased most likely because of insufficient linked read data in some regions. Interestingly,
Scientific Reports | (2021) 11:9987 | https://doi.org/10.1038/s41598-021-89091-w 5
Vol.:(0123456789)www.nature.com/scientificreports/
Assemblies from this study Assemblies from Hazzouri et al.18
10x pseudo- 10x pseudo- 10x diploid 10x mixed-sex hybrid (M_
haplotype1 haplotype2 megabubbles Male diploid ABySS megabubbles ABySS+10x (M_v.1) pseudochr)
Assembly size (bp) 589,402,552 588,821,663 730,004,643 749,083,425 967,735,890 780,518,639 782,098,041
Assembly size for
scaffolds ≥ 250 bp 589,402,552 588,821,663 730,004,643 596,550,086 967,735,890 780,518,639 782,098,041
(bp)
Contig count (#) 42,051 41,976 47,835 1,832,276 125,191 48,516 48,516
Contig N50 (bp) 37,927 37,977 38,908 2000 18,553 23,825 23,825
Scaffold count (#) 24,005 24,005 25,245 1,810,484 78,408 12,400 4807
Scaffold N50 (bp) 471,583 471,583 288,817 2289 76,013 127,745 64,117,472
GC content (%) 32.21 32.21 32.15 32.4 32.27 32.19 32.19
BUSCO (%)
Complete 98.1 97.5 97.3 94.9 95.3 92.8 93.2
Single-copy 96.2 95.5 71.7 93.6 13.4 16.0 54.2
Duplicated 1.9 2.0 25.6 1.3 81.9 76.8 39.0
Fragmented 1.1 1.1 1.1 2.9 1.6 1.4 1.3
Missing 0.8 1.4 1.6 2.2 3.1 5.8 5.5
Table 1. General assembly statistics and BUSCO scores for RPW genome assemblies.
this analysis also revealed the presence of large scaffolds with very low density of SNVs (e.g. JAACXV010014584
and JAACXV010014549; Fig. 1). Scaffolds lacking heterozygosity could represent homozygous diploid regions
resulting from inbreeding or hemizygous sex chromosome sequences if the RPW individual sequenced is male.
To investigate these hypotheses and predict the sex of the sequenced individual we mapped female and male
Illumina reads from Hazzouri et al.18 to our pseudo-haplotype1 assembly and calculated the ratio of male/female
mean mapped read depth for each scaffold. This analysis allowed us to identify multiple putative sex chromosome
scaffolds with a male/female mean mapped read depth ratio of ∼ 0.5 (e.g. JAACXV010000003; Fig. 2). We also
mapped the DNA-seq reads produced in this study and observed that mean mapped depth of our 10x Genomics
reads matches the mapped depth of female reads from Hazzouri et al.18 in putative sex chromosome scaffolds,
indicating that the RPW sample sequenced here is likely to be female and the putative sex chromosomal scaffolds
are therefore X-linked. Additionally, the presence of phase blocks and heterozygous regions on these putative X
chromosome scaffolds further support the conclusion that these sequences are X-linked and that our sample is
female. Using this approach, we identified 29 putative X chromosome scaffolds totaling ∼ 20 Mb (Fig. 2). Surpris-
ingly, none of the long scaffolds that are mostly homozygous appear to be sex linked based on their male/female
mean mapped read depth ratio (Fig. 2, Supplementary File 3), indicating that the RPW genome sequenced here
is characterized by long stretches of low heterozygosity that probably arose as a result of inbreeding.
Recently, a hybrid assembly constructed using a combination of Illumina and 10x Genomics linked-reads
sequencing has been published by Hazzouri et al.18. This hybrid assembly was produced by initially scaffolding
an ABySS assembly of male Illumina 150 bp PE reads using SSPACE-LongRead54 with scaffolds from a Super-
nova assembly based on a mixed-sex 10x Genomics library (comprised of three males and three females; Khaled
Hazzouri, personal communication) exported in ‘megabubbles’ format to create the “M_v.1” hybrid assembly.
The resulting M_v.1 hybrid assembly was further scaffolded into pseudochromosomes using synteny with the T.
castaneum genome to create the “M_pseudochr” assembly available in NCBI (GCA_012979105.1). By assuming
chromosome-wide synteny and collinearity with T. castaneum for scaffolding, the M_pseudochr has a much
higher scaffold N50 and also has nearly 200 Mb of additional DNA relative to either of our pseudo-haplotype
assemblies (Table 1). However, the contig N50s of both our pseudo-haplotypes are higher than the M_pseudochr
assembly. Both pseudo-haplotypes in our assembly also have a higher proportion of complete BUSCOs and a
much lower proportion of duplicated BUSCOs than the M_pseudochr assembly (Table 1).
The observation of very high proportion of duplicated genes in the BUSCO gene set for the M_pseudochr
assembly is unusual since by definition BUSCO genes are expected to be present in a single copy in most
organisms19. We hypothesized that the high proportion of duplicated BUSCOs in the M_pseudochr assembly
is an artifact of scaffolding the initial male ABySS assembly using a Supernova assembly exported in megabub-
bles format, which includes multiple haplotypes in a single output file (Supplementary Figure S1). Scaffolding
with a megabubbles formatted Supernova assembly could introduce multiple haplotypes of the same locus into
a single haploid representation of the genome, thereby creating regions which falsely appear to be duplicated
in the M_pseudochr assembly when in fact they are haplotype-induced duplication a rtifacts20. Inclusion of
multiple haplotypes in a single haploid assembly could also explain the substantially larger total genome size
in the M_pseudochr assembly relative to either of our pseudo-haplotype assemblies (Table 1). Since the 10x
Genomics library used by Hazzouri et al.18 for Supernova assembly was made from six diploid individuals,
heterozygosity will be increased across the genome in this library relative to a single diploid individual used in
our assembly, potentially further increasing haplotype duplications. Importantly, nearly all duplicated BUSCOs
(99.7%) detected in the M_pseudochr assembly have a copy number of two, consistent with the interpretation
that these represent haplotype-induced duplications.
Scientific Reports | (2021) 11:9987 | https://doi.org/10.1038/s41598-021-89091-w 6
Vol:.(1234567890)www.nature.com/scientificreports/
Figure 2. Identification of putative sex chromosome scaffolds. Sequencing data were subsampled to ∼ 39 Gb
and mapped to pseudo-haplotype1. Mean mapped read depth of the 10x Genomics reads produced in this
study (SRX7520800; green shaded area), and the female (black line with open diamonds) and male (purple line)
Illumina reads from Hazzouri et al.18 (SRX5416728 and SRX5416729) is shown in 100 kb windows across the
10 longest scaffolds of pseudo-haplotype1 assembly with terminal windows removed. Phase blocks are shown
as gray rectangles. The ratio of male/female mean mapped read depth is given on the right side of each scaffold.
Scaffolds with a male/female ratio of ∼ 0.5 are indicated as putative sex chromosome sequences. The similar
mapped read depth of our RPW sample and the female sample from Hazzouri et al., as well as the presence of
phase blocks on putative sex chromosome scaffolds implies heterozygosity due to diploidy and indicates that
such scaffolds are X-linked and that the individual sequenced in this study is female.
To provide initial support for the hypothesis that high proportion of duplicated BUSCO genes in the M_pseu-
dochr assembly results from scaffolding with multiple haplotypes from their Supernova megabubbles assembly,
we exported our diploid Supernova assembly in megabubbles format and ran BUSCO on the resulting assembly.
As predicted, exporting our diploid assembly in megabubbles format led to a much larger total genome size and
higher proportion of duplicated BUSCOs (Table 1). We also obtained and analyzed the male ABySS assembly
and mixed-sex Supernova megabubbles assemblies used as input to the ABySS+10x (M_v.1) and final hybrid
assemblies (M_pseudochr) from Hazzouri et al.18 (David Nelson, personal communication). As shown in Table 1,
their male ABySS assembly has a low proportion of duplicated BUSCO genes (1.3%), similar to our pseudo-
haplotype assemblies (1.9 and 2%). In contrast, their multiple individual mixed-sex Supernova megabubbles
assembly has an extremely high proportion of duplicated BUSCO genes (81.9%), higher even than our diploid
Supernova assembly exported in megabubbles format (25.6%). Their male ABySS assembly has an apparently
higher total assembly size (749 Mb) than our pseudo-haplotype assemblies, but has a much lower total assembly
size (597 Mb) when only scaffolds ≥ 250 bp are considered (Table 1), suggesting many small scaffolds inflate the
total size of their initial male ABySS assembly. Their mixed-sex Supernova megabubbles assembly also has very
large total genome size (968 Mb), which is not caused by inclusion of small scaffolds ≤ 250 bp. A high proportion
Scientific Reports | (2021) 11:9987 | https://doi.org/10.1038/s41598-021-89091-w 7
Vol.:(0123456789)www.nature.com/scientificreports/
of duplicated BUSCOs and a large total assembly size are also observed in the M_v.1 hybrid assembly prior to
assembling into the final pseudochromosomes (M_pseudochr). Together, these results support the hypothesis
that the mixed-sex Supernova megabubbles assembly used for scaffolding by Hazzouri et al.18 contributed a
substantial amount of artifactually-duplicated sequences to their intermediate M_v.1 and final M_pseudochr
hybrid assemblies.
Next, we tested which reconstruction of the RPW genome—our pseudo-haplotype1 assembly versus the
M_pseudochr hybrid assembly from Hazzouri et al.18—has better support in the unassembled DNA-seq data from
both projects. To do this, we first classified BUSCO genes as being single copy or duplicated in the M_pseudochr
assembly. We then mapped unassembled DNA-seq reads from four datasets (our 10x Genomics library, their 10x
Genomics library, their male and female Illumina PE libraries) to our pseudo-haplotype1 assembly. If BUSCO
genes classified as duplicated in the M_pseudochr assembly are truly duplicated in the RPW genome but are
erroneously collapsed in our pseudo-haplotype1 assembly, we expect these genes to have higher mapped read
depth relative to BUSCO genes classified as single-copy. Alternatively, if BUSCO genes classified as duplicated
in the M_pseudochr assembly are haplotype-induced duplication artifacts and our pseudo-haplotype assemblies
represent the true structure of the RPW genome, we expect no difference in mapped read depth for BUSCO genes
classified either as duplicated or single copy in the M_pseudochr assembly. Expectations of the latter hypothesis
hold even for the 10x Genomics library from Hazzouri et al.18 that was generated from multiple individuals if
gene copy number is consistent among all individuals in the pooled sample. As shown in Fig. 3, despite differences
in overall coverage across datasets, we observe no difference in relative mapped read depth for BUSCO genes
classified as duplicated versus single copy in the M_pseudochr assembly when DNA-seq reads are mapped to our
pseudo-haplotype1 assembly (Kolmogorov–Smirnov Tests; all P > 0.05). No difference in read depth for these
two categories of BUSCO genes is robustly observed across four different DNA-seq datasets sampled from two
geographic locations generated using two different library types, and is not influenced by low quality read map-
pings (Fig. 3). To test if our approach lacked power to detect differences in the depth of single-copy vs putatively
duplicated BUSCOs with a copy number of two typically seen in the M_pseudochr assembly, we applied it to a
comparison of BUSCOs on the autosomes versus the X-chromosome. In a female sample, the X-chromosome
mean mapped read depth should be the same as that of autosomes, whereas in a male sample read depth on
the X-chromosome should be half that of autosomes. This test resulted in the rejection of the null hypothesis
(that the X-chromosome and autosomes have the same depth) in the male sample, but not in the female sample,
confirming that our depth approach can successfully detect two-fold shifts in the copy number of genes using
raw sequencing reads (Supplementary Figure S2). Together, these results indicate that the unassembled DNA-
seq data from both projects better support the BUSCO gene copy numbers observed in our pseudo-haplotype1
reconstruction of the RPW genome.
Finally, we estimated total genome size for the RPW using assembly-free k-mer based methods44, 45 based on
raw DNA-seq reads from our 10x Genomics library and genomic libraries from Hazzouri et al.18 (Supplementary
Table S3; Supplementary Figure S4). Diploid DNA-seq datasets from our study (10x Genomics) and from their
male and female Illumina PE libraries all predict a total genome size for the RPW of 100 Mb larger than either of our pseudo-haplotypes assembly sizes
(Table 1). This discrepancy could be due to the presence of highly repetitive sequences such as centromeric satel-
lite DNAs and other repeats in the RPW genome that cannot be recovered during genome assembly55. Indeed,
such differences between physical estimates of genome size and assembly length have been observed in other
insects56, 57 and often correlate with the abundance of heterochromatic repeats. Integrating all lines of evidence, we
conclude that our phased diploid assembly does not suffer from the high degree of haplotype-induced duplication
artifacts observed in the M_v.1 and M_pseudochr hybrid assemblies from Hazzouri et al.18, and thus provides
a more accurate platform for gene discovery in the RPW genome.
Gene prediction using a haplotype‑resolved diploid assembly provides a high‑quality RPW
gene set. We next performed ab initio gene prediction on a repeat-masked version of our pseudo-haplo-
type1 assembly using B RAKER24 trained with protein evidence from multiple insect species and RPW short-read
RNA-seq data from three previous s tudies7, 9, 10. Over 45% of pseudo-haplotype1 was identified by RepeatMas-
ker as interspersed repeats using a de novo repeat library generated using RepeatModeler and masked prior to
annotation. BRAKER annotation of our masked pseudo-haplotype1 assembly predicted 25,382 protein-coding
transcripts that clustered into 23,413 loci (Table 2, Supplementary File 4). Over 88% of exon–intron junctions
in our BRAKER annotation can be validated by RNA-seq spliced alignments, suggesting that the exon–intron
structures for the genes included in our genome annotation have high accuracy. Functional annotation of our
BRAKER gene models revealed that ∼ 70% of RPW predicted proteins share similarity to sequences in the NCBI
nr protein database, and that ∼ 84% had hits to one of InterPro’s member databases. The combined evidence of
nr and InterPro resulted in over 13,000 (∼ 54%) RPW predicted proteins being annotated with Gene Ontology
(GO) terms (Table 3, Supplementary File 5).
BUSCO analysis on the full set of transcripts predicted by BRAKER revealed the presence of 91.8% of Arthro-
pod genes in our annotation, which is close to the upper bound of the total number of Arthropod BUSCOs
expected in a well-annotated Coleopteran genome like T. castaneum (95.6%) (Table 2). However, our annotation
has lower BUSCO completeness relative to the RPW pseudo-haplotype1 sequence itself (98%) (Table 1), which
Scientific Reports | (2021) 11:9987 | https://doi.org/10.1038/s41598-021-89091-w 8
Vol:.(1234567890)www.nature.com/scientificreports/
RPW pseudo-haplotype1 RPW M_pseudochr
BRAKER RPW isoseq3 RPW M_v.1 Funannotate BRAKER Tribolium v5.2
Transcript (#) 25,382 24,009 25,394 36,491 25,229
Loci (#) 23,413 6,222 25,394 33,422 14,244
BUSCO (%)—all isoforms
Complete 91.8 62.5 68.9 88.8 95.6
Single-copy 82.0 29.8 21.1 9.6 76.2
Duplicated 9.8 32.7 47.8 79.2 19.4
Fragmented 2.2 1.6 10.5 2.2 0.3
Missing 6.0 35.9 20.6 9.0 4.1
BUSCO (%)—one isoform per locus
Complete 91.2 60.1 68.9 88.3 91.6
Single-copy 89.2 59.7 21.1 10.9 91.1
Duplicated 2.0 0.4 47.8 77.4 0.5
Fragmented 2.2 2.6 10.5 2.2 0.5
Missing 6.6 37.3 20.6 9.5 7.9
Table 2. Statistics and BUSCO scores for RPW and Tribolium annotation gene sets.
implies that a small proportion of genes present in the assembly are missing from our annotation. The total
number of genes in our BRAKER results (23,413 loci) is also substantially higher than the 14,244 loci currently
annotated in T. castaneum, which may indicate false positive gene models in our BRAKER annotation or real loci
in our RPW pseudo-haplotype1 assembly that are split into multiple BRAKER gene models. The total number of
loci in our BRAKER annotation is on the same order of the number of RPW loci identified by Hazzouri et al.18
(25,394), who annotated their intermediate M_v.1 hybrid assembly using Funannotate (https://g ithub.c om/n extg
enusfs/f unann
otate). However, when the BRAKER pipeline used to annotate our pseudo-haplotype1 assembly is
applied to their final M_pseudochr hybrid assembly, we identifiy a much larger number of loci (33,422) (Table 2).
Both the Funannotate (68.9%) annotation of the M_v.1 assembly performed by Hazzouri et al.18 and our
BRAKER (88.8%) annotation of their M_pseudochr assembly had lower BUSCO completeness than our BRAKER
annotation of pseudo-haplotype1 (Table 2). In addition to lower overall BUSCO completeness, both the M_v.1
Funannotate and M_pseudochr BRAKER annotations have much higher BUSCO duplication than gene sets
based on BRAKER annotation of pseudo-haplotype1 or the re-processed Iso-Seq transcriptome (Table 2: “all
isoforms”). However, it is important to highlight that the BUSCO method can falsely classify single copy genes
as being duplicated when applied to gene sets that include multiple transcript isoforms at the same locus, thereby
obscuring the true degree of duplication in a gene set. Therefore, we also performed BUSCO analysis on RPW
and T. castaneum gene sets using a single isoform selected randomly from each locus (Table 2: “one isoform per
locus”). After controlling for the effects of alternative isoforms, 91.2% of Arthropod BUSCOs were captured
completely in our BRAKER annotation of pseudo-haplotype1, 89.2% of which were identified as single-copy
and only 2% as duplicated. Similarly low rates of duplicated BUSCOs are observed in the RPW Iso-Seq and T.
castaneum gene sets when the effects of multiple isoforms are eliminated (Table 2). In contrast, even after con-
trolling for the effect of multiple isoforms on estimates of BUSCO gene duplication, we observe very high rates
of duplicated BUSCO genes in the M_v.1 Funannotate annotation and the M_pseudochr BRAKER annotation
(Table 2). These results indicate that the haplotype-induced duplication artifacts detected in the hybrid genome
assemblies from Hazzouri et al.18 also impact protein-coding gene sets predicted using these genome sequences.
We further evaluated the quality of our BRAKER annotation by comparison to two external datasets of RPW
genes. The first dataset is based on a recently-published RPW Iso-Seq transcriptome obtained using PacBio
long-read sequences10. Preliminary analysis of the processed Iso-Seq dataset reported by Yang et al.10 mapped
to our pseudo-haplotype1 assembly revealed many transcript isoforms on the forward and reverse strands of
the same locus (Supplementary Figure S3), presumably due to the inclusion of non-full length cDNA subreads
that were sequenced on the anti-sense strand. Therefore, we re-processed CCS reads from Yang et al.10 using the
isoseq3 pipeline and obtained a dataset of 24,136 high-quality transcripts, nearly all of which could be mapped
to our pseudo-haplotype1 assembly (24,009, 99.5%). After clustering mapped Iso-Seq transcripts at the genomic
level, we identified 6222 loci supported by this high-quality re-processed Iso-Seq dataset. Overlapping BRAKER
annotations with this high-quality Iso-Seq dataset revealed that the vast majority of loci identified using Iso-Seq
evidence were also present in our BRAKER annotation (5875/6222; 94.4%). This analysis also revealed 6436 loci
in the BRAKER annotation that overlap Iso-Seq loci, with the discrepancy in numbers of overlapping loci among
the two datasets explained by one-to-many relationships.
The second external dataset used to evaluate our BRAKER annotation is derived from genes involved in
behavior and physiology that may be relevant for RPW pest m anagement9, 11, 53. Antony et al.9 identified 157
putative transcripts belonging to six gene families associated with chemosensation, including: odorant receptors
(ORs), odorant binding proteins (OBPs), gustatory receptors (GRs), chemosensory proteins (CSPs), ionotropic
receptors (IRs), and sensory neuron membrane proteins (SNMPs). In a later study Antony et al.53 identified 77
putative transcripts belonging to the cytochrome P450 monooxygenases (CYPs) that are potentially involved in
insecticide resistance. Likewise, Zhang et al.11 identified 88 putative transcripts encoding neuropeptide precursors
Scientific Reports | (2021) 11:9987 | https://doi.org/10.1038/s41598-021-89091-w 9
Vol.:(0123456789)www.nature.com/scientificreports/
Figure 3. Mapped read depth of BUSCO genes in the RPW pseudo-haplotype1 assembly. BUSCO genes were
categorized as single-copy or duplicated based on their status in the M_pseudochr assembly from Hazzouri
et al.18. The four DNA-seq datasets analyzed are (from top to bottom): 10x Genomics library from this study
(SRX7520800), 10x Genomics library from Hazzouri et al.18 (SRX5416727), female RPW Illumina PE library
from Hazzouri et al.18 (SRX5416728), and male RPW Illumina PE library from Hazzouri et al.18 (SRX5416729).
Depth estimates based on all mapped read and high quality mapped reads (MAPQ > 0) are shown in the left and
right columns, respectively. The median values for each depth distribution are given as labeled vertical lines.
Database Sequences annotated % of total
nr 17,893 70.5
InterPro 21,210 83.6
nr or InterPro 22,001 86.7
Gene Ontology 13,779 54.3
Table 3. Functional annotation of 25,382 predicted proteins in the RPW pseudo-haplotype1 annotation.
Scientific Reports | (2021) 11:9987 | https://doi.org/10.1038/s41598-021-89091-w 10
Vol:.(1234567890)www.nature.com/scientificreports/
StringTie models consistent with BRAKER
Gene family Transcripts Transcripts mapped to assembly Mapped loci Mapped loci with StringTie models annotation
OR † 76 76 74 68 68
OBP † 38 35 35 34 34
GR † 15 15 15 15 13
CSP † 12 6 6 6 6
IR † 10 10 10 8 8
SNMP † 6 6 6 5 4
CYP ‡ 77 70 64 55 54
Neuropeptide § 42 42 40 37 36
GPCR § 46 46 46 43 43
Total 322 306 296 271 266
Table 4. Presence of functionally-relevant gene sets in the RPW pseudo-haplotype1 assembly and annotation.
†Curated gene set from Antony et al.9. ‡Curated gene set from Antony et al.53. §Curated gene set from Zhang
et al.11. Numbers of transcripts, numbers of transcripts mapped to the pseudo-haplotype1 assembly, and
numbers of loci in the pseudo-haplotype1 assembly are based on the original transcripts reported in Antony
et al.9 and Zhang et al.11. Numbers of loci that are consistent with the BRAKER annotation of pseudo-
haplotype1 are based on the corresponding StringTie transcript model overlapping transcripts from Antony
et al.9, Antony et al.53 and Zhang et al.11 to correct for orientation strand orientation artifacts in the Antony
et al.9 transcriptome and provide a uniform set of gene structures across curated gene sets.
and their G-protein coupled receptors (GPCRs)11. Our pseudo-haplotype1 assembly contains the vast major-
ity of these functionally-relevant RPW genes (306/322, 95%) (Table 4). Only 16 previously reported genes (3
OBPs, 6 CSPs, and 7 CYPs) could not be mapped to our pseudo-haplotype1 assembly. Analysis of unassembled
DNA-seq reads revealed that the sequences for these 16 genes are in fact not present in the raw DNA sequencing
data produced here or in Hazzouri et al.18, and thus represent either strain-specific gene variants or assembly/
contamination artifacts in the de novo transcriptomes from Antony et al.9, 53. The 306 transcripts that map to
our RPW assembly can be clustered into 296 distinct loci (Table 4), indicating that some previously identified
transcripts are likely isoforms of the same gene, allelic pairs, or sequencing/assembly artifacts.
We initially sought to evaluate the consistency of genomic mappings of transcript models for curated genes
against our BRAKER annotation, but preliminary analysis revealed that a majority of chemosensory transcripts
in the assembly reported by Antony et al.9 map to the opposite strand of genes predicted by both BRAKER
and our re-processed Iso-Seq transcriptome (Supplementary Figure S3). Opposite strand mappings relative to
BRAKER annotations were not observed in the Zhang et al.11 transcripts or the Antony et al.53 transcripts. We
interpret the opposite strand mapping of many transcripts in the Antony et al.9 transcriptome assembly as aris-
ing from contigs being assembled in the anti-sense orientation. To correct the strand orientation in the Antony
et al.9 assembly, we generated a reference-guided StringTie assembly of short-read Illumina data and overlapped
transcripts from Antony et al.9 with StringTie transcripts. The majority of curated gene loci overlap StringTie
transcripts (271/296; 91.5%) (Table 4). Using the StringTie transcript models as proxies for gene structures that
correct strand orientation issues in the Antony et al.9 assembly and are uniform across curated gene sets, we
find that the majority of curated genes are consistent with our BRAKER annotations (266/271; ∼ 98%) (Table 4).
Conclusion
Here we report a draft diploid assembly and genome-wide gene annotation constructed with the aim of sup-
porting efforts to mitigate the impact of agricultural damage caused by the Red Palm Weevil, R. ferrugineus. We
demonstrate that phased diploid assembly using 10x Genomics linked reads is a successful strategy for generating
scaffolds that are suitable for protein-coding gene prediction in this species. We argue that our haplotype-resolved
genome assembly provides a more accurate representation of the R. ferrugineus genome that does not include the
high degree of haplotype-induced duplication artifacts present in the genome assembly and annotation reported
in a recent s tudy18. The use of DNA from a single individual and the generation of a unique non-hybrid phased
assembly presented here provides an efficient approach to tackle genomics in heterozygous non-model organ-
isms. If our interpretation of the differences between our assembly of the RPW genome and that of Hazzouri
et al.18 is correct, then the claims for extremely high rates of gene family expansion in the RPW lineage reported
by Hazzouri et al.18 could be an artifact of their assembly and should be re-evaluated. Additionally, we show
that our annotation of the RPW genome cross-validates the majority of chemosensory and neuropeptide genes
previously identified as candidates for guiding management of this pest using molecular g enetics9, 11, but that a
limited number of previously-identified chemosensory genes may be transcriptomic artifacts or strain-specific
gene variants. The availability of an RPW genome assembly also allows the identification of strand orientation
artifacts in previously-reported transcriptomic datasets for this s pecies9, 10. Finally, by integrating our genomic
data with rigorously-processed Iso-Seq d ata10, we identify > 6000 RPW loci independently supported by both
genome annotation and long-read transcriptomics that represent a high-quality core gene set for future genetic
analysis in this economically-important insect pest.
Scientific Reports | (2021) 11:9987 | https://doi.org/10.1038/s41598-021-89091-w 11
Vol.:(0123456789)www.nature.com/scientificreports/
Data availability
The raw reads used for Supernova genome assembly are available under SRA accession SRX7520800. Pseudo-
haplotype1 (primary) and pseudo-haplotype2 (alternate) assemblies are available at GenBank under accession
numbers GCA_014462685.1 and GCA_014490705.1, respectively. All other associated data is available in the
Supplementary Material and in the Supplementary Files S1–S5 as described in the text.
Received: 16 September 2020; Accepted: 8 April 2021
References
1. Stork, N. E., McBroom, J., Gely, C. & Hamilton, A. J. New approaches narrow global species estimates for beetles, insects, and
terrestrial arthropods. Proc. Natl. Acad. Sci. USA 112, 7519–7523. https://doi.org/10.1073/pnas.1502408112 (2015).
2. McKenna, D. D. Beetle genomes in the 21st century: Prospects, progress and priorities. Curr. Opin. Insect Sci. 25, 76–82. https://
doi.org/10.1016/j.cois.2017.12.002 (2018).
3. El-Sabea, A. M. R., Faleiro, J. R. & Abo-El-Saad, M. M. The threat of red palm weevil Rhynchophorus ferrugineus to date plantations
of the Gulf region in the Middle-East: An economic perspective. Outlooks Pest Manag. 20, 131–134. https://doi.org/10.1564/20jun
11 (2009).
4. Murphy, S. & Briscoe, B. The red palm weevil as an alien invasive: Biology and the prospects for biological control as a component
of IPM A Threat to Palms. Biocontrol News Inf. 20, 20 (1999).
5. Barkan, S., Hoffman, A., Hezroni, A. & Soroker, V. Flight performance and dispersal potential of red palm weevil estimated by
repeated flights on flight mill. J. Insect Behav. 31, 66–82. https://doi.org/10.1007/s10905-017-9660-y (2018).
6. Wang, L. et al. A large-scale gene discovery for the red palm weevil Rhynchophorus ferrugineus (Coleoptera: Curculionidae). Insect
Sci. 20, 689–702. https://doi.org/10.1111/j.1744-7917.2012.01561.x (2013).
7. Yan, W., Liu, L., Qin, W. Q., Li, C. X. & Peng, Z. Q. Transcriptomic identification of chemoreceptor genes in the red palm weevil
Rhynchophorus ferrugineus. Genet. Mol. Res. 14, 7469–7480. https://doi.org/10.4238/2015.July.3.23 (2015).
8. Yin, A. et al. Transcriptomic study of the red palm weevil Rhynchophorus ferrugineus embryogenesis. Insect Sci. 22, 65–82. https://
doi.org/10.1111/1744-7917.12092 (2015).
9. Antony, B. et al. Identification of the genes involved in odorant reception and detection in the palm weevil Rhynchophorus fer-
rugineus, an important quarantine pest, by antennal transcriptome analysis. BMC Genom. 17, 69. https://doi.org/10.1186/s12864-
016-2362-6 (2016).
10. Yang, H., Xu, D., Zhuo, Z., Hu, J. & Lu, B. SMRT sequencing of the full-length transcriptome of the Rhynchophorus ferrugineus
(Coleoptera: Curculionidae). PeerJ 8, e9133. https://doi.org/10.7717/peerj.9133 (2020).
11. Zhang, H. et al. Neuropeptides and G-protein coupled receptors (GPCRs) in the red palm weevil Rhynchophorus ferrugineus
Olivier (Coleoptera: Dryophthoridae). Front Physiol.https://doi.org/10.3389/fphys.2020.00159 (2020).
12. Pertea, M. et al. StringTie enables improved reconstruction of a transcriptome from RNA-seq reads. Nat. Biotechnol. 33, 290–295.
https://doi.org/10.1073/pnas.15024081120 (2015).
13. Luikart, G., England, P. R., Tallmon, D., Jordan, S. & Taberlet, P. The power and promise of population genomics: From genotyping
to genome typing. Nat. Rev. Genet. 4, 981–994. https://doi.org/10.1038/nrg1226 (2003).
14. Miller, W., Makova, K. D., Nekrutenko, A. & Hardison, R. C. Comparative genomics. Annu. Rev. Genom. Human Genet. 5, 15–56.
https://doi.org/10.1146/annurev.genom.5.061903.180057 (2004).
15. Echeverri, C. J. & Perrimon, N. High-throughput RNAi screening in cultured cells: A user’s guide. Nat. Rev. Genet. 7, 373–384.
https://doi.org/10.1038/nrg1836 (2006).
16. Shalem, O., Sanjana, N. E. & Zhang, F. High-throughput functional genomics using CRISPR-Cas9. Nat. Rev. Genet. 16, 299–311.
https://doi.org/10.1038/nrg3899 (2015).
17. Zhang, X., Wu, R., Wang, Y., Yu, J. & Tang, H. Unzipping haplotypes in diploid and polyploid genomes. Comput. Struct. Biotechnol.
J. 18, 66–72. https://doi.org/10.1016/j.csbj.2019.11.011 (2019).
18. Hazzouri, K. M. et al. The genome of pest Rhynchophorus ferrugineus reveals gene families important at the plant-beetle interface.
Commun. Biol. 3, 1–14. https://doi.org/10.1038/s42003-020-1060-8 (2020).
19. Simao, F. A., Waterhouse, R. M., Ioannidis, P., Kriventseva, E. V. & Zdobnov, E. M. BUSCO: Assessing genome assembly and
annotation completeness with single-copy orthologs. Bioinformatics 31, 3210–3212. https://d oi.o
rg/1 0.1 093/b ioinf ormat ics/b
tv351
(2015).
20. Kelley, D. R. & Salzberg, S. L. Detection and correction of false segmental duplications caused by genome mis-assembly. Genome
Biol. 11, R28. https://doi.org/10.1073/pnas.15024081126 (2010).
21. Miller, S. A., Dykes, D. D. & Polesky, H. F. A simple salting out procedure for extracting DNA from human nucleated cells. Nucleic
Acids Res. 16, 1215. https://doi.org/10.1073/pnas.15024081127 (1988).
22. Weisenfeld, N. I., Kumar, V., Shah, P., Church, D. M. & Jaffe, D. B. Direct determination of diploid genome sequences. Genome
Res. 27, 757–767. https://doi.org/10.1073/pnas.15024081128 (2017).
23. Gremme, G., Steinbiss, S. & Kurtz, S. GenomeTools: A comprehensive software library for efficient processing of structured genome
annotations. IEEE/ACM Trans. Comput. Biol. Bioinf. 10, 645–656. https://doi.org/10.1109/TCBB.2013.68 (2013).
24. Bruna, T., Hoff, K. J., Lomsadze, A., Stanke, M. & Borodovsky, M. BRAKER2: Automatic eukaryotic genome annotation with
GeneMark-EP+ and AUGUSTUS supported by a protein database. NAR Genom. Bioinform.https://doi.org/10.1093/nargab/lqaa1
08 (2021).
25. Stanke, M. et al. AUGUSTUS: Ab initio prediction of alternative transcripts. Nucleic Acids Res. 34, W435-439. https://doi.org/10.
1016/j.cois.2017.12.0020 (2006).
26. Stanke, M., Schoffmann, O., Morgenstern, B. & Waack, S. Gene prediction in eukaryotes with a generalized hidden Markov model
that uses hints from external sources. BMC Bioinform. 7, 62. https://doi.org/10.1186/1471-2105-7-62 (2006).
27. Stanke, M., Diekhans, M., Baertsch, R. & Haussler, D. Using native and syntenically mapped cDNA alignments to improve de novo
gene finding. Bioinformatics 24, 637–644. https://doi.org/10.1016/j.cois.2017.12.0022 (2008).
28. Chen, S., Zhou, Y., Chen, Y. & Gu, J. FASTP: An ultra-fast all-in-one FASTQ preprocessor. Bioinformatics 34, i884–i890. https://
doi.org/10.1093/bioinformatics/bty560 (2018).
29. Kim, D., Paggi, J. M., Park, C., Bennett, C. & Salzberg, S. L. Graph-based genome alignment and genotyping with HISAT2 and
HISAT-genotype. Nat. Biotechnol. 37, 907–915. https://doi.org/10.1016/j.cois.2017.12.0024 (2019).
30. Li, H. et al. The sequence alignment/map format and SAMtools. Bioinformatics 25, 2078–2079. https://d oi.o
rg/1 0.1 093/b
ioinf orma
tics/btp352 (2009).
31. Bruna, T., Lomsadze, A. & Borodovsky, M. GeneMark-EP+: Eukaryotic gene prediction with self-training in the space of genes
and proteins. NAR Genom Bioinform.https://doi.org/10.1093/nargab/lqaa026 (2020).
32. Jones, P. et al. InterProScan 5: Genome-scale protein function classification. Bioinformatics 30, 1236–1240. https://doi.org/10.
1093/bioinformatics/btu031 (2014).
Scientific Reports | (2021) 11:9987 | https://doi.org/10.1038/s41598-021-89091-w 12
Vol:.(1234567890)You can also read