Tissue-specific Gene Expression Prediction Associates Vitiligo with SUOX through an Active Enhancer
←
→
Page content transcription
If your browser does not render page correctly, please read the page content below
bioRxiv preprint first posted online Jun. 2, 2018; doi: http://dx.doi.org/10.1101/337196. The copyright holder for this preprint (which
       was not peer-reviewed) is the author/funder, who has granted bioRxiv a license to display the preprint in perpetuity.
                                       All rights reserved. No reuse allowed without permission.

                    Tissue-specific Gene Expression Prediction Associates
                        Vitiligo with SUOX through an Active Enhancer

                           Zhihua Qi1,2 , Shiqi Xie3 , Rui Chen4 , Haji A. Aisa5 , Gary C. Hon3 ,
                                                 and Yongtao Guan1,2,4,6

                                                                 24 May 2018

                1 USDA/ARS Children’s Nutrition Research Center
                2 Department of Pediatrics, Baylor College of Medicine
                3 Cecil H. and Ida Green Center for Reproductive Biology Sciences, Department of
                  Obstetrics and Gynecology, University of Texas Southwestern Medical Center
                4 Department of Molecular and Human Genetics, Baylor College of Medicine
                5 Key Laboratory of Chemistry of Plant Resources in Arid Regions, Xinjiang Technical
                  Institute of Physics and Chemistry, CAS
                6 Current Address: Center for Statistical Genetics and Genomics, Department of Bio-
                  statistics and Bioinformatics, Duke University

               Vitiligo is an autoimmune disease featuring destruction of melanocytes, which results
           in patchy depigemtation of skin and hair; two vitiligo GWAS studies identified multiple
           significant associations, including SNPs in 12q13.2 region. But one study ascribed the as-
           sociation to IKZF4 because it encodes a regulator of T cell activation and is associated
           with two autoimmune diseases; while the other study ascribed the association to PMEL
           because it encodes melanocyte protein and has the strongest differential expression be-
           tween vitiligo lesions and perilesional normal skins. Here we show that vitiligo associated
           gene in 12q13.2 region is SUOX. Reanalyzing one GWAS dataset, we predicted tissue-
           specific gene-expression by leveraging Genotype-Tissue Expression (GTEx) datasets, and
           performed association mapping between the predicted gene-expressions and vitiligo status.
           SUOX expression is significantly associated with vitiligo in both Nerve (tibia) and Skin
           (sun exposed) tissues. Epigenetic marks encompass the most significant eQTL of SUOX
           in both nerve and skin tissues suggest a putative enhancer 3Kb downstream of SUOX. We
           silenced the putative enhancer using the CRISPR interference system and observed 50%
           decrease in SUOX expression in K562 cells, a cell line that has similar DNase hypersensitive
           sites and gene expression pattern to the skin tissue at SUOX locus. Our work provided an
           example to make sense GWAS hits through examining factors that affect gene expression
           both computationally and experimentally.

           Keywords: tissue-specific, gene expression, prediction, association, vitiligo, SUOX

                                                                         1
bioRxiv preprint first posted online Jun. 2, 2018; doi: http://dx.doi.org/10.1101/337196. The copyright holder for this preprint (which
was not peer-reviewed) is the author/funder, who has granted bioRxiv a license to display the preprint in perpetuity.
All rights reserved. No reuse allowed without permission.
1 Introduction
Gene expression is a desirable measurement in genetic association studies. First, according
to NHGRI-EBI genome-wide association studies (GWAS) catalog, there are 46, 159 SNPs
identified through 4, 201 GWAS in association with 2, 364 traits (accessed on 21 February
2018), but majority of those GWAS SNPs are in non-coding region, and thus are believed
to affect gene expression instead of protein function [1]. Second, many diseases manifest
abnormal functions of specific tissue types [2], and consequently tissue-specific gene expres-
sion provides a better surrogate for genotypes in association mapping. Third, expression
quantitative trait loci (eQTL), the genotype variants that affect gene expression, have been
extensively studied [3, 4, 5], allowing gene expression to function as a bridge between geno-
types and phenotypes. Unfortunately, the vast majority of existing GWAS datasets have
no gene expression measurements at all, let alone tissue specific ones.
PrediXcan pioneered the idea of predicting gene expression [6], leveraging public re-
sources such as the Genotype-Tissue Expression (GTEx) project [7], and performing gene-
level association mapping with disease phenotypes. Bayesian variable selection regression
(BVSR) excels at prediction, owing to its model averaging and shrinkage estimates [8]. Here
we demonstrate that BVSR significantly outperforms Elastic-Net [9] (used by PrediXcan)
in gene expression prediction. Our recent computational advancement makes BVSR appli-
cable to large scale gene expression prediction [10]. BVSR provides the posterior inclusion
probability (PIP) for each SNP, which measures the strength of marginal association in
light of all SNPs, and PIP can be used to perform fine mapping.
We reanalysed a GWAS dataset of vitiligo, which is an autoimmune disease that fea-
tures the destruction of skin pigment cells. Our analysis emphasize tissue-specific gene
expression. We chose five tissue types as training dataset (Supplementary Figure S1(A)),
and tissues are selected by jointly considering the number of samples available in GTEx,
the origin of the germ layers, and their relevance to vitiligo. We predicted tissue-specific
gene expression using BVSR, and performed gene-level association mapping between pre-
dicted gene expression and vitiligo status using logistic regression. For significant gene-level
associations, we examined the predictive model to identify key predictor (SNPs with high
PIP) to follow-up, including examining the methylation patterns and gene expression in cell
lines after experimental interference. A highlight of our finding is the association between
vitiligo and SUOX, whose expression is regulated by an nearby enhancer encompassing a
significant GWAS hit.
2 Material and Methods
2.1 Datasets
We used the following datasets in our study.
• GTEx: We got tissue-specific RNA-seq and genome-wide genotype data from GTEx
project (V6 release). We obtained five tissues from the dataset including whole blood
(n= 338), nerve tibial (n=256), lung (n=278), skin (n=302) and muscle (n=361).
The normalised gene expression was adjusted for sex, the top 3 principal compo-
nents(PC) and the top 15 PEER factors (to quantify batch effects and experimental
confounders)[7]. We used the GTEx dataset of different tissues to fit the predictive
models.
2bioRxiv preprint first posted online Jun. 2, 2018; doi: http://dx.doi.org/10.1101/337196. The copyright holder for this preprint (which
was not peer-reviewed) is the author/funder, who has granted bioRxiv a license to display the preprint in perpetuity.
All rights reserved. No reuse allowed without permission.
• DGN: Depression Genetic Network (DGN) cohort obtained whole-blood RNA-seq
and genome-wide genotype data for 922 individuals. For our analysis, we downloaded
both the genotype and the HCP normalized RNA-seq data from the National Institute
of Mental Health (NIMH) repository. DGN was used as a testing dataset in our study.
• VitGene: This vitiligo GWAS dataset contains only cases of 1251 samples (dbGaP
accession number: phs000224). We obtained 4155 healthy controls from two GWAS
datasets (dbGaP accession numbers: phs000336 and phs000147). The controls have
the same continental origin with those cases (Supplementary Figure S2).
2.2 Genotype quality control and imputation
For each dataset, GTEx, DGN, case, and control, we performed single SNP QC separately.
We excluded SNPs if the Hardy-Weinberg equilibrium exact test P-value < 1 × 10⁻⁶ , or
minor allele frequency, MAF < 1%. The cases and controls are typed on different platform.
After QC there are 514, 615 SNPs in cases and 495, 103 in controls. Combined there are
523, 349 SNPs, and these SNPs are subset of GTEx SNPs and HapMap3 SNPs.
In our experience, using popular imputation software, such as IMPUTE2 and MaCH,
to combine datasets genotyped on different platforms is good for single SNP test, but often
produces excessive false positives for multiple-SNP analysis or haplotype analysis. Thus, we
performed imputation using our in-house software based on the two-layer model described
in [11, 12]. Using HapMap3 as training datasets, our goal is to fill in the missing genotypes
and to impute genotypes that are untyped in either cases or controls, but not both.
We first identified that there are 486, 396 SNPs shared between cases and controls,
and masked those SNPs that are only typed in either cases or controls, then we thinned
HapMap3 to contain only 523, 349 SNPs (the combined SNPs between cases and controls)
and used these as training dataset to perform imputation to fill in the missing genotypes,
including those that are only genotyped in either cases or controls. For those SNPs that
are typed in one dataset but not the other, we can evaluate the imputation accuracy for
that SNP, by comparing the genotyped and the imputed best guess genotypes. If the
imputation error rate is > 5% this SNP will be removed. Otherwise, the SNP is kept.
Where the imputed and the typed differ, we used typed. In the end, we have 496, 847 SNPs
for gene expression prediction.
2.3 Gene expression prediction using BVSR
For each gene, we used Bayesian variable selection regression to fit the following additive
model Y = Xβ + where Y is an n-vector representing the individual gene expression, X
is a n × m design matrix including m covariates (either SNPs or PCs), β is an m-vector and
is the error term. After specifying sparse and shrinkage priors (detials can be found in
[8]), we sampled different models to estimate β. And then applied this β to a design matrix
of new set of (exchangeable) individuals to predict their gene expression. For each gene,
we define X by including all SNPs 1 Mbp upstream of first exon and 1 Mbp downstream
of the last exon. Note X is not allowed to have missing values; missing values are filled in
by genotype imputation.
We used the software piMASS, the companions software of [8], to fit BVSR models.
The software is run with the parameter of -w 10000, -s 1000000, -pmin 1, -pmax 10. After
model fitting we use Rao-Blackwellized β estimates [8], weighted by the corresponding
3bioRxiv preprint first posted online Jun. 2, 2018; doi: http://dx.doi.org/10.1101/337196. The copyright holder for this preprint (which
was not peer-reviewed) is the author/funder, who has granted bioRxiv a license to display the preprint in perpetuity.
All rights reserved. No reuse allowed without permission.
posterior inclusion probabilities, for prediction. For each gene, we fit the BVSR model
twice to examine the uncertainty in prediction. We found highly congruent performance in
all tissues except blood (Supplementary Figure S3). In real data analysis, for each gene we
fit BVSR twice to obtain two predicted gene expressions, then we used the averaged gene
expression to obtain a p-value for gene level association.
2.4 Gene expression prediction using Elastic Net
PrediXcan [6] used Elastic-Net to perform gene expression prediction. Elastic-Net linearly
combines the L1 penalty (LASSO), with weight α and L2 penalty (ridge regression), with
weight 1−α, to perform penalised regression [9]. Following the documentation in PrediXcan,
we set α = 0.5 and applied 10-fold cross-validation to obtain λ, the combined penalty, to
fit the penalised regression coefficients. The computation is done using glmnet package in
R [13].
2.5 Predictive performance and gene-based association test
We used coefficients of determination (R2 ), between the predicted and measured values, to
evaluate the predictive performance. For real data analysis, we predicted gene expression
independently using each of the five GTEx tissues as training dataset. Because vitiligo has
binary phenotypes, we fit a logistic regression between each predicted gene expression and
disease phenotypes, controlling for sex and top ten PCs.
2.6 CRISPR interference experiments
2.6.1 Cell Lines and Culture
K562 cells (from ATCC) were cultured in IMDM plus 10% FBS and pen/strep at 37 ◦ C
and 5% CO2 .
2.6.2 Plasmids
The lenti-sgRNA(MS2)-puro plasmid (Addgene ID: 73795) was used for sgRNA expression,
and Lenti-dCas9-KRAB (Addgene ID: 89567) was used for dCas9-KRAB expression [14].
Two sgRNAs were designed for SUOX promotor (seq: GCCACCCGCTTCCAGCCAA; po-
sition: chr12:56391034-56391055) and putative enhancer (seq: ACGCCCGTAACGCAGC-
CTC; position: chr12:56400869-56400888) respectively. The sgRNA fragments were in-
serted into the plasmid backbone (cut with BsmBl) by Golden Gate reaction. After trans-
formation, single clone was picked and the sgRNA sequence of each clone was assessed by
Sanger sequencing.
2.6.3 Virus package
For lentiviral packaging, 3×10⁶ 293T cells were seeded in a 6cm dish one day before transfec-
tion. The indicated viral plasmid(s) were co-transfected with lentivirus packaging plasmids
pMD2.G and psPAX2 (Addgene ID 12259 and 12260) with 4:2:3 ratios by using Lipofec-
tamine 3000 (Thermo Fisher) according to the manufacturers protocol. Twelve hours after
4bioRxiv preprint first posted online Jun. 2, 2018; doi: http://dx.doi.org/10.1101/337196. The copyright holder for this preprint (which
was not peer-reviewed) is the author/funder, who has granted bioRxiv a license to display the preprint in perpetuity.
All rights reserved. No reuse allowed without permission.
transfection, medium was changed to fresh DMEM with 10% FBS plus Pen/Strep. Seventy-
two hours after transfection, virus-containing medium was collected, passed through a 45
µm filter, and aliquoted into 1.5ml tubes.
2.6.4 Virus titration
Viruses were stored in −80◦ C before infection or titration. The viruses are titrated by
using the CellTiter-Glo luminescent cell viability assay. Briefly, 2 × 10⁵ cells were seeded
into 96-well plate. Viruses are diluted in a 10-fold serial dilution and then used to infect
the cells. The next day, medium was changed to fresh medium with antibiotics. Three
days after infection, cells were harvested and the survival cell rate was identified by using
CellTiter-Glo reagents. Based on the Poisson distribution, dilution with cell survival rate
between 0% - 20% was used to back-calculate the virus titer.
2.6.5 Virus infection
For virus infection, 2 × 10⁵ K562 cells were seeded in 24-well plate, and per well with
500 µl complete medium plus 8µg/ml polybrene. Virus aliquot(s) were thawed to room
temperature and added to the plates. The plate was then centrifuged at 1000g at 36 ◦ C and
returned to the incubator. The following day, the medium was changed to fresh complete
medium with antibiotics to screen for infected cells. Cells were kept at 30% confluence
during antibiotic selection.
2.6.6 Quantifying SUOX expression
RNA was extracted using trizol (invitrogen)from K562 cells, infected by lentivirus with dif-
ferent targeting sgRNAs. Reverse transcription was performed using ReverTra Ace qPCR
Master Mix(TOYOBO). SYBR green reagents were used for qPCR. Relavitve gene expres-
sion was analyzed using the 2-∆∆Ct method and normalized to that of ACTIN mRNA.
SUOX forward primer: GAAGACACTGGACCCGCAAAAG
SUOX reverse primer: GACTCGCAGGTGAACTCAGTG
ACTIN forward primer: GAGCACAGAGCCTCGCCTTT
ACTIN reverse primer: TCATCATCCATGGTGAGCTGG
3 Results
Gene expression prediction
We trained BVSR models using GTEx datasets, predicted gene expression into GWAS
datasets using the trained models, and performed association between predicted gene ex-
pression and phenotypes (details in Methods). To evaluate performance of BVSR in gene
expression prediction, we used GTEx whole blood (n = 338) as training and Depression
Genes and Networks (DGN, n = 922) as testing datasets. Samples in DGN have both
genotypes and whole blood RNA-seq [5]; this allows us to compare the predicted against
the measured gene expression using the coefficient of determination R2 . Supplementary
Figure S1(B) summarized the study overview.
5bioRxiv preprint first posted online Jun. 2, 2018; doi: http://dx.doi.org/10.1101/337196. The copyright holder for this preprint (which
was not peer-reviewed) is the author/funder, who has granted bioRxiv a license to display the preprint in perpetuity.
All rights reserved. No reuse allowed without permission.
To compare with Predixcan, we trained the model with Elastic-Net using the parameter
settings described in their paper [7] for model fitting and cross-validation. Predixcan pub-
lished all predication coefficients, but we have a different set of SNPs than what Predixcan
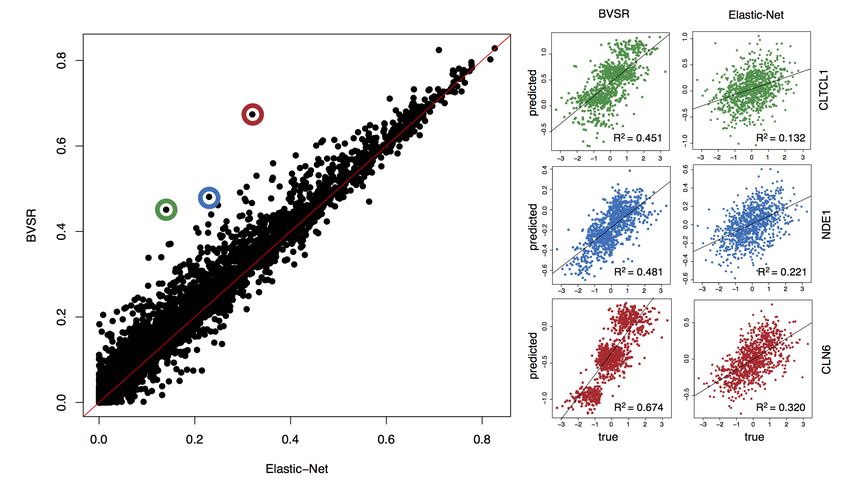
used, which warrants the refitting. Figure 1 demonstrated a much improved performance of
BVSR in gene expression prediction, compared with Elastic-Net. We attribute the improved
performance to two technical aspects of BVSR. The first is model averaging. Intuitively,
BVSR works harder to explore not only the best model, like Elastic-Net does, but also
good models, and weights their contribution to prediction using the posterior probabil-
ity of each model. The second is the separation of sparse and shrinkage priors. Such a
separation allows sparse models without over-shrinking their parameter estimates. Three
examples shown in Figure 1 appear to be the case where BVSR produced sparser models
than Elastic-Net.
Vitiligo GWAS
Vitiligo is an autoimmune disease that features the destruction of melanocytes, resulting
in patchy depigmentation of skin and hair [15]. It has an estimated worldwide prevalence
of 1% [15], and the social or psychological distress caused by vitiligo can be devastating.
We applied and downloaded 1, 251 vitiligo cases from dbGaP, and identified 4, 155 healthy
controls from other two GWAS datasets as controls for vitiligo (see Methods). Both cases
and controls are European descents (Supplementary Figure S2). We first performed single
SNP quality control separately for cases and controls, and after QC there are 514, 615 SNPs
in cases and 495, 103 in controls. Combined there are 523, 349 SNPs, and these SNPs are
subset of those GTEx SNPs. We used an in-house imputation software to fill in genotypes
that are untyped in either cases or controls (See Methods). Poorly imputed SNPs were
removed (Methods) and in the end we have 496, 847 SNPs for gene expression prediction
and gene-level association mapping.
The gene-level association p-values appear to be well calibrated between any pair of five
tissues (Figure 2). However, these p-values are inflated. The genomic control values range
from 1.10 to 1.16 for each tissue, and the genomic control value is 1.13 for the combined p-
values (Figure 2). We therefore adjust p-values using Benjamini-Hochberg-Yekutieli (BHY)
procedure [16, 17, 18], separately for each tissue, to obtain corresponding q-values, each
of which is the smallest FDR at which the hypothesis of interest would be rejected [19].
BHY procedure controls the false discovery rate assuming p-values are dependent, which
is a welcoming feature for our gene expression prediction, as gene expressions are often
correlated. Our simulations show that BHY procedure automatically corrects for p-value
inflation featuring high genomic control values.
At a nominal q-value cutoff of 0.05, our analysis discovered 6 genes outside of the MHC
region whose predicted expression are significantly associated with vitiligo in at least two
tissues (Figure 3). Despite that vitiligo is a skin disease, the 6 genes appear to be lack of
skin tissue-specificity: the nerve and skin tissues each has 5 associations, blood and lung
each has 4, and muscle has 3. Among the 6, RNASET2 is known to be associated with
vitiligo [20, 21]. The other 5 genes are clustered in two genomic regions. One region is
in 11q12.2 that has three genes TMEM258, FADS1, and FADS2. TMEM258 is required
for full N-oligosaccharyl transferase catalytic activity in N-glycosylation. There is no im-
mediate connection between its function to vitiligo, but glcosylation has a well known role
in immune recognition. FADS1 and FADS2 are rate-limiting enzymes in the desaturation
of linoleic acid to arachidonic acid, and alpha-linolenic acid to eicosapentaenoic acid and
6bioRxiv preprint first posted online Jun. 2, 2018; doi: http://dx.doi.org/10.1101/337196. The copyright holder for this preprint (which
was not peer-reviewed) is the author/funder, who has granted bioRxiv a license to display the preprint in perpetuity.
All rights reserved. No reuse allowed without permission.
docosahexaenoic acid [22]. In humans, blood levels of polyunsaturated fatty acids (PUFAs)
and long-chain PUFAs (LC-PUFAs) are strongly associated with FADS1/2 [23]. Inter-
estingly, PUFA of phospholipids reduction was observed in vitiligo epidermis [24], which
provides a plausible link between FADS1/2 and vitiligo. It is note-worthy that FADS1
showed opposite effect sizes in blood tissue and never (or muscle) tissue.
The other region is in 12q13.2 that contains two genes: SUOX and RPS26. RPS26
encodes a ribosomal protein that is a component of the 40S subunit; It is implicated in
psoriasis, another skin disease marked by red, itchy, scaly patches [25]. SUOX encodes
a enzyme, which is localized in mitochondria, that catalyzes the oxidation of sulfite to
sulfate, the final reaction in the oxidative degradation of the sulfur amino acids cysteine
and methionine. Melanogeneisis in cultured melanocytes can be substantially influenced
by L-cysteine [26]. Sulfite induces oxidative stress, and in plants SUOX functions in sulfite
detoxification and has been implicated in the adaption to elevated sulfur dioxide levels (e.g.,
acid rain) [27]. Epidermal melanocytes are particularly vulnerable to oxidative stress due
to the pro-oxidant state generated during melanin synthesis [28].
Inside the MHC region our analysis discovered 36 genes at q-value cutoff of 0.05. Among
them only two genes, HLA-DRA and HLA-DRB1, were reported previously to be associ-
ated with vitiligo [29, 30]. There are 9 pseudogenes, including IFITM4P, HLA-K, and
MICD, consisting 25% of the 36 genes, a proportion that is significantly higher than 16%
pseudogenes in the MHC region and 11% in the whole genome. Associations inside the
MHC region also appear not enriched in the skin tissue, which has 24 associations. As
comparisons nerve has 23, lung 20, blood 19, and muscle 18. Interestingly, 9 genes show
opposite effects in different tissues, including GNL1, TNXB, and PPT2. Supplementary
Table S1 lists the 36 genes in the MHC region. A complete list of genes that are significant
in at least one tissue can be found in the Supplementary Table S2.
SUOX and an enhancer
SUOX is located in the 12q13.2 region identified by two vitiligo GWAS [31, 32]. The
European study [31], however, ascribed the association signal to IKZF4 because the most
significant SNP rs1701704 is in its intron, and because IKZF4 encodes a regulator of T cell
activation, and IKZF4 is associated with type 1 diabetes and alopecia areata. In the Chinese
study [32], the most significant SNP is rs10876864, and the authors ascribed the association
to PMEL based on two pieces of peripheral evidences: 1) PMEL encodes melanocyte protein
and certain T cells exhibits reactivity to modified PMEL peptide epitopes in a subgroup
of vitiligo patients; and 2) PMEL has the strongest differential expression between vitiligo
lesions skin and vitiligo perilesional normal skin.
Our gene-level association ascribe the GWAS hits in 12q13.2 to SUOX. Figure 4 first
presents a table detailing top 10 SNPs (with highest PIP) in the predictive models for the
skin and nerve tissues. Very tellingly, seven overlapping SNPs in two predictive models
are all eQTLs for SUOX, but only two SNPs are eQTLs for PMEL and none for IKZF4,
according to GTEx portal (at FDR level of 0.05, accessed May 2018). The most significant
eQTL in both skin and nerve — SNP rs10876864 — ranks first in predictive model for the
nerve tissue and second for the skin tissue (Figure 4). Incidentally, this SNP is located
in a region that is a DNase hypersensitive site in the skin tissue (Figure 5A). This led us
to examine epigenetic marks in the cell line K562, which has similar DNase sensitivity in
SUOX locus. Reassuringly, the gene expression patterns at the downstream of SUOX are
also similar between K562 cells and the skin tissue. Moreover, both epigenetic markers
7bioRxiv preprint first posted online Jun. 2, 2018; doi: http://dx.doi.org/10.1101/337196. The copyright holder for this preprint (which
was not peer-reviewed) is the author/funder, who has granted bioRxiv a license to display the preprint in perpetuity.
All rights reserved. No reuse allowed without permission.
H3K27ac and H3K4me3 have strong peaks near rs10876864, about 3kb downstream of the
3-UTR of SUOX, indicating this region to be a putative enhancer.
We hypothesized that the putative enhancer affects gene expression of SUOX. To test the
hypothesis, we used the CRISPR interference system[33] that can precisely silence a targeted
promoter or enhancer. Taking advantage of an established CRISPR i system in K562 cell
line [14], we designed two single guide RNA (sgRNA), one targets the promoter of SUOX
as a positive control, and the other targets the putative enhancer. We also designed an
sgRNA that targets GFP as a negative control, and performed mock experiment to measure
SUOX expression as baseline for comparison. Figure 5B showed gene expression of SUOX
under four experimental conditions. After the sgRNA that targets GFP was delivered with
the CRISPR i, the gene expression measurement was similar to the baseline, suggesting
negative control worked. When the sgRNA that targets the promoter was delivered with
CRISPR i, the gene expression dropped to about 10% of the baseline level, suggesting that
positive controls worked. Finally, when the sgRNA that targets the putative enhancer was
delivered with CRISPR i, the gene expression dropped to about 50% of the baseline level,
suggesting the putative enhancer did affect gene expression of SUOX .
4 Discussion
In this paper, we demonstrated the benefits of applying BVSR to predict tissue-specific
gene expression and using predicted gene expression to perform association mapping. To
make sense a significant SNP in GWAS, a common practice is to assign a gene based on the
proximity to the SNP. This is apparently problematic. A famous example against such a
practice is in obesity GWAS, which discovered an association SNP in the first intron of the
FTO gene, but that SNP sits in an enhancer that promotes the expression of not FTO but
IRX3 that is 1Mbp downstream [34]. Most GWAS SNPs are intergenic or intronic and do
not affect protein coding (or gene identity), rather, they associate with disease phenotypes
through affecting gene expression [1]. Thus, focusing on gene expression to make sense
GWAS hits — like we did here — is more advantageous. Our study provides a stellar
example by showing that, in 12q13.2 region identified by two vitiligo GWAS, the relevant
gene is not one of the ones reported by the GWAS studies (IKZF4 and PMEL), but SUOX.
Using CRISPR i system, we experimentally confirmed that an enhancer in 12q13.2 region,
which is downstream of SUOX, mediates the expression of SUOX. The CRIPSR i system
we used here appears to be ideal for functional assay of GWAS hits in noncoding region
that are implicated in gene-level association.
SNP rs10876864 played a vital role in predicting gene expression of SUOX ; it is also
pivotal in locating the enhancer that mediates the expression of SUOX. In addition, SNP
rs10876864 is a known GWAS hit of vitiligo [32]. Thus if it can be shown that different
allele in SNP rs10876864 affects the potency of the enhancer, then we would close the re-
maining gap in elucidating the genetic association between rs10876864 and vitiligo. In fact,
rs10876864 exhibited strong trans associations with 9 targets on 9 different chromosomes
and in 4 distinct tissues: liver, omental adipose, blood cells and prefrontal cortex [35]. We
hypothesize that the trans effects of rs10876864 is due to the very enhancer that mediate
the gene expression of SUOX, which may also affect expression of other genes in trans.
8bioRxiv preprint first posted online Jun. 2, 2018; doi: http://dx.doi.org/10.1101/337196. The copyright holder for this preprint (which
was not peer-reviewed) is the author/funder, who has granted bioRxiv a license to display the preprint in perpetuity.
All rights reserved. No reuse allowed without permission.
5 Acknowledgement
Z.Q. is supported by a training fellowship from the Gulf Coast Consortia, on the NLM
Training Program in Biomedical Informatics & Data Science (T15LM007093) NLM fellow.
S.X. is an American Heart Association fellow (16POST29910007). H.A.A is supported by
the Funds for the Xinjiang Key Research and Development Program (No. 2016B03038-1).
G.C.H. is supported by the Cancer Prevention Research Institute of Texas (RR140023), the
National Institutes of Health (DP2GM128203), the Department of Defense (PR172060), and
the Welch Foundation (I-1926-20170325). Y.G is supported by United States Department
of Agriculture/Agriculture Research Service under contract number 6250-51000-057 and
National Institutes of Health under award number R01HG008157.
9bioRxiv preprint first posted online Jun. 2, 2018; doi: http://dx.doi.org/10.1101/337196. The copyright holder for this preprint (which
was not peer-reviewed) is the author/funder, who has granted bioRxiv a license to display the preprint in perpetuity.
All rights reserved. No reuse allowed without permission.
6 Tables
Table 1: Vitiligo significant hits outside of the MHC region. P: p-values; Q: adjusted
p-values using BHY procedure; OR: odds ratio. Position is the starting location of a gene
and coordinates are from HG19. Significant test statistics (Q < 0.05) are marked bold.
Only genes significant in more than one tissues are shown. Known GWAS hits are marked
by †.
Gene Chr Position Statistics Blood Nerve Lung Muscle Skin
P 1.4e-6 2.0e-7 8.5e-7 0.13 6.1e-6
RNASET2 † 6 167342992 Q 1.5e-2 2.5e-3 8.9e-3 1 4.4e-2
OR 0.83 0.82 0.83 0.94 0.84
P 8.3e-7 2.8e-9 1.1e-6 5.7e-8 2.3e-8
TMEM258 11 61535973 Q 9.4e-3 6.1e-5 1.1e-2 1.0e-3 4.5e-4
OR 0.82 0.79 0.83 0.81 0.80
P 9.8e-9 2.7e-8 3.4e-9 8.5e-10 7.6e-8
FADS2 11 61560452 Q 2.4e-4 4.7e-4 8.2e-5 3.0e-5 1.1e-3
OR 0.79 0.80 0.79 0.79 0.81
P 2.6e-8 1.4e-9 0.17 2.7e-9 0.10
FADS1 11 61567099 Q 4.9e-4 3.4e-5 1 7.4e-5 1
OR 0.81 1.25 1.05 1.25 1.06
P 6.2e-5 2.8e-6 8.2e-4 3.8e-3 1.2e-6
SUOX 12 56390964 Q 0.34 2.4e-2 1 1 1.1e-2
OR 0.86 0.84 0.88 0.89 0.83
P 5.1e-6 3.2e-3 3.0e-7 0.36 2.1e-7
RPS26 12 56435637 Q 5.1e-2 1 3.4e-3 1 2.9e-3
OR 1.18 1.11 1.20 1.03 1.21
10bioRxiv preprint first posted online Jun. 2, 2018; doi: http://dx.doi.org/10.1101/337196. The copyright holder for this preprint (which
was not peer-reviewed) is the author/funder, who has granted bioRxiv a license to display the preprint in perpetuity.
All rights reserved. No reuse allowed without permission.
7 Figures
Figure 1: Comparison of predictive performance between BVSR and Elastic-Net.
Using GTEx (n=338) as training and DGN (n=922) as testing, BVSR out-performs Elastic-
Net in predicting gene expression. Three examples where BVSR outperforms Elastic-Net
the most suggest BVSR has sparser predictive models.
11bioRxiv preprint first posted online Jun. 2, 2018; doi: http://dx.doi.org/10.1101/337196. The copyright holder for this preprint (which
was not peer-reviewed) is the author/funder, who has granted bioRxiv a license to display the preprint in perpetuity.
All rights reserved. No reuse allowed without permission.
Figure 2: Calibration of association p-values. The diagonal plots are histograms for
each set of p-values in five tissues. The upper off diagonal plots are pairwise quantile
quantile plot of two sets of − log10 (p-values). The lower off-diagonal plot is obtained by
combining p-values from all five tissues. The lines y=x are colored in red.
12bioRxiv preprint first posted online Jun. 2, 2018; doi: http://dx.doi.org/10.1101/337196. The copyright holder for this preprint (which
was not peer-reviewed) is the author/funder, who has granted bioRxiv a license to display the preprint in perpetuity.
All rights reserved. No reuse allowed without permission.
Figure 3: Manhattan plot of gene-level association in five different tissues for
vitiligo. Different colors represent different tissues, whose GTEx datasets were used to
train the predictive models. Y-axis is − log10 p-value, although p-values are not used to call
significance. Dashed horizontal line is the p-value cutoff of 5 × 10⁻⁶ . Only genes that are
significant (q-value < 0.05) in more than one tissue are labelled. At MHC region such a gene
is only labelled once due to crowdedness. XXbac-ID1 stands for XXbac-BPG170G13.32,
XXbac-ID2 for XXbac-BPG249D20.9, and XXbac-ID3 for XXbac-BPG300A18.13
13bioRxiv preprint first posted online Jun. 2, 2018; doi: http://dx.doi.org/10.1101/337196. The copyright holder for this preprint (which
was not peer-reviewed) is the author/funder, who has granted bioRxiv a license to display the preprint in perpetuity.
All rights reserved. No reuse allowed without permission.
Nerve Skin
SNP PIP β̂ SNP PIP β̂
rs10876864 0.65 -0.244 rs773107 0.91 -0.269
rs1701704 0.36 -0.150 rs10876864 0.57 -0.124
rs773107 0.29 -0.087 rs17118206 0.43 -0.116
rs17118206 0.28 -0.109 rs12810816 0.17 -0.031
rs12810816 0.27 -0.076 rs11550558 0.16 -0.041
rs17528736 0.18 -0.081 rs2658479 0.12 0.024
rs1701706 0.14 -0.037 rs1701706 0.11 -0.022
rs2658479 0.13 -0.032 rs11171582 0.06 0.006
rs2643626 0.12 0.031 rs10876820 0.06 0.006
rs2066808 0.12 0.028 rs1701704 0.05 -0.009
1
0.75
rs10876820
rs10876864
rs17118206
rs11550558
rs11171582
rs10506345
rs10783763
rs17528736
rs12810816
rs11171580
rs1701706
rs1701704
rs2658479
rs2643626
rs2066808
rs1316899
rs773107
0.5
Block 1 (0 kb) Block 2 (38 kb) Block 3 (11 kb)
63 64 65 66 67 68 107 108 109 110 112 113 114 115 124 132 133
0.25
30 37 26 11 0 0 2 52 12 22 8 8 13 2
11 37 26 42 4 1 20 5 6 56 44 0 12 2
0
11 5 42 1 0 0 10 32 28 5 22 13 9 12
2 16 1 0 3 4 1 7 2 56 6 12 9
Nerve
9 0 0 1 5 4 6 78 29 23 0 12
Skin
0 0 1 3 2 7 0 6 41 2 0
Nerve Skin
SNP PMEL SUOX IKZF4 PMEL SUOX IKZF4
rs10876864† NA 6.3e-40 NA NA 2.6e-41 NA
rs1701704† NA 4.9e-24 NA NA 1.3e-26 NA
rs773107 NA 2.9e-22 NA NA 1.8e-27 NA
rs17118206 3.4e-6 3.8e-7 NA NA 6.2e-6 NA
rs12810816 4.6e-5 2.2e-8 NA NA 1.0e-9 NA
rs1701706 NA 8.4e-8 NA NA 2.2e-5 NA
rs2658479 NA 4.3e-8 NA NA 2.9e-5 NA
Figure 4: Fine mapping of SUOX in nerve and skin tissues. A) In each tissue, top 10
SNPs of highest PIP (posterior inclusion probability) are presented in the table, together
with the predicting coefficients. (Both PIP and β̂ are obtained from GTEx training dataset).
Those 7 SNPs shared between two models (each for a tissue) are highlighted in bold. B)
These top 10 SNPs are also marked in the LD plot, with the color of the dot representing
the magnitude of PIP. The LD plot between SNPs was obtained from case control samples,
where the number in each square represents correlation (×100) between two SNPs, ranging
from 0 to 100 with 100 being darkest. C) The 7 shared SNPs are examined against GTEx
portal for evidence of eQTLs in each tissue for three genes of interest, and p-values are
provided if available. The entries marked by NA denote non-eQTL at FDR of 0.05. Two
GWAS hit SNPs are marked by †.
14bioRxiv preprint first posted online Jun. 2, 2018; doi: http://dx.doi.org/10.1101/337196. The copyright holder for this preprint (which
was not peer-reviewed) is the author/funder, who has granted bioRxiv a license to display the preprint in perpetuity.
All rights reserved. No reuse allowed without permission.
A rs10876864
56391000 Chr12 q13.2 56433000
50
DNase-seq
0
50
RNA-seq
0
Skin (Roadmap)
700
DNase-seq
0
500
RNA-seq
0
100
H3K27Ac
0
300
H3K4me3
0
70
H3K4me1
0
SUOX IKZF4
K562 (ENCODE)
B 150
Rel. Expr. of SUOX
100
RT - PCR
Mock
50 NC
Promotor
Enhancer
0
Vector - + + +
Sg-NC - + - -
Sg-P - - + -
Sg-E - - - +
Figure 5: Epigenetic regulation of SUOX and its expression under CRISPR-i.
A) Levels of transcription (mRNA) and DNase and epigenetic marks for the SUOX region
in K562 cells and the Skin tissue. The position of SNP rs10876864 is marked by a blue
dash vertical line. B) Using CRISPR-i to interfere SUOX promotor and an enhancer of
interest, gene expression of SUOX were compared between mock (Vector), negative control
(sg-NC), promotor-interfered (sg-P), and enhancer-interfered (sg-E).
15bioRxiv preprint first posted online Jun. 2, 2018; doi: http://dx.doi.org/10.1101/337196. The copyright holder for this preprint (which
was not peer-reviewed) is the author/funder, who has granted bioRxiv a license to display the preprint in perpetuity.
All rights reserved. No reuse allowed without permission.
References
[1] Yu Gyoung Tak and Peggy J. Farnham. Making sense of gwas: using epigenomics
and genome engineering to understand the functional relevance of snps in non-coding
regions of the human genome. Epigenetics & Chromatin, 8(1):57, Dec 2015.
[2] Yuanfang Guan, Dmitriy Gorenshteyn, Margit Burmeister, Aaron K. Wong, John C.
Schimenti, Mary Ann Handel, Carol J. Bult, Matthew A. Hibbs, and Olga G. Troyan-
skaya. Tissue-specific functional networks for prioritizing phenotype and disease genes.
PLOS Computational Biology, 8(9):1–12, 09 2012.
[3] Joseph K. Pickrell, John C. Marioni, Athma A. Pai, Jacob F. Degner, Barbara E.
Engelhardt, Everlyne Nkadori, Jean-Baptiste Veyrieras, Matthew Stephens, Yoav Gi-
lad, and Jonathan K. Pritchard. Understanding mechanisms underlying human gene
expression variation with rna sequencing. Nature, 464:768–772, 03 2010.
[4] Tuuli Lappalainen, Michael Sammeth, Marc R Friedländer, Peter AC ‘t Hoen, Jean
Monlong, Manuel A Rivas, Mar Gonzàlez-Porta, Natalja Kurbatova, Thasso Griebel,
Pedro G Ferreira, Matthias Barann, Thomas Wieland, Liliana Greger, Maarten van
Iterson, Jonas Almlöf, Paolo Ribeca, Irina Pulyakhina, Daniela Esser, Thomas Giger,
Andrew Tikhonov, Marc Sultan, Gabrielle Bertier, Daniel G MacArthur, Monkol Lek,
Esther Lizano, Henk PJ Buermans, Ismael Padioleau, Thomas Schwarzmayr, Olof
Karlberg, Halit Ongen, Helena Kilpinen, Sergi Beltran, Marta Gut, Katja Kahlem,
Vyacheslav Amstislavskiy, Oliver Stegle, Matti Pirinen, Stephen B Montgomery, Pe-
ter Donnelly, Mark I McCarthy, Paul Flicek, Tim M Strom, The Geuvadis Consor-
tium, Hans Lehrach, Stefan Schreiber, Ralf Sudbrak, Ángel Carracedo, Stylianos E
Antonarakis, Robert Häsler, Ann-Christine Syvänen, Gert-Jan van Ommen, Alvis
Brazma, Thomas Meitinger, Philip Rosenstiel, Roderic Guigó, Ivo G Gut, Xavier Es-
tivill, and Emmanouil T Dermitzakis. Transcriptome and genome sequencing uncovers
functional variation in humans. Nature, 501(7468):506–511, 09 2013.
[5] Alexis Battle, Sara Mostafavi, Xiaowei Zhu, James B Potash, Myrna M Weissman,
Courtney McCormick, Christian D Haudenschild, Kenneth B Beckman, Jianxin Shi,
Rui Mei, et al. Characterizing the genetic basis of transcriptome diversity through
rna-sequencing of 922 individuals. Genome research, 24(1):14–24, 2014.
[6] Eric R Gamazon, Heather E Wheeler, Kaanan P Shah, Sahar V Mozaffari, Keston
Aquino-Michaels, Robert J Carroll, Anne E Eyler, Joshua C Denny, Dan L Nicolae,
Nancy J Cox, et al. A gene-based association method for mapping traits using reference
transcriptome data. Nature genetics, 47(9):1091–1098, 2015.
[7] GTEx Consortium et al. The genotype-tissue expression (gtex) pilot analysis: Multi-
tissue gene regulation in humans. Science, 348(6235):648–660, 2015.
[8] Yongtao Guan and Matthew Stephens. Bayesian variable selection regression for
genome-wide association studies and other large-scale problems. The Annals of Applied
Statistics, pages 1780–1815, 2011.
[9] Hui Zou and Trevor Hastie. Regularization and variable selection via the elastic net.
Journal of the Royal Statistical Society: Series B (Statistical Methodology), 67(2):301–
320, 2005.
16bioRxiv preprint first posted online Jun. 2, 2018; doi: http://dx.doi.org/10.1101/337196. The copyright holder for this preprint (which
was not peer-reviewed) is the author/funder, who has granted bioRxiv a license to display the preprint in perpetuity.
All rights reserved. No reuse allowed without permission.
[10] Quan Zhou and Yongtao Guan. Fast model-fitting of bayesian variable selection re-
gression using the iterative complex factorization. under review, 2017.
[11] Yongtao Guan. Detecting structure of haplotypes and local ancestry. Genetics,
196(3):625–642, 2014.
[12] Hanli Xu and Yongtao Guan. Detecting local haplotype sharing and haplotype asso-
ciation. Genetics, pages genetics–114, 2014.
[13] Jerome Friedman, Trevor Hastie, and Robert Tibshirani. Regularization paths for gen-
eralized linear models via coordinate descent. Journal of Statistical Software, 33(1):1–
22, 2010.
[14] Shiqi Xie, Jialei Duan, Boxun Li, Pei Zhou, and Gary C Hon. Multiplexed engineer-
ing and analysis of combinatorial enhancer activity in single cells. Molecular Cell,
66(2):285–299, 2017.
[15] Khaled Ezzedine, Viktoria Eleftheriadou, Maxine Whitton, and Nanja van Geel. Vi-
tiligo. The Lancet, 386(9988):74–84, 01 2018.
[16] Y. Benjamini and Y. Hochberg. Controlling the false discovery rate: a practical and
powerful approach to multiple testing. Journal of the Royal Statistical Society. Series
B (Methodological), pages 289–300, 1995.
[17] Yoav Benjamini and Daniel Yekutieli. The control of the false discovery rate in multiple
testing under dependency. Ann. Statist., 29(4):1165–1188, 08 2001.
[18] S. Paul Wright. Adjusted p-values for simultaneous inference. Biometrics, 48(4):1005–
1013, 1992.
[19] John D. Storey. A direct approach to false discovery rates. Journal of the Royal
Statistical Society. Series B (Statistical Methodology), 64(3):479–498, 2002.
[20] Cheng Quan, Yun-Qing Ren, Lei-Hong Xiang, Liang-Dan Sun, Ai-E Xu, Xing-Hua
Gao, Hong-Duo Chen, Xiong-Ming Pu, Ri-Na Wu, Chao-Zhao Liang, et al. Genome-
wide association study for vitiligo identifies susceptibility loci at 6q27 and the mhc.
Nature genetics, 42(7):614–618, 2010.
[21] Qianqian Wang, Xiuxiu Wang, and Leihong Xiang. Role and mechanism of rnaset2 in
the pathogenesis of vitiligo. Journal of Investigative Dermatology Symposium Proceed-
ings, 17(1):48–50, 2015.
[22] Claudia Glaser, Joachim Heinrich, and Berthold Koletzko. Role of fads1 and fads2
polymorphisms in polyunsaturated fatty acid metabolism. Metabolism, 59(7):993 –
999, 2010.
[23] Lin Xie and Sheila M. Innis. Genetic variants of the fads1 fads2 gene cluster are
associated with altered (n-6) and (n-3) essential fatty acids in plasma and erythrocyte
phospholipids in women during pregnancy and in breast milk during lactation. The
Journal of Nutrition, 138(11):2222–2228, 2008.
[24] Siro Passi, Mauro Grandinetti, Francesco Maggio, Andrea Stancato, and Chiara Luca.
Epidermal oxidative stress in vitiligo. Pigment Cell Research, 11(2):81–85, 1998.
17bioRxiv preprint first posted online Jun. 2, 2018; doi: http://dx.doi.org/10.1101/337196. The copyright holder for this preprint (which
was not peer-reviewed) is the author/funder, who has granted bioRxiv a license to display the preprint in perpetuity.
All rights reserved. No reuse allowed without permission.
[25] Philip E Stuart, Rajan P Nair, Eva Ellinghaus, Jun Ding, Trilokraj Tejasvi, Jo-
hann E Gudjonsson, Yun Li, Stephan Weidinger, Bernadette Eberlein, Christian
Gieger, H Erich Wichmann, Manfred Kunz, Robert Ike, Gerald G Krueger, Anne M
Bowcock, Ulrich Mrowietz, Henry W Lim, John J Voorhees, Gonçalo R Abecasis,
Michael Weichenthal, Andre Franke, Proton Rahman, Dafna D Gladman, and James T
Elder. Genome-wide association analysis identifies three psoriasis susceptibility loci.
Nature Genetics, 42:1000 EP –, 10 2010.
[26] NP Smit, H Van der Meulen, HK Koerten, RM Kolb, AM Mommaas, EG Lentjes, and
S. Pavel. Melanogenesis in cultured melanocytes can be substantially influenced by
l-tyrosine and l-cysteine. J Invest Dermatol., 109(6), Dec 1997.
[27] Gregory J. Workun, Kamila Moquin, Richard A. Rothery, and Joel H. Weiner. Evolu-
tionary persistence of the molybdopyranopterin-containing sulfite oxidase protein fold.
Microbiology and Molecular Biology Reviews, 72(2):228–248, 2008.
[28] Laurence Denat, Ana L. Kadekaro, Laurent Marrot, Sancy A. Leachman, and Zalfa A.
Abdel-Malek. Melanocytes as instigators and victims of oxidative stress. Journal of
Investigative Dermatology, 134(6):1512 – 1518, 2014.
[29] Fain Pamela R., Babu Sunanda R., Bennett Dorothy C., and Spritz Richard A. Hla
class ii haplotype drb1*04dqb1*0301 contributes to risk of familial generalized vitiligo
and early disease onset. Pigment Cell Research, 19(1):51–57, 2005.
[30] Stanca A Birlea, Fridoon J Ahmad, Raza M Uddin, Shakil Ahmad, Sabrina S Pal,
Rasheedunnisa Begum, Naresh C Laddha, Mitesh Dwivedi, Mohmmad Shoab Mansuri,
Ying Jin, Katherine Gowan, Sheri L Riccardi, Paulene J Holland, Songtao Ben,
Pamela R Fain, and Richard A Spritz. Association of generalized vitiligo with mhc
class ii loci in patients from the indian subcontinent. The Journal of investigative
dermatology, 133(5):1369–1372, 05 2013.
[31] Ying Jin, Stanca A Birlea, Pamela R Fain, Tracey M Ferrara, Songtao Ben, Sheri L
Riccardi, Joanne B Cole, Katherine Gowan, Paulene J Holland, Dorothy C Bennett,
et al. Genome-wide association analyses identify 13 new susceptibility loci for gener-
alized vitiligo. Nature genetics, 44(6):676–680, 2012.
[32] Xian-Fa Tang, Zheng Zhang, Da-Yan Hu, Ai-E Xu, Hai-Sheng Zhou, Liang-Dan Sun,
Min Gao, Tian-Wen Gao, Xing-Hua Gao, Hong-Duo Chen, et al. Association analyses
identify three susceptibility loci for vitiligo in the chinese han population. Journal of
Investigative Dermatology, 133(2):403–410, 2013.
[33] Pratiksha I Thakore, Anthony M D’ippolito, Lingyun Song, Alexias Safi, Nishkala K
Shivakumar, Ami M Kabadi, Timothy E Reddy, Gregory E Crawford, and Charles A
Gersbach. Highly specific epigenome editing by crispr-cas9 repressors for silencing of
distal regulatory elements. Nature methods, 12(12):1143–1149, 2015.
[34] Scott Smemo, Juan J Tena, Kyoung-Han Kim, Eric R Gamazon, Noboru J Sak-
abe, Carlos Gómez-Marı́n, Ivy Aneas, Flavia L Credidio, Débora R Sobreira, Nora F
Wasserman, et al. Obesity-associated variants within fto form long-range functional
connections with irx3. Nature, 507(7492):371–375, 2014.
18bioRxiv preprint first posted online Jun. 2, 2018; doi: http://dx.doi.org/10.1101/337196. The copyright holder for this preprint (which
was not peer-reviewed) is the author/funder, who has granted bioRxiv a license to display the preprint in perpetuity.
All rights reserved. No reuse allowed without permission.
[35] Xiaoling Zhang, Hinco J Gierman, Daniel Levy, Andrew Plump, Radu Dobrin, Har-
ald HH Goring, Joanne E Curran, Matthew P Johnson, John Blangero, Stuart K
Kim, Christopher J O’Donnell, Valur Emilsson, and Andrew D Johnson. Synthesis of
53 tissue and cell line expression qtl datasets reveals master eqtls. BMC Genomics,
15(1):532, 2014.
19You can also read