Issues of seismic risk assessment of Vladikavkaz city
←
→
Page content transcription
If your browser does not render page correctly, please read the page content below
94       Geology and Geophysics of Russian South             10 (3) 2020            Геология и геофизика Юга России

================================ GEOPHYSICS ================================

DOI: 10.46698/VNC.2020.47.51.006

                                                 Review paper

                        Issues of seismic risk assessment
                               of Vladikavkaz city
 V. B. Zaalishvili        1
                            , A. Pinar      2
                                             , M. Erdik       2
                                                                , O. G. Burdzieva            , D. A. Melkov
                                                                                             1                     1

     Geophysical Institute, Vladikavkaz Scientific Center, Russian Academy of Sciences, 93a
     1

       Markova Str., Vladikavkaz 362002, Russian Federation, e-mail: cgi_ras@mail. ru;
           2
            Boğaziçi University, Kandilli Observatory and Earthquake Research Institute,
                      Istanbul 34342, Turkey, e-mail: 4alipinar@gmail. com

                           Received: 20.08.2020, revised: 03.09.2020, accepted: 04.09.2020

      Abstract: Relevance. The last decades in Russia have been characterized by high growth rates of population,
industry, infrastructure in large cities and industrial centers located in seismically active regions. The construction
did not always take into account the characteristics of local soils and the level of seismic hazard. The study of the
consequences of strong and destructive earthquakes created the conditions for new scientific developments in
engineering seismology and earthquake-engineering. Seismic zoning of urbanized territories makes it possible
to assess the seismic risk of the territory, take measures to strengthen existing buildings and carry out the
construction of buildings and structures with a given seismic resistance. This problem is especially relevant for
the regions of the Caucasus. The Republic of North Ossetia-Alania is located in a fairly high seismically active
zone. It seems natural to assess the seismic risk in the capital of the republic – the city of Vladikavkaz. Aim. The
aim of the work is to develop and implement modern methodology for the expected seismic risk assessment of a
city on the example of Vladikavkaz city. Methods. The methods associated with the assessment (probabilistic or
deterministic) of ground motion include consideration a number of processes: earthquake source, disaggregation
of probabilistic hazard, empirical relationships of seismic attenuation, site effects, and construction mechanics.
All of this demands regularization of Construction Norms parameters with different methodologies and
corresponding methodology development based on GIS technology. Results. Previous test area assessment
results are presented and tips for improvement and regularization are given. Consideration of specific types of
soils and types of building stock with estimated intensities and vulnerabilities of building types caused a different
level of expected economic losses.
      Keywords: seismic hazard, intensity, soil conditions, seismic risk, economic and social losses.
      For citation: Zaalishvili V. B., Pinar A., Erdik M., Burdzieva O. G, Melkov D. A. Issues of seismic risk
assessment of Vladikavkaz city. Geologiya I Geofizika Yuga Rossii = Geology and Geophysics of Russian South.
(in Russ.). 2020. 10 (3): 94 – 113. DOI: 10.46698/VNC.2020.47.51.006.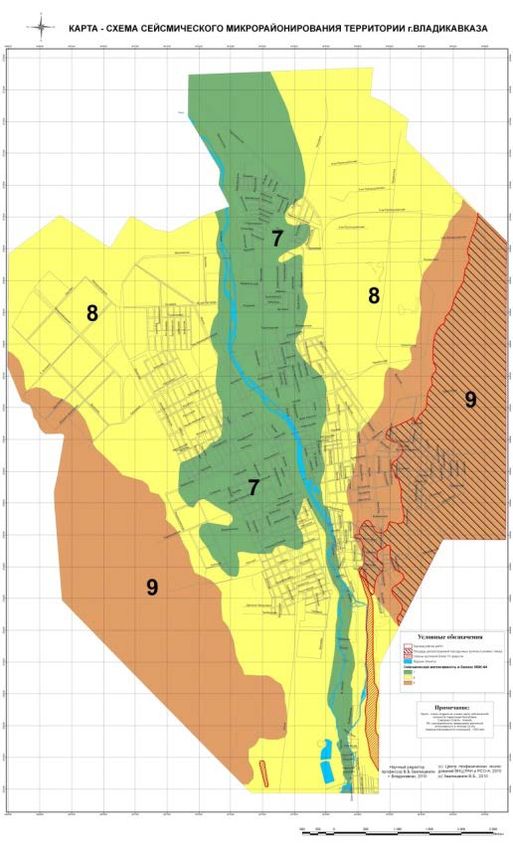
Geology and Geophysics of Russian South           10 (3) 2020          Геология и геофизика Юга России   95

================================ГЕОФИЗИКА ================================

УДК 550:34
DOI: 10.46698/VNC.2020.47.51.006

                                           Обзорная статья

     К вопросу сейсмического риска территории
                  г. Владикавказа
       В. Б. Заалишвили             1
                                     , А. Пинар 2, М. Эрдик               2
                                                                           , О. Г. Бурдзиева         ,
                                                                                                     1

                                           Д. А. Мельков 1

1
 Геофизический институт Владикавказского научного центра Российской академии наук,
 Россия, 362002, РСО-Алания, г. Владикавказ, ул. Маркова, 93а, e-mail: cgi_ras@mail. ru;
         2
          Университет Богазичи, Обсерватория Кандилли и институт Исследования
            землетрясений, Турция, Стамбул, 34342, e-mail: 4alipinar@gmail. com

               Статья поступила: 20.08.2020, доработана: 03.09.2020, одобрена в печать: 04.09.2020

     Аннотация: Актуальность работы. Последние десятилетия в России отмечены высокими темпами
роста населения, промышленности и инфраструктуры в крупных городах и промышленных центрах, рас-
положенных в сейсмически активных регионах. При строительстве не всегда учитывались местные грун-
товые условия и уровень сейсмической опасности. Изучение последствий сильных и разрушительных
землетрясений создало условия для новых научных разработок в инженерной сейсмологии и сейсмостой-
ком строительстве. Сейсмическое районирование урбанизированных территорий дает возможность оце-
нить сейсмический риск территории, принять меры по усилению существующих построек и осуществить
строительство зданий и сооружений с заданной сейсмостойкостью. Эта проблема особенно актуальна для
регионов Кавказа. Республика Северная Осетия-Алания расположена в зоне достаточно высокой сейсми-
ческой активности. Оценка сейсмического риска в столице Республики – городе Владикавказ становит-
ся очевидной. Цель работы. Целью работы является разработка и внедрение современной методологии
оценки ожидаемого сейсмического риска города на примере города Владикавказ. Методы исследований.
Методы, связанные с оценкой (вероятностной или детерминистической) движений грунта, включают рас-
смотрение ряда процессов: очага землетрясения, отделения вероятностной опасности, эмпирических со-
отношений затухания сейсмических волн, влияния площадки и строительной механики. Все это требует
упорядочения параметров строительных норм с использованием различных методологий и разработки
соответствующей методики на основе ГИС-технологий. Результаты работ. Представлены результаты пре-
дыдущей оценки тестовой области и даны советы по улучшению и регуляризации. Рассмотрение конкрет-
ных типов грунтов и типов застройки с оценкой интенсивности и уязвимости типов зданий дало разный
уровень ожидаемых экономических потерь.
     Ключевые слова: сейсмическая опасность, интенсивность, грунтовые условия, сейсмический риск,
экономические и социальные потери.
     Для цитирования: Заалишвили В. Б., Пинар А., Эрдик М., Бурдзиева О. Г., Мельков Д. А. К вопросу
сейсмического риска территории г. Владикавказ. Геология и геофизика Юга России. 2020. 10 (3): 94 – 113.
DOI: 10.46698/VNC.2020.47.51.006.

                                            1. Introduction
    An important problem of the modern seismic risk assessment methodology is the
lack of a still reliable account of the features of seismic impact and the response of the
existing building stock in their relationship. It is enough to recall the consequences of the
Spitak earthquake (1988), the unexpected colossal losses of which were caused by the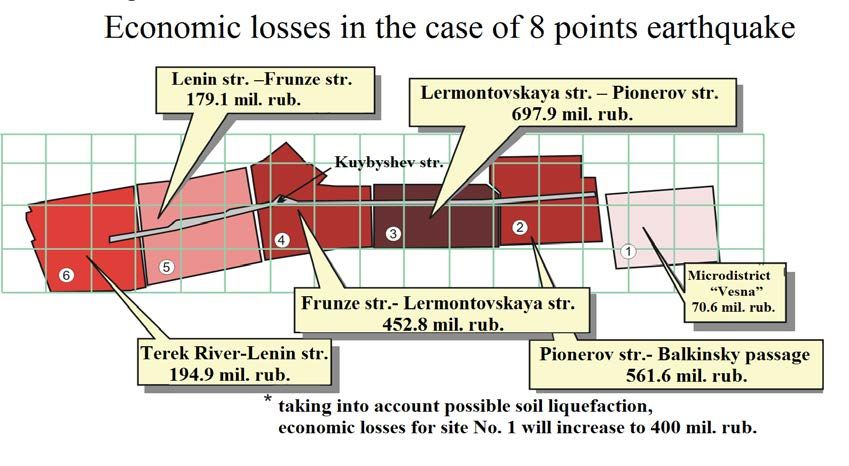
96    Geology and Geophysics of Russian South   10 (3) 2020      Геология и геофизика Юга России

coincidence of the prevailing period of seismic impact, formed by the influence of a thick
stratum of soft sedimentary deposits overlain by a layer of rock, on the initial seismic
signal, with the period of natural or predominant vibration of high-rise buildings that
were either destroyed or critically damaged. An important aspect of the methodology is
the dependence between the effect of the amplitude-frequency characteristics of a seismic
signal on the foundation soils and building stock and the level of the impact itself and its
spectral composition, which is often caused by significant nonlinear phenomena (up to
soil liquefaction). In fact, the duration of the incoming seismic signal also has a decisive
influence on the earthquake effect. The noticeable influence of the relationship between
the direction of incoming seismic waves and the orientation of a building stock on the
severity of its destruction and damage, as well as the effect of multiple earthquakes and
various dynamic effects on the state of building stock and its seismic resistance are well
known. Finally, despite the development of a number of modern methods for seismic
risk assessment insufficient attention is paid to the results of seismic microzonation with
a changing level of seismic impact, which causes a variation in the calculated intensity
increments. A full accounting of seismic effects and their relationship with the features of
a building stock and foundation soils on the basis of the latest achievements will make it
possible to develop a new methodology for state assessment and forecasting the behavior
of the “soil-building stock” system during strong earthquakes.

                                   2. Seismic risk concepts
     To assess seismic hazard, a probabilistic approach is currently used in the world.
The approach is caused by the probabilistic nature of an earthquake itself. The seismic
resistance of a building stock is determined not only by the strength of its elements
(construction, material, etc.) but also by the conditions which occur during operational
loads. During strong earthquakes, the strength characteristics of building stock will be
determined by various features of the seismic load. Seismic effects are characterized by
the load level and the range of periods or frequencies of the incoming vibrations. Under
intense loads, soils exhibit significant physical nonlinearity, characterized by a change
in their amplitude and vibration frequency. Numerous experimental studies show that
constructions usually vibrate with the frequency or period of their natural vibrations
regardless of the frequency of the external influences. In this case, the prevailing periods
of natural or free vibrations of most buildings and structures are in the range T = 0.1‑2.0
s. Thus, the vibration frequency of the dynamic load experienced by a structure during
earthquakes, as a rule, is in the range of 0.5‑10 Hz. On the other hand, as a result of
the interaction of the system “foundation soils – structure”, during intense loads under
the conditions of noticeable physical nonlinearity of soils, the prevailing or resulting
vibrations will differ significantly from the frequency of free vibrations.
     Despite the development of a large number of adaptive systems for the protection of
buildings and structures, this fact makes the forecasting of building stock behavior during
strong earthquakes rather uncertain. Currently, techniques and methods for seismic hazard
and risk assessment of territory have been developed; new data on the soil layer behavior
under intense seismic loads and its influence on the transformation of vibration frequencies
during the passage of waves excited by strong earthquakes have been obtained. At the
same time, there is still no single information and technical system that allows performing
the entire range of work in the format of structural-dynamic, kinematic, physical and
mathematical models of the spatial data infrastructure and realizing calculations in a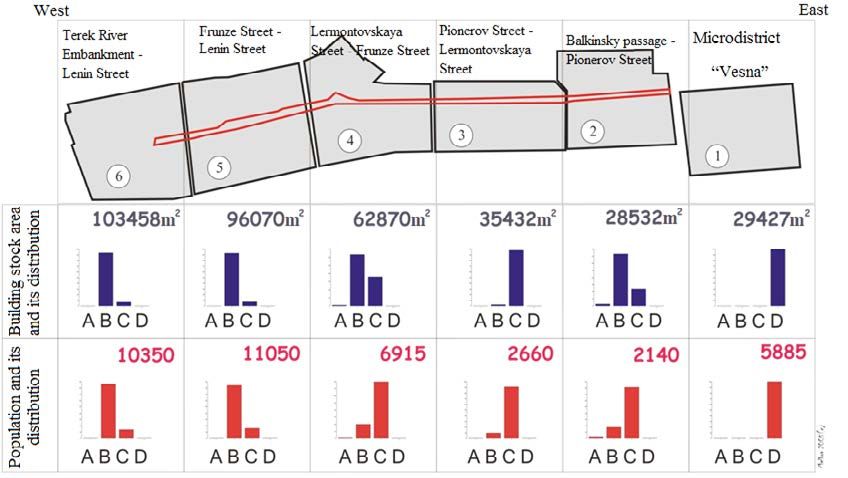
Geology and Geophysics of Russian South   10 (3) 2020     Геология и геофизика Юга России   97

single information field. The absence of reliable accounting of resonance phenomena in
the “soil-structure” system associated with their interaction is one of such problems of
modern methods of the expected seismic risk assessment.
     In this regard, it is useful enough to recall the consequences of the Spitak earthquake
of 1988, the colossal losses in which were caused by the coincidence of the frequency
of seismic impact, distorted by the initial signal passage through a thick layer of weak
lacustrine sediments, covered with rocks, and the natural frequencies of buildings of
the so-called 111 series. These were buildings on the territory of the city of Leninakan,
that were all destroyed or critically damaged, in contrast to the similar buildings in the
city of Kirovokan. So establishment of the various sides of the complex diversity of the
interaction of seismic impact and the urbanized environment is of a high importance.
Analysis and subsequent adequate consideration of the features of seismic impacts on
the designed and the existing construction site will significantly reduce both economic
and social damage through a preliminary or subsequent regulation of the hazardous
characteristics of a construction site in an urbanized area.
     The term “seismic risk” was first identified as a special concept, different from the
actual term “seismic hazard” in the foundational work of Cornell [Cornell, 1968]. In
Russia, the issues of seismic zoning were considered by I. E. Gubin, S. V. Medvedev,
Yu. V. Riznichenko. [Gubin, 1950; Medvedev, 1960; Riznichenko, 1965]. The influence of
soil conditions was investigated in the works of Egorov, Popov V. V. (1945), A. N. Safaryan
(1963). Further development of the methods of long-term forecasting was obtained in the
works of G. A. Sobolev, V. I. Ulomov, M. I. Bogdanov. [Sobolev, 1992; Ulomov et al.,
1993; Ulomov, 1994; Balassanian et al., 1999; Ulomov et al., 2015].
     At present, a large number of studies are concerned with seismic hazard [Pinar et
al., 2001, 2016; Zaalishvili, Rogozhin, 2011; Yamamoto et al., 2020] and seismic risk
assessments [Shah, 1995, 2009; Shah, et al., 1987, 1992; Balassanian et al., 1999; Erdik,
2005, 2013, 2017; Erdik et al., 2000, 2018; Durulkal et al., 2008; Chan et al., 1998;
Davidson et al., 1999; Dong et al., 1994; Yuchang and Kemon, 1991; Zaalishvili et al.,
2001]. The following works of Trifunac [Trifunac, Todorovska, 1998], Bazurro and
Cornell [Bazzurro, Cornell, 2004] and many other foreign researchers` works [Yang et al.,
2000; 2018; Campbell & Bozorgnia, 2003; Bolisetti et al., 2018; Chandra, Gueguen, 2019;
Dammala, 2019; Das, Chakrabortty, 2020; Kwok et al., 2007; Phillips & Hashash, 2009;
Rathje et al., 2010; Riga et al., 2018; Sonmezer et al., 2018] are devoted to the study of
nonlinear properties. The works analyze the consequences of strong earthquakes [Hartzell
et al., 1999; Kaklamanos et all., 2013, 2015]. Sometimes, the analysis is done using strong
motion databases [Mahani & Kazemian, 2018; Kaklamanos & Bradley, 2018; Afshari &
Stewart, 2019; Pagliaroli et al., 2018; Pavel et al., 2019; Wang et al., 2019; Zeghal et al.,
1995] or with the help of mathematical modeling [Poul et al., 2018; Stupazzini et al.,
2009; Terziv & Ignatakis, 2018; Thebian et al., 2018; Tsiapas & Bouckovalas, 2019]. In
the works of A. V. Nikolaev and V. B. Zaalishvili [Zaalishvili, Kanukov, 2013; Zaalishvili,
2016; Zaalishvili et al., 2014, 2018, 2019a, b, 2020], the experiments have been described
and the methods have been developed to assess the nonlinear behavior of soils using the in
situ instrumental method directly in the investigated area.
     To predict the expected consequences of strong earthquakes, as well as other disasters,
a detailed study of the features of urbanized territories is required. At the end of the 20th
century, different approaches for assessing the seismic risk of already existing buildings
and structures were developed in Russia. They took into account various factors that, with
98     Geology and Geophysics of Russian South    10 (3) 2020      Геология и геофизика Юга России

varying accuracy, determine the level of an expected seismic risk. One of the first such
techniques, considering world experience, was developed by S. Yu. Balasanyan. in 1991.
Aizenberg Ya. M., Klyachko M. A., Koff G. L. [Klyachko, 1994; Klyachko, Polovinchik,
1994; Polovinchik, Klyachko, Koff, 1995] laid the foundation and made a significant
contribution to the formation and subsequent development of domestic approaches of
risk assessment. Developed by Zaalishvili V. B. in 2000 method of rating assessment
of soil conditions and seismic risk of the territory seems to be a more complete and,
apparently, more adequate forecasting technique. This method was first applied for the
allocated territory of Tbilisi during the process of implementing the international project
of the INTAS Program “Seismic hazard assessment for big cities in Georgia using the
modern concept of seismic microzonation with consideration of soil non-linearity” (1999-
2001). Later, in 2004, a rating assessment of the complex of engineering-geological,
hydrogeological, geomorphological and other features of soil conditions was for the first
time successfully implemented in Russia for the capital of North Ossetia under the next
international NATO “Science for Peace” Program Project “Seismic Risk of Large Cities
of Caucasus: Tools for Risk Management. Azerbaijani, Armenian, Georgian and Russian
(North-Ossetian) scientists took part in the realization of this project. In this case, a rather
extensive area of the city of Vladikavkaz (Kuibyshev street and the adjacent quarters)
was chosen as the object of the study. It is known, that the vulnerability of building
stock during strong earthquakes depends significantly on its type and infrastructure
characteristics. Different types of construction of buildings are characterized by the
different seismic vulnerability. The traditional use of the letters to denote different types
of buildings derives from the Modified Mercalli-Richter Scale of 1956 (MM1). This
classification characterizes different levels of vulnerability quite roughly. Similarly, the
current MSK-64 seismic scale directly identifies building classes by type of construction
and resulting differences in the vulnerability or building exposure to seismic effects. The
vulnerability curves do not take into account resonance phenomena; it necessitates a set
of curves for each vibration frequency. Assessment of buildings` resonant frequencies,
which, first of all, depend on the type of structure and number of storeys must be carried
out. And microseismic method could be used.
     The aim of the work is to develop the existing methodology of a building stock seismic
risk assessment and to work out new approaches for taking into account the interaction
of building stock and foundations in the urbanized territories based on the use of modern
knowledge and technologies. To achieve this goal, the following tasks are required:
     – Creation of a data infrastructure that allows carrying out the modeling and various
calculations of seismic effects (including the influence of the location of faults and the
influence of local soil conditions), data on the building stock and its interrelationships,
which together make it possible to simulate scenarios (with the help of modern
computational power)
     – Development of computational algorithms for modeling the initial seismic impacts
for different recurrence periods, the response of the soil strata and building stock to these
effects, with support for the possibility of multivariate calculations and the use of the
Monte Carlo method.
     – Modeling based on known and developed methods for seismic risk assessment,
comparing the results and choosing the most optimal methodology for the conditions of
the North Caucasus.
     The considered and the other tasks are the methodological basis and are included in
each stage of work (detailed zoning – seismic microzonation – risk assessment)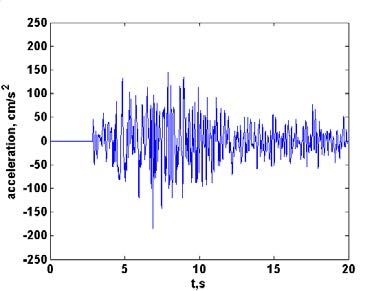
Geology and Geophysics of Russian South    10 (3) 2020      Геология и геофизика Юга России   99

                                 3. Seismic hazard assessment
     Seismic hazard assessment carried out in connection with the analysis of the risks
of urbanized areas can be realized using probabilistic or deterministic approaches. A
probabilistic approach would be relevant for probable losses estimation in a given area or
geocell. However, since all probable losses in a given geocell cannot manifest themselves
simultaneously, the integral effect of individual (single) losses will give an overestimation
of the total losses in the urban area. In addition, a spatial-system approach is required for
the assessment of the life cycles` disruption. As general, estimates of earthquake losses
in urban areas have traditionally been deterministically associated with an earthquake
scenario (or the set of scenarios).
     An earthquake scenario can be assessed by disaggregating the probabilistic hazard to
find the source that contributes the most to the formation of the integral hazard (Thenhaus
and Campbell 2003; Somerville and Moriwaki 2003; Faccioli and Pessina 2003).
     The methods associated with the assessment (probabilistic or deterministic) of ground
motion include consideration of the following processes:
     • Process at the source of the earthquake
     • Disaggregation of probabilistic hazard
     • Empirical relationships of seismic attenuation
     • Effects close to faults (directivity graph and radiation directivity)
     • Influence of soil conditions
     Nowadays reliable empirical models exist in terms of peak acceleration, velocity
and displacement (PGA, PGV, and PGD) and pseudospectral velocity (PSV) at the
specific frequencies and damping factors for a given earthquake intensity, distance, fault
mechanism, and local geology [e. g. Boore et al. 1993; Campbell and Bozorognia 1994;
Gregor, 1995; Fukushima and Tanaka, 1990; Ambraseis and Bommer 1995; Campbell
2003a, 2003b]. Although the statistical results were obtained for the territories which
are fully equipped with monitoring systems (for example, California and Japan), the
comparison shows that with identical definitions of the input parameters, the difference
between the attenuation ratios in the western United States, Japan and Europe is less
than the actual dispersion in any of them. [Fukushima and Tanaka 1990; Ambraseys and
Bommer 1995]. This substantiates the use of the data for the territory of Turkey and the
Greater Caucasus. We will also consider numerical modeling procedures for determining
ground motion based on the mechanism of fracture disruption and wave propagation.
At shorter distances, the phenomena associated with the finite dimensions of the fault
become significant. These phenomena are primarily caused by the final velocity of
disruption propagation, as a result of which some parts of the fault emit energy earlier
than others; thus, waves emitted with delays then interfere, causing significant directivity
effects. The modeling method used, for example, in the FINSIM program [Beresnev,
Atkinson, 1997, 1998], is described in works and previous publications devoted to the
basics of the stochastic technique. The time series for the sub-faults are generated using
the Boore procedure, which assumes a baseline ω2 spectrum and takes into account
the propagation of seismic waves to the observation point, using defined duration and
attenuation operators. The program uses the standard stacking operation, in which the
rupture from the hypocenter propagates radially, initiating secondary sources during its
passage. The random component enters at the moment of the sub-source starting, etc.
Analysis and consequent account of initial accelerograms transformation will become the
basis for site effect analysis at strong seismic loadings (Figure 1) [Zaalishvili et al., 2010].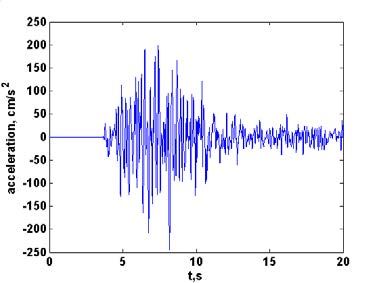
operation, in which the rupture from the hypocenter propagates radially, initiating secondary
sources during its passage. The random component enters at the moment of the sub‑source
starting, etc. Analysis and consequent account of initial accelerograms transformation will
become the basis for site effect analysis at strong seismic loadings (Figure 1) [Zaalishvili et al.,
2010].
     100 Geology and Geophysics of Russian South    10 (3) 2020    Геология и геофизика Юга России

                                                            a)                                                 b)

                                                                 VLADIKAVKAZ

                                                                     1
                                                                                       2
                                                                                                           3

                                                             10 km
                                                       c)                                                           d)

                      Fig.Fig.
                            1. Synthetical
                               1. Syntheticalaccelerograms
                                               accelerograms forfor different
                                                                    differentsource
                                                                               source   locations:
                                                                                     locations:
   a – westerna part
                – western  partbof–fault;
                     of fault;      middleb –part
                                              middle  part ofcfault;
                                                   of fault;         c – eastern
                                                               – eastern         part
                                                                            part of    of fault;
                                                                                    fault;       d – scheme
                                                                                            d – scheme   of sources of
                                          of sources of scenarios
                                                scenarios          earthquakes
                                                           earthquakes

       Seismic
          Seismic microzonation
                    microzonation  (SMZ)
                                     (SMZ)cancanbe
                                                 beviewed
                                                    viewed asas aa method
                                                                   methodofofzoning
                                                                               zoningofof  a city
                                                                                        a city or aor  a large
                                                                                                    large
construction site in areas with the same ground response for standard seismic effect of a certain
     construction site in areas with the same ground response for standard seismic effect of a
level and assessment of the relative changes in the characteristics of vibrations on the surface
     certain level and assessment of the relative changes in the characteristics of vibrations on
relative to the characteristics of vibrations of so‑called reference site to which the initial intensity
     the surface relative to the characteristics of vibrations of so-called reference site to which
is attributed. In Russia the reference sites are sites with average seismic properties of ground
     the initial intensity is attributed. In Russia the reference sites are sites with average seismic
conditions of certain territory. In Armenia and Georgia sites with the worst ground conditions are
     properties of ground conditions of certain territory. In Armenia and Georgia sites with the
     worst ground conditions are generally considered as reference, although in some cases
     they can be averages. In the United States the reference sites are Rock sites. In former
     USSR sites with standard ground conditions traditionally were chosen after macroseismic
     investigation of historical strong earthquakes.
          Sites with the same intensity are combined in different seismic zones. Engineering-
     geological, hydrogeological and geomorphological conditions are taken into account.
     On the other hand, the target of seismic microzonation is development of initial data
     of various levels of seismic impacts for structural engineering and urban planning. The
     territory is divided into a grid with equal cells. Further the parameters of the forming
     characteristics of ground conditions in each of these cells are defined, which requires
     active use of GIS technology [Zaalishvili, Berezko, 1999]. In particular, such studies have
     been carried out in 2000, in the process of implementation of the international project
     for a large area of Tbilisi, with various types of soils, in different physical conditions
     [Zaalishvili et al., 2001].
          In general, the process of seismic microzonation can be divided into three phases. In
     the first phase, initial regional seismic characteristics of the earthquake at rock level are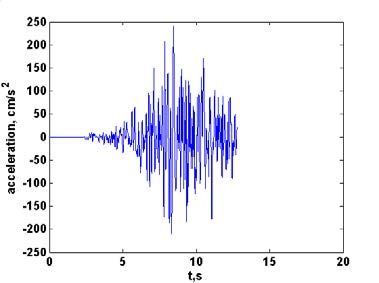
Geology and Geophysics of Russian South   10 (3) 2020     Геология и геофизика Юга России   101

determined for each cell. In the second stage, the site profiles are modeled on the basis
of the results of the drilling and field testing. The third phase includes an analysis of the
expected response of sites to evaluate characteristic of earthquake on the surface and
interpreting the results of microzonation [Ansal et al., 2004, 2010]. When the available
data of engineering geological zoning (usually the results of surveys of past years) do
not correspond to modern requirements (for example, insufficient data on fill content
in gravels), the instrumental studies based on some selected grounds in the territory is
essential for the reliability of the final result.
     In the paper approaches used abroad is combined with techniques of Russian-
Georgian school of seismic microzonation, especially instrumental method which is
the primary method of SMZ. Seismic process is a complex multifactor process, so final
maps of seismic microzonation are based on the results of integrated use of instrumental,
calculational and recently developed instrumental-calculation methods. On the basis of
this approach in 2010 SMZ Map of Vladikavkaz city was developed (Figure 2).

                                                                      Fig. 2. Seismic microzo-
                                                                      nation Map of the terri-
                                                                      tory of Vladikavkaz city
102 Geology and Geophysics of Russian South 10 (3) 2020 Геология и геофизика Юга России
4. Vulnerability of buildings and structures
Tables 1‑2 show number of damaged buildings, degree of damage d and the
corresponding values of the damage coefficient DR for different intensity levels I.
The value of the damage coefficient above 30 % from an economic point of view
should be considered as very high for repair and, therefore, can be considered 100 % loss
for functioning in certain cases.
Each intensity level in the macroseismic scale represents a certain number of buildings
that must be exposed to a certain extent within the range of damage levels from 1 to 5.
Vulnerability value for a building of types A, B, C, D, taking into account the data in
Table 1 and Table 2 at various levels of macroseismic intensity can be calculated using
the following expression:
(1)
It must be noted that “averaged” express assessment technique based on MSK-64
scale concept is applied. It is applicable for the most of the buildings of the investigated
area and allowed to make assessment in a short time. Specifics of new building types as
for the site 1 are considered in section 8. Life-cycle cost and seismic reliability analysis
could give more precise and detailed result.
Table 1.
Number of damaged buildings N (% of total) with corresponding degree of damage
d at different intensity levels on the MSK – 64 scale [Sobolev, 1997].
Building type
Seismic A B C D
intensity
I, MSK- Number Number Number Number
64 scale of dam‑ Degree of dam‑ Degree of dam‑ Degree of dam‑ Degree
aged of dam‑ aged of dam‑ aged of dam‑ aged of dam‑
buildings, age d buildings, age d buildings, age d buildings, age d
N (%) N (%) N (%) N (%)
10 1 15 0 50 0 65 0
35 2 35 1 50 1 35 1
7 50 3 50 2
5 4
10 2 10 1 10 0 45 0
35 3 35 2 35 1 50 1
8 50 4 50 3 50 2 5 2
5 5 5 4 5
15 3 10 2 10 1 15 0
35 4 35 3 35 2 50 1
9 50 5 50 4 50 3 35 2
5 5 5 4Geology and Geophysics of Russian South 10 (3) 2020 Геология и геофизика Юга России 103
Table 2.
Degree of damage d and the corresponding values of the damage coefficient DR
[Sobolev, 1997]
Degree of damage d 1 2 3 4 5
Damage coefficient
0.02 0.10 0.30 0.80 1.00
DR
In the study area, four structural types of buildings were identified. For each type, a
seismic vulnerability was calculated. The value of the degree of vulnerability lies in the
range 0 ≤ V ≤ 1. The closer V is to unity, the higher the vulnerability of the building. A
value of 1 corresponds to the complete collapse of the building. The results are presented
in Table 3 and in Fig. 3.
Table 3
Vulnerability Vi, corresponding to four types of buildings
on the MSK-64 [Sobolev, 1997]
Building Macroseismic intensity on MSK-64 scale
type
V VI VII VIII IX XII
A 0.001 0.015 0.227 0.565 0.825 1
B 0 0.001 0.057 0.227 0.565 1
C 0 0 0.010 0.072 0.227 1
D 0 0 0.002 0.015 0.06 1
1,2
1
0,8
0,6
V
0,4
0,2
0
V VI VII VIII IX XII
-0,2
I
A B C D
Fig. 3. The dependence of the vulnerability of buildings V from the intensity I104 Geology and Geophysics of Russian South 10 (3) 2020 Геология и геофизика Юга России
5. Seismic risk assessment
On one or another urbanized area, the population, buildings and structures, various
communications and socio-economic activities are considered as the “elements of risk”.
Buildings and life support systems form an “artificial environment”. Physical losses of
the elements of risk, which may result from a particular earthquake scenario, require an
extensive and comprehensive collection of “inventory” or initial data, i. e. the collection of
the following information: demographic distribution at different times of the day; building
stock and its typification; life support systems and infrastructure (main roads, railways,
bridges, overpasses, public transport, distribution of electricity, water supply, sewerage,
gas supply, telephone communications, including cell towers and the possibility of their
operation at maximum loads), including their nodal points (stations, pumps, switchgears,
storage systems, power transmission towers, sewage treatment plants, airports, seaports,
etc.); main and critical facilities (dams, power plants, large chemical and fuel storage
tanks) in the form of GIS databases. In fact, the issue is to develop the main elements of
the domestic HAZUS system [HAZUS, 1999, 2014]. The vulnerability functions of the
elements at risk represent the possibility of its response to an earthquake exceed its various
limit states based on physical and socio-economic impacts. Vulnerability assessments are
usually based on the analysis of the previous earthquake data (the observed vulnerability)
and on the analytical studies (predicted vulnerability). The main physical vulnerability is
associated with buildings, infrastructure and life support. Secondary physical vulnerability
is associated with consequential losses. Socio-economic factors of vulnerability include
accidents, social disruption and injuries, as well as economic consequences, not only
associated with damage to the facilities but also production downtime, supply disruptions,
etc.
To construct scenarios of losses, caused by earthquakes, vulnerability matrices,
which link damage classes to impact intensity, must be used. The principles, underlying
the MSK-64 scales and the new developed domestic seismic scale of the MSK type, will
be used for the territory of the North Caucasus. Several approaches will be used to assess
the losses directly under the conditions of various earthquake scenarios and average
losses (for the different probability of nonexceedance) and a comparative analysis will
be performed.
HAZUS is a standardized methodology for estimating earthquake losses implemented
in GIS [Whitman and Lagorio, 1999]. HAZUS provides a quantitative estimate of losses in
terms of direct costs to repair and replace damaged buildings and life support components;
direct costs associated with the loss of function (for example, loss of business income);
victims; people who have lost their homes; expenses for the elimination of blockages;
regional economic implications; loss of functionality in terms of loss of function and
recovery time for buildings, critical facilities such as hospitals and life support systems.
KOERILoss is a software developed by Earthquake Engineering, Bogadishi University
(Kandilli Observatory and Earthquake Research Institute (KOERI)). The software uses
a loss estimation methodology (probabilistic or deterministic) developed by KOERI to
perform the analysis for estimation of potential losses from earthquakes. The Code or
Norms for the assessment of seismic scenarios was developed by the Italian National
Seismic Service (SSN) [Di Pasquale and Orsini, 1997]. This model uses seismic intensity,
which supposes its adaptation to the Russian MSK scale.
According to the definition, the risk is the probability of economic and social damage
for a given territory over a certain period of time.Geology and Geophysics of Russian South 10 (3) 2020 Геология и геофизика Юга России 105
It is possible to assess risks, expressed as a percentage of losses for individual
elements of risk or in monetary terms of these losses. The percentage of seismic risk is
more convenient because such expression is more stable for certain elements of risk. The
percentage ratio of losses does not depend on inflation and makes it possible to compare
the results of assessments according to the materials of different countries, regardless of
the ratio of the currency rate.
The area of the study was located on the territory of 1.35 km2; Gorky Street
was considered as its southern border, the northern boundary passed along the of
Dzhanaev Str., Markov Str., Osipenko Lane and Shchukin Brothers Str.; in the west, the
region stretched to the Terek River, and in the east it was limited by the corresponding
line of the constructed Vesna district. The built-up part of the area was conditionally
divided into six approximately equal sites, which are named from east to west: 1) Vesna,
2) Balkinsky passage – Pionerov Street, 3) Pionerov Street – Lermontovskaya Street, 4)
Lermontovskaya Street – Frunze Street, 5) Frunze Street – Lenin Street 6) Lenin Street
– Terek River. Within each of the site, on the vector graphic, various objects and their
number of storeys (separate houses and their groups, schools, institutes, administrative
and public buildings, markets, etc.) were allocated, for each of which constructional
types of buildings (A, B, C, D) and their number of storeys were established (Fig. 4).
Constructional types of buildings were chosen while considering the design estimation
documentation, as well as during the inspection of structures in-situ. The researchers of
the institute were involved for this purpose. In each of the above-mentioned sites, its total
area was determined, as well as the total area occupied by various built-up objects.
Data for some types of damage calculation is necessary in order to estimate the total
damage:
– L1 is economic damage as a result of damage and (or) destruction of residential
buildings and structures;
– L2 is economic damage as a result of damage and (or) destruction of urban
infrastructure (excluding indirect losses);
– L3 is economic damage as a result of damage and (or) destruction of buildings for
social welfare services (institutions of management, health care, etc.);
– L4 is social damage.
Damage caused by the secondary effects of earthquakes is taken into account by
introducing specially designed multiplying coefficients for additional costs associated
with the mitigation of the consequences (caused by the soils deformation, landslides,
mudflows, etc.) including those connected with the impact of additional engineering
protection structures from hazardous processes.
The total economic losses L is calculated as the sum of individual types of losses for
all zones of varying intensity [Balassanian et al., 1999]:
(2)
where, sij is building stock density of type j in the zone with intensity i; vij is an
average vulnerability of a single object; Cij is the average cost of a single object.
Distribution of economic losses during an intensity 8 earthquake is shown in Fig. 5,
which clearly shows that the largest economic losses should be expected in areas 2 and 3,
which, first of all, is due to soil conditions. At the same time, the risk of economic losses
for site 1 (“Vesna” micro-district) is insignificant, due to the fact that the development
of this area consists entirely of D-type buildings. At the same time, considering possible106 Geology and Geophysics of Russian South 10 (3) 2020 Геология и геофизика Юга России
tilting of buildings caused by soil liquefaction, an economic risk will increase several
times and according to our assessments will be about 400 million rubles (damage to about
30 % of building stock).
Fig. 4. Initial data for seismic risk assessment
Fig. 5. Expected economic losses in the case of 8 points earthquake for Vladikavkaz
(for average soil conditions)
5. Results and discussion
Based on the analysis of the results of geological surveys on Kuybyshev Street on
the territory of Vladikavkaz six sites with different soil conditions were identified. Then,
using the method of expert assessments, rating evaluations of the soils of the foundationsGeology and Geophysics of Russian South 10 (3) 2020 Геология и геофизика Юга России 107
According to detailed seismic zoning and seismic microzonation data, the calculated
intensity for the indicated site varies within 7‑9 points.
Analysis of the calculation results shows that, depending on the type of buildings,
the vulnerability varies widely. It can be well seen that the modern development of
the “Vesna” micro-district is sharply distinguished by the minimality of the predicted
vulnerability. Here it is almost zero at 6‑9 points of impact. On the other hand, an analysis
of the instrumental records of stations located in different soil conditions shows that this
region is characterized by a significant seismic hazard due to the foundation soils in the
form of a thick layer (20 meters or more) of clayey soils with a free-flowing consistency.
The results of the analysis of the worst effects of earthquakes show that the base plates,
although they prevent the effect of the uneven settlement on the integrity of buildings,
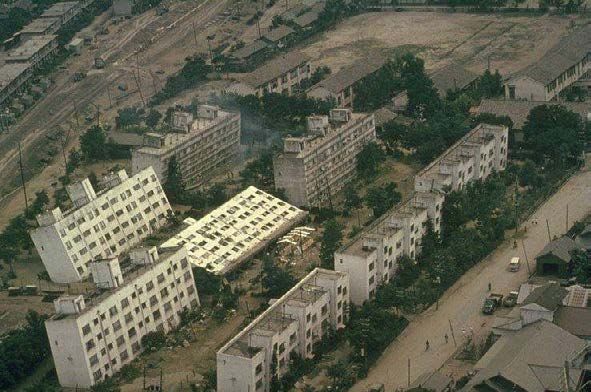
Fig. 6. Micro-district Vesna, Vladikavkaz
M max = 7.1 . Photo: T. V. Zaalishvili
Fig. 7. Soil liquefaction June 16, 1964, Niigata, Japan,
M max = 7.5 . Photo: Joseph Penzien108 Geology and Geophysics of Russian South 10 (3) 2020 Геология и геофизика Юга России
with soft base soils make them very vulnerable to tipping. Examples of such accidents
are well known (Niigata, 1964). In general, the question of the traditional increase in
the intensity of a site in order to enhance them is still controversial, since even a second
sagging of individual parts of a heavy building will lead to significant damage. Some
authors believe that buildings are not recommended to be strengthened and believe that it
is even harmful because, on soft soils, a heavy building may simply “sink” in the ground.
Therefore, it is necessary to implement special measures to strengthen the soil itself.
When implementing the seismic impact of the expected level, and, as noted above
this is the magnitude of M = 7 with an earthquake intensity of 9‑10 points in the epicenter,
an earthquake that is generated directly in the southern part of the city, will have the same
intensity in the investigated site.
Considering that soil liquefaction usually takes place for flooded soils already with
8‑point intensity, a very realistic manifestation of a seismic event similar to Niigata (Fig.
7.) seems quite feasible at the “Vesna” site (Fig. 6). It should be noted that during the
Niigata earthquake (Japan, 1964), good quality houses simply lay on the ground almost
undamaged. With minimal social losses, the economic damage was great. For site No.
1 (Vesna), represented by the ground layer, which contains a layer of soil of flowing
consistency, the economic loss a priori will increase by 2.5 times and, according to
calculations, will amount to 400 million rubles. (Fig. 5.). Due to the very high quality of
buildings, by the way, designed for 8 points, social losses here will be minimal. Social
losses during earthquakes are mainly determined by the level of damage to buildings and
structures. At the same time, the so-called secondary effects in the form of landslides, soil
liquefaction, floods can become defining and abnormally high at a certain confluence of
negative factors. As noted above, it is necessary to note the problem of fires, which often
accompany destructive earthquakes due to completely regular violations of gas pipelines,
power lines, etc.
But the most of the buildings are masonry type, especially in historical regions,
some of them are unique and needs special approach for vulnerability assessment and
reinforcement techniques for risk mitigation.
Conclusions
Finally the issue of seismic risk assessment implementation technique in the North
Caucasus consists in adoption and developing the main elements for the analog of HAZUS
system. To construct scenarios of losses, caused by earthquakes, vulnerability matrices,
which link damage classes to impact intensity, must be used. The principles, underlying
the MSK-64 scales and the new developed domestic seismic scale of the MSK type, will
be used for the territory of the North Caucasus as it shown for the test area of Kuibisheva
street in Vladikavkaz city. Several approaches will be used to assess the losses directly
under the conditions of various earthquake scenarios and average losses (for the different
probability of nonexceedance) and a comparative analysis must be performed.
References
1. Ambraseys N. N., Bommer J. J. Attenuation relations for use in Europe: An overview.
Proc. 5th SECED Conf. On European Seismic Design Practice: Research & Applicatinons, Balke‑
ma. 1995. pp. 67‑73.
2. Ansal A., Erdik M., Studer J., Springman S., Laue J., Buchheister J., Giardini D., Faeh D.,
Koksal D. Seismic microzonation for earthquake risk mitigation in Turkey. In: Proceedings of the
13thWorld Conference of Earthquake Engineering, Vancouver, BC. 2004. p. 1428.Geology and Geophysics of Russian South 10 (3) 2020 Геология и геофизика Юга России 109
3. Ansal A., Tönük G., Kurtuluş A. Microzonation for Earthquake Scenarios (Chapter 2).
Earthquake Engineering in Europe, ed. By M. Garevski, A. Ansal. Springer, 2010. pp. 125‑144.
4. Afshari, K., & Stewart, J. P. (2019, Aug). Insights from California Vertical Arrays on
the Effectiveness of Ground Response Analysis with Alternative Damping Models [Article].
Bulletin of the Seismological Society of America. Vol. 109 (4). pp. 1250‑1264. https://doi.
org/10.1785/0120180292
5. Balassanian S., Ashirov T., Chelidze T., Gassanov A., Kondorskaya N., Molchan G., Pus‑
tovitenko B., Trifonov V., Ulomov V., Giardini D., Erdik M., Ghafory-Ashtiany M., Gruenthal G.,
Mayer-Rosa D., Schenk V. and Stucchi M. Seismic hazard assessment for the Caucasus test area.
Annali di Geofisica. 1999. 42. pp. 1139‑1151.
6. Bazzurro P., Cornell C. A. Nonlinear soil-site effects in probabilistic seismic-hazard anal‑
ysis [Article]. Bulletin of the Seismological Society of America. 2004. Vol. 94 (6). pp. 2110‑2123.
https://doi. org/10.1785/0120030216
7. Beresnev I. A., Atkinson G. M. Modeling finite fault radiation from on spectrum. Bull.
Seism. Soc. Am. 1997. Vol. 87. pp. 67‑84.
8. Beresnev I. A., Atkinson G. M. (FINSIM – a FORTRAN program for simulating stochas‑
tic acceleration time histories from finite faults. Seismological Research letters. 1998. Vol. 69.
No. 1.
9. Bolisetti C., Whittaker A. S., Coleman J. L. Linear and nonlinear soil-structure interaction
analysis of buildings and safety-related nuclear structures [Article]. Soil Dynamics and Earth‑
quake Engineering. 2018. Vol. 107. pp. 218‑233. https://doi. org/10.1016/j. soildyn. 2018.01.026
10. Boore D. M. Stochastic simulation of high-frequency ground motions based on seismo‑
logical models of radiated spectra. Bull. Seism. Soc. Am. 1983. Vol. 73. pp. 1865‑1894.
11. Campbell K. W., Bozorgnia Y. (Updated near-source ground-motion (attenuation) rela‑
tions for the horizontal and vertical components of peak ground acceleration and acceleration
response spectra [Article]. Bulletin of the Seismological Society of America. 2003. Vol. 93 (1).
pp. 314‑331. https://doi. org/10.1785/0120020029
12. Campbell K. W., Bozorognia Y. Near-source attenuation of peak horizontal acceleration
from worldwide accelerogram recorded from 1957 to 1993. 5th US National Conf. on Earthq.
Engrg., Chicago. 1994.
13. Campbell K. W. Engineering models of strong ground motion. Earthquake Engineering
Handbook, edited by W. Chen and C. Scawthorn, CRC Press, New York. 2003a
14. Campbell K. W. Strong-motion attenuation relationships. International Handbook
of Earthquake and Engineering Seismology, edited by W. Lee, H. Kanamori, P. Jennings and
C. Kisslinger, Academic Press. 2003b
15. Chan L. S., Chen Y., Chen Q., Chen L., Liu J., Dong W., Shah H. Assessment of global
seismic loss based on macroeconomic indicators. Natural Hazards. 1998. Vol. 17 (3). pp. 269‑283.
16. Chandra J., Gueguen P. Nonlinear Response of Soil-Structure Systems using Dynamic
Centrifuge Experiments [Article]. Journal of Earthquake Engineering. 2019. Vol. 23 (10). pp.
1719‑1741. https://doi. org/10.1080/13632469.2017.1398692
17. Cornell C. A. Engineering seismic risk analysis: Bulletin of the Seismological Society of
America. 1968. Vol. 58. pp. 1583‑1606.
18. Dammala P. K., Kumar S. S., Krishna A. M., Bhattacharya S. Dynamic soil properties and
liquefaction potential of northeast Indian soil for non-linear effective stress analysis [Article].
Bulletin of Earthquake Engineering. 2019a. Vol. 17 (6). pp. 2899‑2933. https://doi. org/10.1007/
s10518-019‑00592-6
19. Das A. (Das, Angshuman), Chakrabortty P. (Chakrabortty, Pradipta). Influence of Mo‑
tion Energy and Soil Characteristics on Seismic Ground Response of Layered Soil International
Journal of Civil Engineering. 2020. DOI: 10.1007/s40999-020‑00496-6
20. Davidson R. A., Gupta A., Kakhandiki A., Shah, H. C. Urban earthquake disaster risk as‑
sessment and management. 1999.110 Geology and Geophysics of Russian South 10 (3) 2020 Геология и геофизика Юга России
21. Di Pasquale G., Orsini G. (1997). Proposta per la valutazione di scenari di danno conseg‑
uenti ad un evento sismico a partire dai dati ISTAT. Atti del 8°Convegno nazionale L’Ingegneria
Sismica in Italia, Taormina, 477‑486. EERI. (1986). “Reducing earthquake hazards: Lessons
learned from earthquakes.” EERI Publication, 86‑02, San Francisco, Calif.
22. Dong W. M., Shah H. M., Klun J., Green S. Earthquake Engn Res, I. Estimating Residen‑
tial Dwelling Losses – the California Residential Earthquake Recovery Fund (Crerf) Experience.
1994.
23. Durukal E., Erdik M., Uçkan E. Earthquake risk to industry in Istanbul and its manage‑
ment. Natural Hazards. 2008. Vol. 44. No. 2. pp. 199‑212. doi 10.1007/s11069-007‑9119-0.
24. Erdik M. Earthquake Risk, Earthquake Rapid Response System, and Early Warning Sys‑
tem in Istanbul. Macalester International. 2005. Vol. 15, Article 12 (Available at: http://digital‑
commons. macalester. edu/macintl/vol15/iss1/1). pp. 99‑124.
25. Erdik M. Earthquake Risk in Turkey. Science. 2013. Vol. 341 (6147). pp. 724‑725. htt‑
ps://doi. org/10.1126/science. 1238945
26. Erdik M. (Earthquake risk assessment. Bulletin of Earthquake Engineering. 2017. Vol. 15
(12). pp. 5055‑5092. https://doi. org/10.1007/s10518-017‑0235-2
27. Erdik M., Durukal E., Biro Y., Birgören G. İstanbul’da Binalar için Deprem Riski ve Risk
Azaltımına Yönelik Somut bir Öneri. İkinci İstanbul ve Deprem Sempozyumu, TMMOB İnşaat
Mühendisleri Odası İstanbul Şubesi, 27 Mayıs 2000, İstanbul Teknik Üniversitesi Maçka Kam‑
pusü. Istanbul. 2000. pp. 131‑149.
28. Erdik M., Ulker O., Sadan B., Tuzun C. Seismic isolation code developments and sig‑
nificant applications in Turkey. Soil Dynamics and Earthquake Engineering. 2018. Vol. 115. pp.
413‑437. https://doi. org/10.1016/j. soildyn. 2018.09.009
29. Fukushima Y., Tanaka T. A new attenuation relationship for peak horizontal acceleration
of strong earthquake ground motion in Japan. Bull. Seism. Soc. Am. 1990. Vol. 80. pp. 757‑783.
30. Gregor N. J. The attenuation of strong ground displacements. EERC Report No: UCB/
EERC-95/02, Univ. of California at Berkeley. 1995.
31. Gubin I. E. Seismotectonic Method of Seismic Zoning. Proc. Geophys. Inst.
Acad. Sci. SSSR. 1950. No. 13 (140). p. 2.
32. Hartzell S., Harmsen S., Frankel A., Larsen S. Calculation of broadband time histories
of ground motion: Comparison of methods and validation using strong-ground motion from the
1994 Northridge earthquake [Article]. Bulletin of the Seismological Society of America. 1999.
Vol. 89 (6). pp. 1484‑1504.
33. HAZUS (1999). Earthquake loss estimation methodology, Technical Manual, RMS,
NIBS and FEMA. IDNDR-Radius, http://www. reliefweb. int/ocha_ol/programs/idndr/radi‑
us. html
34. HAZUS-MH 2.1 Technical Manual: Earthquake Model, FEMA, Washington, DC. 2014.
35. Kaklamanos J., Bradley B. A., Thompson E. M., Baise L. G. Critical Parameters Affecting
Bias and Variability in Site-Response Analyses Using KiK-net Downhole Array Data [Article].
Bulletin of the Seismological Society of America. 2013. Vol. 103 (3). pp. 1733‑1749. https://doi.
org/10.1785/0120120166
36. Kaklamanos J., Baise L. G., Thompson E. M., Dorfmann L. Comparison of 1D linear,
equivalent-linear, and nonlinear site response models at six KiK-net validation sites [Article]. Soil
Dynamics and Earthquake Engineering. 2015. Vol. 69. pp. 207‑219. https://doi. org/10.1016/j.
soildyn. 2014.10.016
37. Kaklamanos J., Bradley B. A. Challenges in Predicting Seismic Site Response with
1D Analyses: Conclusions from 114 KiK-net Vertical Seismometer Arrays [Article]. Bulle‑
tin of the Seismological Society of America. 2018. Vol. 108 (5A). pp. 2816‑2838. https://doi.
org/10.1785/0120180062
38. Klyachko M. A. Arguments for Earthquake Hazard Mitigation in the Kamchatka Region.
In B. E. Tucker, M. Erdik, & C. N. Hwang (Eds.), Issues in Urban Earthquake Risk. 1994. Vol.
271. pp. 215‑219).Geology and Geophysics of Russian South 10 (3) 2020 Геология и геофизика Юга России 111
39. Klyachko M. A., Polovinchik J. F. (1994). Application of GIS and Scenario Techniques to
Urban Eq Risk Analysis and Mitigation.
40. Kwok A. L., Stewart J. P., Hashash Y. M. A., Matasovic N., Pyke R., Wang Z., Yang Z. Use
of exact solutions of wave propagation problems to guide lmplementation of Nonlinear seismic
ground response analysis procedures [Article]. Journal of Geotechnical and Geoenvironmental
Engineering. 2007. Vol. 133 (11). pp. 1385‑1398. https://doi. org/10.1061/ (asce) 1090‑0241
(2007) 133:11 (1385)
41. Mahani A. B., Kazemian J. Strong ground motion from the November 12, 2017, M 7.3
Kermanshah earthquake in western Iran [Article]. Journal of Seismology. 2018. Vol. 22 (6). pp.
1339‑1358. https://doi. org/10.1007/s10950-018‑9761‑x
42. Medvedev S. V. Problems of Seismic Zoning. Byull. Bulletin of Seismological Council.
1960. No. 8.
43. Pagliaroli A., Aprile V., Chamlagain D., Lanzo G., Poovarodom N. Assessment of site
effects in the Kathmandu valley, Nepal, during the 2015 Mw 7.8 Gorkha earthquake sequence
using 1D and 2D numerical modelling [Article]. Engineering Geology. 2018. Vol. 239. pp. 50‑62.
https://doi. org/10.1016/j. enggeo. 2018.03.011
44. Pavel F., Vacareanu R., Pitilakis K. Intensity-dependent site amplification factors for
Vrancea intermediate-depth earthquakes [Article]. Bulletin of Earthquake Engineering. 2019.
Vol. 17 (5). pp. 2363‑2380. https://doi. org/10.1007/s10518-019‑00563‑x
45. Phillips C., Hashash Y. M. A. Damping formulation for nonlinear 1D site response anal‑
yses [Article]. Soil Dynamics and Earthquake Engineering. 2009. Vol. 29 (7). pp. 1143‑1158.
https://doi. org/10.1016/j. soildyn. 2009.01.004
46. Pinar A., Honkura Y., Kuge K. Seismic activity triggered by the 1999 Izmit earthquake
and its implications for the assessment of future seismic risk. Geophysical Journal International.
2001. Vol. 146 (1). F1‑F7. https://doi. org/10.1046/j. 0956-540x. 2001.01476. x
47. Pinar A., Z. Coskun, A. Mert, D. Kalafat. Frictional strength of North Anatolian fault in
eastern Marmara region, Earth Planets and Space. 2016. Vol. 68. pp. 1880‑5981.
48. Polovinchik I. F., Klyachko M. A., Koff G. L. Development of Geoinformational System
(GIS) for analysis and management of seismic risk on the urban areas. 10th European Conference
on Earthquake Engineering, Proceedings. 1995. Vol. 1‑4. pp. 1141‑1146.
49. Poul M. K., Zerva A. Efficient time-domain deconvolution of seismic ground motions
using the equivalent-linear method for soil-structure interaction analyses [Article]. Soil Dynam‑
ics and Earthquake Engineering. 2018. Vol. 112. pp. 138‑151. https://doi. org/10.1016/j. soildyn.
2018.04.032
50. Rathje E. M., Kottke A. R., Trent W. L. Influence of Input Motion and Site Property
Variabilities on Seismic Site Response Analysis [Article]. Journal of Geotechnical and Geoen‑
vironmental Engineering. 2010. Vol. 136 (4). pp. 607‑619. https://doi. org/10.1061/ (asce) gt.
1943‑5606.0000255
51. Riga E., Makra K., Pitilakis K. Investigation of the effects of sediments inhomogene‑
ity and nonlinearity on aggravation factors for sedimentary basins [Article]. Soil Dynamics
and Earthquake Engineering. 2018. Vol. 110. pp. 284‑299. https://doi. org/10.1016/j. soildyn.
2018.01.016
52. Riznichenko Yu. V. From the Earthquake Source Activity to Ground Motions, Izv. Akad.
Nauk SSSR, Fiz. Zemli. 1965. No. 11. pp. 1‑12.
53. Shah H. C. The Increasing Nature of Global Earthquake Risk. Global Environmental
Change-Human and Policy Dimensions. 1995. Vol. 5 (1). pp. 65‑67.
54. Shah H. C. (Catastrophe Risk Management in Developing Countries and the Last Mile.
1755 Lisbon Earthquake: Revisited. 2009. No. 7. pp. 111‑120.
55. Shah H. C., Wong F. S., Dong W. (1987). IRAS – an Expert System for Earthquake Insur‑
ance and Investment Risk Assessment.
56. Shah H. C., Bendimerad M. F., Stojanovski P. Int Assoc Earthquake, E. (1992). Resource-
Allocation in Seismic Risk Mitigation.112 Geology and Geophysics of Russian South 10 (3) 2020 Геология и геофизика Юга России
57. Sobolev G. A. Source Physics and Prediction of Earthquakes. Moscow, Geofiz. Tsentr
RAN, IFZ RAN. 1992. (In Russ.)
58. Sonmezer Y. B., Bas S., Isik N. S., Akbas S. O. Linear and nonlinear site response analy‑
ses to determine dynamic soil properties of Kirikkale [Article]. Geomechanics and Engineering.
2018. Vol. 16 (4). pp. 435‑448. https://doi. org/10.12989/gae. 2018.16.4.435
59. Stupazzini M., Paolucci R., Igel H. Near-Fault Earthquake Ground-Motion Simulation in
the Grenoble Valley by a High-Performance Spectral Element Code [Article]. Bulletin of the Seis‑
mological Society of America. 2009. Vol. 99 (1). pp. 286‑301. https://doi. org/10.1785/0120080274
60. Terzi V. G., Ignatakis C. E. Nonlinear finite element analyses for the restoration study
of Xana, Greece [Article]. Engineering Structures. 2018. Vol. 167. pp. 96‑107. https://doi.
org/10.1016/j. engstruct. 2018.04.034
61. Thebian L., Najjar S., Sadek S., Mabsout M. Numerical investigation of dip-slip fault
propagation effects on offshore seabed sediments [Article]. Engineering Geology. 2018. Vol. 237.
pp. 149‑167. https://doi. org/10.1016/j. enggeo. 2018.02.008
62. Trifunac M. D., Todorovska M. I. Nonlinear soil response as a natural passive isolation
mechanism – the 1994 Northridge, California, earthquake [Article]. Soil Dynamics and Earth‑
quake Engineering. 1998. Vol. 17 (1). pp. 41‑51. https://doi. org/10.1016/s0267–7261 (97)
00028‑6
63. Tsiapas Y. Z., Bouckovalas G. D. Equivalent linear computation of response spectra for
liquefiable sites: The spectral interpolation method [Article]. Soil Dynamics and Earthquake En‑
gineering. 2019. Vol. 116. pp. 541‑551. https://doi. org/10.1016/j. soildyn. 2018.10.033
64. Ulomov V., Strakhov V., Giardini D. Seismic hazard assessment in Northern Eurasia An‑
nali di Geofisica. Vol. XXXVI. № 3‑4. June-July. 1993. pp. 83‑92.
65. Ulomov V. Structural and dynamical regularity of Eurasia intracontinental seismicity and
some aspects of seismic hazard prediction // XXIY General ESC Assembly. 1994 September
19‑24. Proceedings and Active Report 1992‑1994. Athens. Greece. 1994. Vol. 1. pp. 271‑281.
66. Ulomov V. I., Bogdanov M. I., Pustovitenko B. G., Peretokin S. A. Strom A. L., Akato‑
va K. N., Danilova T. I., Medvedeva N. S. Analysis of the seismic hazard of the North Caucasus
and Crimea as part of the general seismic region of the territory of the Russian Federation. Journal
of Engineering Research. 2015. No. 13. pp. 12‑27. (in Russ.)
67. Wang H. Y., Jiang W. P., Wang S. Y., Miao Y. In situ assessment of soil dynamic param‑
eters for characterizing nonlinear seismic site response using KiK-net vertical array data [Article].
Bulletin of Earthquake Engineering. 2019. Vol. 17 (5). pp. 2331‑2360. https://doi. org/10.1007/
s10518-018‑00539-3
68. Whitman R. V., Lagorio H. J. (1999). The FEMA-NIBS methodology for earthquake loss
estimation. http://www. fema. gov/hazus/hazus4a. html.
69. Yamamoto Y., D. Kalafat, A. Pinar, N. Takahashi, Z. Coskun, R. Polat, Y. Kaneda,
H. Özener. Fault geometry beneath the western and Central Marmara Sea, Turkey, based on ocean
bottom seismographic observations: Implications for future large earthquakes, Tectonophysics.
2020. 0040‑1951, 791, 1, 1‑14.
70. Yang J., Sato T., Li X. S. Seismic amplification at a soft soil site with liquefiable layer
[Article]. Journal of Earthquake Engineering. 2000. Vol. 4 (1). pp. 1‑23. https://doi. org/10.1142/
s1363246900000023
71. Yang X. L., Li Z. W. Kinematical analysis of 3D passive earth pressure with nonlinear
yield criterion [Article]. International Journal for Numerical and Analytical Methods in Geome‑
chanics. 2018. Vol. 42 (7). pp. 916‑930. https://doi. org/10.1002/nag. 2771
72. Yuchang L., Kemon L. The economic influences of the earthquakes in cities, Earthquake
strategy for cities, Earthquake Press, Beijing. 1991. pp. 308‑319.
73. Zaalishvili V. B., Berezko A. E. View assessments seismic risk urban areas by using GIS//
International Symposium “Engineering seismology and earthquake resistance”. 19‑21 May. Tbi‑
lisi. 1999. p. 15 (In Russ.)You can also read